SlideShare une entreprise Scribd logo
1  sur  4
Télécharger pour lire hors ligne
LETTER                                                                                                                                                               doi:10.1038/nature09717


A candidate redshift z < 10 galaxy and rapid changes
in that population at an age of 500 Myr
R. J. Bouwens1,2, G. D. Illingworth1, I. Labbe3, P. A. Oesch4, M. Trenti5, C. M. Carollo4, P. G. van Dokkum6, M. Franx2, M. Stiavelli7,
V. Gonzalez1, D. Magee1 & L. Bradley7
         ´


Searches for very-high-redshift galaxies over the past decade have                                   of Lyman a (121.6 nm). These ‘spectral breaks’ shift to longer wave-
yielded a large sample of more than 6,000 galaxies existing just                                     lengths for more distant, redshifted galaxies seen at earlier times. A
900–2,000 million years (Myr) after the Big Bang (redshifts                                          distinguishing characteristic of z < 10 galaxies would be, first, a detec-
6 . z . 3; ref. 1). The Hubble Ultra Deep Field (HUDF09) data2,3                                     tion in the H160 band, and, second, the absence of flux in the J125 band,
have yielded the first reliable detections of z < 8 galaxies3–9 that,                                and in all other shorter-wavelength Hubble Space Telescope (HST)
together with reports of a c-ray burst at z < 8.2 (refs 10, 11), con-                                Wide Field Camera 3 (WFC3/IR) and Advanced Camera for Surveys
stitute the earliest objects reliably reported to date. Observations of                              (ACS) filters blueward of the J125 band (hence they are called ‘J125-
z < 7–8 galaxies suggest substantial star formation at z . 9–10                                      dropouts’). The new, powerful HST WFC3/IR camera is ,40 times
(refs 12, 13). Here we use the full two-year HUDF09 data to con-                                     more efficient at finding z < 7 galaxies2,4–9 than the previous near-infra-
duct an ultra-deep search for z < 10 galaxies in the heart of the                                    red NICMOS camera owing to its wider field of view and greater sens-
reionization epoch, only 500 Myr after the Big Bang. Not only do                                     itivity in its Y105, J125 and H160 filters. It provides us with the capability to
we find one possible z < 10 galaxy candidate, but we show that,                                      explore to z < 10.
regardless of source detections, the star formation rate density is                                     A thorough search of the deep WFC3/IR HUDF09 data set strong
much smaller ( 10%) at this time than it is just 200 Myr later at                                    limits at z < 10, and also resulted in the detection of a candidate z < 10
z < 8. This demonstrates how rapid galaxy build-up was at z < 10,                                    J125-dropout galaxy UDFj-39546284 at 5.4s in our 0.260-diameter
as galaxies increased in both luminosity density and volume density                                  selection aperture (Fig. 1). The signal-to-noise ratio grows to 5.8s in
from z < 10 to z < 8. The 100–200 Myr before z < 10 is clearly a                                     a larger 0.350-diameter aperture. The candidate is 28.92 6 0.18 mag in
crucial phase in the assembly of the earliest galaxies.                                              the WFC3/IR H160 band ((1.01 6 0.18) 3 10231 erg s21 cm22 Hz21),
   The detection of galaxies at very high redshift from deep imaging                                 has a likely redshift of z < 10.3 (Fig. 2), and appears to be slightly
data depends on the absorption (by intervening neutral hydrogen) of                                  extended. Given the importance of the limits that we set, and of the
much of the flux in the spectrum at wavelengths below the wavelength                                 candidate z < 10 galaxy, we perform extensive tests and simulations.

                                 UDFj-39546284 (H = 28.9, J–H > 2.0)


                                        V+i+z                   Y                      J                    H                   3.6 m                 4.5 m


                                                                     50% random                                                         50% random
                                                                                             First year           Second year

Figure 1 | Optical and near-infrared images of the candidate z < 10 galaxy,                          be undetected (,2s) in all imaging observations blueward of the J125 band.
UDFj-39546284, from the HUDF. Top row: the leftmost panel shows the                                  Also, candidates must not be detected at .1.5s in more than one band
HUDF ACS (V6061i7751z850) data26; the next three panels show the similarly                           blueward of the J125 band, and have x2 , 2.5 in the extremely-deep image
deep HUDF09 (HST GO 11563), near-infrared WFC3/IR (Y105, J125, H160) data                            obtained by combining the B435, V606, i775, z850 and Y105 imaging data. All of
(reaching to 5s depths of ,29.8 AB mag)2,3,9; and the last two panels show the                       these requirements place very strong limits on the optical flux from our z < 10
longer wavelength Spitzer IRAC 3.6 and 4.5 mm observations. Bottom row: the                          candidates and provide strong discrimination against contamination by low-
two middle panels show images of our z < 10 candidate in the first and second                        redshift sources (see ref. 9, Appendix C). The candidate is significant at .3s in
year of H160-band observations (each representing ,50% of the total); the two                        each year of observations and therefore not likely to be spurious. It is detected at
outer panels show two random 50% subsets of the data (see also Supplementary                         5.4s in the H160 band, which is much more significant than the next possible
Fig. 2). Each cutout is 2.499 3 2.499 on a side, and is orientated with north at the                 candidates (seen at 4.0s and 4.9s). In addition, our z < 10 candidate is not
top. For our selection criteria, we require our z < 10 candidates to be detected at                  detected in the IRAC data, as expected given the IRAC flux limits. The position
5s in the H160 band, to have J125 2 H160 colours redder than 1.2 AB mag, and to                      and other properties of this candidate are given in Supplementary Table 1.
1
  Department of Astronomy, University of California Santa Cruz, Santa Cruz, California 95064, USA. 2Leiden Observatory, Leiden University, Leiden NL-2333, The Netherlands. 3Carnegie Observatories,
Pasadena, California 91101, USA. 4Institute for Astronomy, ETH Zurich, Zurich CH-8093, Switzerland. 5University of Colorado, Center for Astrophysics and Space Astronomy, Boulder, Colorado 80303, USA.
6
  Department of Astronomy, Yale University, New Haven, Connecticut 06520, USA. 7Space Telescope Science Institute, Baltimore, Maryland 21218, USA.


5 0 4 | N AT U R E | VO L 4 6 9 | 2 7 J A N U A RY 2 0 1 1
                                                             ©2011 Macmillan Publishers Limited. All rights reserved
LETTER RESEARCH

               1                                                                       reason for the robustness is the non-detection in all shorter wavelength
                        UDFy-38135539
                                                                                       filters. The x2opt test that we have developed9 largely eliminates con-
                      UDFy-33436598
                                                                                       taminating objects.
              0.8   UDFy-37796000
                                                                                           Our z < 10 candidate was also checked for any Spitzer IRAC flux in
                                                   J-dropouts
                                                                                       the 3.6 mm band (see Fig. 1). It is quite isolated and is not detected to
                                                                                       ,27 AB mag (2s), further enhancing the case that this z < 10 candidate
                                                                                       corresponds to a very-high-redshift galaxy rather than a highly reddened,
              0.6                                                                      lower-redshift contaminant. Contamination from spurious sources is
 Likelihood


                                                                                       also an important concern for such faint sources. We verified that the
                                                                                       source is present in a wide variety of subsets of the H160-band data (Fig. 1,
              0.4                                                                      Supplementary Fig. 2), suggesting that the candidate is not spurious.
                                                                                       Although these tests make a case for this source being a z < 10 galaxy,
                                                                                       deeper observations—involving both imaging (with, for example, WFC3/
                                                                                       IR) and spectroscopy (with the James Webb Space Telescope)—will be
              0.2
                                                                                       required to confirm it.
                                                                                           Using the results of these tests and Monte Carlo simulations, we
                                                                                       estimate there is an ,20% probability that our candidate is a contami-
               0                                                                       nant or is spurious. Of that 20%, 10% was estimated to be from pho-
                         8              9                10              11
                                                                                       tometric scatter. Contamination from spurious sources is uncertain,
                                            Redshift
                                                                                       and our estimates range from 1% to 10% probability; to be conservative
Figure 2 | Predicted redshift distributions for our z < 8.5 and z < 10 galaxy          we adopt 10%. Contamination from lower-redshift red sources is also
candidates. The red line gives the redshift distribution for our z < 10 J125-          possible, but the above single-filter z < 8 Y105-dropout test suggests
dropout candidate, while the blue, green and magenta lines give the redshift           that the probable contamination is small, consistent with the totals we
distributions for our z < 8.5 Y105-dropout candidates. The H160-band source            estimate from our other tests (,20%).
images that correspond to the redshift distributions are shown for the z < 8.7,
                                                                                           Fortunately, the depth of the data and the thoroughness of our
8.6 and z < 8.5 sources (labels arranged in same order as images), and for our
z < 10.3 candidate. Each source image is 2.499 3 2.499, with north at the top.         analysis for contamination allow us to set very strong constraints on
The selection criteria for the z < 8–9 sources have been published elsewhere3,9        the volume density of z < 10 galaxies, regardless of the uncertainties
(see also Supplementary Information section 5). However, the detailed redshift         associated with our candidate z < 10 galaxy. Thus we evaluate our
distributions are shown here for the first time. The redshift distributions were       constraints based on the limit set if no galaxies were found, and based
derived by adding artificial sources to the HUDF09 WFC3/IR data, and re-               on the candidate z < 10 galaxy, whose volume density is corrected by
selecting them in the same way as the actual galaxy candidates (see                    20% to account for the estimated contamination rate.
Supplementary Information sections 4, 5 and 9). The mean redshifts of these                Large-scale structure uncertainties are important for small area
distributions are 8.7, 8.6, 8.5 and 10.3. The z < 8.7 source has a tentative           searches. We estimate the field-to-field variance on the present z < 10
spectroscopic confirmation at z < 8.6 (ref. 14). For these simulations, the
                                                                                       J125-dropout searches in the HUDF09 field to be 39% (see
ultraviolet luminosity function was used. The luminosity function describes the
number density of galaxies versus luminosity and is usually parameterized as           Supplementary Information)20. Even at this level, the cosmic variance
w*e2L/L*(L/L*)a, where w* is the normalization, L* is the characteristic               (‘large-scale structure’) is not the dominant source of uncertainty for our
luminosity, and a is the faint end slope (see Fig. 3). The luminosity function was     single candidate galaxy.
assumed to have an M*UV of 219.5 and 218.8 at z < 8 and z < 10, respectively               These z < 10 results have far-reaching implications for estimating
(based on predictions from our z < 4–6 fitting relation9,22), while a was taken to     the role of galaxies in reionization (using the luminosity density), and
be 21.74.                                                                              for establishing the star formation rate density at very early times, as
                                                                                       z < 10 is just 480 Myr after the Big Bang and just a few hundred million
These are described in Supplementary Information sections 4 and 7,                     years since the first galaxies formed. Strikingly, the upper limits and
while the candidate properties are given in Supplementary Table 1.                     our candidate allow us to do this through quantitative constraints we
   The existence of galaxies at z . 8.2 (the c-ray burst redshift10,11) is             place on the z < 10 luminosity function.
strengthened by three additional sources that have been detected in                        The extent of the changes at z < 10 can be demonstrated by first
recent searches3–9, one of which has a tentative spectroscopic con-                    contrasting what we see at z < 10 with expectations based on a ‘no-
firmation at z 5 8.6 (ref. 14). The updated redshift distributions from                evolution’ scenario: that is, the galaxy populations stay unchanged
our simulations show that these three sources3 are most likely to be at                with time. We compute the ‘no-evolution’ estimate by using our
z < 8.7, 8.5 and 8.6 (Fig. 2). The expectation of finding galaxies at                  ‘galaxy cloning’ software21 to artificially redshift the observed z < 6
z < 10, just ,120 Myr earlier, is enhanced by these strong detections                  and z < 7 galaxy population to z < 10, add them at random positions
at z < 8.5, especially since the z < 7–8 Spitzer and HST data suggest                  within our HUDF data, and then repeat the object selection process
that substantial star formation is likely at z . 9–10 (refs 12, 13).                   just as for the observed z < 10 galaxies. We estimated that we would
   The photometric-selection ‘dropout’ approach has been verified                      find 12 6 4 z < 10 galaxies using our z < 7 detections as the baseline,
through numerous spectroscopic confirmations at redshifts from                         and 23 6 5 z < 10 galaxies using our z < 6 detections as a baseline.
z < 2 to z < 6 (refs 15–19), and possibly also now at z < 8.6 (ref. 14).               These ‘no-evolution’ estimates are substantially higher than our (con-
For our candidate z < 10 galaxy, however, its single band (H160 band)                  tamination-corrected) estimate of ,0.8 z < 10 galaxies. For simple
detection increases the risk of contamination compared to the z < 7 and                Poissonian statistics, our observed number of ,0.8 galaxies is incon-
z < 8 samples, where two (or more) bands are used to measure the                       sistent with no-evolution at 4s and 5s confidence, respectively (and
source magnitudes and colours. Fortunately, we can test the robustness                 sets even stronger limits on any ‘upturn’ in the star formation rate6).
of the single-band detection process by selecting z < 8 galaxy candidates              Although striking, this is not wholly unexpected. Extrapolating the
using the J125-band data alone. Analogous to the z < 10 J125-dropouts,                 trends seen by us at lower redshifts22 would lead us to expect 3 6 2
z < 8 galaxies are Y105-band dropouts. We compare this single-band                     z < 10 sources. Thus our results reaffirm that the significant evolution
selection against the more robust z < 8 detections using two bands3                    seen in galaxies at lower redshift continues to z < 10 (in contrast with
(J125 and H160). We are very encouraged that we select the same eight                  other studies6).
z < 8 Y105-dropouts with the J125-band data alone, as we do with the                       The present search results can also be expressed as constraints on
normal selection using both the J125- and H160-band data. The primary                  the luminosity function at z < 10. The luminosity function describes
                                                                                                           2 7 J A N U A RY 2 0 1 1 | VO L 4 6 9 | N AT U R E | 5 0 5
                                                       ©2011 Macmillan Publishers Limited. All rights reserved
RESEARCH LETTER

the number density of galaxies versus luminosity, and is important for                                                                                Time (Gyr)
estimating the ultraviolet flux from galaxies and their expected role in                                                          10   54 3   2          1          0.6            0.4
reionizing the Universe. The high-redshift-galaxy ultraviolet luminosity                                                                                                                 27
                                                                                                                             –1
function maintains a nearly constant form and evolves in a largely self-                                                                                            >0.06 Lz = 3


                                                                                                                                                                                               log10(erg s–1 Mpc–3)
                                                                                                      log10(M yr –1 Mpc–3)
similar manner, with the characteristic luminosity (L*) increasing
smoothly over about 1,300 Myr from z < 7 to z < 3, that is, from                                                             –2                                                          26
,750 Myr to ,2,000 Myr. Assuming the same form for the ultraviolet
luminosity function at z < 10, we find that L* at z < 10 is fainter, indi-                                                                                                               25
                                                                                                                             –3
cating that the evolution in the bright end of the ultraviolet luminosity
function seen from z < 7 to z < 4 (refs 1, 9, 22) continues to z < 10
                                                                                                                                                                                         24
(Fig. 3). Definitive measurements of L* at z < 10 will, of course, require                                                   –4
deep, wide-area data to define the luminous end of the z < 10 luminosity
                                                                                                                              0          2        4       6        8         10
function.
                                                                                                                                                       Redshift
   The existence of a steep slope a to the faint end of the ultraviolet
luminosity function found at z < 6–7 (refs 1, 2, 9) highlights the                               Figure 4 | The luminosity density and star formation rate density in the
importance of low luminosity galaxies in providing the flux needed                               Universe over 13.2 Gyr. The rest-frame continuum ultraviolet luminosity
to reionize the Universe. It is of great interest to estimate the ultraviolet                    density (right axis, blue points) at z < 10, and the star formation rate density
luminosity density at z < 7–10 where reionization most probably                                  (left axis, red points) derived from the extinction-corrected luminosity
occurred, given its apparent completion at z < 6 (ref. 23) and its onset                         density1,25,, are integrated down to the approximate magnitude limit
                                                                                                 MAB < 218 (0.06L*) of our z < 10 J125-dropout search. The conversion from
at z < 11 as deduced from Wilkinson Microwave Anisotropy Probe
                                                                                                 ultraviolet luminosity to star formation rate assumes a Salpeter initial mass
(WMAP)24 observations. The recent results from the HUDF09 data set                               function. The upper horizontal axis gives the time after the Big Bang and the
provide estimates for the ultraviolet luminosity density at z < 7 and at                         lower axis the redshift. As before, we assume that the ultraviolet luminosity
z < 8 (ref. 9). We can now also do so at z < 10. We compute the                                  function has the same faint-end slope (and normalization) as at z < 6 and z < 7.
luminosity density implied by our sample by assuming a faint-end                                 The star formation rate density (1.914.4 3 1024 M[ yr21 Mpc23) from the
                                                                                                                                        21.5
slope of 21.7 (the same slope as found for the z < 2–7 luminosity                                contamination-corrected sample is shown at z < 10 from the current
functions) and extending the integration down to a very plausible limit                          J125-dropout search, as is the 1s upper limit (,3 3 1024 M[ yr21 Mpc23) if we
of 212 AB mag. We find that the ultraviolet flux that is available from                          assume no z < 10 sources are detected. All error bars are 1s. Also included here
                                                                                                 are the recent star formation rate determinations at z < 7 and z < 8 from our
                                                                                                 HUDF09 WFC3/IR z850-dropout and Y105-dropout searches9, and from the
                                                                                                 literature at z , 4 (green and black points: refs 27, 30) and at z < 4–6 (ref. 1).
                                –2                                                               The dust corrections at z < 4 are based on the estimated ultraviolet-continuum
                                                                                                 slopes b, and are already negligible by z < 7 (refs 2, 3, 25). There is no evidence
                                                                                                 for any substantial change in the star formation rate density trends established
    log10(number mag–1 Mpc–3)


                                           z≈4                                                   at lower redshift.
                                –3
                                                                           z ≈ 10                galaxies at z < 10 is only ,12126% of what is needed for galaxies to be
                                                                                                                                210
                                                                                                 the reionizing source, with typical assumptions of an escape fraction of
                                –4                                                               ,0.4, a clumping factor of ,3 and a Salpeter initial mass function (see,
                                                                                                 for example, ref. 9). This result is tantalizing, suggesting that galaxies
                                            z≈7                                                  are contributing to reionization, but the enigma remains: where are
                                –5                                                               most of the needed ultraviolet photons coming from? Obser-
                                                                                                 vations to significantly fainter levels will be central to characterizing
                                                                                                 the role of galaxies in reionization.
                                                                                                    The star formation rate (SFR) density is derived from the luminosity
                                     –22            –20                  –18           –16
                                                                                                 density (see Fig. 4). The SFR density increases systematically and
                                                 Luminosity (M1600,AB)                           monotonically at early times from z < 10 (500 Myr) to z < 4
Figure 3 | Ultraviolet luminosity functions at z < 4, z < 7 and constraints
                                                                                                 (1,600 Myr), peaking at z < 2–3 (at ,2,500 Myr), before decreasing
for z < 10. The present constraints on the stepwise ultraviolet luminosity                       at z , 2 (Fig. 4). This suggests that the luminosity function and star
function at z < 10 (black points and upper limits) are new and are derived from                  formation rate density evolution found at lower redshifts1,25 continues
the J125-dropout candidate galaxies over our ultra-deep HUDF WFC3/IR field.                      to z < 10 when the universe was just 480 Myr old. The limits estab-
These luminosity functions are a function of the absolute magnitude (that is,                    lished here even suggest that the trends in star formation rate density
luminosity) of galaxies (M1600,AB) in the rest-frame far-ultraviolet. All error                  established at lower redshifts could be steepening.
bars are 1s. The stepwise luminosity function at z < 10 is also presented as a 1s                   This is clearly an era when galaxies were evolving very rapidly. The
upper limit, given the uncertainty of our z < 10 candidate. The lowest                           star formation rate density increased by a factor of ,10 in less than
luminosity point has been corrected for incompleteness. The ultraviolet
                                                                                                 200 Myr, from z < 10 to z < 8. This dramatic change in such a short
luminosity functions1,9 at z < 4 (blue) and at z < 7 (magenta) are shown for
comparison. The luminosity functions fitted here are of the form w*e2L/L*(L/
                                                                                                 period of time suggests that the first phases of galaxy formation and
L*)a (see Fig. 2 legend). This analytic representation has recently been shown9                  their build-up could be unveiled by observations that penetrate just
to fit well at z < 7 and later times. The present search results also allow us to                200 Myr earlier, to redshifts z < 15. However, only when the James
estimate the value of L* at z < 10—assuming that the luminosity function at                      Webb Space Telescope is launched will these first phases of galaxy
z < 10 has the same values of w* and a < 21.7 as have been found to describe                     build-up between z < 15 and z < 10 be revealed.
ultraviolet luminosity function results from z < 7 to z < 4 (refs 1, 2, 9, 27–29).
Doing so allows us to constrain the evolution in the luminosity function out to                  Received 21 December 2009; accepted 30 November 2010.
z < 10, nearly 500 Myr earlier than at z < 6 (and so halving the time difference
between the first galaxies at z < 15–20 and those seen at z < 6). We find L* at                  1.              Bouwens, R. J., Illingworth, G. D., Franx, M. & Ford, H. UV luminosity functions at
                                                                                                                 z,4, 5, and 6 from the Hubble Ultra Deep Field and other deep Hubble Space
z < 10 to be 218.3 6 0.5 AB mag, or L* . 218.3 in the limit of no detected
                                                                                                                 Telescope ACS fields: evolution and star formation history. Astrophys. J. 670,
sources—although obviously very uncertain, this is consistent with the                                           928–958 (2007).
evolution in the bright end of the ultraviolet luminosity function seen from                     2.              Oesch, P. A. et al. z,7 Galaxies in the HUDF: first epoch WFC3/IR results. Astrophys.
z < 7 to z < 4 continuing to z < 10.                                                                             J. 709, L16–L20 (2010).

5 0 6 | N AT U R E | VO L 4 6 9 | 2 7 J A N U A RY 2 0 1 1
                                                                   ©2011 Macmillan Publishers Limited. All rights reserved
LETTER RESEARCH

3.    Bouwens, R. J. et al. Discovery of z,8 galaxies in the HUDF from ultra-deep WFC3/             22. Bouwens, R. J., Illingworth, G. D., Franx, M. & Ford, H. z , 7–10 galaxies in the HUDF
      IR observations. Astrophys. J. 709, L133–L137 (2010).                                             and GOODS Fields: UV luminosity functions. Astrophys. J. 686, 230–250 (2008).
4.    McLure, R. et al. Galaxies at z,6–9 from the WFC3/IR imaging of the HUDF. Mon.                23. Fan, X. et al. Evolution of the ionizing background and the epoch of reionization
      Not. R. Astron. Soc. 403, 960–983 (2010).                                                         from the spectra of z,6 quasars. Astron. J. 123, 1247–1257 (2002).
5.    Bunker, A. et al. The contribution of high redshift galaxies to cosmic reionization:          24. Komatsu, E. et al. Seven-Year Wilkinson Microwave Anisotropy Probe observations:
      new results from deep WFC3 Imaging of the Hubble Ultra Deep Field. Mon. Not. R.                   cosmological interpretation. Astrophys. J. (in the press); preprint at Æhttp://
      Astron. Soc. 409, 855–866 (2010).                                                                 arXiv.org/abs/1001.4538æ (2010).
6.    Yan, H. et al. Galaxy formation in the reionization epoch as hinted by Wide Field             25. Bouwens, R. et al. UV-continuum slope and dust obscuration from z,6 to z,2: the
      Camera 3 observations of the Hubble Ultra Deep Field. Res. Astron. Astrophys. 10,                 star formation rate density at high redshift. Astrophys. J. 705, 936–961 (2009).
      867–904 (2010).                                                                               26. Beckwith, S. W. et al. The Hubble Ultra Deep Field. Astrophys. J. 132, 1729–1755
7.    Finkelstein, S. et al. On the stellar populations and evolution of star-forming                   (2006).
      galaxies at 6.3,z8.6. Astrophys. J. 719, 1250–1273 (2010).                                    27. Reddy, N. & Steidel, C. C. A steep faint-end slope of the UV luminosity function at z
8.    Robertson, N., Ellis, R. S., Dunlop, R. S., McLure, R. J. & Stark, D. P. Early star-forming       , 2–3: implications for the global stellar mass density and star formation in low-
      galaxies and the reionization of the Universe. Nature 468, 49–55 (2010).                          mass halos. Astrophys. J. 692, 778–803 (2009).
9.    Bouwens, R. J. et al. UV luminosity functions from 113 z,7 and z,8 Lyman-break                28. Yoshida, M. et al. Luminosity functions of Lyman break galaxies at z,4 and z,5 in
      galaxies in the ultra-deep HUDF09 and wide-area ERS WFC3/IR observations,                         the Subaru Deep Field. Astrophys. J. 653, 988–1003 (2006).
      2010. Astrophys. J. (submitted); preprint at Æhttp://arxiv.org/abs/1006.4360æ                 29. McLure, R., Cirasuolo, M., Dunlop, J. S., Foucaud, S. & Almaini, O. The luminosity
      (2010).                                                                                           function, halo masses, and stellar masses of luminous Lyman-break galaxies at
10.   Tanvir, N. et al. A c-ray burst at a redshift of z < 8. Nature 461, 1254–1257 (2009).             5,z6. Mon. Not. R. Astron. Soc. 395, 2196–2209 (2009).
11.   Salvaterra, R. et al. GRB090423 at a redshift of z < 8.1. Nature 461, 1258–1260               30. Schiminovich, D. et al. The GALEX-VVDS measurement of the evolution of the far-
      (2009).                                                                                           ultraviolet luminosity density and the cosmic star formation rate. Astrophys. J. 619,
12.         ´,
      Labbe I. et al. Ultradeep IRAC observations of sub-L* z,7 and z,8 galaxies in the                 L47–L50 (2005).
      HUDF: the contribution of low-luminosity galaxies to the stellar mass density and             Supplementary Information is linked to the online version of the paper at
      reionization. Astrophys. J. 708, L26–L31 (2010).                                              www.nature.com/nature.
13.   Gonza ´lez, V. et al. Stellar mass density and specific star formation rates of the
      Universe at z,7. Astrophys. J. 713, 115–130 (2010).                                           Acknowledgements We are grateful to all those at NASA, STScI and throughout the
14.   Lehnert, M. et al. Spectroscopic confirmation of a galaxy at z 5 8.6. Nature 467,             community who have worked to make the Hubble Space Telescope the observatory
      940–942 (2010).                                                                               that it is today, and we acknowledge the importance of the servicing missions and those
15.   Steidel, C. C., Giavalisco, M., Pettini, M., Dickinson, M. & Adelberger, K. L.                who organised them. We acknowledge our program coordinator W. Januszewski for his
      Spectroscopic confirmation of a population of normal star-forming galaxies at                 care in helping to set up our program and observing configuration. We acknowledge
      redshifts z . 3. Astrophys. J. 462, L17–L21 (1996).                                           support from NASA and the Swiss National Science Foundation.
16.   Vanzella, E. et al. Spectroscopic observations of Lyman break galaxies at redshifts
                                                                                                    Author Contributions R.J.B. carried out the most of the data analysis and calculations
      ,4, 5, and 6 in the Goods-South Field. Astrophys. J. 695, 1163–1182 (2009).
                                                                                                    for this paper, and wrote most of the Supplementary Information; G.D.I. wrote most of
17.   Popesso, P. et al. The great observatories origins deep survey. VLT/VIMOS
                                                                                                    the text in the Letter and iterated on the initial science results and content with R.J.B.;
      spectroscopy in the GOODS-south field. Astron. Astrophys. 494, 443–460 (2009).
                                                                                                    I.L., P.A.O., M.T., C.M.C., P.G.v.D., M.F., M.S. and L.B. provided significant feedback on the
18.   Steidel, C. C. et al. Lyman break galaxies at redshift z , 3: survey description and          science content and on the drafts; I.L. and V.G. were involved with processing the
      full data set. Astrophys. J. 592, 728–754 (2003).                                             Spitzer IRAC data; P.A.O. contributed to the data analysis; M.T. made the cosmic
19.   Reddy, N. et al. A spectroscopic survey of redshift 1.4,,z,,3.0 galaxies in the               variance estimates; and D.M. was involved in data processing and pipeline generation
      GOODS-North Field: survey description, catalogs, and properties. Astrophys. J.                for the WFC3/IR data.
      653, 1004–1026 (2006).
20.   Trenti, M. & Stiavelli, M. Cosmic variance and its effect on the luminosity function          Author Information Reprints and permissions information is available at
      determinations in deep high-z surveys. Astrophys. J. 676, 767–780 (2008).                     www.nature.com/reprints. The authors declare no competing financial interests.
21.   Bouwens, R. J., Broadhurst, T. J. & Silk, J. Cloning Hubble Deep Fields. I. A model-          Readers are welcome to comment on the online version of this article at
      independent measurement of galaxy evolution. Astrophys. J. 506, 557–578                       www.nature.com/nature. Correspondence and requests for materials should be
      (1998).                                                                                       addressed to R.J.B. (bouwens@ucolick.org).


                                                                                                                             2 7 J A N U A RY 2 0 1 1 | VO L 4 6 9 | N AT U R E | 5 0 7
                                                           ©2011 Macmillan Publishers Limited. All rights reserved

Contenu connexe

Tendances

Dwarf galaxies with_optical_signatures_of_active_massive_black_holes
Dwarf galaxies with_optical_signatures_of_active_massive_black_holesDwarf galaxies with_optical_signatures_of_active_massive_black_holes
Dwarf galaxies with_optical_signatures_of_active_massive_black_holes
Sérgio Sacani
 
Too much pasta_for_pulsars_to_spin_down
Too much pasta_for_pulsars_to_spin_downToo much pasta_for_pulsars_to_spin_down
Too much pasta_for_pulsars_to_spin_down
Sérgio Sacani
 
The shadow _of_the_flying_saucer_a_very_low_temperature_for_large_dust_grains
The shadow _of_the_flying_saucer_a_very_low_temperature_for_large_dust_grainsThe shadow _of_the_flying_saucer_a_very_low_temperature_for_large_dust_grains
The shadow _of_the_flying_saucer_a_very_low_temperature_for_large_dust_grains
Sérgio Sacani
 
The open cluster_ngc6520_and_the_nearby_dark_molecular_cloud_barnard_86
The open cluster_ngc6520_and_the_nearby_dark_molecular_cloud_barnard_86The open cluster_ngc6520_and_the_nearby_dark_molecular_cloud_barnard_86
The open cluster_ngc6520_and_the_nearby_dark_molecular_cloud_barnard_86
Sérgio Sacani
 
Distances luminosities and_temperatures_of_the_coldest_known_substelar_objects
Distances luminosities and_temperatures_of_the_coldest_known_substelar_objectsDistances luminosities and_temperatures_of_the_coldest_known_substelar_objects
Distances luminosities and_temperatures_of_the_coldest_known_substelar_objects
Sérgio Sacani
 
Cold clumpy accretion_toward_an_active_supermasive_black_hole
Cold clumpy accretion_toward_an_active_supermasive_black_holeCold clumpy accretion_toward_an_active_supermasive_black_hole
Cold clumpy accretion_toward_an_active_supermasive_black_hole
Sérgio Sacani
 
Low surface brightness_imaging_of_the_magellanic_system_imprints_of_tidal_int...
Low surface brightness_imaging_of_the_magellanic_system_imprints_of_tidal_int...Low surface brightness_imaging_of_the_magellanic_system_imprints_of_tidal_int...
Low surface brightness_imaging_of_the_magellanic_system_imprints_of_tidal_int...
Sérgio Sacani
 
The ASTRODEEP Frontier Fields catalogues II. Photometric redshifts and rest f...
The ASTRODEEP Frontier Fields catalogues II. Photometric redshifts and rest f...The ASTRODEEP Frontier Fields catalogues II. Photometric redshifts and rest f...
The ASTRODEEP Frontier Fields catalogues II. Photometric redshifts and rest f...
Sérgio Sacani
 
The Internal Structure of Asteroid (25143) Itokawa as Revealed by Detection o...
The Internal Structure of Asteroid (25143) Itokawa as Revealed by Detection o...The Internal Structure of Asteroid (25143) Itokawa as Revealed by Detection o...
The Internal Structure of Asteroid (25143) Itokawa as Revealed by Detection o...
WellingtonRodrigues2014
 
Major contributor to_agn_feedback
Major contributor to_agn_feedbackMajor contributor to_agn_feedback
Major contributor to_agn_feedback
Sérgio Sacani
 
On some structural_features_of_the_metagalaxy
On some structural_features_of_the_metagalaxyOn some structural_features_of_the_metagalaxy
On some structural_features_of_the_metagalaxy
Sérgio Sacani
 
Olivine in an_unexpected_location_on_vesta_surface
Olivine in an_unexpected_location_on_vesta_surfaceOlivine in an_unexpected_location_on_vesta_surface
Olivine in an_unexpected_location_on_vesta_surface
Sérgio Sacani
 

Tendances (20)

Alfalfa discovery of_the_most_metal_poor_gas_rich_galaxy_known_agc_198691
Alfalfa discovery of_the_most_metal_poor_gas_rich_galaxy_known_agc_198691Alfalfa discovery of_the_most_metal_poor_gas_rich_galaxy_known_agc_198691
Alfalfa discovery of_the_most_metal_poor_gas_rich_galaxy_known_agc_198691
 
Dwarf galaxies with_optical_signatures_of_active_massive_black_holes
Dwarf galaxies with_optical_signatures_of_active_massive_black_holesDwarf galaxies with_optical_signatures_of_active_massive_black_holes
Dwarf galaxies with_optical_signatures_of_active_massive_black_holes
 
Too much pasta_for_pulsars_to_spin_down
Too much pasta_for_pulsars_to_spin_downToo much pasta_for_pulsars_to_spin_down
Too much pasta_for_pulsars_to_spin_down
 
The shadow _of_the_flying_saucer_a_very_low_temperature_for_large_dust_grains
The shadow _of_the_flying_saucer_a_very_low_temperature_for_large_dust_grainsThe shadow _of_the_flying_saucer_a_very_low_temperature_for_large_dust_grains
The shadow _of_the_flying_saucer_a_very_low_temperature_for_large_dust_grains
 
The open cluster_ngc6520_and_the_nearby_dark_molecular_cloud_barnard_86
The open cluster_ngc6520_and_the_nearby_dark_molecular_cloud_barnard_86The open cluster_ngc6520_and_the_nearby_dark_molecular_cloud_barnard_86
The open cluster_ngc6520_and_the_nearby_dark_molecular_cloud_barnard_86
 
Distances luminosities and_temperatures_of_the_coldest_known_substelar_objects
Distances luminosities and_temperatures_of_the_coldest_known_substelar_objectsDistances luminosities and_temperatures_of_the_coldest_known_substelar_objects
Distances luminosities and_temperatures_of_the_coldest_known_substelar_objects
 
Cold clumpy accretion_toward_an_active_supermasive_black_hole
Cold clumpy accretion_toward_an_active_supermasive_black_holeCold clumpy accretion_toward_an_active_supermasive_black_hole
Cold clumpy accretion_toward_an_active_supermasive_black_hole
 
Nature12888
Nature12888Nature12888
Nature12888
 
Using the milk_way_satellites_to_study_interactions_between_cold_dark_matter_...
Using the milk_way_satellites_to_study_interactions_between_cold_dark_matter_...Using the milk_way_satellites_to_study_interactions_between_cold_dark_matter_...
Using the milk_way_satellites_to_study_interactions_between_cold_dark_matter_...
 
Low surface brightness_imaging_of_the_magellanic_system_imprints_of_tidal_int...
Low surface brightness_imaging_of_the_magellanic_system_imprints_of_tidal_int...Low surface brightness_imaging_of_the_magellanic_system_imprints_of_tidal_int...
Low surface brightness_imaging_of_the_magellanic_system_imprints_of_tidal_int...
 
Deep chandra observations_of_pictor_a
Deep chandra observations_of_pictor_aDeep chandra observations_of_pictor_a
Deep chandra observations_of_pictor_a
 
The ASTRODEEP Frontier Fields catalogues II. Photometric redshifts and rest f...
The ASTRODEEP Frontier Fields catalogues II. Photometric redshifts and rest f...The ASTRODEEP Frontier Fields catalogues II. Photometric redshifts and rest f...
The ASTRODEEP Frontier Fields catalogues II. Photometric redshifts and rest f...
 
The Internal Structure of Asteroid (25143) Itokawa as Revealed by Detection o...
The Internal Structure of Asteroid (25143) Itokawa as Revealed by Detection o...The Internal Structure of Asteroid (25143) Itokawa as Revealed by Detection o...
The Internal Structure of Asteroid (25143) Itokawa as Revealed by Detection o...
 
Major contributor to_agn_feedback
Major contributor to_agn_feedbackMajor contributor to_agn_feedback
Major contributor to_agn_feedback
 
On some structural_features_of_the_metagalaxy
On some structural_features_of_the_metagalaxyOn some structural_features_of_the_metagalaxy
On some structural_features_of_the_metagalaxy
 
Olivine in an_unexpected_location_on_vesta_surface
Olivine in an_unexpected_location_on_vesta_surfaceOlivine in an_unexpected_location_on_vesta_surface
Olivine in an_unexpected_location_on_vesta_surface
 
A giant galaxy in the young Universe with a massive ring
A giant galaxy in the young Universe with a massive ringA giant galaxy in the young Universe with a massive ring
A giant galaxy in the young Universe with a massive ring
 
SPECTROSCOPIC CONFIRMATION OF THE EXISTENCE OF LARGE, DIFFUSE GALAXIES IN THE...
SPECTROSCOPIC CONFIRMATION OF THE EXISTENCE OF LARGE, DIFFUSE GALAXIES IN THE...SPECTROSCOPIC CONFIRMATION OF THE EXISTENCE OF LARGE, DIFFUSE GALAXIES IN THE...
SPECTROSCOPIC CONFIRMATION OF THE EXISTENCE OF LARGE, DIFFUSE GALAXIES IN THE...
 
A terrestrial planet_candidate_in_a_temperate_orbit_around_proxima_centauri
A terrestrial planet_candidate_in_a_temperate_orbit_around_proxima_centauriA terrestrial planet_candidate_in_a_temperate_orbit_around_proxima_centauri
A terrestrial planet_candidate_in_a_temperate_orbit_around_proxima_centauri
 
Aa17043 11
Aa17043 11Aa17043 11
Aa17043 11
 

Similaire à A candidate redshift z &lt; 10 galaxy and rapid changes in that population at an age of 500 myr

A luminous quasar at a redshift
A luminous quasar at a redshiftA luminous quasar at a redshift
A luminous quasar at a redshift
Sérgio Sacani
 
Spectroscopic confirmation of an ultra-faint galaxy at the epoch of reionization
Spectroscopic confirmation of an ultra-faint galaxy at the epoch of reionizationSpectroscopic confirmation of an ultra-faint galaxy at the epoch of reionization
Spectroscopic confirmation of an ultra-faint galaxy at the epoch of reionization
Sérgio Sacani
 
Black hole growth in the early universe is self regulated and largely hidde...
 Black hole growth in the early universe is  self regulated and largely hidde... Black hole growth in the early universe is  self regulated and largely hidde...
Black hole growth in the early universe is self regulated and largely hidde...
Sérgio Sacani
 
A close pair_binary_in_a_distant_triple_supermassive_black_hole_system
A close pair_binary_in_a_distant_triple_supermassive_black_hole_systemA close pair_binary_in_a_distant_triple_supermassive_black_hole_system
A close pair_binary_in_a_distant_triple_supermassive_black_hole_system
Sérgio Sacani
 
A dust obscured_massive_maximum_starburst_galaxy_at_a_redshift_634
A dust obscured_massive_maximum_starburst_galaxy_at_a_redshift_634A dust obscured_massive_maximum_starburst_galaxy_at_a_redshift_634
A dust obscured_massive_maximum_starburst_galaxy_at_a_redshift_634
Sérgio Sacani
 
Spitzer bright ultravista_faint_sources_in_cosmos_the_contribution_to_the_ove...
Spitzer bright ultravista_faint_sources_in_cosmos_the_contribution_to_the_ove...Spitzer bright ultravista_faint_sources_in_cosmos_the_contribution_to_the_ove...
Spitzer bright ultravista_faint_sources_in_cosmos_the_contribution_to_the_ove...
Sérgio Sacani
 
Nustar reveals extreme_absortion_in_z_05_type_2_quasars
Nustar reveals extreme_absortion_in_z_05_type_2_quasarsNustar reveals extreme_absortion_in_z_05_type_2_quasars
Nustar reveals extreme_absortion_in_z_05_type_2_quasars
Sérgio Sacani
 
A massive protocluster of galaxies at a redshift of z&lt;5.3
A massive protocluster of galaxies at a redshift of z&lt;5.3A massive protocluster of galaxies at a redshift of z&lt;5.3
A massive protocluster of galaxies at a redshift of z&lt;5.3
Sérgio Sacani
 
A spectroscopic sample_of_massive_galaxies
A spectroscopic sample_of_massive_galaxiesA spectroscopic sample_of_massive_galaxies
A spectroscopic sample_of_massive_galaxies
Sérgio Sacani
 

Similaire à A candidate redshift z &lt; 10 galaxy and rapid changes in that population at an age of 500 myr (20)

An ultraluminous quasar_with_a_twelve_billion_solar_mass_black_hole_at_redshi...
An ultraluminous quasar_with_a_twelve_billion_solar_mass_black_hole_at_redshi...An ultraluminous quasar_with_a_twelve_billion_solar_mass_black_hole_at_redshi...
An ultraluminous quasar_with_a_twelve_billion_solar_mass_black_hole_at_redshi...
 
A luminous quasar at a redshift
A luminous quasar at a redshiftA luminous quasar at a redshift
A luminous quasar at a redshift
 
Spectroscopic confirmation of an ultra-faint galaxy at the epoch of reionization
Spectroscopic confirmation of an ultra-faint galaxy at the epoch of reionizationSpectroscopic confirmation of an ultra-faint galaxy at the epoch of reionization
Spectroscopic confirmation of an ultra-faint galaxy at the epoch of reionization
 
Black hole growth in the early universe is self regulated and largely hidde...
 Black hole growth in the early universe is  self regulated and largely hidde... Black hole growth in the early universe is  self regulated and largely hidde...
Black hole growth in the early universe is self regulated and largely hidde...
 
A close pair_binary_in_a_distant_triple_supermassive_black_hole_system
A close pair_binary_in_a_distant_triple_supermassive_black_hole_systemA close pair_binary_in_a_distant_triple_supermassive_black_hole_system
A close pair_binary_in_a_distant_triple_supermassive_black_hole_system
 
A dust obscured_massive_maximum_starburst_galaxy_at_a_redshift_634
A dust obscured_massive_maximum_starburst_galaxy_at_a_redshift_634A dust obscured_massive_maximum_starburst_galaxy_at_a_redshift_634
A dust obscured_massive_maximum_starburst_galaxy_at_a_redshift_634
 
Nature10592
Nature10592Nature10592
Nature10592
 
GOALS-JWST: Unveiling Dusty Compact Sources in the Merging Galaxy IIZw096
GOALS-JWST: Unveiling Dusty Compact Sources in the Merging Galaxy IIZw096GOALS-JWST: Unveiling Dusty Compact Sources in the Merging Galaxy IIZw096
GOALS-JWST: Unveiling Dusty Compact Sources in the Merging Galaxy IIZw096
 
Spitzer bright ultravista_faint_sources_in_cosmos_the_contribution_to_the_ove...
Spitzer bright ultravista_faint_sources_in_cosmos_the_contribution_to_the_ove...Spitzer bright ultravista_faint_sources_in_cosmos_the_contribution_to_the_ove...
Spitzer bright ultravista_faint_sources_in_cosmos_the_contribution_to_the_ove...
 
Lord of the_rings_a_kinematic_distance_to_circinus_x1_from_a_giant_x_ray_ligh...
Lord of the_rings_a_kinematic_distance_to_circinus_x1_from_a_giant_x_ray_ligh...Lord of the_rings_a_kinematic_distance_to_circinus_x1_from_a_giant_x_ray_ligh...
Lord of the_rings_a_kinematic_distance_to_circinus_x1_from_a_giant_x_ray_ligh...
 
XRD Proposal
XRD ProposalXRD Proposal
XRD Proposal
 
Dense m agnetized_plasma_associated_with_afast_radio_burst
Dense m agnetized_plasma_associated_with_afast_radio_burstDense m agnetized_plasma_associated_with_afast_radio_burst
Dense m agnetized_plasma_associated_with_afast_radio_burst
 
Nustar reveals extreme_absortion_in_z_05_type_2_quasars
Nustar reveals extreme_absortion_in_z_05_type_2_quasarsNustar reveals extreme_absortion_in_z_05_type_2_quasars
Nustar reveals extreme_absortion_in_z_05_type_2_quasars
 
Intra cluster light_at_the_frontier_abell_2744
Intra cluster light_at_the_frontier_abell_2744Intra cluster light_at_the_frontier_abell_2744
Intra cluster light_at_the_frontier_abell_2744
 
Buraco negro na_ic10
Buraco negro na_ic10Buraco negro na_ic10
Buraco negro na_ic10
 
Eso1138
Eso1138Eso1138
Eso1138
 
A massive protocluster of galaxies at a redshift of z&lt;5.3
A massive protocluster of galaxies at a redshift of z&lt;5.3A massive protocluster of galaxies at a redshift of z&lt;5.3
A massive protocluster of galaxies at a redshift of z&lt;5.3
 
Chandra deep observation_of_xdcpj004402033_a_massive_galaxy_cluster_at_z_1_5
Chandra deep observation_of_xdcpj004402033_a_massive_galaxy_cluster_at_z_1_5Chandra deep observation_of_xdcpj004402033_a_massive_galaxy_cluster_at_z_1_5
Chandra deep observation_of_xdcpj004402033_a_massive_galaxy_cluster_at_z_1_5
 
A spectroscopic redshift_measurement_for_a_luminous_lyman_break_galaxy_at_z _...
A spectroscopic redshift_measurement_for_a_luminous_lyman_break_galaxy_at_z _...A spectroscopic redshift_measurement_for_a_luminous_lyman_break_galaxy_at_z _...
A spectroscopic redshift_measurement_for_a_luminous_lyman_break_galaxy_at_z _...
 
A spectroscopic sample_of_massive_galaxies
A spectroscopic sample_of_massive_galaxiesA spectroscopic sample_of_massive_galaxies
A spectroscopic sample_of_massive_galaxies
 

Plus de Sérgio Sacani

Biogenic Sulfur Gases as Biosignatures on Temperate Sub-Neptune Waterworlds
Biogenic Sulfur Gases as Biosignatures on Temperate Sub-Neptune WaterworldsBiogenic Sulfur Gases as Biosignatures on Temperate Sub-Neptune Waterworlds
Biogenic Sulfur Gases as Biosignatures on Temperate Sub-Neptune Waterworlds
Sérgio Sacani
 
Asymmetry in the atmosphere of the ultra-hot Jupiter WASP-76 b
Asymmetry in the atmosphere of the ultra-hot Jupiter WASP-76 bAsymmetry in the atmosphere of the ultra-hot Jupiter WASP-76 b
Asymmetry in the atmosphere of the ultra-hot Jupiter WASP-76 b
Sérgio Sacani
 
Formation of low mass protostars and their circumstellar disks
Formation of low mass protostars and their circumstellar disksFormation of low mass protostars and their circumstellar disks
Formation of low mass protostars and their circumstellar disks
Sérgio Sacani
 
Discovery of an Accretion Streamer and a Slow Wide-angle Outflow around FUOri...
Discovery of an Accretion Streamer and a Slow Wide-angle Outflow around FUOri...Discovery of an Accretion Streamer and a Slow Wide-angle Outflow around FUOri...
Discovery of an Accretion Streamer and a Slow Wide-angle Outflow around FUOri...
Sérgio Sacani
 
Disentangling the origin of chemical differences using GHOST
Disentangling the origin of chemical differences using GHOSTDisentangling the origin of chemical differences using GHOST
Disentangling the origin of chemical differences using GHOST
Sérgio Sacani
 
Hubble Asteroid Hunter III. Physical properties of newly found asteroids
Hubble Asteroid Hunter III. Physical properties of newly found asteroidsHubble Asteroid Hunter III. Physical properties of newly found asteroids
Hubble Asteroid Hunter III. Physical properties of newly found asteroids
Sérgio Sacani
 
Observation of Gravitational Waves from the Coalescence of a 2.5–4.5 M⊙ Compa...
Observation of Gravitational Waves from the Coalescence of a 2.5–4.5 M⊙ Compa...Observation of Gravitational Waves from the Coalescence of a 2.5–4.5 M⊙ Compa...
Observation of Gravitational Waves from the Coalescence of a 2.5–4.5 M⊙ Compa...
Sérgio Sacani
 
The SAMI Galaxy Sur v ey: galaxy spin is more strongly correlated with stella...
The SAMI Galaxy Sur v ey: galaxy spin is more strongly correlated with stella...The SAMI Galaxy Sur v ey: galaxy spin is more strongly correlated with stella...
The SAMI Galaxy Sur v ey: galaxy spin is more strongly correlated with stella...
Sérgio Sacani
 
Is Betelgeuse Really Rotating? Synthetic ALMA Observations of Large-scale Con...
Is Betelgeuse Really Rotating? Synthetic ALMA Observations of Large-scale Con...Is Betelgeuse Really Rotating? Synthetic ALMA Observations of Large-scale Con...
Is Betelgeuse Really Rotating? Synthetic ALMA Observations of Large-scale Con...
Sérgio Sacani
 
First Direct Imaging of a Kelvin–Helmholtz Instability by PSP/WISPR
First Direct Imaging of a Kelvin–Helmholtz Instability by PSP/WISPRFirst Direct Imaging of a Kelvin–Helmholtz Instability by PSP/WISPR
First Direct Imaging of a Kelvin–Helmholtz Instability by PSP/WISPR
Sérgio Sacani
 
Hydrogen Column Density Variability in a Sample of Local Compton-Thin AGN
Hydrogen Column Density Variability in a Sample of Local Compton-Thin AGNHydrogen Column Density Variability in a Sample of Local Compton-Thin AGN
Hydrogen Column Density Variability in a Sample of Local Compton-Thin AGN
Sérgio Sacani
 

Plus de Sérgio Sacani (20)

Biogenic Sulfur Gases as Biosignatures on Temperate Sub-Neptune Waterworlds
Biogenic Sulfur Gases as Biosignatures on Temperate Sub-Neptune WaterworldsBiogenic Sulfur Gases as Biosignatures on Temperate Sub-Neptune Waterworlds
Biogenic Sulfur Gases as Biosignatures on Temperate Sub-Neptune Waterworlds
 
Asymmetry in the atmosphere of the ultra-hot Jupiter WASP-76 b
Asymmetry in the atmosphere of the ultra-hot Jupiter WASP-76 bAsymmetry in the atmosphere of the ultra-hot Jupiter WASP-76 b
Asymmetry in the atmosphere of the ultra-hot Jupiter WASP-76 b
 
Formation of low mass protostars and their circumstellar disks
Formation of low mass protostars and their circumstellar disksFormation of low mass protostars and their circumstellar disks
Formation of low mass protostars and their circumstellar disks
 
Nightside clouds and disequilibrium chemistry on the hot Jupiter WASP-43b
Nightside clouds and disequilibrium chemistry on the hot Jupiter WASP-43bNightside clouds and disequilibrium chemistry on the hot Jupiter WASP-43b
Nightside clouds and disequilibrium chemistry on the hot Jupiter WASP-43b
 
Discovery of an Accretion Streamer and a Slow Wide-angle Outflow around FUOri...
Discovery of an Accretion Streamer and a Slow Wide-angle Outflow around FUOri...Discovery of an Accretion Streamer and a Slow Wide-angle Outflow around FUOri...
Discovery of an Accretion Streamer and a Slow Wide-angle Outflow around FUOri...
 
Disentangling the origin of chemical differences using GHOST
Disentangling the origin of chemical differences using GHOSTDisentangling the origin of chemical differences using GHOST
Disentangling the origin of chemical differences using GHOST
 
All-domain Anomaly Resolution Office U.S. Department of Defense (U) Case: “Eg...
All-domain Anomaly Resolution Office U.S. Department of Defense (U) Case: “Eg...All-domain Anomaly Resolution Office U.S. Department of Defense (U) Case: “Eg...
All-domain Anomaly Resolution Office U.S. Department of Defense (U) Case: “Eg...
 
PossibleEoarcheanRecordsoftheGeomagneticFieldPreservedintheIsuaSupracrustalBe...
PossibleEoarcheanRecordsoftheGeomagneticFieldPreservedintheIsuaSupracrustalBe...PossibleEoarcheanRecordsoftheGeomagneticFieldPreservedintheIsuaSupracrustalBe...
PossibleEoarcheanRecordsoftheGeomagneticFieldPreservedintheIsuaSupracrustalBe...
 
Isotopic evidence of long-lived volcanism on Io
Isotopic evidence of long-lived volcanism on IoIsotopic evidence of long-lived volcanism on Io
Isotopic evidence of long-lived volcanism on Io
 
Hubble Asteroid Hunter III. Physical properties of newly found asteroids
Hubble Asteroid Hunter III. Physical properties of newly found asteroidsHubble Asteroid Hunter III. Physical properties of newly found asteroids
Hubble Asteroid Hunter III. Physical properties of newly found asteroids
 
Observational constraints on mergers creating magnetism in massive stars
Observational constraints on mergers creating magnetism in massive starsObservational constraints on mergers creating magnetism in massive stars
Observational constraints on mergers creating magnetism in massive stars
 
Observation of Gravitational Waves from the Coalescence of a 2.5–4.5 M⊙ Compa...
Observation of Gravitational Waves from the Coalescence of a 2.5–4.5 M⊙ Compa...Observation of Gravitational Waves from the Coalescence of a 2.5–4.5 M⊙ Compa...
Observation of Gravitational Waves from the Coalescence of a 2.5–4.5 M⊙ Compa...
 
The SAMI Galaxy Sur v ey: galaxy spin is more strongly correlated with stella...
The SAMI Galaxy Sur v ey: galaxy spin is more strongly correlated with stella...The SAMI Galaxy Sur v ey: galaxy spin is more strongly correlated with stella...
The SAMI Galaxy Sur v ey: galaxy spin is more strongly correlated with stella...
 
Is Betelgeuse Really Rotating? Synthetic ALMA Observations of Large-scale Con...
Is Betelgeuse Really Rotating? Synthetic ALMA Observations of Large-scale Con...Is Betelgeuse Really Rotating? Synthetic ALMA Observations of Large-scale Con...
Is Betelgeuse Really Rotating? Synthetic ALMA Observations of Large-scale Con...
 
First Direct Imaging of a Kelvin–Helmholtz Instability by PSP/WISPR
First Direct Imaging of a Kelvin–Helmholtz Instability by PSP/WISPRFirst Direct Imaging of a Kelvin–Helmholtz Instability by PSP/WISPR
First Direct Imaging of a Kelvin–Helmholtz Instability by PSP/WISPR
 
The Sun’s differential rotation is controlled by high- latitude baroclinicall...
The Sun’s differential rotation is controlled by high- latitude baroclinicall...The Sun’s differential rotation is controlled by high- latitude baroclinicall...
The Sun’s differential rotation is controlled by high- latitude baroclinicall...
 
Hydrogen Column Density Variability in a Sample of Local Compton-Thin AGN
Hydrogen Column Density Variability in a Sample of Local Compton-Thin AGNHydrogen Column Density Variability in a Sample of Local Compton-Thin AGN
Hydrogen Column Density Variability in a Sample of Local Compton-Thin AGN
 
Huygens - Exploring Titan A Mysterious World
Huygens - Exploring Titan A Mysterious WorldHuygens - Exploring Titan A Mysterious World
Huygens - Exploring Titan A Mysterious World
 
The Radcliffe Wave Of Milk Way is oscillating
The Radcliffe Wave Of Milk Way  is oscillatingThe Radcliffe Wave Of Milk Way  is oscillating
The Radcliffe Wave Of Milk Way is oscillating
 
Thermonuclear explosions on neutron stars reveal the speed of their jets
Thermonuclear explosions on neutron stars reveal the speed of their jetsThermonuclear explosions on neutron stars reveal the speed of their jets
Thermonuclear explosions on neutron stars reveal the speed of their jets
 

A candidate redshift z &lt; 10 galaxy and rapid changes in that population at an age of 500 myr

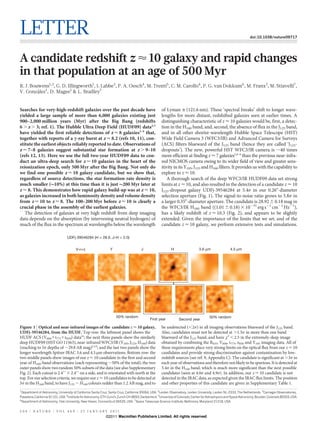
  • 1. LETTER doi:10.1038/nature09717 A candidate redshift z < 10 galaxy and rapid changes in that population at an age of 500 Myr R. J. Bouwens1,2, G. D. Illingworth1, I. Labbe3, P. A. Oesch4, M. Trenti5, C. M. Carollo4, P. G. van Dokkum6, M. Franx2, M. Stiavelli7, V. Gonzalez1, D. Magee1 & L. Bradley7 ´ Searches for very-high-redshift galaxies over the past decade have of Lyman a (121.6 nm). These ‘spectral breaks’ shift to longer wave- yielded a large sample of more than 6,000 galaxies existing just lengths for more distant, redshifted galaxies seen at earlier times. A 900–2,000 million years (Myr) after the Big Bang (redshifts distinguishing characteristic of z < 10 galaxies would be, first, a detec- 6 . z . 3; ref. 1). The Hubble Ultra Deep Field (HUDF09) data2,3 tion in the H160 band, and, second, the absence of flux in the J125 band, have yielded the first reliable detections of z < 8 galaxies3–9 that, and in all other shorter-wavelength Hubble Space Telescope (HST) together with reports of a c-ray burst at z < 8.2 (refs 10, 11), con- Wide Field Camera 3 (WFC3/IR) and Advanced Camera for Surveys stitute the earliest objects reliably reported to date. Observations of (ACS) filters blueward of the J125 band (hence they are called ‘J125- z < 7–8 galaxies suggest substantial star formation at z . 9–10 dropouts’). The new, powerful HST WFC3/IR camera is ,40 times (refs 12, 13). Here we use the full two-year HUDF09 data to con- more efficient at finding z < 7 galaxies2,4–9 than the previous near-infra- duct an ultra-deep search for z < 10 galaxies in the heart of the red NICMOS camera owing to its wider field of view and greater sens- reionization epoch, only 500 Myr after the Big Bang. Not only do itivity in its Y105, J125 and H160 filters. It provides us with the capability to we find one possible z < 10 galaxy candidate, but we show that, explore to z < 10. regardless of source detections, the star formation rate density is A thorough search of the deep WFC3/IR HUDF09 data set strong much smaller ( 10%) at this time than it is just 200 Myr later at limits at z < 10, and also resulted in the detection of a candidate z < 10 z < 8. This demonstrates how rapid galaxy build-up was at z < 10, J125-dropout galaxy UDFj-39546284 at 5.4s in our 0.260-diameter as galaxies increased in both luminosity density and volume density selection aperture (Fig. 1). The signal-to-noise ratio grows to 5.8s in from z < 10 to z < 8. The 100–200 Myr before z < 10 is clearly a a larger 0.350-diameter aperture. The candidate is 28.92 6 0.18 mag in crucial phase in the assembly of the earliest galaxies. the WFC3/IR H160 band ((1.01 6 0.18) 3 10231 erg s21 cm22 Hz21), The detection of galaxies at very high redshift from deep imaging has a likely redshift of z < 10.3 (Fig. 2), and appears to be slightly data depends on the absorption (by intervening neutral hydrogen) of extended. Given the importance of the limits that we set, and of the much of the flux in the spectrum at wavelengths below the wavelength candidate z < 10 galaxy, we perform extensive tests and simulations. UDFj-39546284 (H = 28.9, J–H > 2.0) V+i+z Y J H 3.6 m 4.5 m 50% random 50% random First year Second year Figure 1 | Optical and near-infrared images of the candidate z < 10 galaxy, be undetected (,2s) in all imaging observations blueward of the J125 band. UDFj-39546284, from the HUDF. Top row: the leftmost panel shows the Also, candidates must not be detected at .1.5s in more than one band HUDF ACS (V6061i7751z850) data26; the next three panels show the similarly blueward of the J125 band, and have x2 , 2.5 in the extremely-deep image deep HUDF09 (HST GO 11563), near-infrared WFC3/IR (Y105, J125, H160) data obtained by combining the B435, V606, i775, z850 and Y105 imaging data. All of (reaching to 5s depths of ,29.8 AB mag)2,3,9; and the last two panels show the these requirements place very strong limits on the optical flux from our z < 10 longer wavelength Spitzer IRAC 3.6 and 4.5 mm observations. Bottom row: the candidates and provide strong discrimination against contamination by low- two middle panels show images of our z < 10 candidate in the first and second redshift sources (see ref. 9, Appendix C). The candidate is significant at .3s in year of H160-band observations (each representing ,50% of the total); the two each year of observations and therefore not likely to be spurious. It is detected at outer panels show two random 50% subsets of the data (see also Supplementary 5.4s in the H160 band, which is much more significant than the next possible Fig. 2). Each cutout is 2.499 3 2.499 on a side, and is orientated with north at the candidates (seen at 4.0s and 4.9s). In addition, our z < 10 candidate is not top. For our selection criteria, we require our z < 10 candidates to be detected at detected in the IRAC data, as expected given the IRAC flux limits. The position 5s in the H160 band, to have J125 2 H160 colours redder than 1.2 AB mag, and to and other properties of this candidate are given in Supplementary Table 1. 1 Department of Astronomy, University of California Santa Cruz, Santa Cruz, California 95064, USA. 2Leiden Observatory, Leiden University, Leiden NL-2333, The Netherlands. 3Carnegie Observatories, Pasadena, California 91101, USA. 4Institute for Astronomy, ETH Zurich, Zurich CH-8093, Switzerland. 5University of Colorado, Center for Astrophysics and Space Astronomy, Boulder, Colorado 80303, USA. 6 Department of Astronomy, Yale University, New Haven, Connecticut 06520, USA. 7Space Telescope Science Institute, Baltimore, Maryland 21218, USA. 5 0 4 | N AT U R E | VO L 4 6 9 | 2 7 J A N U A RY 2 0 1 1 ©2011 Macmillan Publishers Limited. All rights reserved
  • 2. LETTER RESEARCH 1 reason for the robustness is the non-detection in all shorter wavelength UDFy-38135539 filters. The x2opt test that we have developed9 largely eliminates con- UDFy-33436598 taminating objects. 0.8 UDFy-37796000 Our z < 10 candidate was also checked for any Spitzer IRAC flux in J-dropouts the 3.6 mm band (see Fig. 1). It is quite isolated and is not detected to ,27 AB mag (2s), further enhancing the case that this z < 10 candidate corresponds to a very-high-redshift galaxy rather than a highly reddened, 0.6 lower-redshift contaminant. Contamination from spurious sources is Likelihood also an important concern for such faint sources. We verified that the source is present in a wide variety of subsets of the H160-band data (Fig. 1, 0.4 Supplementary Fig. 2), suggesting that the candidate is not spurious. Although these tests make a case for this source being a z < 10 galaxy, deeper observations—involving both imaging (with, for example, WFC3/ IR) and spectroscopy (with the James Webb Space Telescope)—will be 0.2 required to confirm it. Using the results of these tests and Monte Carlo simulations, we estimate there is an ,20% probability that our candidate is a contami- 0 nant or is spurious. Of that 20%, 10% was estimated to be from pho- 8 9 10 11 tometric scatter. Contamination from spurious sources is uncertain, Redshift and our estimates range from 1% to 10% probability; to be conservative Figure 2 | Predicted redshift distributions for our z < 8.5 and z < 10 galaxy we adopt 10%. Contamination from lower-redshift red sources is also candidates. The red line gives the redshift distribution for our z < 10 J125- possible, but the above single-filter z < 8 Y105-dropout test suggests dropout candidate, while the blue, green and magenta lines give the redshift that the probable contamination is small, consistent with the totals we distributions for our z < 8.5 Y105-dropout candidates. The H160-band source estimate from our other tests (,20%). images that correspond to the redshift distributions are shown for the z < 8.7, Fortunately, the depth of the data and the thoroughness of our 8.6 and z < 8.5 sources (labels arranged in same order as images), and for our z < 10.3 candidate. Each source image is 2.499 3 2.499, with north at the top. analysis for contamination allow us to set very strong constraints on The selection criteria for the z < 8–9 sources have been published elsewhere3,9 the volume density of z < 10 galaxies, regardless of the uncertainties (see also Supplementary Information section 5). However, the detailed redshift associated with our candidate z < 10 galaxy. Thus we evaluate our distributions are shown here for the first time. The redshift distributions were constraints based on the limit set if no galaxies were found, and based derived by adding artificial sources to the HUDF09 WFC3/IR data, and re- on the candidate z < 10 galaxy, whose volume density is corrected by selecting them in the same way as the actual galaxy candidates (see 20% to account for the estimated contamination rate. Supplementary Information sections 4, 5 and 9). The mean redshifts of these Large-scale structure uncertainties are important for small area distributions are 8.7, 8.6, 8.5 and 10.3. The z < 8.7 source has a tentative searches. We estimate the field-to-field variance on the present z < 10 spectroscopic confirmation at z < 8.6 (ref. 14). For these simulations, the J125-dropout searches in the HUDF09 field to be 39% (see ultraviolet luminosity function was used. The luminosity function describes the number density of galaxies versus luminosity and is usually parameterized as Supplementary Information)20. Even at this level, the cosmic variance w*e2L/L*(L/L*)a, where w* is the normalization, L* is the characteristic (‘large-scale structure’) is not the dominant source of uncertainty for our luminosity, and a is the faint end slope (see Fig. 3). The luminosity function was single candidate galaxy. assumed to have an M*UV of 219.5 and 218.8 at z < 8 and z < 10, respectively These z < 10 results have far-reaching implications for estimating (based on predictions from our z < 4–6 fitting relation9,22), while a was taken to the role of galaxies in reionization (using the luminosity density), and be 21.74. for establishing the star formation rate density at very early times, as z < 10 is just 480 Myr after the Big Bang and just a few hundred million These are described in Supplementary Information sections 4 and 7, years since the first galaxies formed. Strikingly, the upper limits and while the candidate properties are given in Supplementary Table 1. our candidate allow us to do this through quantitative constraints we The existence of galaxies at z . 8.2 (the c-ray burst redshift10,11) is place on the z < 10 luminosity function. strengthened by three additional sources that have been detected in The extent of the changes at z < 10 can be demonstrated by first recent searches3–9, one of which has a tentative spectroscopic con- contrasting what we see at z < 10 with expectations based on a ‘no- firmation at z 5 8.6 (ref. 14). The updated redshift distributions from evolution’ scenario: that is, the galaxy populations stay unchanged our simulations show that these three sources3 are most likely to be at with time. We compute the ‘no-evolution’ estimate by using our z < 8.7, 8.5 and 8.6 (Fig. 2). The expectation of finding galaxies at ‘galaxy cloning’ software21 to artificially redshift the observed z < 6 z < 10, just ,120 Myr earlier, is enhanced by these strong detections and z < 7 galaxy population to z < 10, add them at random positions at z < 8.5, especially since the z < 7–8 Spitzer and HST data suggest within our HUDF data, and then repeat the object selection process that substantial star formation is likely at z . 9–10 (refs 12, 13). just as for the observed z < 10 galaxies. We estimated that we would The photometric-selection ‘dropout’ approach has been verified find 12 6 4 z < 10 galaxies using our z < 7 detections as the baseline, through numerous spectroscopic confirmations at redshifts from and 23 6 5 z < 10 galaxies using our z < 6 detections as a baseline. z < 2 to z < 6 (refs 15–19), and possibly also now at z < 8.6 (ref. 14). These ‘no-evolution’ estimates are substantially higher than our (con- For our candidate z < 10 galaxy, however, its single band (H160 band) tamination-corrected) estimate of ,0.8 z < 10 galaxies. For simple detection increases the risk of contamination compared to the z < 7 and Poissonian statistics, our observed number of ,0.8 galaxies is incon- z < 8 samples, where two (or more) bands are used to measure the sistent with no-evolution at 4s and 5s confidence, respectively (and source magnitudes and colours. Fortunately, we can test the robustness sets even stronger limits on any ‘upturn’ in the star formation rate6). of the single-band detection process by selecting z < 8 galaxy candidates Although striking, this is not wholly unexpected. Extrapolating the using the J125-band data alone. Analogous to the z < 10 J125-dropouts, trends seen by us at lower redshifts22 would lead us to expect 3 6 2 z < 8 galaxies are Y105-band dropouts. We compare this single-band z < 10 sources. Thus our results reaffirm that the significant evolution selection against the more robust z < 8 detections using two bands3 seen in galaxies at lower redshift continues to z < 10 (in contrast with (J125 and H160). We are very encouraged that we select the same eight other studies6). z < 8 Y105-dropouts with the J125-band data alone, as we do with the The present search results can also be expressed as constraints on normal selection using both the J125- and H160-band data. The primary the luminosity function at z < 10. The luminosity function describes 2 7 J A N U A RY 2 0 1 1 | VO L 4 6 9 | N AT U R E | 5 0 5 ©2011 Macmillan Publishers Limited. All rights reserved
  • 3. RESEARCH LETTER the number density of galaxies versus luminosity, and is important for Time (Gyr) estimating the ultraviolet flux from galaxies and their expected role in 10 54 3 2 1 0.6 0.4 reionizing the Universe. The high-redshift-galaxy ultraviolet luminosity 27 –1 function maintains a nearly constant form and evolves in a largely self- >0.06 Lz = 3 log10(erg s–1 Mpc–3) log10(M yr –1 Mpc–3) similar manner, with the characteristic luminosity (L*) increasing smoothly over about 1,300 Myr from z < 7 to z < 3, that is, from –2 26 ,750 Myr to ,2,000 Myr. Assuming the same form for the ultraviolet luminosity function at z < 10, we find that L* at z < 10 is fainter, indi- 25 –3 cating that the evolution in the bright end of the ultraviolet luminosity function seen from z < 7 to z < 4 (refs 1, 9, 22) continues to z < 10 24 (Fig. 3). Definitive measurements of L* at z < 10 will, of course, require –4 deep, wide-area data to define the luminous end of the z < 10 luminosity 0 2 4 6 8 10 function. Redshift The existence of a steep slope a to the faint end of the ultraviolet luminosity function found at z < 6–7 (refs 1, 2, 9) highlights the Figure 4 | The luminosity density and star formation rate density in the importance of low luminosity galaxies in providing the flux needed Universe over 13.2 Gyr. The rest-frame continuum ultraviolet luminosity to reionize the Universe. It is of great interest to estimate the ultraviolet density (right axis, blue points) at z < 10, and the star formation rate density luminosity density at z < 7–10 where reionization most probably (left axis, red points) derived from the extinction-corrected luminosity occurred, given its apparent completion at z < 6 (ref. 23) and its onset density1,25,, are integrated down to the approximate magnitude limit MAB < 218 (0.06L*) of our z < 10 J125-dropout search. The conversion from at z < 11 as deduced from Wilkinson Microwave Anisotropy Probe ultraviolet luminosity to star formation rate assumes a Salpeter initial mass (WMAP)24 observations. The recent results from the HUDF09 data set function. The upper horizontal axis gives the time after the Big Bang and the provide estimates for the ultraviolet luminosity density at z < 7 and at lower axis the redshift. As before, we assume that the ultraviolet luminosity z < 8 (ref. 9). We can now also do so at z < 10. We compute the function has the same faint-end slope (and normalization) as at z < 6 and z < 7. luminosity density implied by our sample by assuming a faint-end The star formation rate density (1.914.4 3 1024 M[ yr21 Mpc23) from the 21.5 slope of 21.7 (the same slope as found for the z < 2–7 luminosity contamination-corrected sample is shown at z < 10 from the current functions) and extending the integration down to a very plausible limit J125-dropout search, as is the 1s upper limit (,3 3 1024 M[ yr21 Mpc23) if we of 212 AB mag. We find that the ultraviolet flux that is available from assume no z < 10 sources are detected. All error bars are 1s. Also included here are the recent star formation rate determinations at z < 7 and z < 8 from our HUDF09 WFC3/IR z850-dropout and Y105-dropout searches9, and from the literature at z , 4 (green and black points: refs 27, 30) and at z < 4–6 (ref. 1). –2 The dust corrections at z < 4 are based on the estimated ultraviolet-continuum slopes b, and are already negligible by z < 7 (refs 2, 3, 25). There is no evidence for any substantial change in the star formation rate density trends established log10(number mag–1 Mpc–3) z≈4 at lower redshift. –3 z ≈ 10 galaxies at z < 10 is only ,12126% of what is needed for galaxies to be 210 the reionizing source, with typical assumptions of an escape fraction of –4 ,0.4, a clumping factor of ,3 and a Salpeter initial mass function (see, for example, ref. 9). This result is tantalizing, suggesting that galaxies z≈7 are contributing to reionization, but the enigma remains: where are –5 most of the needed ultraviolet photons coming from? Obser- vations to significantly fainter levels will be central to characterizing the role of galaxies in reionization. The star formation rate (SFR) density is derived from the luminosity –22 –20 –18 –16 density (see Fig. 4). The SFR density increases systematically and Luminosity (M1600,AB) monotonically at early times from z < 10 (500 Myr) to z < 4 Figure 3 | Ultraviolet luminosity functions at z < 4, z < 7 and constraints (1,600 Myr), peaking at z < 2–3 (at ,2,500 Myr), before decreasing for z < 10. The present constraints on the stepwise ultraviolet luminosity at z , 2 (Fig. 4). This suggests that the luminosity function and star function at z < 10 (black points and upper limits) are new and are derived from formation rate density evolution found at lower redshifts1,25 continues the J125-dropout candidate galaxies over our ultra-deep HUDF WFC3/IR field. to z < 10 when the universe was just 480 Myr old. The limits estab- These luminosity functions are a function of the absolute magnitude (that is, lished here even suggest that the trends in star formation rate density luminosity) of galaxies (M1600,AB) in the rest-frame far-ultraviolet. All error established at lower redshifts could be steepening. bars are 1s. The stepwise luminosity function at z < 10 is also presented as a 1s This is clearly an era when galaxies were evolving very rapidly. The upper limit, given the uncertainty of our z < 10 candidate. The lowest star formation rate density increased by a factor of ,10 in less than luminosity point has been corrected for incompleteness. The ultraviolet 200 Myr, from z < 10 to z < 8. This dramatic change in such a short luminosity functions1,9 at z < 4 (blue) and at z < 7 (magenta) are shown for comparison. The luminosity functions fitted here are of the form w*e2L/L*(L/ period of time suggests that the first phases of galaxy formation and L*)a (see Fig. 2 legend). This analytic representation has recently been shown9 their build-up could be unveiled by observations that penetrate just to fit well at z < 7 and later times. The present search results also allow us to 200 Myr earlier, to redshifts z < 15. However, only when the James estimate the value of L* at z < 10—assuming that the luminosity function at Webb Space Telescope is launched will these first phases of galaxy z < 10 has the same values of w* and a < 21.7 as have been found to describe build-up between z < 15 and z < 10 be revealed. ultraviolet luminosity function results from z < 7 to z < 4 (refs 1, 2, 9, 27–29). Doing so allows us to constrain the evolution in the luminosity function out to Received 21 December 2009; accepted 30 November 2010. z < 10, nearly 500 Myr earlier than at z < 6 (and so halving the time difference between the first galaxies at z < 15–20 and those seen at z < 6). We find L* at 1. Bouwens, R. J., Illingworth, G. D., Franx, M. & Ford, H. UV luminosity functions at z,4, 5, and 6 from the Hubble Ultra Deep Field and other deep Hubble Space z < 10 to be 218.3 6 0.5 AB mag, or L* . 218.3 in the limit of no detected Telescope ACS fields: evolution and star formation history. Astrophys. J. 670, sources—although obviously very uncertain, this is consistent with the 928–958 (2007). evolution in the bright end of the ultraviolet luminosity function seen from 2. Oesch, P. A. et al. z,7 Galaxies in the HUDF: first epoch WFC3/IR results. Astrophys. z < 7 to z < 4 continuing to z < 10. J. 709, L16–L20 (2010). 5 0 6 | N AT U R E | VO L 4 6 9 | 2 7 J A N U A RY 2 0 1 1 ©2011 Macmillan Publishers Limited. All rights reserved
  • 4. LETTER RESEARCH 3. Bouwens, R. J. et al. Discovery of z,8 galaxies in the HUDF from ultra-deep WFC3/ 22. Bouwens, R. J., Illingworth, G. D., Franx, M. & Ford, H. z , 7–10 galaxies in the HUDF IR observations. Astrophys. J. 709, L133–L137 (2010). and GOODS Fields: UV luminosity functions. Astrophys. J. 686, 230–250 (2008). 4. McLure, R. et al. Galaxies at z,6–9 from the WFC3/IR imaging of the HUDF. Mon. 23. Fan, X. et al. Evolution of the ionizing background and the epoch of reionization Not. R. Astron. Soc. 403, 960–983 (2010). from the spectra of z,6 quasars. Astron. J. 123, 1247–1257 (2002). 5. Bunker, A. et al. The contribution of high redshift galaxies to cosmic reionization: 24. Komatsu, E. et al. Seven-Year Wilkinson Microwave Anisotropy Probe observations: new results from deep WFC3 Imaging of the Hubble Ultra Deep Field. Mon. Not. R. cosmological interpretation. Astrophys. J. (in the press); preprint at Æhttp:// Astron. Soc. 409, 855–866 (2010). arXiv.org/abs/1001.4538æ (2010). 6. Yan, H. et al. Galaxy formation in the reionization epoch as hinted by Wide Field 25. Bouwens, R. et al. UV-continuum slope and dust obscuration from z,6 to z,2: the Camera 3 observations of the Hubble Ultra Deep Field. Res. Astron. Astrophys. 10, star formation rate density at high redshift. Astrophys. J. 705, 936–961 (2009). 867–904 (2010). 26. Beckwith, S. W. et al. The Hubble Ultra Deep Field. Astrophys. J. 132, 1729–1755 7. Finkelstein, S. et al. On the stellar populations and evolution of star-forming (2006). galaxies at 6.3,z8.6. Astrophys. J. 719, 1250–1273 (2010). 27. Reddy, N. & Steidel, C. C. A steep faint-end slope of the UV luminosity function at z 8. Robertson, N., Ellis, R. S., Dunlop, R. S., McLure, R. J. & Stark, D. P. Early star-forming , 2–3: implications for the global stellar mass density and star formation in low- galaxies and the reionization of the Universe. Nature 468, 49–55 (2010). mass halos. Astrophys. J. 692, 778–803 (2009). 9. Bouwens, R. J. et al. UV luminosity functions from 113 z,7 and z,8 Lyman-break 28. Yoshida, M. et al. Luminosity functions of Lyman break galaxies at z,4 and z,5 in galaxies in the ultra-deep HUDF09 and wide-area ERS WFC3/IR observations, the Subaru Deep Field. Astrophys. J. 653, 988–1003 (2006). 2010. Astrophys. J. (submitted); preprint at Æhttp://arxiv.org/abs/1006.4360æ 29. McLure, R., Cirasuolo, M., Dunlop, J. S., Foucaud, S. & Almaini, O. The luminosity (2010). function, halo masses, and stellar masses of luminous Lyman-break galaxies at 10. Tanvir, N. et al. A c-ray burst at a redshift of z < 8. Nature 461, 1254–1257 (2009). 5,z6. Mon. Not. R. Astron. Soc. 395, 2196–2209 (2009). 11. Salvaterra, R. et al. GRB090423 at a redshift of z < 8.1. Nature 461, 1258–1260 30. Schiminovich, D. et al. The GALEX-VVDS measurement of the evolution of the far- (2009). ultraviolet luminosity density and the cosmic star formation rate. Astrophys. J. 619, 12. ´, Labbe I. et al. Ultradeep IRAC observations of sub-L* z,7 and z,8 galaxies in the L47–L50 (2005). HUDF: the contribution of low-luminosity galaxies to the stellar mass density and Supplementary Information is linked to the online version of the paper at reionization. Astrophys. J. 708, L26–L31 (2010). www.nature.com/nature. 13. Gonza ´lez, V. et al. Stellar mass density and specific star formation rates of the Universe at z,7. Astrophys. J. 713, 115–130 (2010). Acknowledgements We are grateful to all those at NASA, STScI and throughout the 14. Lehnert, M. et al. Spectroscopic confirmation of a galaxy at z 5 8.6. Nature 467, community who have worked to make the Hubble Space Telescope the observatory 940–942 (2010). that it is today, and we acknowledge the importance of the servicing missions and those 15. Steidel, C. C., Giavalisco, M., Pettini, M., Dickinson, M. & Adelberger, K. L. who organised them. We acknowledge our program coordinator W. Januszewski for his Spectroscopic confirmation of a population of normal star-forming galaxies at care in helping to set up our program and observing configuration. We acknowledge redshifts z . 3. Astrophys. J. 462, L17–L21 (1996). support from NASA and the Swiss National Science Foundation. 16. Vanzella, E. et al. Spectroscopic observations of Lyman break galaxies at redshifts Author Contributions R.J.B. carried out the most of the data analysis and calculations ,4, 5, and 6 in the Goods-South Field. Astrophys. J. 695, 1163–1182 (2009). for this paper, and wrote most of the Supplementary Information; G.D.I. wrote most of 17. Popesso, P. et al. The great observatories origins deep survey. VLT/VIMOS the text in the Letter and iterated on the initial science results and content with R.J.B.; spectroscopy in the GOODS-south field. Astron. Astrophys. 494, 443–460 (2009). I.L., P.A.O., M.T., C.M.C., P.G.v.D., M.F., M.S. and L.B. provided significant feedback on the 18. Steidel, C. C. et al. Lyman break galaxies at redshift z , 3: survey description and science content and on the drafts; I.L. and V.G. were involved with processing the full data set. Astrophys. J. 592, 728–754 (2003). Spitzer IRAC data; P.A.O. contributed to the data analysis; M.T. made the cosmic 19. Reddy, N. et al. A spectroscopic survey of redshift 1.4,,z,,3.0 galaxies in the variance estimates; and D.M. was involved in data processing and pipeline generation GOODS-North Field: survey description, catalogs, and properties. Astrophys. J. for the WFC3/IR data. 653, 1004–1026 (2006). 20. Trenti, M. & Stiavelli, M. Cosmic variance and its effect on the luminosity function Author Information Reprints and permissions information is available at determinations in deep high-z surveys. Astrophys. J. 676, 767–780 (2008). www.nature.com/reprints. The authors declare no competing financial interests. 21. Bouwens, R. J., Broadhurst, T. J. & Silk, J. Cloning Hubble Deep Fields. I. A model- Readers are welcome to comment on the online version of this article at independent measurement of galaxy evolution. Astrophys. J. 506, 557–578 www.nature.com/nature. Correspondence and requests for materials should be (1998). addressed to R.J.B. (bouwens@ucolick.org). 2 7 J A N U A RY 2 0 1 1 | VO L 4 6 9 | N AT U R E | 5 0 7 ©2011 Macmillan Publishers Limited. All rights reserved