SlideShare une entreprise Scribd logo
1  sur  16
Télécharger pour lire hors ligne
X-raying the ejecta of Supernova 1987A

                                ¨
J. Larsson1 , C. Fransson1 , G. Ostlin1, P. Gr¨ ningsson1, A. Jerkstrand1 , C. Kozma1, J. Sollerman1 ,
                                              o

P. Challis2 , R. P. Kirshner2 , R. A. Chevalier3 , K. Heng4 , R. McCray5 , N. B. Suntzeff6 , P. Bouchet7 ,

A. Crotts8 , J. Danziger9 , E. Dwek10 , K. France11 , P. M. Garnavich12 , S. S. Lawrence13 ,

B. Leibundgut14, P. Lundqvist,1 N. Panagia15,16,17 , C. S. J. Pun18 , N. Smith19 , G. Sonneborn10 ,

L. Wang20 , J. C. Wheeler21


1
    Department of Astronomy, The Oskar Klein Centre, Stockholm University, 106 91 Stockholm,

Sweden.

2
    Harvard-Smithsonian Center for Astrophysics, 60 Garden Street, MS-19, Cambridge, MA 02138,

USA.

3
    Department of Astronomy, University of Virginia, Charlottesville, VA 22903, USA

4
    Eidgen¨ ssische Technische Hochschule Z¨ rich, Institute for Astronomy, Wolfgang-Pauli-Strasse
          o                                u

27, CH-8093, Z¨ rich, Switzerland.
              u

5
    JILA, University of Colorado, Boulder, CO 803090-0440, USA.

6
    George P. and Cynthia Woods Mitchell Institute for Fundamental Physics and Astronomy, Texas

A&M University, Department of Physics and Astronomy, College Station, TX 77843, USA.

7                     ´                          ´ ´                        ´
    DSM/IRFU/Service dAstrophysique Commissariat a lEnergie Atomique et aux Energies Alterna-

tives, Saclay, Orme des Merisiers, FR 91191 Gif-sur-Yvette, France.

8
    Department of Astronomy, Mail Code 5240, Columbia University, 550 West 120th Street, New

York, NY 10027, USA.


                                                    1
9
    Osservatorio Astronomico di Trieste, Via Tiepolo 11, Trieste, Italy.

10
     NASA Goddard Space Flight Center, Code 665, Greenbelt, MD 20771, USA.

11
     Center for Astrophysics and Space Astronomy, University of Colorado, Boulder, CO 80309,

USA.

12
     225 Nieuwland Science, University of Notre Dame, Notre Dame, IN 465565670, USA.

13
     Department of Physics and Astronomy, Hofstra University, Hempstead, NY 11549, USA.

14
     ESO, Karl-Schwarzschild-Strasse 2, 85748 Garching, Germany.

15
     Space Telescope Science Institute, 3700 San Martin Drive, Baltimore, MD 21218, USA.

16
     INAF-CT, Osservatorio Astrosico di Catania, Via S. Soa 78, I-95123 Catania, Italy.

17
     Supernova Limited, OYV #131, Northsound Road, Virgin Gorda, British Virgin Islands.

18
     Department of Physics, University of Hong Kong, Pok Fu Lam Road, Hong Kong, China.

19
     Steward Observatory, University of Arizona, 933 North Cherry Avenue, Tucson, AZ 85721,

USA.

20
     Department of Physics and Astronomy, Texas A&M University, College Station, TX 77844242,

USA.

21
     Department of Astronomy, University of Texas, Austin, TX 787120259, USA.


When a massive star explodes as a supernova, substantial amounts of radioactive elements,

primarily 56 Ni, 57 Ni and 44 Ti, are produced1 . After the initial flash of light from shock heat-

ing, the fading light emitted by the supernova is due to the decay of these elements2 . However,

after decades, the energy for a supernova remnant comes from the shock interaction between

the ejecta and the surrounding medium3 . The transition to this phase has hitherto not been


                                                    2
observed: supernovae in the Milky Way are too infrequent to provide a young example, and

extragalactic supernovae are generally too faint and too small. Here we report observations

that show this transition in the supernova SN 1987A in the Large Magellanic Cloud. From

                                                                               44
1994 to 2001 the ejecta faded as predicted by radioactive power from                Ti. After that, the

flux started to increase, reaching a level more than twice as high by the end of 2009. We show

that this increase is the result of heat deposited by X-rays produced as the ejecta interacts

with the surrounding material.


      Due to the proximity of SN 1987A (located only 160, 000 light years away), we can study

the evolution of the supernova (SN) in great detail. The central ejecta are surrounded by a ring

of circumstellar material (Fig. 1) that was shed from the star 20, 000 years before the explosion in

19874 . Since the explosion, the ejecta have been expanding, and now the outer parts of the ejecta

are colliding with the ring, causing it to brighten at all wavelengths5–8 . The dense, central part of

the ejecta contains most of the mass from the disrupted star and acts as a calorimeter for the energy

input to the SN. Here we determine the energy input by tracking the energy output with the Hubble

Space Telescope (HST).


      Because the ejecta are roughly elliptical in projection on the sky we use an elliptical aper-

ture to measure the brightness. To monitor a constant mass of expanding material, we allow the

measuring aperture to expand linearly with time. The axes of the aperture are therefore three times

larger in 2009 than in 1994 (Fig. 1). Using this aperture, we determined the R-and and B-band

light curves of the ejecta, as shown in Fig. 2 (see Supplementary Table 1 and Supplementary Infor-


                                                  3
mation, section 1 for further details of the observations and light curves). Our measurements show

that the flux from the ejecta decays during the first ∼ 5, 000 days after the explosion, as expected

from radioactive input, but then starts to increase, reaching a level that is 2-3 times higher around

day 8, 000 (end of 2009). A new energy source must be present in addition to radioactive decay.

Below, we consider a model for the declining phase and then discuss the new energy source that is

responsible for the observed increase in flux.


      The energy input to the declining phase of the light curve after ∼ 1, 500 days is expected

to come from positrons produced in the decay of      44
                                                          Ti2, 9, 10. To test this we use a model2 with

abundances taken from the 14E1 explosion model11 and a          44
                                                                     Ti mass of 1.4 × 10⁻⁴ M   12
                                                                                                    (Sup-

plementary Information, section 3). The model is shown in Fig. 3 together with the observed

broadband luminosities. The good agreement with the observations up to day 5, 000 confirms that

the 44 Ti positrons provide the energy input up to this point. However, after day 5, 000 the model

clearly fails to describe the light curve; radioactive decay cannot explain the increase in flux that

we observe.


      One possible origin for the flux increase is the reverse shock that results from the interaction

between the ejecta and the H II region inside the ring13–16 . The reverse shock produces strong Lyα

and Hα emission, which has increased by a factor of ∼ 1.7 between 2004 and 201016 . Although

most of this emission originates close to the ring, there is also a component of projected high-

velocity Hα-emission that can be traced to the central parts of the ejecta16 , which would contribute

to the flux we measure. To determine the contribution from the reverse shock to our light curves


                                                 4
we have examined HST STIS spectra from 2004 and 2010 (Supplementary Information, section 2

and Supplementary Fig. 5). The reverse shock can be isolated in the spectra because of its boxy

line profile, allowing us to place a limit on its contribution at < 20%. Furthermore, this changes
                                                                 ∼

only marginally between 2004 and 2010, as the expanding measuring aperture remains well inside

the area where most of the shock emission is seen. Importantly, an increase in flux is also seen

in the [Ca II] λλ7292, 7324 lines between 2000 – 2010 (determined from UVES observations at

the ESO/VLT, Fig. 2). These lines have velocities < 5, 000 km s−1 , implying that they originate
                                                  ∼

in the inner ejecta (the projected ejecta velocity near the edge of the ring is > 7, 000 km s−1 at the
                                                                                ∼

present time). We conclude that the increase in flux occurs primarily in the inner ejecta and cannot

be explained by emission from the shock region.


      We believe that the strong X-ray flux produced in the ring collision is the dominant source

of energy input to the ejecta. The X-ray flux from the ring increased by a factor ∼ 3 in the 0.5 –

10 keV band between day 6, 000 and day 8, 0006, similar to what we find for the optical emission

from the ejecta. To investigate this, we calculated the fraction of X-rays absorbed by the ejecta from

a point source located at the ring, using the partially mixed 14E1 explosion model17. As shown in

Supplementary Fig. 6, most of the observed X-ray flux is absorbed in the core region of the ejecta

(corresponding to velocities less than 5, 000 km s−1 ), where most of the heavy elements reside. At

an energy of ∼ 0.35 keV, which corresponds to the temperature of the dominant component in the

X-ray spectrum18 , the fraction of flux absorbed by the ejecta at tyr years can be approximated by

1.6 × 10⁻³ t1.67 (the increase with time is mainly due to the increasing solid angle of the expanding
            yr


ejecta, assumed to be spherical, as seen from the ring). This gives a current-day absorbed X-


                                                  5
ray luminosity of ∼ 5.0 × 1035 erg s−1 . In this calculation we have neglected the weaker, hard

component that contributes to the X-ray spectrum18 . We note that this does not significantly affect

the estimate of the absorbed flux, although the hard X-rays may be important due to their larger

penetrating power.


     To model the ejecta light curve produced by input from the X-rays we scaled the observed

X-ray flux6 by the fraction absorbed at 0.35 keV, multiplied the resulting flux with a constant

(corresponding to the conversion efficiency from X-rays to optical) and added this to the radioactive

energy input. Fig. 3 shows the scaled X-ray flux together with the observed light curves. This

model follows the general trend of the observed fluxes in both bands, although we note that a more

accurate model would need to take into account the detailed shape of the X-ray spectrum and the

reprocessing of the X-rays into optical emission. The required conversion efficiency from X-rays

to optical emission in our model is 5.0% in the R-band and 3.1% in the B-band.


     The conversion of X-rays to optical/IR emission is similar to that of the 44 Ti positrons. Both

involve degradation of non-thermal electrons to heating, ionization and excitation. For a typical

ionization fraction of 10−3 − 10−2 , the expected efficiency of conversion from X-rays to Hα (the

dominant line in the R-band) is ∼ 5% (Supplementary Information, section 3). This conversion

factor is consistent with the scaling factor we used to model the light curve. Similar arguments

apply to the B-band. Furthermore, the density in the core is high enough for the time-scale of

recombination to be shorter than the expansion time-scale, ensuring a balance between the energy

input and output.


                                                 6
Other possible explanations for the increase in flux include input from a central pulsar19 , a

transition from optically thick to optically thin dust and positron leakage from the Fe-rich regions.

We find that input from a pulsar is unlikely for several reasons. In particular, it would be a strange

coincidence for the emission from the pulsar to mimic the increasing X-ray flux from the ring

interaction. Also, we expect the energy input from a pulsar to be concentrated toward the low-

velocity material at the centre of the ejecta, while observations of the Hα and [Ca II] lines show

that the increase occurs for velocities up to ∼ 5, 000 km s−1 . We also note that constraints on a

point source at the centre of SN 1987A have already been obtained using HST data taken near the

minimum of the ejecta light curve20 . A change in the properties of the dust or a transition in the

positron deposition process are also unable to quantitatively explain the observed increase in flux

(Supplementary Information, section 4).


      We conclude that SN 1987A has made a transition from a radioactively dominated phase to

a phase dominated by the X-ray input from the ring collision. This conclusion has interesting im-

plications for the observed morphology. In particular, most of the X-rays are likely to be absorbed

at the boundary of the ejecta core, where the density increases rapidly. This may lead to the light

from the ejecta being emitted in a ring that is concentrated to the plane of the circumstellar ring.

The ’hole’ in the ejecta (Fig. 1), which has become more pronounced since ∼ 2001, may in fact be

a result of this, rather than reflect the true density distribution or dust obscuration. The asymmetric

morphology seen at velocities < 3, 000 km s−1 in the near-IR [Si I] and [Fe II] lines21 is, however,
                              ∼

likely to be intrinsic to the metal core. By studying future changes in the morphology of the ejecta,

we will be able to understand the origin of this asymmetry


                                                  7
In the future the density of the ejecta will decrease and the fraction of X-rays absorbed will

grow (Supplementary Fig. 7). As a result the ionization will increase and a smaller fraction of the

X-ray flux will produce line excitation, while a larger fraction will go into heating, leading to an

increase in the mid-IR flux and a flattening of the optical light curves. With time the X-rays will

also penetrate deeper layers of the ejecta, thereby allowing us to probe the chemical structure of

the innermost ejecta. This will be a novel form of X-ray tomography.


                                                8
References

[1] Woosley, S. E., Heger, A. & Weaver, T. A. The evolution and explosion of massive stars.

    Reviews of Modern Physics 74, 1015–1071 (2002).


[2] Fransson, C. & Kozma, C. Radioactivities and nucleosynthesis in SN 1987A. New Astronomy

    Review 46, 487–492 (2002).


[3] McKee, C. F. in Young Supernova Remnants (eds S. S. Holt & U. Hwang) vol. 565 of Ameri-

    can Institute of Physics Conference Series, 17–28 (2001).


[4] Morris, T. & Podsiadlowski, P. The Triple-Ring Nebula Around SN 1987A: Fingerprint of a

    Binary Merger. Science 315, 1103–1105 (2007).


[5] Gr¨ ningsson, P. et al. Time evolution of the line emission from the inner circumstellar ring
      o

    of SN 1987A and its hot spots. Astron. Astrophys. 492, 481–491 (2008).


[6] Racusin, J. L. et al. X-ray Evolution of SNR 1987A: The Radial Expansion. Astrophys. J.

    703, 1752–1759 (2009).


[7] Zanardo, G. et al. Multifrequency Radio Measurements of Supernova 1987A Over 22 Years.

    Astrophys. J. 710, 1515–1529 (2010).


[8] Dwek, E. et al. Five Years of Mid-infrared Evolution of the Remnant of SN 1987A: The

    Encounter Between the Blast Wave and the Dusty Equatorial Ring. Astrophys. J. 722, 425–

    434 (2010).


                                               9
[9] Timmes, F. X., Woosley, S. E., Hartmann, D. H. & Hoffman, R. D. The Production of 44 Ti

     and 60 Co in Supernovae. Astrophys. J. 464, 332–341 (1996).


[10] Diehl, R. & Timmes, F. X. Gamma-Ray Line Emission from Radioactive Isotopes in Stars

     and Galaxies. PASP 110, 637–659 (1998).


[11] Shigeyama, T. & Nomoto, K. Theoretical light curve of SN 1987A and mixing of hydrogen

     and nickel in the ejecta. Astrophys. J. 360, 242–256 (1990).

                                                      44
[12] Jerkstrand, A., Fransson, C. & Kozma, C. The          Ti-powered spectrum of SN 1987A. As-

     tron. Astrophys. (in press); preprint at http://arxiv.org/abs/1103.3653 (2011).


[13] Michael, E. et al. Hubble Space Telescope Observations of High-Velocity Lyα and Hα Emis-

     sion from Supernova Remnant 1987A: The Structure and Development of the Reverse Shock.

     Astrophys. J. 593, 809–830 (2003).


[14] Smith, N. et al. The Reverse Shock of SNR 1987A at 18 Years after Outburst. Astrophys. J.

     635, L41–L44 (2005).


[15] Heng, K. et al. Evolution of the Reverse Shock Emission from SNR 1987A. Astrophys. J.

     644, 959–970 (2006).


[16] France, K. et al. Observing Supernova 1987A with the Refurbished Hubble Space Telescope.

     Science 329, 1624–1627 (2010).


                                               10
[17] Blinnikov, S., Lundqvist, P., Bartunov, O., Nomoto, K. & Iwamoto, K. Radiation Hydrody-

     namics of SN 1987A. I. Global Analysis of the Light Curve for the First 4 Months. Astro-

     phys. J. 532, 1132–1149 (2000).


[18] Zhekov, S. A., Park, S., McCray, R., Racusin, J. L. & Burrows, D. N. Evolution of the

     Chandra CCD spectra of SNR 1987A: probing the reflected-shock picture. Mon. Not. R. As-

     tron. Soc. 721, 518–529 (2010).


[19] Woosley, S. E., Hartmann, D. & Pinto, P. A. Hard emission at late times from SN 1987A.

     Astrophys. J. 346, 395–404 (1989).


[20] Graves, G. J. M. et al. Limits from the Hubble Space Telescope on a Point Source in SN

     1987A. Astrophys. J. 629, 944–959 (2005).


[21] Kjær, K., Leibundgut, B., Fransson, C., Jerkstrand, A. & Spyromilio, J. The 3-D structure of

     SN 1987A’s inner ejecta. Astron. Astrophys. 517, A51–A60 (2010).


[22] Chugai, N. N., Chevalier, R. A., Kirshner, R. P. & Challis, P. M. Hubble Space Telescope

     Spectrum of SN 1987A at an Age of 8 Years: Radioactive Luminescence of Cool Gas. As-

     trophys. J. 483, 925–940 (1997).


[23] Lucy, L. B., Danziger, I. J., Gouiffes, C. & Bouchet, P. Dust Condensation in the Ejecta of

     Supernova 1987A - Part Two. In S. E. Woosley (ed.) Supernovae, 82–94 (1991).


[24] Wooden, D. H. et al. Airborne spectrophotometry of SN 1987A from 1.7 to 12.6 microns

     - Time history of the dust continuum and line emission. Astrophys. J. Supp. 88, 477–507

     (1993).

                                               11
Supplementary Information


Supplementary information accompanies this paper.


Acknowledgments


This work was supported by the Swedish Research Council and the Swedish National Space Board.

Support for the HST observing program was provided by NASA through a grant from the Space

Telescope Science Institute, which is operated by the Association of Universities for Research in

Astronomy, Inc.


Author contribution


                                                                 ¨
J.L. carried out the data reduction and analysis together with G.O., P.G., B. L., J.S. and P.C.; C.F.

performed the theoretical modelling together with A.J. and C.K.; J.L. and C.F. wrote the paper.

R.P.K. is PI for the HST/SAINTS collaboration. All authors discussed the results and commented

on the manuscript.


                                                 12
Author information


Reprints and permissions information is available at www.nature.com/reprints. The authors declare

no competing financial interests. Readers are welcome to comment on the online version of this

article at www.nature.com/nature. Correspondence and requests for materials should be directed

to J.L. (josefin.larsson@astro.su.se) or C.F. (claes@astro.su.se).


                                                13
Figures legends


Figure 1: A selection of HST R-band images. The observing dates are 1994-09-24 (a), 2000-11-

13 (b) and 2009-04-29 (c), which correspond to 2770, 5012 and 8101 days after the explosion,

respectively. The horizontal bar in c represents 1 . The circumstellar ring is inclined at an angle

of 45◦ with respect to the line of sight and is approximately 1.3 light years across. The red (inner)

ellipse shows the expanding aperture used for the light curve in Fig. 2. By using an initial semi-

major axis of 0.11 for the observation in 1994 we always follow the bright, central part of the

ejecta without being significantly affected by emission from the circumstellar ring. The white

(outer) ellipse shows the fixed aperture used for one of the light curves in Supplementary Fig. 2.

The R-band emission from the ejecta is dominated by Hα emission with a small contribution from

[Ca I-II] lines, while the B-band (Supplementary Fig. 1) is dominated by H I and Fe I-II lines12, 22.

Note that only the densest, central parts of the ejecta are visible due to the low surface brightness

of the outer parts. In reality, the ejecta extend to the ring, as is evident from the strong interaction

with the ring.


                                                  14
7

                                                      6


                          Flux (10-14 erg cm-2 s-1)
                                                      5

                                                      4

                                                      3

                                                      2

                                                      1

                                                      0
                                                          3,000   4,000     5,000      6,000     7,000   8,000
                                                                       Time after explosion (days)


Figure 2: Light curves of the ejecta in different wavebands. Data points from WFPC2, ACS and

WFC3 are shown as dots, triangles and stars, respectively. Red and blue symbols correspond to

the R- and B-bands. A correction factor has been applied to the ACS and WFC3 fluxes in order to

account for the differences between these instruments and WFPC2. To quantify the contamination

from the brightening circumstellar ring we created detailed models of the ring for a number of dif-

ferent epochs (Supplementary Information, section 1, and Supplementary Figs. 3 and 4). The open

symbols show the ejecta fluxes after the contribution from the ring has been removed. Although

the contamination from the ring increases with time it never exceeds ∼ 20% of the flux from the

ejecta. The statistical errors on the HST fluxes are smaller than the data points and systematic

errors are discussed in the Supplementary Information, section 1. The black squares show the flux

of the [Ca II] λλ7291.5, 7323.9 lines from VLT/UVES (error bars, s.d.). These lines are free from

contamination from the circumstellar ring and the reverse shock. Note the decreasing flux during

the first ∼ 5, 000 days and the increase thereafter, indicating an extra source of energy. A further

indication that the energy source has changed is that the colour, determined from the flux ratio

between the B-and R-bands, changes from a level of ∼ 0.8 up to day 5, 000 to a value close to

∼ 0.6 on day 8, 000.
                                                                              15
7   a                            7   b


                         Band luminosity (1034 erg s-1)
                                                          6   R                            6   B

                                                          5                                5

                                                          4                                4

                                                          3                                3

                                                          2                                2

                                                          1                                1

                                                          0                                0
                                                                  4,000   6,000      8,000         4,000     6,000     8,000
                                                                               Time after explosion (days)


Figure 3: Evolution of the luminosity from the ejecta in the R- and B-bands. The dashed black

                                                                                                              44               44
lines show a model with only radioactive input, mainly from                                                        Ti. The          Ti mass used for the

                                     12
model is 1.4 × 10⁻⁴ M                                     , as determined from a detailed model that takes into account the effects

of scattering and fluorescence of the UV flux, as well as a correction for internal dust (here taken

to have a 50% covering factor of the core inside 2000 km s−1 )23, 24 . The lower dot-dashed lines

show the light curves with no 44 Ti, illustrating the necessity to include this isotope. The red dashed

lines show a model based on a constant fraction of the observed X-ray flux6 , corrected for the

fraction of flux absorbed by the ejecta (Supplementary Fig. 7). The blue solid line shows the sum

of both models. The R- and B-bands contain 5% and 3% of the total bolometric flux, respectively,

and we expect these fractions to remain roughly constant with time. This is because the relative

amount of energy resulting in heating, ionization and excitation will remain nearly constant as long

as the ionization by the X-rays is < 10−2 . It is clear from this figure that there is a transition at
                                   ∼

∼ 5, 000 days from a radioactivity dominated phase to a phase dominated by the X-ray input from

the collision with the ring.


                                                                                      16

Contenu connexe

Tendances

Xray and protostars_in_the_trifid_nebula
Xray and protostars_in_the_trifid_nebulaXray and protostars_in_the_trifid_nebula
Xray and protostars_in_the_trifid_nebulaSérgio Sacani
 
The shadow _of_the_flying_saucer_a_very_low_temperature_for_large_dust_grains
The shadow _of_the_flying_saucer_a_very_low_temperature_for_large_dust_grainsThe shadow _of_the_flying_saucer_a_very_low_temperature_for_large_dust_grains
The shadow _of_the_flying_saucer_a_very_low_temperature_for_large_dust_grainsSérgio Sacani
 
A luminous X-ray outburst from an intermediatemass black hole in an off-centr...
A luminous X-ray outburst from an intermediatemass black hole in an off-centr...A luminous X-ray outburst from an intermediatemass black hole in an off-centr...
A luminous X-ray outburst from an intermediatemass black hole in an off-centr...Sérgio Sacani
 
Observation of Bose–Einstein condensates in an Earth-orbiting research lab
Observation of Bose–Einstein condensates in an Earth-orbiting research labObservation of Bose–Einstein condensates in an Earth-orbiting research lab
Observation of Bose–Einstein condensates in an Earth-orbiting research labSérgio Sacani
 
Flaring from the_supermassive_black_hole_in_mrk335_studied_with_swift_and_nustar
Flaring from the_supermassive_black_hole_in_mrk335_studied_with_swift_and_nustarFlaring from the_supermassive_black_hole_in_mrk335_studied_with_swift_and_nustar
Flaring from the_supermassive_black_hole_in_mrk335_studied_with_swift_and_nustarSérgio Sacani
 
Magnetic interaction of_a_super_cme_with_the_earths_magnetosphere_scenario_fo...
Magnetic interaction of_a_super_cme_with_the_earths_magnetosphere_scenario_fo...Magnetic interaction of_a_super_cme_with_the_earths_magnetosphere_scenario_fo...
Magnetic interaction of_a_super_cme_with_the_earths_magnetosphere_scenario_fo...Sérgio Sacani
 
Bright radio emission_from_an_ultraluminous_stellar_mass_microquasar_in_m31
Bright radio emission_from_an_ultraluminous_stellar_mass_microquasar_in_m31Bright radio emission_from_an_ultraluminous_stellar_mass_microquasar_in_m31
Bright radio emission_from_an_ultraluminous_stellar_mass_microquasar_in_m31Sérgio Sacani
 
Deep chandra observations_of_pictor_a
Deep chandra observations_of_pictor_aDeep chandra observations_of_pictor_a
Deep chandra observations_of_pictor_aSérgio Sacani
 
Exocometary gas in_th_hd_181327_debris_ring
Exocometary gas in_th_hd_181327_debris_ringExocometary gas in_th_hd_181327_debris_ring
Exocometary gas in_th_hd_181327_debris_ringSérgio Sacani
 
Too much pasta_for_pulsars_to_spin_down
Too much pasta_for_pulsars_to_spin_downToo much pasta_for_pulsars_to_spin_down
Too much pasta_for_pulsars_to_spin_downSérgio Sacani
 
Superwind phenomenon in_m82
Superwind phenomenon in_m82Superwind phenomenon in_m82
Superwind phenomenon in_m82Sérgio Sacani
 
The open cluster_ngc6520_and_the_nearby_dark_molecular_cloud_barnard_86
The open cluster_ngc6520_and_the_nearby_dark_molecular_cloud_barnard_86The open cluster_ngc6520_and_the_nearby_dark_molecular_cloud_barnard_86
The open cluster_ngc6520_and_the_nearby_dark_molecular_cloud_barnard_86Sérgio Sacani
 
Distances luminosities and_temperatures_of_the_coldest_known_substelar_objects
Distances luminosities and_temperatures_of_the_coldest_known_substelar_objectsDistances luminosities and_temperatures_of_the_coldest_known_substelar_objects
Distances luminosities and_temperatures_of_the_coldest_known_substelar_objectsSérgio Sacani
 
Probing the jet_base_of_blazar_pks1830211_from_the_chromatic_variability_of_i...
Probing the jet_base_of_blazar_pks1830211_from_the_chromatic_variability_of_i...Probing the jet_base_of_blazar_pks1830211_from_the_chromatic_variability_of_i...
Probing the jet_base_of_blazar_pks1830211_from_the_chromatic_variability_of_i...Sérgio Sacani
 
Puzzling accretion onto_a_black_hole_in_the_ultraluminous_x_ray_source_m101_ulx1
Puzzling accretion onto_a_black_hole_in_the_ultraluminous_x_ray_source_m101_ulx1Puzzling accretion onto_a_black_hole_in_the_ultraluminous_x_ray_source_m101_ulx1
Puzzling accretion onto_a_black_hole_in_the_ultraluminous_x_ray_source_m101_ulx1Sérgio Sacani
 
Spectral and morphological_analysis_of_the_remnant_of_supernova_1987_a_with_a...
Spectral and morphological_analysis_of_the_remnant_of_supernova_1987_a_with_a...Spectral and morphological_analysis_of_the_remnant_of_supernova_1987_a_with_a...
Spectral and morphological_analysis_of_the_remnant_of_supernova_1987_a_with_a...Sérgio Sacani
 
Discovery of powerful gamma ray flares from the crab nebula
Discovery of powerful gamma ray flares from the crab nebulaDiscovery of powerful gamma ray flares from the crab nebula
Discovery of powerful gamma ray flares from the crab nebulaSérgio Sacani
 
Imaging the dust_sublimation_front_of_a_circumbinary_disk
Imaging the dust_sublimation_front_of_a_circumbinary_diskImaging the dust_sublimation_front_of_a_circumbinary_disk
Imaging the dust_sublimation_front_of_a_circumbinary_diskSérgio Sacani
 
Probing the fermi_bubbles_in_ultraviolet_absorption_spectroscopic_signature_o...
Probing the fermi_bubbles_in_ultraviolet_absorption_spectroscopic_signature_o...Probing the fermi_bubbles_in_ultraviolet_absorption_spectroscopic_signature_o...
Probing the fermi_bubbles_in_ultraviolet_absorption_spectroscopic_signature_o...Sérgio Sacani
 

Tendances (20)

Xray and protostars_in_the_trifid_nebula
Xray and protostars_in_the_trifid_nebulaXray and protostars_in_the_trifid_nebula
Xray and protostars_in_the_trifid_nebula
 
The shadow _of_the_flying_saucer_a_very_low_temperature_for_large_dust_grains
The shadow _of_the_flying_saucer_a_very_low_temperature_for_large_dust_grainsThe shadow _of_the_flying_saucer_a_very_low_temperature_for_large_dust_grains
The shadow _of_the_flying_saucer_a_very_low_temperature_for_large_dust_grains
 
A luminous X-ray outburst from an intermediatemass black hole in an off-centr...
A luminous X-ray outburst from an intermediatemass black hole in an off-centr...A luminous X-ray outburst from an intermediatemass black hole in an off-centr...
A luminous X-ray outburst from an intermediatemass black hole in an off-centr...
 
Observation of Bose–Einstein condensates in an Earth-orbiting research lab
Observation of Bose–Einstein condensates in an Earth-orbiting research labObservation of Bose–Einstein condensates in an Earth-orbiting research lab
Observation of Bose–Einstein condensates in an Earth-orbiting research lab
 
Flaring from the_supermassive_black_hole_in_mrk335_studied_with_swift_and_nustar
Flaring from the_supermassive_black_hole_in_mrk335_studied_with_swift_and_nustarFlaring from the_supermassive_black_hole_in_mrk335_studied_with_swift_and_nustar
Flaring from the_supermassive_black_hole_in_mrk335_studied_with_swift_and_nustar
 
Magnetic interaction of_a_super_cme_with_the_earths_magnetosphere_scenario_fo...
Magnetic interaction of_a_super_cme_with_the_earths_magnetosphere_scenario_fo...Magnetic interaction of_a_super_cme_with_the_earths_magnetosphere_scenario_fo...
Magnetic interaction of_a_super_cme_with_the_earths_magnetosphere_scenario_fo...
 
Bright radio emission_from_an_ultraluminous_stellar_mass_microquasar_in_m31
Bright radio emission_from_an_ultraluminous_stellar_mass_microquasar_in_m31Bright radio emission_from_an_ultraluminous_stellar_mass_microquasar_in_m31
Bright radio emission_from_an_ultraluminous_stellar_mass_microquasar_in_m31
 
Deep chandra observations_of_pictor_a
Deep chandra observations_of_pictor_aDeep chandra observations_of_pictor_a
Deep chandra observations_of_pictor_a
 
Exocometary gas in_th_hd_181327_debris_ring
Exocometary gas in_th_hd_181327_debris_ringExocometary gas in_th_hd_181327_debris_ring
Exocometary gas in_th_hd_181327_debris_ring
 
Too much pasta_for_pulsars_to_spin_down
Too much pasta_for_pulsars_to_spin_downToo much pasta_for_pulsars_to_spin_down
Too much pasta_for_pulsars_to_spin_down
 
Aa15425 10
Aa15425 10Aa15425 10
Aa15425 10
 
Superwind phenomenon in_m82
Superwind phenomenon in_m82Superwind phenomenon in_m82
Superwind phenomenon in_m82
 
The open cluster_ngc6520_and_the_nearby_dark_molecular_cloud_barnard_86
The open cluster_ngc6520_and_the_nearby_dark_molecular_cloud_barnard_86The open cluster_ngc6520_and_the_nearby_dark_molecular_cloud_barnard_86
The open cluster_ngc6520_and_the_nearby_dark_molecular_cloud_barnard_86
 
Distances luminosities and_temperatures_of_the_coldest_known_substelar_objects
Distances luminosities and_temperatures_of_the_coldest_known_substelar_objectsDistances luminosities and_temperatures_of_the_coldest_known_substelar_objects
Distances luminosities and_temperatures_of_the_coldest_known_substelar_objects
 
Probing the jet_base_of_blazar_pks1830211_from_the_chromatic_variability_of_i...
Probing the jet_base_of_blazar_pks1830211_from_the_chromatic_variability_of_i...Probing the jet_base_of_blazar_pks1830211_from_the_chromatic_variability_of_i...
Probing the jet_base_of_blazar_pks1830211_from_the_chromatic_variability_of_i...
 
Puzzling accretion onto_a_black_hole_in_the_ultraluminous_x_ray_source_m101_ulx1
Puzzling accretion onto_a_black_hole_in_the_ultraluminous_x_ray_source_m101_ulx1Puzzling accretion onto_a_black_hole_in_the_ultraluminous_x_ray_source_m101_ulx1
Puzzling accretion onto_a_black_hole_in_the_ultraluminous_x_ray_source_m101_ulx1
 
Spectral and morphological_analysis_of_the_remnant_of_supernova_1987_a_with_a...
Spectral and morphological_analysis_of_the_remnant_of_supernova_1987_a_with_a...Spectral and morphological_analysis_of_the_remnant_of_supernova_1987_a_with_a...
Spectral and morphological_analysis_of_the_remnant_of_supernova_1987_a_with_a...
 
Discovery of powerful gamma ray flares from the crab nebula
Discovery of powerful gamma ray flares from the crab nebulaDiscovery of powerful gamma ray flares from the crab nebula
Discovery of powerful gamma ray flares from the crab nebula
 
Imaging the dust_sublimation_front_of_a_circumbinary_disk
Imaging the dust_sublimation_front_of_a_circumbinary_diskImaging the dust_sublimation_front_of_a_circumbinary_disk
Imaging the dust_sublimation_front_of_a_circumbinary_disk
 
Probing the fermi_bubbles_in_ultraviolet_absorption_spectroscopic_signature_o...
Probing the fermi_bubbles_in_ultraviolet_absorption_spectroscopic_signature_o...Probing the fermi_bubbles_in_ultraviolet_absorption_spectroscopic_signature_o...
Probing the fermi_bubbles_in_ultraviolet_absorption_spectroscopic_signature_o...
 

En vedette (20)

Quizzes and assignments
Quizzes and assignmentsQuizzes and assignments
Quizzes and assignments
 
JBM-HH Weekly Gouge May 2, 2014
JBM-HH Weekly Gouge May 2, 2014JBM-HH Weekly Gouge May 2, 2014
JBM-HH Weekly Gouge May 2, 2014
 
Wheel Tracks October 2012
Wheel Tracks October 2012Wheel Tracks October 2012
Wheel Tracks October 2012
 
Ma Huan - ying ya sheng lan
Ma Huan - ying ya sheng lanMa Huan - ying ya sheng lan
Ma Huan - ying ya sheng lan
 
Actividad del agua
Actividad del aguaActividad del agua
Actividad del agua
 
Wedding Book
Wedding BookWedding Book
Wedding Book
 
Umpah pah dupli skalp
Umpah pah  dupli skalpUmpah pah  dupli skalp
Umpah pah dupli skalp
 
Portfolio project
Portfolio project Portfolio project
Portfolio project
 
Nosso Guia de Parcerias
Nosso Guia de Parcerias Nosso Guia de Parcerias
Nosso Guia de Parcerias
 
Perinteisestä Todennäköisyysteoriasta Poikkeava Näkökulma Epävarmuuden Mallin...
Perinteisestä Todennäköisyysteoriasta Poikkeava Näkökulma Epävarmuuden Mallin...Perinteisestä Todennäköisyysteoriasta Poikkeava Näkökulma Epävarmuuden Mallin...
Perinteisestä Todennäköisyysteoriasta Poikkeava Näkökulma Epävarmuuden Mallin...
 
13.Safety & navigation
13.Safety & navigation13.Safety & navigation
13.Safety & navigation
 
Profit Profiler
Profit Profiler Profit Profiler
Profit Profiler
 
History of Synthetic Turf
History of Synthetic TurfHistory of Synthetic Turf
History of Synthetic Turf
 
Lrf Avaliacao Dos Resultados
Lrf Avaliacao Dos ResultadosLrf Avaliacao Dos Resultados
Lrf Avaliacao Dos Resultados
 
Texto história epidemiologia
Texto história epidemiologiaTexto história epidemiologia
Texto história epidemiologia
 
740582main nasa fy14_m&p-4-9-13
740582main nasa fy14_m&p-4-9-13740582main nasa fy14_m&p-4-9-13
740582main nasa fy14_m&p-4-9-13
 
Na R S - KM - ZS 623
Na R S - KM - ZS 623Na R S - KM - ZS 623
Na R S - KM - ZS 623
 
Cicc95
Cicc95Cicc95
Cicc95
 
Actividad del agua
Actividad del aguaActividad del agua
Actividad del agua
 
Research study: (lif)e-portfolio by Lee Ballantyne
Research study: (lif)e-portfolio by Lee Ballantyne Research study: (lif)e-portfolio by Lee Ballantyne
Research study: (lif)e-portfolio by Lee Ballantyne
 

Similaire à X raying the ejecta of supernova 1987 a

A mildly relativistic wide-angle outflow in the neutron-star merger event GW1...
A mildly relativistic wide-angle outflow in the neutron-star merger event GW1...A mildly relativistic wide-angle outflow in the neutron-star merger event GW1...
A mildly relativistic wide-angle outflow in the neutron-star merger event GW1...Sérgio Sacani
 
An elevation of 0.1 light-seconds for the optical jet base in an accreting Ga...
An elevation of 0.1 light-seconds for the optical jet base in an accreting Ga...An elevation of 0.1 light-seconds for the optical jet base in an accreting Ga...
An elevation of 0.1 light-seconds for the optical jet base in an accreting Ga...Sérgio Sacani
 
Galaxy growth in a massive halo in the first billion years of cosmic history
Galaxy growth in a massive halo in the first billion years of cosmic historyGalaxy growth in a massive halo in the first billion years of cosmic history
Galaxy growth in a massive halo in the first billion years of cosmic historySérgio Sacani
 
Assymetries in core_collapse_supernovae_from_maps_of_radioactive_ti_in_cassio...
Assymetries in core_collapse_supernovae_from_maps_of_radioactive_ti_in_cassio...Assymetries in core_collapse_supernovae_from_maps_of_radioactive_ti_in_cassio...
Assymetries in core_collapse_supernovae_from_maps_of_radioactive_ti_in_cassio...Sérgio Sacani
 
Black hole feedback_in_the_luminous_quasar_pds_456
Black hole feedback_in_the_luminous_quasar_pds_456Black hole feedback_in_the_luminous_quasar_pds_456
Black hole feedback_in_the_luminous_quasar_pds_456Sérgio Sacani
 
Eso1437a
Eso1437aEso1437a
Eso1437aGOASA
 
MUSE sneaks a peek at extreme ram-pressure stripping events. I. A kinematic s...
MUSE sneaks a peek at extreme ram-pressure stripping events. I. A kinematic s...MUSE sneaks a peek at extreme ram-pressure stripping events. I. A kinematic s...
MUSE sneaks a peek at extreme ram-pressure stripping events. I. A kinematic s...Sérgio Sacani
 
A precise measurement of the magnetic field in the corona of the black hole b...
A precise measurement of the magnetic field in the corona of the black hole b...A precise measurement of the magnetic field in the corona of the black hole b...
A precise measurement of the magnetic field in the corona of the black hole b...Sérgio Sacani
 
High Energy Astrophysics Dissertation
High Energy Astrophysics DissertationHigh Energy Astrophysics Dissertation
High Energy Astrophysics DissertationAlexander Booth
 
Spectroscopy and thermal modelling of the first interstellar object 1I/2017 U...
Spectroscopy and thermal modelling of the first interstellar object 1I/2017 U...Spectroscopy and thermal modelling of the first interstellar object 1I/2017 U...
Spectroscopy and thermal modelling of the first interstellar object 1I/2017 U...Sérgio Sacani
 
Polarized reflected light from the Spica binary system
Polarized reflected light from the Spica binary systemPolarized reflected light from the Spica binary system
Polarized reflected light from the Spica binary systemSérgio Sacani
 
Multi dimensional simulations_of_the_expanding_supernova_remnant_of_sn1987_a
Multi dimensional simulations_of_the_expanding_supernova_remnant_of_sn1987_aMulti dimensional simulations_of_the_expanding_supernova_remnant_of_sn1987_a
Multi dimensional simulations_of_the_expanding_supernova_remnant_of_sn1987_aSérgio Sacani
 
Swiging between rotation_and_accretion_power_in_a_millisecond_binary_pulsar
Swiging between rotation_and_accretion_power_in_a_millisecond_binary_pulsarSwiging between rotation_and_accretion_power_in_a_millisecond_binary_pulsar
Swiging between rotation_and_accretion_power_in_a_millisecond_binary_pulsarSérgio Sacani
 
Ion cyclotron resonance spectroscopy and photo acoustic spectroscopy
Ion cyclotron resonance spectroscopy and photo acoustic spectroscopyIon cyclotron resonance spectroscopy and photo acoustic spectroscopy
Ion cyclotron resonance spectroscopy and photo acoustic spectroscopymanikanthaTumarada
 
Dense m agnetized_plasma_associated_with_afast_radio_burst
Dense m agnetized_plasma_associated_with_afast_radio_burstDense m agnetized_plasma_associated_with_afast_radio_burst
Dense m agnetized_plasma_associated_with_afast_radio_burstSérgio Sacani
 
A surge of light at the birth of a supernova
A surge of light at the birth of a supernovaA surge of light at the birth of a supernova
A surge of light at the birth of a supernovaSérgio Sacani
 

Similaire à X raying the ejecta of supernova 1987 a (20)

A mildly relativistic wide-angle outflow in the neutron-star merger event GW1...
A mildly relativistic wide-angle outflow in the neutron-star merger event GW1...A mildly relativistic wide-angle outflow in the neutron-star merger event GW1...
A mildly relativistic wide-angle outflow in the neutron-star merger event GW1...
 
An elevation of 0.1 light-seconds for the optical jet base in an accreting Ga...
An elevation of 0.1 light-seconds for the optical jet base in an accreting Ga...An elevation of 0.1 light-seconds for the optical jet base in an accreting Ga...
An elevation of 0.1 light-seconds for the optical jet base in an accreting Ga...
 
Galaxy growth in a massive halo in the first billion years of cosmic history
Galaxy growth in a massive halo in the first billion years of cosmic historyGalaxy growth in a massive halo in the first billion years of cosmic history
Galaxy growth in a massive halo in the first billion years of cosmic history
 
Assymetries in core_collapse_supernovae_from_maps_of_radioactive_ti_in_cassio...
Assymetries in core_collapse_supernovae_from_maps_of_radioactive_ti_in_cassio...Assymetries in core_collapse_supernovae_from_maps_of_radioactive_ti_in_cassio...
Assymetries in core_collapse_supernovae_from_maps_of_radioactive_ti_in_cassio...
 
Black hole feedback_in_the_luminous_quasar_pds_456
Black hole feedback_in_the_luminous_quasar_pds_456Black hole feedback_in_the_luminous_quasar_pds_456
Black hole feedback_in_the_luminous_quasar_pds_456
 
Eso1437a
Eso1437aEso1437a
Eso1437a
 
MUSE sneaks a peek at extreme ram-pressure stripping events. I. A kinematic s...
MUSE sneaks a peek at extreme ram-pressure stripping events. I. A kinematic s...MUSE sneaks a peek at extreme ram-pressure stripping events. I. A kinematic s...
MUSE sneaks a peek at extreme ram-pressure stripping events. I. A kinematic s...
 
Aa17043 11
Aa17043 11Aa17043 11
Aa17043 11
 
A precise measurement of the magnetic field in the corona of the black hole b...
A precise measurement of the magnetic field in the corona of the black hole b...A precise measurement of the magnetic field in the corona of the black hole b...
A precise measurement of the magnetic field in the corona of the black hole b...
 
A precise measurement of the magnetic field in the corona of the black hole b...
A precise measurement of the magnetic field in the corona of the black hole b...A precise measurement of the magnetic field in the corona of the black hole b...
A precise measurement of the magnetic field in the corona of the black hole b...
 
Aa16869 11
Aa16869 11Aa16869 11
Aa16869 11
 
High Energy Astrophysics Dissertation
High Energy Astrophysics DissertationHigh Energy Astrophysics Dissertation
High Energy Astrophysics Dissertation
 
Spectroscopy and thermal modelling of the first interstellar object 1I/2017 U...
Spectroscopy and thermal modelling of the first interstellar object 1I/2017 U...Spectroscopy and thermal modelling of the first interstellar object 1I/2017 U...
Spectroscopy and thermal modelling of the first interstellar object 1I/2017 U...
 
Polarized reflected light from the Spica binary system
Polarized reflected light from the Spica binary systemPolarized reflected light from the Spica binary system
Polarized reflected light from the Spica binary system
 
Multi dimensional simulations_of_the_expanding_supernova_remnant_of_sn1987_a
Multi dimensional simulations_of_the_expanding_supernova_remnant_of_sn1987_aMulti dimensional simulations_of_the_expanding_supernova_remnant_of_sn1987_a
Multi dimensional simulations_of_the_expanding_supernova_remnant_of_sn1987_a
 
Eso1151
Eso1151Eso1151
Eso1151
 
Swiging between rotation_and_accretion_power_in_a_millisecond_binary_pulsar
Swiging between rotation_and_accretion_power_in_a_millisecond_binary_pulsarSwiging between rotation_and_accretion_power_in_a_millisecond_binary_pulsar
Swiging between rotation_and_accretion_power_in_a_millisecond_binary_pulsar
 
Ion cyclotron resonance spectroscopy and photo acoustic spectroscopy
Ion cyclotron resonance spectroscopy and photo acoustic spectroscopyIon cyclotron resonance spectroscopy and photo acoustic spectroscopy
Ion cyclotron resonance spectroscopy and photo acoustic spectroscopy
 
Dense m agnetized_plasma_associated_with_afast_radio_burst
Dense m agnetized_plasma_associated_with_afast_radio_burstDense m agnetized_plasma_associated_with_afast_radio_burst
Dense m agnetized_plasma_associated_with_afast_radio_burst
 
A surge of light at the birth of a supernova
A surge of light at the birth of a supernovaA surge of light at the birth of a supernova
A surge of light at the birth of a supernova
 

Plus de Sérgio Sacani

Formation of low mass protostars and their circumstellar disks
Formation of low mass protostars and their circumstellar disksFormation of low mass protostars and their circumstellar disks
Formation of low mass protostars and their circumstellar disksSérgio Sacani
 
Nightside clouds and disequilibrium chemistry on the hot Jupiter WASP-43b
Nightside clouds and disequilibrium chemistry on the hot Jupiter WASP-43bNightside clouds and disequilibrium chemistry on the hot Jupiter WASP-43b
Nightside clouds and disequilibrium chemistry on the hot Jupiter WASP-43bSérgio Sacani
 
Discovery of an Accretion Streamer and a Slow Wide-angle Outflow around FUOri...
Discovery of an Accretion Streamer and a Slow Wide-angle Outflow around FUOri...Discovery of an Accretion Streamer and a Slow Wide-angle Outflow around FUOri...
Discovery of an Accretion Streamer and a Slow Wide-angle Outflow around FUOri...Sérgio Sacani
 
Disentangling the origin of chemical differences using GHOST
Disentangling the origin of chemical differences using GHOSTDisentangling the origin of chemical differences using GHOST
Disentangling the origin of chemical differences using GHOSTSérgio Sacani
 
All-domain Anomaly Resolution Office U.S. Department of Defense (U) Case: “Eg...
All-domain Anomaly Resolution Office U.S. Department of Defense (U) Case: “Eg...All-domain Anomaly Resolution Office U.S. Department of Defense (U) Case: “Eg...
All-domain Anomaly Resolution Office U.S. Department of Defense (U) Case: “Eg...Sérgio Sacani
 
PossibleEoarcheanRecordsoftheGeomagneticFieldPreservedintheIsuaSupracrustalBe...
PossibleEoarcheanRecordsoftheGeomagneticFieldPreservedintheIsuaSupracrustalBe...PossibleEoarcheanRecordsoftheGeomagneticFieldPreservedintheIsuaSupracrustalBe...
PossibleEoarcheanRecordsoftheGeomagneticFieldPreservedintheIsuaSupracrustalBe...Sérgio Sacani
 
Isotopic evidence of long-lived volcanism on Io
Isotopic evidence of long-lived volcanism on IoIsotopic evidence of long-lived volcanism on Io
Isotopic evidence of long-lived volcanism on IoSérgio Sacani
 
Hubble Asteroid Hunter III. Physical properties of newly found asteroids
Hubble Asteroid Hunter III. Physical properties of newly found asteroidsHubble Asteroid Hunter III. Physical properties of newly found asteroids
Hubble Asteroid Hunter III. Physical properties of newly found asteroidsSérgio Sacani
 
Observational constraints on mergers creating magnetism in massive stars
Observational constraints on mergers creating magnetism in massive starsObservational constraints on mergers creating magnetism in massive stars
Observational constraints on mergers creating magnetism in massive starsSérgio Sacani
 
Observation of Gravitational Waves from the Coalescence of a 2.5–4.5 M⊙ Compa...
Observation of Gravitational Waves from the Coalescence of a 2.5–4.5 M⊙ Compa...Observation of Gravitational Waves from the Coalescence of a 2.5–4.5 M⊙ Compa...
Observation of Gravitational Waves from the Coalescence of a 2.5–4.5 M⊙ Compa...Sérgio Sacani
 
The SAMI Galaxy Sur v ey: galaxy spin is more strongly correlated with stella...
The SAMI Galaxy Sur v ey: galaxy spin is more strongly correlated with stella...The SAMI Galaxy Sur v ey: galaxy spin is more strongly correlated with stella...
The SAMI Galaxy Sur v ey: galaxy spin is more strongly correlated with stella...Sérgio Sacani
 
Is Betelgeuse Really Rotating? Synthetic ALMA Observations of Large-scale Con...
Is Betelgeuse Really Rotating? Synthetic ALMA Observations of Large-scale Con...Is Betelgeuse Really Rotating? Synthetic ALMA Observations of Large-scale Con...
Is Betelgeuse Really Rotating? Synthetic ALMA Observations of Large-scale Con...Sérgio Sacani
 
First Direct Imaging of a Kelvin–Helmholtz Instability by PSP/WISPR
First Direct Imaging of a Kelvin–Helmholtz Instability by PSP/WISPRFirst Direct Imaging of a Kelvin–Helmholtz Instability by PSP/WISPR
First Direct Imaging of a Kelvin–Helmholtz Instability by PSP/WISPRSérgio Sacani
 
The Sun’s differential rotation is controlled by high- latitude baroclinicall...
The Sun’s differential rotation is controlled by high- latitude baroclinicall...The Sun’s differential rotation is controlled by high- latitude baroclinicall...
The Sun’s differential rotation is controlled by high- latitude baroclinicall...Sérgio Sacani
 
Hydrogen Column Density Variability in a Sample of Local Compton-Thin AGN
Hydrogen Column Density Variability in a Sample of Local Compton-Thin AGNHydrogen Column Density Variability in a Sample of Local Compton-Thin AGN
Hydrogen Column Density Variability in a Sample of Local Compton-Thin AGNSérgio Sacani
 
Huygens - Exploring Titan A Mysterious World
Huygens - Exploring Titan A Mysterious WorldHuygens - Exploring Titan A Mysterious World
Huygens - Exploring Titan A Mysterious WorldSérgio Sacani
 
The Radcliffe Wave Of Milk Way is oscillating
The Radcliffe Wave Of Milk Way  is oscillatingThe Radcliffe Wave Of Milk Way  is oscillating
The Radcliffe Wave Of Milk Way is oscillatingSérgio Sacani
 
Thermonuclear explosions on neutron stars reveal the speed of their jets
Thermonuclear explosions on neutron stars reveal the speed of their jetsThermonuclear explosions on neutron stars reveal the speed of their jets
Thermonuclear explosions on neutron stars reveal the speed of their jetsSérgio Sacani
 
Identification of Superclusters and Their Properties in the Sloan Digital Sky...
Identification of Superclusters and Their Properties in the Sloan Digital Sky...Identification of Superclusters and Their Properties in the Sloan Digital Sky...
Identification of Superclusters and Their Properties in the Sloan Digital Sky...Sérgio Sacani
 
Digitized Continuous Magnetic Recordings for the August/September 1859 Storms...
Digitized Continuous Magnetic Recordings for the August/September 1859 Storms...Digitized Continuous Magnetic Recordings for the August/September 1859 Storms...
Digitized Continuous Magnetic Recordings for the August/September 1859 Storms...Sérgio Sacani
 

Plus de Sérgio Sacani (20)

Formation of low mass protostars and their circumstellar disks
Formation of low mass protostars and their circumstellar disksFormation of low mass protostars and their circumstellar disks
Formation of low mass protostars and their circumstellar disks
 
Nightside clouds and disequilibrium chemistry on the hot Jupiter WASP-43b
Nightside clouds and disequilibrium chemistry on the hot Jupiter WASP-43bNightside clouds and disequilibrium chemistry on the hot Jupiter WASP-43b
Nightside clouds and disequilibrium chemistry on the hot Jupiter WASP-43b
 
Discovery of an Accretion Streamer and a Slow Wide-angle Outflow around FUOri...
Discovery of an Accretion Streamer and a Slow Wide-angle Outflow around FUOri...Discovery of an Accretion Streamer and a Slow Wide-angle Outflow around FUOri...
Discovery of an Accretion Streamer and a Slow Wide-angle Outflow around FUOri...
 
Disentangling the origin of chemical differences using GHOST
Disentangling the origin of chemical differences using GHOSTDisentangling the origin of chemical differences using GHOST
Disentangling the origin of chemical differences using GHOST
 
All-domain Anomaly Resolution Office U.S. Department of Defense (U) Case: “Eg...
All-domain Anomaly Resolution Office U.S. Department of Defense (U) Case: “Eg...All-domain Anomaly Resolution Office U.S. Department of Defense (U) Case: “Eg...
All-domain Anomaly Resolution Office U.S. Department of Defense (U) Case: “Eg...
 
PossibleEoarcheanRecordsoftheGeomagneticFieldPreservedintheIsuaSupracrustalBe...
PossibleEoarcheanRecordsoftheGeomagneticFieldPreservedintheIsuaSupracrustalBe...PossibleEoarcheanRecordsoftheGeomagneticFieldPreservedintheIsuaSupracrustalBe...
PossibleEoarcheanRecordsoftheGeomagneticFieldPreservedintheIsuaSupracrustalBe...
 
Isotopic evidence of long-lived volcanism on Io
Isotopic evidence of long-lived volcanism on IoIsotopic evidence of long-lived volcanism on Io
Isotopic evidence of long-lived volcanism on Io
 
Hubble Asteroid Hunter III. Physical properties of newly found asteroids
Hubble Asteroid Hunter III. Physical properties of newly found asteroidsHubble Asteroid Hunter III. Physical properties of newly found asteroids
Hubble Asteroid Hunter III. Physical properties of newly found asteroids
 
Observational constraints on mergers creating magnetism in massive stars
Observational constraints on mergers creating magnetism in massive starsObservational constraints on mergers creating magnetism in massive stars
Observational constraints on mergers creating magnetism in massive stars
 
Observation of Gravitational Waves from the Coalescence of a 2.5–4.5 M⊙ Compa...
Observation of Gravitational Waves from the Coalescence of a 2.5–4.5 M⊙ Compa...Observation of Gravitational Waves from the Coalescence of a 2.5–4.5 M⊙ Compa...
Observation of Gravitational Waves from the Coalescence of a 2.5–4.5 M⊙ Compa...
 
The SAMI Galaxy Sur v ey: galaxy spin is more strongly correlated with stella...
The SAMI Galaxy Sur v ey: galaxy spin is more strongly correlated with stella...The SAMI Galaxy Sur v ey: galaxy spin is more strongly correlated with stella...
The SAMI Galaxy Sur v ey: galaxy spin is more strongly correlated with stella...
 
Is Betelgeuse Really Rotating? Synthetic ALMA Observations of Large-scale Con...
Is Betelgeuse Really Rotating? Synthetic ALMA Observations of Large-scale Con...Is Betelgeuse Really Rotating? Synthetic ALMA Observations of Large-scale Con...
Is Betelgeuse Really Rotating? Synthetic ALMA Observations of Large-scale Con...
 
First Direct Imaging of a Kelvin–Helmholtz Instability by PSP/WISPR
First Direct Imaging of a Kelvin–Helmholtz Instability by PSP/WISPRFirst Direct Imaging of a Kelvin–Helmholtz Instability by PSP/WISPR
First Direct Imaging of a Kelvin–Helmholtz Instability by PSP/WISPR
 
The Sun’s differential rotation is controlled by high- latitude baroclinicall...
The Sun’s differential rotation is controlled by high- latitude baroclinicall...The Sun’s differential rotation is controlled by high- latitude baroclinicall...
The Sun’s differential rotation is controlled by high- latitude baroclinicall...
 
Hydrogen Column Density Variability in a Sample of Local Compton-Thin AGN
Hydrogen Column Density Variability in a Sample of Local Compton-Thin AGNHydrogen Column Density Variability in a Sample of Local Compton-Thin AGN
Hydrogen Column Density Variability in a Sample of Local Compton-Thin AGN
 
Huygens - Exploring Titan A Mysterious World
Huygens - Exploring Titan A Mysterious WorldHuygens - Exploring Titan A Mysterious World
Huygens - Exploring Titan A Mysterious World
 
The Radcliffe Wave Of Milk Way is oscillating
The Radcliffe Wave Of Milk Way  is oscillatingThe Radcliffe Wave Of Milk Way  is oscillating
The Radcliffe Wave Of Milk Way is oscillating
 
Thermonuclear explosions on neutron stars reveal the speed of their jets
Thermonuclear explosions on neutron stars reveal the speed of their jetsThermonuclear explosions on neutron stars reveal the speed of their jets
Thermonuclear explosions on neutron stars reveal the speed of their jets
 
Identification of Superclusters and Their Properties in the Sloan Digital Sky...
Identification of Superclusters and Their Properties in the Sloan Digital Sky...Identification of Superclusters and Their Properties in the Sloan Digital Sky...
Identification of Superclusters and Their Properties in the Sloan Digital Sky...
 
Digitized Continuous Magnetic Recordings for the August/September 1859 Storms...
Digitized Continuous Magnetic Recordings for the August/September 1859 Storms...Digitized Continuous Magnetic Recordings for the August/September 1859 Storms...
Digitized Continuous Magnetic Recordings for the August/September 1859 Storms...
 

X raying the ejecta of supernova 1987 a

  • 1. X-raying the ejecta of Supernova 1987A ¨ J. Larsson1 , C. Fransson1 , G. Ostlin1, P. Gr¨ ningsson1, A. Jerkstrand1 , C. Kozma1, J. Sollerman1 , o P. Challis2 , R. P. Kirshner2 , R. A. Chevalier3 , K. Heng4 , R. McCray5 , N. B. Suntzeff6 , P. Bouchet7 , A. Crotts8 , J. Danziger9 , E. Dwek10 , K. France11 , P. M. Garnavich12 , S. S. Lawrence13 , B. Leibundgut14, P. Lundqvist,1 N. Panagia15,16,17 , C. S. J. Pun18 , N. Smith19 , G. Sonneborn10 , L. Wang20 , J. C. Wheeler21 1 Department of Astronomy, The Oskar Klein Centre, Stockholm University, 106 91 Stockholm, Sweden. 2 Harvard-Smithsonian Center for Astrophysics, 60 Garden Street, MS-19, Cambridge, MA 02138, USA. 3 Department of Astronomy, University of Virginia, Charlottesville, VA 22903, USA 4 Eidgen¨ ssische Technische Hochschule Z¨ rich, Institute for Astronomy, Wolfgang-Pauli-Strasse o u 27, CH-8093, Z¨ rich, Switzerland. u 5 JILA, University of Colorado, Boulder, CO 803090-0440, USA. 6 George P. and Cynthia Woods Mitchell Institute for Fundamental Physics and Astronomy, Texas A&M University, Department of Physics and Astronomy, College Station, TX 77843, USA. 7 ´ ´ ´ ´ DSM/IRFU/Service dAstrophysique Commissariat a lEnergie Atomique et aux Energies Alterna- tives, Saclay, Orme des Merisiers, FR 91191 Gif-sur-Yvette, France. 8 Department of Astronomy, Mail Code 5240, Columbia University, 550 West 120th Street, New York, NY 10027, USA. 1
  • 2. 9 Osservatorio Astronomico di Trieste, Via Tiepolo 11, Trieste, Italy. 10 NASA Goddard Space Flight Center, Code 665, Greenbelt, MD 20771, USA. 11 Center for Astrophysics and Space Astronomy, University of Colorado, Boulder, CO 80309, USA. 12 225 Nieuwland Science, University of Notre Dame, Notre Dame, IN 465565670, USA. 13 Department of Physics and Astronomy, Hofstra University, Hempstead, NY 11549, USA. 14 ESO, Karl-Schwarzschild-Strasse 2, 85748 Garching, Germany. 15 Space Telescope Science Institute, 3700 San Martin Drive, Baltimore, MD 21218, USA. 16 INAF-CT, Osservatorio Astrosico di Catania, Via S. Soa 78, I-95123 Catania, Italy. 17 Supernova Limited, OYV #131, Northsound Road, Virgin Gorda, British Virgin Islands. 18 Department of Physics, University of Hong Kong, Pok Fu Lam Road, Hong Kong, China. 19 Steward Observatory, University of Arizona, 933 North Cherry Avenue, Tucson, AZ 85721, USA. 20 Department of Physics and Astronomy, Texas A&M University, College Station, TX 77844242, USA. 21 Department of Astronomy, University of Texas, Austin, TX 787120259, USA. When a massive star explodes as a supernova, substantial amounts of radioactive elements, primarily 56 Ni, 57 Ni and 44 Ti, are produced1 . After the initial flash of light from shock heat- ing, the fading light emitted by the supernova is due to the decay of these elements2 . However, after decades, the energy for a supernova remnant comes from the shock interaction between the ejecta and the surrounding medium3 . The transition to this phase has hitherto not been 2
  • 3. observed: supernovae in the Milky Way are too infrequent to provide a young example, and extragalactic supernovae are generally too faint and too small. Here we report observations that show this transition in the supernova SN 1987A in the Large Magellanic Cloud. From 44 1994 to 2001 the ejecta faded as predicted by radioactive power from Ti. After that, the flux started to increase, reaching a level more than twice as high by the end of 2009. We show that this increase is the result of heat deposited by X-rays produced as the ejecta interacts with the surrounding material. Due to the proximity of SN 1987A (located only 160, 000 light years away), we can study the evolution of the supernova (SN) in great detail. The central ejecta are surrounded by a ring of circumstellar material (Fig. 1) that was shed from the star 20, 000 years before the explosion in 19874 . Since the explosion, the ejecta have been expanding, and now the outer parts of the ejecta are colliding with the ring, causing it to brighten at all wavelengths5–8 . The dense, central part of the ejecta contains most of the mass from the disrupted star and acts as a calorimeter for the energy input to the SN. Here we determine the energy input by tracking the energy output with the Hubble Space Telescope (HST). Because the ejecta are roughly elliptical in projection on the sky we use an elliptical aper- ture to measure the brightness. To monitor a constant mass of expanding material, we allow the measuring aperture to expand linearly with time. The axes of the aperture are therefore three times larger in 2009 than in 1994 (Fig. 1). Using this aperture, we determined the R-and and B-band light curves of the ejecta, as shown in Fig. 2 (see Supplementary Table 1 and Supplementary Infor- 3
  • 4. mation, section 1 for further details of the observations and light curves). Our measurements show that the flux from the ejecta decays during the first ∼ 5, 000 days after the explosion, as expected from radioactive input, but then starts to increase, reaching a level that is 2-3 times higher around day 8, 000 (end of 2009). A new energy source must be present in addition to radioactive decay. Below, we consider a model for the declining phase and then discuss the new energy source that is responsible for the observed increase in flux. The energy input to the declining phase of the light curve after ∼ 1, 500 days is expected to come from positrons produced in the decay of 44 Ti2, 9, 10. To test this we use a model2 with abundances taken from the 14E1 explosion model11 and a 44 Ti mass of 1.4 × 10⁻⁴ M 12 (Sup- plementary Information, section 3). The model is shown in Fig. 3 together with the observed broadband luminosities. The good agreement with the observations up to day 5, 000 confirms that the 44 Ti positrons provide the energy input up to this point. However, after day 5, 000 the model clearly fails to describe the light curve; radioactive decay cannot explain the increase in flux that we observe. One possible origin for the flux increase is the reverse shock that results from the interaction between the ejecta and the H II region inside the ring13–16 . The reverse shock produces strong Lyα and Hα emission, which has increased by a factor of ∼ 1.7 between 2004 and 201016 . Although most of this emission originates close to the ring, there is also a component of projected high- velocity Hα-emission that can be traced to the central parts of the ejecta16 , which would contribute to the flux we measure. To determine the contribution from the reverse shock to our light curves 4
  • 5. we have examined HST STIS spectra from 2004 and 2010 (Supplementary Information, section 2 and Supplementary Fig. 5). The reverse shock can be isolated in the spectra because of its boxy line profile, allowing us to place a limit on its contribution at < 20%. Furthermore, this changes ∼ only marginally between 2004 and 2010, as the expanding measuring aperture remains well inside the area where most of the shock emission is seen. Importantly, an increase in flux is also seen in the [Ca II] λλ7292, 7324 lines between 2000 – 2010 (determined from UVES observations at the ESO/VLT, Fig. 2). These lines have velocities < 5, 000 km s−1 , implying that they originate ∼ in the inner ejecta (the projected ejecta velocity near the edge of the ring is > 7, 000 km s−1 at the ∼ present time). We conclude that the increase in flux occurs primarily in the inner ejecta and cannot be explained by emission from the shock region. We believe that the strong X-ray flux produced in the ring collision is the dominant source of energy input to the ejecta. The X-ray flux from the ring increased by a factor ∼ 3 in the 0.5 – 10 keV band between day 6, 000 and day 8, 0006, similar to what we find for the optical emission from the ejecta. To investigate this, we calculated the fraction of X-rays absorbed by the ejecta from a point source located at the ring, using the partially mixed 14E1 explosion model17. As shown in Supplementary Fig. 6, most of the observed X-ray flux is absorbed in the core region of the ejecta (corresponding to velocities less than 5, 000 km s−1 ), where most of the heavy elements reside. At an energy of ∼ 0.35 keV, which corresponds to the temperature of the dominant component in the X-ray spectrum18 , the fraction of flux absorbed by the ejecta at tyr years can be approximated by 1.6 × 10⁻³ t1.67 (the increase with time is mainly due to the increasing solid angle of the expanding yr ejecta, assumed to be spherical, as seen from the ring). This gives a current-day absorbed X- 5
  • 6. ray luminosity of ∼ 5.0 × 1035 erg s−1 . In this calculation we have neglected the weaker, hard component that contributes to the X-ray spectrum18 . We note that this does not significantly affect the estimate of the absorbed flux, although the hard X-rays may be important due to their larger penetrating power. To model the ejecta light curve produced by input from the X-rays we scaled the observed X-ray flux6 by the fraction absorbed at 0.35 keV, multiplied the resulting flux with a constant (corresponding to the conversion efficiency from X-rays to optical) and added this to the radioactive energy input. Fig. 3 shows the scaled X-ray flux together with the observed light curves. This model follows the general trend of the observed fluxes in both bands, although we note that a more accurate model would need to take into account the detailed shape of the X-ray spectrum and the reprocessing of the X-rays into optical emission. The required conversion efficiency from X-rays to optical emission in our model is 5.0% in the R-band and 3.1% in the B-band. The conversion of X-rays to optical/IR emission is similar to that of the 44 Ti positrons. Both involve degradation of non-thermal electrons to heating, ionization and excitation. For a typical ionization fraction of 10−3 − 10−2 , the expected efficiency of conversion from X-rays to Hα (the dominant line in the R-band) is ∼ 5% (Supplementary Information, section 3). This conversion factor is consistent with the scaling factor we used to model the light curve. Similar arguments apply to the B-band. Furthermore, the density in the core is high enough for the time-scale of recombination to be shorter than the expansion time-scale, ensuring a balance between the energy input and output. 6
  • 7. Other possible explanations for the increase in flux include input from a central pulsar19 , a transition from optically thick to optically thin dust and positron leakage from the Fe-rich regions. We find that input from a pulsar is unlikely for several reasons. In particular, it would be a strange coincidence for the emission from the pulsar to mimic the increasing X-ray flux from the ring interaction. Also, we expect the energy input from a pulsar to be concentrated toward the low- velocity material at the centre of the ejecta, while observations of the Hα and [Ca II] lines show that the increase occurs for velocities up to ∼ 5, 000 km s−1 . We also note that constraints on a point source at the centre of SN 1987A have already been obtained using HST data taken near the minimum of the ejecta light curve20 . A change in the properties of the dust or a transition in the positron deposition process are also unable to quantitatively explain the observed increase in flux (Supplementary Information, section 4). We conclude that SN 1987A has made a transition from a radioactively dominated phase to a phase dominated by the X-ray input from the ring collision. This conclusion has interesting im- plications for the observed morphology. In particular, most of the X-rays are likely to be absorbed at the boundary of the ejecta core, where the density increases rapidly. This may lead to the light from the ejecta being emitted in a ring that is concentrated to the plane of the circumstellar ring. The ’hole’ in the ejecta (Fig. 1), which has become more pronounced since ∼ 2001, may in fact be a result of this, rather than reflect the true density distribution or dust obscuration. The asymmetric morphology seen at velocities < 3, 000 km s−1 in the near-IR [Si I] and [Fe II] lines21 is, however, ∼ likely to be intrinsic to the metal core. By studying future changes in the morphology of the ejecta, we will be able to understand the origin of this asymmetry 7
  • 8. In the future the density of the ejecta will decrease and the fraction of X-rays absorbed will grow (Supplementary Fig. 7). As a result the ionization will increase and a smaller fraction of the X-ray flux will produce line excitation, while a larger fraction will go into heating, leading to an increase in the mid-IR flux and a flattening of the optical light curves. With time the X-rays will also penetrate deeper layers of the ejecta, thereby allowing us to probe the chemical structure of the innermost ejecta. This will be a novel form of X-ray tomography. 8
  • 9. References [1] Woosley, S. E., Heger, A. & Weaver, T. A. The evolution and explosion of massive stars. Reviews of Modern Physics 74, 1015–1071 (2002). [2] Fransson, C. & Kozma, C. Radioactivities and nucleosynthesis in SN 1987A. New Astronomy Review 46, 487–492 (2002). [3] McKee, C. F. in Young Supernova Remnants (eds S. S. Holt & U. Hwang) vol. 565 of Ameri- can Institute of Physics Conference Series, 17–28 (2001). [4] Morris, T. & Podsiadlowski, P. The Triple-Ring Nebula Around SN 1987A: Fingerprint of a Binary Merger. Science 315, 1103–1105 (2007). [5] Gr¨ ningsson, P. et al. Time evolution of the line emission from the inner circumstellar ring o of SN 1987A and its hot spots. Astron. Astrophys. 492, 481–491 (2008). [6] Racusin, J. L. et al. X-ray Evolution of SNR 1987A: The Radial Expansion. Astrophys. J. 703, 1752–1759 (2009). [7] Zanardo, G. et al. Multifrequency Radio Measurements of Supernova 1987A Over 22 Years. Astrophys. J. 710, 1515–1529 (2010). [8] Dwek, E. et al. Five Years of Mid-infrared Evolution of the Remnant of SN 1987A: The Encounter Between the Blast Wave and the Dusty Equatorial Ring. Astrophys. J. 722, 425– 434 (2010). 9
  • 10. [9] Timmes, F. X., Woosley, S. E., Hartmann, D. H. & Hoffman, R. D. The Production of 44 Ti and 60 Co in Supernovae. Astrophys. J. 464, 332–341 (1996). [10] Diehl, R. & Timmes, F. X. Gamma-Ray Line Emission from Radioactive Isotopes in Stars and Galaxies. PASP 110, 637–659 (1998). [11] Shigeyama, T. & Nomoto, K. Theoretical light curve of SN 1987A and mixing of hydrogen and nickel in the ejecta. Astrophys. J. 360, 242–256 (1990). 44 [12] Jerkstrand, A., Fransson, C. & Kozma, C. The Ti-powered spectrum of SN 1987A. As- tron. Astrophys. (in press); preprint at http://arxiv.org/abs/1103.3653 (2011). [13] Michael, E. et al. Hubble Space Telescope Observations of High-Velocity Lyα and Hα Emis- sion from Supernova Remnant 1987A: The Structure and Development of the Reverse Shock. Astrophys. J. 593, 809–830 (2003). [14] Smith, N. et al. The Reverse Shock of SNR 1987A at 18 Years after Outburst. Astrophys. J. 635, L41–L44 (2005). [15] Heng, K. et al. Evolution of the Reverse Shock Emission from SNR 1987A. Astrophys. J. 644, 959–970 (2006). [16] France, K. et al. Observing Supernova 1987A with the Refurbished Hubble Space Telescope. Science 329, 1624–1627 (2010). 10
  • 11. [17] Blinnikov, S., Lundqvist, P., Bartunov, O., Nomoto, K. & Iwamoto, K. Radiation Hydrody- namics of SN 1987A. I. Global Analysis of the Light Curve for the First 4 Months. Astro- phys. J. 532, 1132–1149 (2000). [18] Zhekov, S. A., Park, S., McCray, R., Racusin, J. L. & Burrows, D. N. Evolution of the Chandra CCD spectra of SNR 1987A: probing the reflected-shock picture. Mon. Not. R. As- tron. Soc. 721, 518–529 (2010). [19] Woosley, S. E., Hartmann, D. & Pinto, P. A. Hard emission at late times from SN 1987A. Astrophys. J. 346, 395–404 (1989). [20] Graves, G. J. M. et al. Limits from the Hubble Space Telescope on a Point Source in SN 1987A. Astrophys. J. 629, 944–959 (2005). [21] Kjær, K., Leibundgut, B., Fransson, C., Jerkstrand, A. & Spyromilio, J. The 3-D structure of SN 1987A’s inner ejecta. Astron. Astrophys. 517, A51–A60 (2010). [22] Chugai, N. N., Chevalier, R. A., Kirshner, R. P. & Challis, P. M. Hubble Space Telescope Spectrum of SN 1987A at an Age of 8 Years: Radioactive Luminescence of Cool Gas. As- trophys. J. 483, 925–940 (1997). [23] Lucy, L. B., Danziger, I. J., Gouiffes, C. & Bouchet, P. Dust Condensation in the Ejecta of Supernova 1987A - Part Two. In S. E. Woosley (ed.) Supernovae, 82–94 (1991). [24] Wooden, D. H. et al. Airborne spectrophotometry of SN 1987A from 1.7 to 12.6 microns - Time history of the dust continuum and line emission. Astrophys. J. Supp. 88, 477–507 (1993). 11
  • 12. Supplementary Information Supplementary information accompanies this paper. Acknowledgments This work was supported by the Swedish Research Council and the Swedish National Space Board. Support for the HST observing program was provided by NASA through a grant from the Space Telescope Science Institute, which is operated by the Association of Universities for Research in Astronomy, Inc. Author contribution ¨ J.L. carried out the data reduction and analysis together with G.O., P.G., B. L., J.S. and P.C.; C.F. performed the theoretical modelling together with A.J. and C.K.; J.L. and C.F. wrote the paper. R.P.K. is PI for the HST/SAINTS collaboration. All authors discussed the results and commented on the manuscript. 12
  • 13. Author information Reprints and permissions information is available at www.nature.com/reprints. The authors declare no competing financial interests. Readers are welcome to comment on the online version of this article at www.nature.com/nature. Correspondence and requests for materials should be directed to J.L. (josefin.larsson@astro.su.se) or C.F. (claes@astro.su.se). 13
  • 14. Figures legends Figure 1: A selection of HST R-band images. The observing dates are 1994-09-24 (a), 2000-11- 13 (b) and 2009-04-29 (c), which correspond to 2770, 5012 and 8101 days after the explosion, respectively. The horizontal bar in c represents 1 . The circumstellar ring is inclined at an angle of 45◦ with respect to the line of sight and is approximately 1.3 light years across. The red (inner) ellipse shows the expanding aperture used for the light curve in Fig. 2. By using an initial semi- major axis of 0.11 for the observation in 1994 we always follow the bright, central part of the ejecta without being significantly affected by emission from the circumstellar ring. The white (outer) ellipse shows the fixed aperture used for one of the light curves in Supplementary Fig. 2. The R-band emission from the ejecta is dominated by Hα emission with a small contribution from [Ca I-II] lines, while the B-band (Supplementary Fig. 1) is dominated by H I and Fe I-II lines12, 22. Note that only the densest, central parts of the ejecta are visible due to the low surface brightness of the outer parts. In reality, the ejecta extend to the ring, as is evident from the strong interaction with the ring. 14
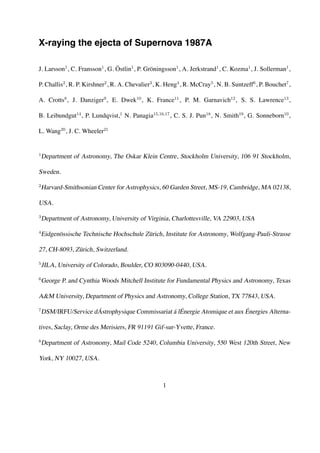
  • 15. 7 6 Flux (10-14 erg cm-2 s-1) 5 4 3 2 1 0 3,000 4,000 5,000 6,000 7,000 8,000 Time after explosion (days) Figure 2: Light curves of the ejecta in different wavebands. Data points from WFPC2, ACS and WFC3 are shown as dots, triangles and stars, respectively. Red and blue symbols correspond to the R- and B-bands. A correction factor has been applied to the ACS and WFC3 fluxes in order to account for the differences between these instruments and WFPC2. To quantify the contamination from the brightening circumstellar ring we created detailed models of the ring for a number of dif- ferent epochs (Supplementary Information, section 1, and Supplementary Figs. 3 and 4). The open symbols show the ejecta fluxes after the contribution from the ring has been removed. Although the contamination from the ring increases with time it never exceeds ∼ 20% of the flux from the ejecta. The statistical errors on the HST fluxes are smaller than the data points and systematic errors are discussed in the Supplementary Information, section 1. The black squares show the flux of the [Ca II] λλ7291.5, 7323.9 lines from VLT/UVES (error bars, s.d.). These lines are free from contamination from the circumstellar ring and the reverse shock. Note the decreasing flux during the first ∼ 5, 000 days and the increase thereafter, indicating an extra source of energy. A further indication that the energy source has changed is that the colour, determined from the flux ratio between the B-and R-bands, changes from a level of ∼ 0.8 up to day 5, 000 to a value close to ∼ 0.6 on day 8, 000. 15
  • 16. 7 a 7 b Band luminosity (1034 erg s-1) 6 R 6 B 5 5 4 4 3 3 2 2 1 1 0 0 4,000 6,000 8,000 4,000 6,000 8,000 Time after explosion (days) Figure 3: Evolution of the luminosity from the ejecta in the R- and B-bands. The dashed black 44 44 lines show a model with only radioactive input, mainly from Ti. The Ti mass used for the 12 model is 1.4 × 10⁻⁴ M , as determined from a detailed model that takes into account the effects of scattering and fluorescence of the UV flux, as well as a correction for internal dust (here taken to have a 50% covering factor of the core inside 2000 km s−1 )23, 24 . The lower dot-dashed lines show the light curves with no 44 Ti, illustrating the necessity to include this isotope. The red dashed lines show a model based on a constant fraction of the observed X-ray flux6 , corrected for the fraction of flux absorbed by the ejecta (Supplementary Fig. 7). The blue solid line shows the sum of both models. The R- and B-bands contain 5% and 3% of the total bolometric flux, respectively, and we expect these fractions to remain roughly constant with time. This is because the relative amount of energy resulting in heating, ionization and excitation will remain nearly constant as long as the ionization by the X-rays is < 10−2 . It is clear from this figure that there is a transition at ∼ ∼ 5, 000 days from a radioactivity dominated phase to a phase dominated by the X-ray input from the collision with the ring. 16