Map Making with QGIS - Part II
•
0 j'aime•734 vues

In Part I of this tutorial (http://scr.bi/L412S2), we looked at how to visualise a shapefile, add styles and query the attributes table. In this part, let us explore how to perform geoprocessing, plot custom data and prepare a map for publishing. By - Sagar Arlekar, Niket Narang

Recommandé
Contenu connexe
En vedette
Similaire à Map Making with QGIS - Part II
Similaire à Map Making with QGIS - Part II (20)
Plus de Sagar Arlekar
Plus de Sagar Arlekar (6)
Dernier
Dernier (15)
Map Making with QGIS - Part II
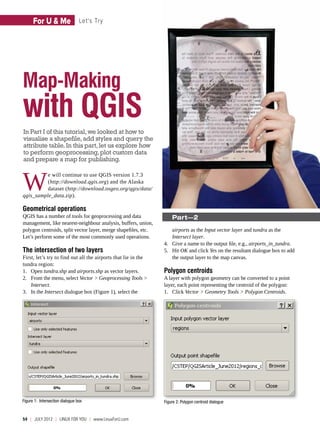
- 1. For U & Me Let's Try Map-Making with QGIS In Part I of this tutorial, we looked at how to visualise a shapefile, add styles and query the attribute table. In this part, let us explore how to perform geoprocessing, plot custom data and prepare a map for publishing. W e will continue to use QGIS version 1.7.3 (http://download.qgis.org) and the Alaska dataset (http://download.osgeo.org/qgis/data/ qgis_sample_data.zip). Geometrical operations QGIS has a number of tools for geoprocessing and data Part—2 management, like nearest-neighbour analysis, buffers, union, polygon centroids, split vector layer, merge shapefiles, etc. airports as the Input vector layer and tundra as the Let’s perform some of the most commonly used operations. Intersect layer. 4. Give a name to the output file, e.g., airports_in_tundra. The intersection of two layers 5. Hit OK and click Yes on the resultant dialogue box to add First, let’s try to find out all the airports that lie in the the output layer to the map canvas. tundra region: 1. Open tundra.shp and airports.shp as vector layers. Polygon centroids 2. From the menu, select Vector > Geoprocessing Tools > A layer with polygon geometry can be converted to a point Intersect. layer, each point representing the centroid of the polygon: 3. In the Intersect dialogue box (Figure 1), select the 1. Click Vector > Geometry Tools > Polygon Centroids. Figure 1: Intersection dialogue box Figure 2: Polygon centroid dialogue 54 | JULY 2012 | LINUX For You | www.LinuxForU.com
- 2. Let's Try For U & Me Figure 3: Split vector layer dialogue Figure 5: New vector layer dialogue Merge shapefiles into one Different shapefiles can be merged into one, provided they are of the same geometry type: 1. Click Vector > Data Management Tools. 2. Tick the check-box ‘Select by layers in the folder’. (See Figure 4.) 3. Browse to the source folder, select majrivers.shp and rivers.shp files. 4. Browse to the target folder and enter the name of the Figure 4: Merge files dialogue shapefile (alaska_rivers_combined.shp). 2. In the dialogue box (Figure 2), select the polygon layer to 5. Mark the ‘Add result to map canvas’ to directly add the be converted (in our case, add regions.shp and select it as result to the map canvas, and click OK. the Input polygon vector layer). 3. Enter the path and name (e.g., regions_centroid) of the Plotting custom features new point file. QGIS allows us to create new layers by plotting geometries 4. Hit OK and click Yes on the resultant dialogue box to add and entering attribute data. In a shapefile, one map layer can the output layer to the map canvas. contain only one type of geometry—point, line or polygon. Now, let’s learn to draw a new point layer by Split vector layer assuming you want to plot sites for new airports. Let this This feature allows you to split a vector file into a number of layer have two attributes: id, name. The id attribute is a separate shapefiles, based on some attribute value: unique identifier—an integer and added by default. 1. Click Vector > Data Management Tools > Split Vector Layer. 1. Go to the menu Layer > New > New Shapefile Layer. 2. Select the Input vector layer (see Figure 3) and the 2. Select Point as the geometry (see Figure 5). attributes to be used to split the layer (in our case, airports 3. In the New attribute section: and the Unique ID field, respectively). i. Add text (e.g., name) to the Name field. 3. Browse to the folder to save output files (ours is airport_ ii. Select Text data from the Type drop-down. split_by_name) and click OK. iii. Set Width to 100. www.LinuxForU.com | LINUX For You | JULY 2012 | 55
- 3. For U & Me Let's Try You will see the new point on the map canvas. For plotting roads, rivers and mountain ranges, you could choose line as the geometry, while polygon geometry is chosen for closed entities like lakes, parks, parcels of land, etc. Map publishing A map ready for publishing should contain the following details: the title, legend, data source, date, projection information, distribution licence, scale, north arrow and information about the creator. Let us now publish a map with the regions, major rivers, and trees layers. The map composer in QGIS provides a canvas to structure the map and add these data fields. ƒƒ Click File > New Print Composer. ƒƒ Use the General tab on the right to modify parameters like the size of the paper, orientation, the quality and Figure 6: Attributes dialogue the grid style. ƒƒ To add a map to the composer, click Layout > Add Map and then draw the canvas in the white area of the screen. The layout will display the layers as seen in the map canvas of the QGIS. ƒƒ Click the Move item content icon to pan across the map. ƒƒ To add a label, click Layout > Add a label. Click on the map canvas where you want to place the label. Use the Item tab on the right to style the text. Elements like the title, publisher’s name, data source and the date of publishing can be added as labels. Other elements like the legend, north arrow and scale- bar can be added using the controls in the menu. These can be styled using the fields on the Item tab. Exporting the map Figure 7: Sample map Click File > Export as image to export the map as an image. The map can also be exported as a PDF or an SVG file. 4. Click the Add to Attribute List button. 5. Click OK. 6. Save the layer as new_airports.shp. By: Sagar Arlekar & Niket Narang 7. Right-click New Airports in the Layers window. The authors are researchers at the Center for Study of Science, 8. Select Toggle Editing on the pop-up. Now you are ready Technology and Policy (CSTEP), Bengaluru. They work in the to plot new points. fields of GIS and Agent-Based Simulation. At CSTEP they have 9. Go to Edit > Capture Point. Click on those places in the built a web-based GIS framework to simulate and visualise disaster impact. They love working with open source tools and map where you want to plot new airports. In the Attributes are active contributors to Openstreetmaps. pop-up (Figure 6), type in the desired values, and hit OK. THE COMPLETE M AGAZINE ON OPEN SOURCE Your favourite Linux Magazine is BETA now on the Web, too. LinuxForU.com Follow us on Twitter@LinuxForYou 56 | JULY 2012 | LINUX For You | www.LinuxForU.com