2. 18-2
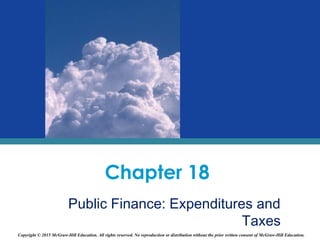
Government and the Circular
Flow
(1) Costs
RESOURCE
MARKET
PRODUCT
MARKET
BUSINESSES HOUSEHOLDS
(4)
Goods and services
(7)
Expenditures
(8)
Resources
(9)
Goods and services
(4)
Goods and services
(10)
Goods and services
Net taxes
(12)
Net taxes
(11)
(3) Consumption expenditures(3) Revenues
GOVERNMENT
(2) Land, labor, capital
Entrepreneurial Ability
(2) Resources
(5) Expenditures (6) Goods and services
LO1
3. 18-3
Government Expenditures
• Government Expenditures
• Government purchases: Purchases of goods and
services by the government
• Defense, Highway construction, NASA
• Transfer payments: Payments to person or firm
that the government does not require any goods
or service in return
• Social security benefits, welfare benefits,
unemployment benefits
LO2
4. 18-4
Federal Tax Revenues
• Personal income tax
• Progressive tax
• Marginal tax rate
• Payroll taxes: Tax levied on employers of
labor equal to a percentage of the wage
• Corporate income tax
• Excise taxes: Tax levied on specific items
• Gasoline tax, cigarette tax, alcohol tax
LO3
7. 18-7
Government Deficit and Surplus
• The government has a balanced budget when
tax revenues equal outlays (expenditures).
• The government has a budget surplus when tax
revenues exceed outlays.
• The government has a budget deficit when
outlays exceed tax revenues.
• The government borrows to finance a budget
deficit and repays its debt when it has a budget
surplus.
LO2
8. 18-8
National Debt
• National debt: The amount of debt outstanding
that arises from past budget deficits.
• National debt clock
• Current U.S. National debt is more than $18
trillion.
LO2
13. 18-13
Apportioning the Tax Burden
• Size, distribution, and impact of the costs that
taxes impose on society
• Benefits-received principle: Those who
receive the benefits of goods and services
provided by the government should pay the
taxes required to finance them.
• Ability-to-pay principle: Those who have
greater income should pay a greater
proportion of it as taxes.
LO6
14. 18-14
Apportioning the Tax Burden
• Progressive tax – average tax rates increase
as income increases
• Regressive tax – average tax rate declines
as income increases
• Proportional tax – average rate stays the
same as income increases
LO6
15. 18-15
Apportioning the Tax Burden
• Applications
• Personal income tax: progressive
• Sales tax: regressive
• Corporate tax: proportional
• Payroll tax: regressive
LO6
16. 18-16
Tax Incidence and Efficiency
Loss
• Tax incidence
• Who really pays the tax, sellers or buyers?
• Tax burden depends on elasticity
• Inelastic vs. elastic
• Efficiency loss
• Excise tax creates deadweight loss
• Transfer of surplus to government
• Efficiency loss depends on elasticity
LO7
17. 18-17
Excise Taxes
• Specific excise tax: Tax levied as a fixed
charge for each unit of product sold.
• Gasoline tax, cigarette tax
• Ad valorem tax: Tax levied as a fraction (%) of
the value of product sold.
• Sales tax
18. 18-18
Price with and without Tax
• When a good is taxed, it has two prices:
• A price that includes the tax
• A price that excludes the tax
• Buyers respond to the price that includes the
tax.
• Sellers respond to the price that excludes the
tax.
19. 18-19
Tax Incidence
• With no tax, the
price is $100 and
5,000 players a
week are bought.
• Buyers pay
$100/unit and
sellers receive and
retain $100/unit.
20. 18-20
Tax Incidence
• The government
taxes on the MP3
players by $10/unit.
• A $10/unit tax shifts
the supply curve up.
• If buyers pay $110
including tax, sellers
retain $100 after tax.
21. 18-21
Tax Incidence
• The buyer’s price rises
to $105—an increase of
$5 a player.
• The seller’s price falls to
$95—a decrease of $5 a
player.
• The quantity decreases
to 2,000 players a week.
• Buyers pay $5 portion
and sellers pay $5
portion of $10/unit tax.
22. 18-22
Efficiency Loss
• Marginal benefit
exceeds marginal
cost.
• Consumer surplus
and Producer surplus
shrink.
• The government
collects its tax
revenue.
• A deadweight loss
arises.
23. 18-23
Elasticity and Tax Incidence
Elastic Demand Inelastic demand
Tax
a
b
c
a
b
0Q2
P1
Q1
P
Pe
Smaller efficiency loss with inelastic demand
St
S
De
Di
c
S
Tax
St
P1
P
Pb
Q2 Q1
Pa
P
LO7
24. 18-24
Elasticity and Tax Incidence
Elastic Supply Inelastic Supply
Smaller efficiency loss with inelastic supply
D D
S
SSt
St
P1
Pa
Pe
P1
Pb
Pi
Q1Q2
Q1Q2
Tax Tax
a
a
bb
c
c
0
P P
0 QQ
LO7
26. 18-26
Probable Incidence of U.S. Taxes
Type of tax Probable Incidence
Personal income
tax
The household or individual on which it is levied
Payroll taxes Workers pay the full tax levied on their earnings and part
of the tax levied on their employers
Corporate income
tax
Short Run: Full tax falls on owners of the businesses
Long Run: Some of the tax may be borne by workers through
lower wages
Sales tax Consumers who buy the taxed products
Specific excise
taxes
Consumers, producers or both, depending on elasticities of supply and
demand
Property Taxes Owners in the case of land and owner-occupied residences,
tenants in the case of rented property, consumers in the
case of business property
LO8
27. 18-27
The U.S. Tax Structure
• The Federal tax system is progressive.
• The state and local tax structures are largely
regressive
• The overall U.S. tax system is progressive
LO8
28. 18-28
Redistribution vs. Recycling
• Distribution of income
• Taxes taken from the rich
• Do they flow to the poor?
• Shows income is transferred to the poor
• Bottom 40% received more government
spending than they paid in taxes
• Top 40% paid more in taxes than they
received in government spending
This chapter addresses the main sources of government revenue and categories of government spending. We discuss and summarize the different philosophies regarding the distribution of a nation’s tax burden. We explain the principles relating to tax shifting, tax incidence, and the efficiency losses caused by taxes. It also discusses how the distribution of income between the rich and poor is affected by government taxes, transfers, and spending.
We integrate government as a decision maker into the circular flow model. Note that government employs resources from the resource market and buys goods and services from the products market. Government then provides goods and services to households and businesses. This is all financed through the net taxes (taxes minus transfer payments) that they receive from households and businesses.
Government purchases are exhaustive and directly absorb resources. The goods and services purchased by the government are a part of GDP. Transfer payments do not contribute to GDP because recipients don’t make any contributions to current GDP. Social security, welfare payments, veterans’ benefits, and unemployment compensation are examples of transfer payments. Government spending and the tax revenues needed to finance it are equivalent to 35% of GDP. The funds used to pay for government purchases and transfers come from taxes, proprietary income, and borrowed funds secured by selling government securities. Government can maintain a high level of spending during a recession by borrowing and creating deficits. The opportunity cost of borrowing during a recession is low because otherwise the funds would have sat idle, but during growth, deficit spending can crowd out private investment.
Personal income taxes are the backbone of the U.S. Federal tax system. A tax is levied on taxable incomes of households and unincorporated businesses after certain deductions. A progressive tax means that higher tax rates are applied to higher brackets of income. Marginal tax rate is the tax rate paid on additional income. Payroll taxes are taxes on wages and income that finance Social Security and Medicare for retirees. The corporate income tax is a tax on a corporation’s profit and for most firms it is 35%. Excise taxes include sales taxes where sales taxes are placed on a large range of goods and services and excise taxes are imposed on specific goods.
These pie charts show the sources of revenues and expenditures for the Federal government, 2012.
In 2009 government purchases declined to 20 percent from 22 percent in 1960, while government transfer payments rose from 5 percent in 1960 to 15.3% in 2012. Total government spending (purchases plus transfers) rose from 27 percent of U.S. GDP in 1960 to about 35 percent in 2012.
Government purchases are exhaustive and directly absorb resources. The goods and services purchased by the government are a part of GDP. Transfer payments do not contribute to GDP because recipients don’t make any contributions to current GDP. Social security, welfare payments, veterans’ benefits, and unemployment compensation are examples of transfer payments. Government spending and the tax revenues needed to finance it are equivalent to 35% of GDP. The funds used to pay for government purchases and transfers come from taxes, proprietary income, and borrowed funds secured by selling government securities. Government can maintain a high level of spending during a recession by borrowing and creating deficits. The opportunity cost of borrowing during a recession is low because otherwise the funds would have sat idle, but during growth, deficit spending can crowd out private investment.
Government purchases are exhaustive and directly absorb resources. The goods and services purchased by the government are a part of GDP. Transfer payments do not contribute to GDP because recipients don’t make any contributions to current GDP. Social security, welfare payments, veterans’ benefits, and unemployment compensation are examples of transfer payments. Government spending and the tax revenues needed to finance it are equivalent to 35% of GDP. The funds used to pay for government purchases and transfers come from taxes, proprietary income, and borrowed funds secured by selling government securities. Government can maintain a high level of spending during a recession by borrowing and creating deficits. The opportunity cost of borrowing during a recession is low because otherwise the funds would have sat idle, but during growth, deficit spending can crowd out private investment.
This table shows the tax revenue or a nation’s “tax burden,” as a percent of GDP for selected industrialized nations.
The pie charts show the sources of revenues and expenditures for the state governments, 2011. State and local governments have different mixes of revenues and expenditures than Federal government, as shown on this slide.
Tax revenues cover less than half of local government expenditures. Grants from federal and state governments make up the rest of the funding. These pie charts show the sources of revenues and expenditures for the local governments, 2010.
Local, state, and Federal government employment represents 16% of the U.S. labor force. The pie charts show the percentages of government employees assigned to different tasks at the Federal, state, and local levels. In 2011, U.S. governments (local, state, and Federal) employed about 21.9 million workers, about 16% of the U.S. labor force.
Taxes are the major source of funding for goods and services provided by government and the wages and salaries paid to government workers. Without taxes, there would be no public and quasi-public goods provided. Who should pay and how much taxes one should pay continue to stir controversy. Some leading philosophical approaches to splitting the tax burden are based on the benefits-received principle and ability-to-pay principle. Based on the benefits-received principle, those who benefit from the taxes should pay for them. This includes taxes on gas to fund highway construction and repair since these are the individuals using the highways. However, this principle becomes much more difficult to apply to things like public education and defense. Imposing taxes based on the ability-to-pay principle means that the taxes are based upon a person’s income and wealth where individuals with greater income/wealth pay more taxes.
Taxes are classified into one of the above categories based upon the relationship between average tax rates and the taxpayer incomes.
Here we show a general application using the tax classification. Personal income taxes are progressive with marginal tax rates rising as incomes increase. A sales tax is regressive relative to income because a larger portion of a low incomes household’s income is paid to sales taxes. Corporate taxes are proportional because they are a flat percentage on income. Payroll taxes are regressive because Social Security tax has a limit where once an individual has reached the income limit, he will no longer have to pay Social Security taxes for the year.
Determining the classification of a particular tax is complicated because those on whom taxes are levied do not always pay the tax. We therefore need an understanding of tax incidence: the degree to which a tax burden falls on a person or group.
This figure contrasts the cases where demand is either relatively elastic or relatively inelastic in the relevant price range, and we can clearly see the difference in the tax burden.
In this figure, we contrast what would happen with a specific demand. The more inelastic the supply, the larger the portion of the tax borne by producers. When supply is elastic, the consumer will pay a larger portion of the tax.
A number of advanced industrial nations rely much more heavily on consumption taxes, sales taxes, specific excise taxes, and value-added taxes, than the United States. A value-added tax, which the United States does not have, applies only to the difference between the value of a firm’s sales and the value of its purchases from other firms. As a percentage of GDP, the highest tax rates on consumption are in countries that have value-added taxes.
This table looks at the probable outcome of taxes on each of the major sources of tax revenue in the United States.
Overall, higher-income groups pay larger percentages of their income as Federal taxes than do lower-income groups.
As a percentage of income, property taxes and sales taxes fall as income rises; and state income taxes are generally less progressive than the Federal income tax.
Higher-income people carry a substantially larger tax burden, as a percentage of their income, than do lower-income people.
The Last Word article was written by two economists from the nonpartisan Tax Foundation. The question they attempt to answer is “Does the government transfer significant amounts of income from the rich to the poor through taxation and spending?” There are concerns that the large taxes government collects merely get recycled back to the rich, but data from 2004 shows that the poor do receive more government spending than they pay in taxes.