This document summarizes two scenarios for providing energy to a facility from gas generation versus the electricity grid. Scenario 1 involves 100% gas generation and Scenario 2 uses 52% gas and 48% electricity. The feasibility of each scenario was evaluated based on various factors such as cost, payback period, environmental impact, and social impact. Scenario 1 has a payback period of 6 months while Scenario 2 is 10 months. Both scenarios result in reductions of CO2 emissions compared to using only the electricity grid.
1. Gas Research:
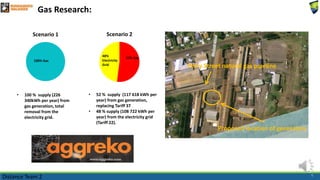
Scenario 1
100% Gas
• 100 % supply (226
340kWh per year) from
gas generation, total
removal from the
electricity grid.
Scenario 2
52% Gas
48%
Electricity
Grid
• 52 % supply (117 618 kWh per
year) from gas generation,
replacing Tariff 37
• 48 % supply (108 722 kWh per
year) from the electricity grid
(Tariff 22).
Perry Street natural gas pipeline
Proposed location of generators
Distance Team 2 1
2. Distance Team 2
Feasibility of the project was determined by:
• Cost
• Payback period
• Energy efficiency
• Life expectancy
• Maintenance
• Installation time
• Environmental impact
• Social impact
• Government grants
2
3. Gas Results: Cost
Scenario 1
Item Cost (over a 4 year period)
Gas Generators, Diesel, Transformers
etc.
30,000 per week (6,240,000 for 4
years)
Commissioning 28,000
Transport and Craneage to site 32,000
Transport and Craneage from site 20,000
Decommissioning 20,000
Earth Works for Pad for generators 62,400
Earth Grid and fencing 12,000
Gas Connection Unknown
HV connection to switch room 50,000
Diesel consumption Minimal – approximately 1000 for 4
years
Gas consumption 1,274,596 for 4 years (318,649 per
year)
Total 7,739,996 for 4 years
Per Year 1,934,999
Comparison of electricity cost per year
Gas Generators, Diesel, Transformers
etc.
Commissioning 20,000
Transport and Craneage to site 22,000
Transport and Craneage from site 16,000
Decommissioning 15,000
Earth Works for Pad for generators 62,400
Earth Grid and fencing 12,000
Gas Connection Unknown
HV connection to switch room 50,000
Diesel consumption 6,056
Gas consumption 920,212 for 4 years (230,053 per
Electricity Consumption Tariff 22 7,047,112 for 4 years (1,761,778 per
Total 12,330,780 for 4 years
Per Year 3,082,697
Electricity Grid Scenario 1 Scenario 2
$3,997,158 $1,934,999 $3,082,697
Scenario 2
Item Cost (over a 4 year period)
20,000 per week (4,160,000 for 4
years)
year)
year)
Price Difference over 4 year period compared to
the electricity grid
Scenario 1: $8,248,636
Scenario 2: $3,657,852
Distance Team 2 3
4. Gas Results:
Comparison of electricity cost per year
Payback period
Electricity Grid Scenario 1 Scenario 2
$3,997,158 $1,934,999 $3,082,697
• Scenario 1: 6 months
• Scenario 2: 10 months
Energy Efficiency
• No improvement in energy reduction
Life expectancy
• Contract period of 4 years
• Potential of 15 -20 years (feasibility influenced by gas prices)
Distance Team 2 4
5. Gas Results: Environmental impact
Current BWEL emissions from electricity consumption
Resource Percentage CO2
Emissions
(kg/MJ)
BWEL amount
(814 824 MJ)
Coal 74% 0.288 173 655 kg of
CO2 emissions
Gas 15% 0.069 8433 kg of CO2
emissions
Renewabl
es
8% 0.005 326 kg of CO2
emissions
Others 3% 0.078 1906 kg of CO2
emissions
Total CO2 Emissions of BWEL Facility
based on electricity consumption
184 320 kg of
CO2 emissions
per year
• BWEL emissions from electricity consumption Scenario 1: 56 222 kg of CO2 emissions per year
BWEL emissions from electricity consumption Scenario 2
Resource Percentage CO2 Emissions (kg/MJ) BWEL amount at (391 400 MJ)
Coal 74% 0.288 83 415 kg of CO2 emissions
Gas 15% 0.069 4050 kg of CO2 emissions
Renewables 8% 0.005 156 kg of CO2 emissions
Others 3% 0.078 915 kg of CO2 emissions
Total CO2 Emissions of BWEL Facility based on electricity consumption
88 536 kg of CO2 emissions per
year
• Scenario 1: emissons reduction of 128 098 kg of CO2 emissions per year
• Scenario 2: emissions reduction of 66 568 kg of CO2 emissions per year
Distance Team 2 5
6. Gas Results:
Social impact
• Minimal
• Designated area for installation is within the BWEL boundary
• Noise output level of 73 dB from 15 metres away
Government grants
• Nil
• The Queensland Gas Scheme finished on 31 December 2013
Distance Team 2 6
7. Research revealed:
• Gas – uncertainty of gas line connection from gas authority
• Diesel – suitable with environmental disadvantages
• Solar – unable to supply infrequent peak demand of tariff 37
• Wind – Land zoning issues combined with social impact
• Hybrid – Battery storage capability required too expensive
• Waste Heat extraction – Only increases efficiency of furnace, minimal
energy reduction/replacement
• Millaquin mill – Not enough fuel supply (bagasse)
Distance Team 2 7
8. Distance Team 2 determined the most suitable application to
be: cope;
• Diesel Generation
• Not a renewable energy, but suits the proposed requirements
for the BWEL energy demand
• Future improvements may prove the Hybrid system to be of
greater economical advantage
Distance Team 2 8
Notes de l'éditeur
Investigation revealed that a natural gas pipeline exists just outside of the BWEL boundary. Research revealed unpredictability of gas prices which lead Distance Team 2 to investigate the option of renting the required generation equipment. The company approach for the rental solution was aggreko.
2 scenarios were investigated. Scenario one involved 100% gas supply while scenario 2 involved an almost even split of gas generation and electricity from the grid.
Significant cost reductions were estimated from both scenario 1 & 2
Payback periods were estimated to be minimal
With no improvements of energy efficiency
Over a 4 year Contract period.
Gas generation shows definite reductions in emissions from energy consumption
Social impact would be minimal with no government grants applicable
The most suitable application was determined to be diesel generation.
Distance team 2 believes future improvements in battery capabilities may prove hybrid systems to be of greater advantage than stand alone diesel systems.