SlideShare une entreprise Scribd logo
1  sur  26
4.1Gender of the respondents
S.no Options No of the
respondents
percentage
1 Male 31 31%
2 Female 69 69%
Total 100 100
Interpretation
The above table indicates that 31% of the respondents are male and 69% of the
respondents are female.
0%
10%
20%
30%
40%
50%
60%
70%
Male female
31%
69%
Nooftherespondents
Gender
gender of the respondents
4.1.2 Age of the respondents
S.no Options No of the
respondents
Percentage
1 20-30 69 69%
2 30-40 16 16%
3 40-50 13 13%
4 Above 50 2 2%
Total 100 100
Interpretation
The table shows that 69% of the respondents are belongs to 20-30 Age group and 16% of
the respondents are belongs to 30-40 age group and 13% of the respondents are belongs to 40-
50 age group and 2% of the respondents are belongs to more than 50 age group.
69%
16% 13% 2%
0%
10%
20%
30%
40%
50%
60%
70%
80%
20-30 30-40 40-50 Above 50
Nooftherespondents
Age
Age of the respondents
4.1.3Experience of the respondents
S.no Options No of the
respondents
Percentage
1 1-5 years 63 62%
2 5-10years 20 21%
3 10-15 years 11 10%
4 Above 15years 6 6%
Total 100 100
Interpretation
The table shows that 63% of the respondents have 1-5years of experience and 20%of the
respondents have 5-10 years of experience and 11% of the respondents have 10-15 years of
experience and 6% of the respondents have above 15years of experience.
63%
20%
11% 6%
0
10
20
30
40
50
60
70
1-5 years 5-10years 10-15 years Above 15years
Nooftherespondents
Experience
4.1.4Table showing the satisfied with your position at your department
S.no Options No of the
respondents
Percentage
1 Satisfied 81 81%
2 Dissatisfied 9 9%
3 Minimal
satisfaction
2 2%
TOTAL 100 100
Interpretation
The table shows that 81% of the respondents said that they are satisfied with their position
at their department and 9% of the respondents said that they are dissatisfied with their position at
their department and 2% of the respondents said that they are minimally satisfied with their
position at their department.
81%
9% 2%
0%
10%
20%
30%
40%
50%
60%
70%
80%
90%
Satisfied Dissatisfied Minimal satisfaction
Nooftherespondents
options
position at your depatment
4.1.5Table showing the feel sufficient and appropriate on-the- job performance.
S.no Options No of the
respondents
Percentage
1 Always 45 45%
2 Never 12 12%
3 Some times 26 26%
4 Neutral 15 15%
Total 100 100
Interpretation
The table shows that 45% of the respondents feel that they always receive sufficient and
appropriate on-the-job performance and recognition and 12% of the respondents feel that they
never receive sufficient and appropriate on-the-job performance and recognition and 26% of the
respondents feels that sometimes they receive sufficient and appropriate on-the-job performance
and recognition and 15% the respondents feel neutral.
45%
12%
26%
15%
0%
5%
10%
15%
20%
25%
30%
35%
40%
45%
50%
Always Never Some times Neutral
Nooftherespondents
options
Appropriate job performance
4.16 Table showing the motivated assist department in meeting objectives
S.no Options No of the
respondents
Percentage
1 Motivated 75 75%
2 Not motivated 12 12%
3 Some what motivated 13 13%
Total 100 100
Interpretation
The table shows that 75% of the respondents said that they were motivated to assist their
department in meeting objectives and 12% the respondents said that they were not motivated to
assist their department in meeting its objectives and 13% of the respondents said that they were
somewhat motivated to assist their department in meeting its objectives.
75%
12% 13%
0%
10%
20%
30%
40%
50%
60%
70%
80%
Motivated Not motivated Some what motivated
Nooftherespondents
options
Department meeting its objectives
4.1.7 Table showing the reasons for staying present job
s.no Options No of the
respondents
Percentage
1 Challenging job
assignment
11 11%
2 Salary/benefits/
stability
33 33%
3 Interesting work 37 37%
4 Good boss 9 9%
5 Work
assignments vary
training
4 4%
6 Location is
convenient
5 5%
7 Others 1 1%
Total 100 100
Interpretation
The Table shows that 11% of the respondents stay in their job because of the challenging
assignment of their job. 33% of the respondents stay in their job because of the salary. 37% of
the respondents stay in their job because of their interest in that job. 9% of the respondents stay
in their job because they thought they had good boss. 4% of the respondents stay in their job
because of the job assignments. 5% of the respondents stay in their job because of the location.
1% of the respondents stay in their job with other reasons.
11
33 37
9 4 5 1
0
5
10
15
20
25
30
35
40
Nooftherespondents
options
4.18Table showing the rate current workload
S.no Options No of the
respondents
Percentage
1 Adequate 91 91%
2 Inadequate 9 9%
Total 100 100
Interpretation
The table shows that 91% of the respondents have adequate rate of current work load and
9% of the have inadequate rate of current workload.
91%
9%
0
10
20
30
40
50
60
70
80
90
100
Adequate Inadequate
Nooftherespondents
workload
Rate of current work load
4.19 Table showing the health benefits compare to the health benefits offered other companies
S.no Options No of the
respondents
Percentage
1 Betters 81 81%
2 Similar 11 11%
3 Worse 5 5%
4 N/A 3 3%
Total 100 100
Interpretation
The table above shows 81% of the respondents said that their company provides better
health benefits than other companies. 11% of the respondents said that their company provides
similar health benefits like other companies. 5% of the respondents said that their company
provides worse health benefits compared to other companies. 3% of the respondents stay neutral.
81%
11% 5% 3%
0
20
40
60
80
100
Betters Similar Worse N/A
Nooftherespondents
Health benefits
Health benefits offered other
companies
4.1.10 Table showing the encouraged within my department
S.no Options No of the
respondents
Percentage
1 Strongly Disagree 5 5%
2 Somewhat
dissatisfied
10 10%
3 Neutral 24 24%
4 Somewhat agree 14 14%
5 Strongly agree 47 47%
Total 100 100
Interpretation
The table shows 5% of the respondents strongly disagree with the team work encouragement
within the department. 10% of the respondents somewhat disagree with the team work encouragement
within the department. 24% of the respondents respond with neutral. 14% of the respondents somewhat
agree with the team work encouragement within the department. 47% of the respondents strongly agree
with the team work encouragement within the department.
5% 10%
24%
14%
47%
0
10
20
30
40
50
Strongly
Disagree
Some what
dissatisfied
Neutral Some what
agree
Strongly agree
Nooftherespondents
Team work
Team work encouraged with in my
department
4.1.11 Table showing the encouraged with other departments.
S.no Options No of the
respondents
Percentage
1 Strongly Disagree 9 9%
2 Somewhat
dissatisfied
7 7%
3 Neutral 26 26%
4 Somewhat agree 17 17%
5 Strongly agree 41 41%
Total 100 100
Interpretation
The table shows 9% of the respondents strongly agree with the team work encouragement
with the other department. 7% of the respondents somewhat disagree with the team work
encouragement with the other department. 26% of the respondents stay neutral. 17% of the
respondents somewhat agree with the team work encouragement with the other department. 41%
of the respondents strongly agree with the team work encouragement with the other department
9% 7%
26%
17%
41%
0
5
10
15
20
25
30
35
40
45
Strongly
Disagree
Some what
dissatisfied
Neutral Some what
agree
Strongly agree
Nooftherespondents
team work
Team work encouages other
department
4.1.12Table showing the held accountable for the decision they made
S.no Options No of the
respondents
Percentage
1 Strongly Disagree 6 6%
2 Somewhat
Dissatisfied
3 3%
3 Neutral 35 35%
4 Somewhat agree 17 17%
5 Strongly agree 41 41%
total 100 100
Interpretation
The table shows 6% of the respondents strongly disagree that the team members are held
accountable for the decisions they make. 5% of the respondents somewhat disagree that the team
members are held accountable for the decisions they make. 35% of the respondents stay neutral. 17% of
the respondents somewhat agree that the team members are held accountable for the decisions they make.
41% of the respondents strongly agree that the team members are held accountable for the decisions they
make.
6% 3%
35%
17%
41%
0
5
10
15
20
25
30
35
40
45
Strongly
Disagree
Some what
Dissatisfied
Neutral Some what
agree
Strongly agree
Nooftherespondents
Decision making
Accounting for decision making
4.1.13Table showing the work assignments are distributed fairly
S.no Options No of the
respondents
Percentage
1 Strongly Disagree 7 7%
2 Somewhat
dissatisfied
5 5%
3 Neutral 30 30%
4 Somewhat agree 14 14%
5 Strongly agree 44 44%
Total 100 100
Interpretation
The table above indicates 44% of the respondents strongly agree that the work assignments
are distributed fairly. 30% of the respondents stay neutral. 14% of the respondents somewhat
agree that the work assignments are distributed fairly. 7% of the respondents strongly disagree
that the work assignments are distributed fairly. 5% of the respondent somewhat disagree that the
work assignments are distributed fairly.
7% 5%
30%
14%
44%
0
5
10
15
20
25
30
35
40
45
50
Strongly
Disagree
Some what
dissatisfied
Neutral Some what
agree
Strongly agree
Nooftherespondents
work assignments
Work assignment distribution fairly
4.1.14Table showing to get opinions and ideas of employees
S.no Options No of the
respondents
Percentage
1 Strongly
Disagree
7 7%
2 Somewhat
dissatisfied
8 8%
3 Neutral 25 25%
4 Somewhat agree 27 27%
5 Strongly agree 33 33%
Total 100 100
Interpretation
The table shows that 33% of the respondents strongly agree that sufficient effort is made
to get the opinions and ideas of the employees. 27% of the respondents somewhat agree that
sufficient effort is made to get the opinions and ideas of the employees. 25% of the respondents
stay neutral. 8% of the respondents somewhat disagree that sufficient effort is made to get the
opinions and ideas of the employees. 7% of the respondents strongly disagree that sufficient
effort is made to get the opinions and ideas of the employees.
7% 8%
25%
27%
33%
0
5
10
15
20
25
30
35
Strongly
Disagree
Some what
dissatisfied
Neutral Some what
agree
Strongly agree
Nooftherespondentz
opinions
opinions and ideas of the employees
4.1.15Table showing good alignment between my department and others with whom I need to
Co-ordinate
S.no Options No of the
respondents
Percentage
1 Strongly
Disagree
3 3%
2 Somewhat
dissatisfied
3 3%
3 Neutral 30 30%
4 Somewhat
agree
26 26%
5 Strongly agree 38 38%
Total 100 100
Interpretation
The table shows that 38% of the respondents strongly agree
that there is good alignment between the department and others who are related to the
department. 30% of the respondents stay neutral. 26% of the respondents somewhat agree that
there is good alignment between the department and others who are related to the department.
3% of the respondents strongly disagree that there is good alignment between the department and
others who are related to the department. 3% of the respondents somewhat disagree that there is
good alignment between the department and others who are related to the department
0
10
20
30
40
Strongly
Disagree
Some what
dissatisfied
Neutral Some what
agree
Strongly
agree
3% 3%
30% 26%
38%
Nooftherespondents
Alingment
Alingnment between my department and
others
4.1.16Table showing the factors affect level of motivation towards work
S.no Options No of the
respondents
Percentage
1 Praise and
acknowledgement
19 19%
2 Job security 22 22%
3 Public recognition 49 9%
4 Monetary benefits 8 8%
Total 100 100
Interpretation
The above table shows that 49% of the respondents say that job security affects the level of
motivation towards work. 22% of the respondents say that job security affects the level of motivation
towards work. 19% of the respondents say that praise and acknowledgment affects the level of motivation
towards work. 8% of the respondents say that monetary benefits affect the level of motivation towards the
work.
19% 22%
49%
8%
0
10
20
30
40
50
60
Nooftherespondents
Factors
Factors affecting level of motivation
4.1.17 Table showing the factors de-motivate in doing your work.
S.no Options No of the
respondents
Percentage
1 No opportunities for
learning advancement
13 13%
2 Boredom 6 6%
3 Poor working conditions 9 9%
4 Lack of skills needed for
the job
28 28%
5 Others 45 45%
Total 100 100
Interpretation
The above table shows that 45% of the respondents say that other factors demotivate them in
doing their work. 28% of the respondents say that lack of skills needed for the job demotivate them in
doing their work. 13% of the respondents say that no opportunities for learning advancement demotivate
them in doing their work. 9% stay neutral.6 % of the respondents say that boredom demotivate them in
doing their work.
13% 6% 9%
28%
45%
0
10
20
30
40
50
No
opportunities
for learning
advancement
Boredom Poor working
conditions
Lack of skills
needed for
the job
Others
Nooftherespondents
De-motivate
De-motivate the work
4.1.18 Table showing level of satisfaction in your work
S.no Options No of the
respondents
Percentage
1 More than satisfied 23 23%
2 Satisfied 74 74%
3 Not satisfied 3 3%
Total 100 100
Interpretation
The above table shows that78% of the respondents says that they are satisfied with their work.
23% of the respondents say that they are more than satisfied with their work. 3% of the respondents say
that they are dissatisfied with the work.
23%
74%
3%
0
10
20
30
40
50
60
70
80
More then satisfied Satisfied Not satistifed
Nooftherespondents
Motivation
Level of satisfaction at your work
4.1.19Table showing things that best in your work place
S.no Options No of the
respondents
Percentage
1 People and work
environment
25 25%
2 Challenging and
exciting job
22 22%
3 Flexibility 44 44%
4 Salary 9 9%
Total 100 100
Interpretation
The above table shows that 44% of the respondents say that flexibility is the best things in their
workplace. 25% of the respondents say that people and work environment is the best thing in their
workplace. 22% of the respondents say that challenging and exciting job is the best thing in their
workplace. 9% of the respondents say that salary is the best thing in their work place
25% 22%
44%
9%
0
5
10
15
20
25
30
35
40
45
50
People and work
environment
Challenging and
exciting job
Flexibility Salary
Nooftherespondents
work place
Best in your work place
4.1.20Table showing level of satisfaction with the working culture of the organization
S.no Options No of the
respondents
Percentage
1 Highly
satisfied
12 12%
2 Satisfied 74 74%
3 Average 11 11%
4 Dissatisfied 3 3%
5 Highly
Dissatisfied
6 6%
Total 100 100
Interpretation
The above table shows that 74% of the respondents satisfied with the working culture of the
organization. 12% of the respondents highly satisfied with the working culture of the organization. 11%
of the respondents averagely satisfied with the working culture of the organization. 3% of the respondents
are dissatisfied with working culture of the organization. 6% of the respondents are highly dissatisfied
with working culture of the organization
12%
74%
11% 3% 6%
0
10
20
30
40
50
60
70
80
Highly
satisfied
Satisfied Average Dissatisfied Highly
Dissatisfied
Nooftherespondents
culture
Culture on the organization
4.1.21 Table showing the top management is interested in motivating the employees
S.no Options No of the
respondents
Percentage
1 Strongly agree 10 10%
2 Agree 74 74%
3 Neutral 11 11%
4 Disagree 3 3%
5 Strongly disagree 2 2%
Total 100 100
Interpretation
The table shows that 74% of the respondents agree that management is interested in
motivating the employees , 11% of the respondents are Neutral that management is interested in
motivating the employees, 10% of the respondents are strongly agree that management is
interested in motivating the employees, 3% of the respondents are disagree that management is
interested in motivating the employees, 2% of the respondents are strongly disagree that
management is interested in motivating the employees.
0
20
40
60
80
Strongly
agree
Agree Neutral Disagree Strongly
disagree
10%
74%
11% 3% 2%
Nooftherespondents
management interested in the employees
mangement interested in the
employees
4.1.22Table showing the kind of facilities provided by the organization
S.no Options No of the
respondents
Percentage
1 Residential Facility 11 11%
2 Canteen facility 20 20%
3 School children facility 19 19%
4 All of the above 50 50%
Total 100 100
Interpretation
The tables showing that respondent’s opinion about kind of the facilities are provided by
the all of the above and canteen facility is 20% and school children facility is19% and residential
facility is 11%.
0
10
20
30
40
50
Residential
Facility
Canteen
facility
School
children
facility
All of the
above
11%
20% 19%
50%
Nooftherespondents
Facilities
kind of facilities
4.1.23Table showing the satisfied with the working environment
S.no Options No of the
respondents
Percentage
1 Highly satisfied 14 14%
2 Satisfied 80 80%
3 Can’t say 5 5%
4 Dissatisfied 1 1%
Total 100 100
Interpretation
From the above table there are 80 % of the feels satisfied, 14% of the respondents feels
highly satisfied, 5% of the respondents feels can’t say and 1% of the respondents dissatisfied
with the working environment of the organization.
14%
80%
5% 1%
0
20
40
60
80
100
Highly satisfied Satisfied Can’t say Dissatisfied
Nooftherespondents
working environrment
satisfied with the working
environment
4.1.24Table showing the management to improve work efficiency
S.no Options No of the
respondents
Percentage
1 Highly satisfied 11 11%
2 Satisfied 80 80%
3 Can’t say 3 3%
4 Dissatisfied 6 6%
Total 100 100
Interpretation
From the table we can found that there are 80% of the respondents feel satisfied, 11% of
the respondents feel highly satisfied, 6% of the respondents feel dissatisfied, 3% of the
respondents can’t say with expect from management to improve work efficiency.
0
10
20
30
40
50
60
70
80
Highly
satisfied
Satisfied Can’t say Dissatisfied
11%
80%
3% 6%
Nooftherespondents
work efficiency
To impreove work efficiency
4.1.25Table showing the management involves you in decision making in your department
S.no Options No of the
respondents
Percentage
1 Highly satisfied 11 11%
2 Satisfied 80 80%
3 Can’t say 3 3%
4 Dissatisfied 6 6%
Total 100 100
Interpretation
From the table we can found that there are 80% of the respondents feel satisfied, 11% of
the respondents feel highly satisfied, 6% of the respondents feel dissatisfied, 3% of the
respondents can’t say with expect from management to improve work efficiency.
0
10
20
30
40
50
60
70
80
Highly
satisfied
Satisfied Can’t say Dissatisfied
11%
80%
3% 6%
Nooftherespondents
work efficiency
To impreove work efficiency
4.1.26 Table showing holidays provided to you in a year
S.no Options No of the
respondents
Percentage
1 0-10 58 58%
2 10-20 33 33%
3 20-30 5 5%
4 30-40 4 4%
Total 100 100
Interpretation
From the above the table showing respondent’s opinion about holidays provided 0-10 is
58% and 10-20 is 33% and 20-30 is 5% and 30 -40 is 4%
58%
33%
5% 4%
0
10
20
30
40
50
60
70
0-10 15-20 20-25 Above 30
Nooftherespondents
holidays

Contenu connexe

Similaire à Mm

technology in internet -med.doc
technology in internet -med.doctechnology in internet -med.doc
technology in internet -med.docRamesh Ankathi
 
Chapter 4Data Analysis and presentationIntroduction T.docx
Chapter 4Data Analysis and presentationIntroduction  T.docxChapter 4Data Analysis and presentationIntroduction  T.docx
Chapter 4Data Analysis and presentationIntroduction T.docxchristinemaritza
 
lakshmi project 1.docx
lakshmi project 1.docxlakshmi project 1.docx
lakshmi project 1.docxmanju192075
 
Labour Ligislation- CIA 2.docx
Labour Ligislation- CIA 2.docxLabour Ligislation- CIA 2.docx
Labour Ligislation- CIA 2.docxHarshadaSujith
 
Employee happiness and engagement
Employee happiness and engagementEmployee happiness and engagement
Employee happiness and engagementJessica Gilmore
 
Gallup Q12 index survey
Gallup Q12 index surveyGallup Q12 index survey
Gallup Q12 index surveyTaha Momin
 
Assignment 1 Research GuidelinesStudent`s.docx
Assignment 1 Research GuidelinesStudent`s.docxAssignment 1 Research GuidelinesStudent`s.docx
Assignment 1 Research GuidelinesStudent`s.docxfelicitytaft14745
 
PRESENTATION.pptx
PRESENTATION.pptxPRESENTATION.pptx
PRESENTATION.pptxRjAutnap1
 
Social psychology
Social psychologySocial psychology
Social psychologyDanish Mak
 
A PRESENTATION ON WORKER’S ABSENTEEISM
A PRESENTATION ON  WORKER’S ABSENTEEISM A PRESENTATION ON  WORKER’S ABSENTEEISM
A PRESENTATION ON WORKER’S ABSENTEEISM Gaurav Bhut
 
Chapter iv data analysis and interpretation
Chapter iv data analysis and interpretationChapter iv data analysis and interpretation
Chapter iv data analysis and interpretationanjalatchi
 
Determination and Analysis of Sample size
Determination and Analysis of Sample sizeDetermination and Analysis of Sample size
Determination and Analysis of Sample sizeSudipto Krishna Dutta
 
Statistical Analysis.02.06.2022 (1).pdf
Statistical Analysis.02.06.2022 (1).pdfStatistical Analysis.02.06.2022 (1).pdf
Statistical Analysis.02.06.2022 (1).pdfstatsanjal
 
customer service question in spss
customer service question in spsscustomer service question in spss
customer service question in spssRam Kumar
 

Similaire à Mm (20)

technology in internet -med.doc
technology in internet -med.doctechnology in internet -med.doc
technology in internet -med.doc
 
SM.pptx
SM.pptxSM.pptx
SM.pptx
 
Chapter 4Data Analysis and presentationIntroduction T.docx
Chapter 4Data Analysis and presentationIntroduction  T.docxChapter 4Data Analysis and presentationIntroduction  T.docx
Chapter 4Data Analysis and presentationIntroduction T.docx
 
lakshmi project 1.docx
lakshmi project 1.docxlakshmi project 1.docx
lakshmi project 1.docx
 
ms.pptx
ms.pptxms.pptx
ms.pptx
 
R
RR
R
 
Labour Ligislation- CIA 2.docx
Labour Ligislation- CIA 2.docxLabour Ligislation- CIA 2.docx
Labour Ligislation- CIA 2.docx
 
Bunza
BunzaBunza
Bunza
 
Employee happiness and engagement
Employee happiness and engagementEmployee happiness and engagement
Employee happiness and engagement
 
Gallup Q12 index survey
Gallup Q12 index surveyGallup Q12 index survey
Gallup Q12 index survey
 
Assignment 1 Research GuidelinesStudent`s.docx
Assignment 1 Research GuidelinesStudent`s.docxAssignment 1 Research GuidelinesStudent`s.docx
Assignment 1 Research GuidelinesStudent`s.docx
 
Chart
ChartChart
Chart
 
PRESENTATION.pptx
PRESENTATION.pptxPRESENTATION.pptx
PRESENTATION.pptx
 
Social psychology
Social psychologySocial psychology
Social psychology
 
A PRESENTATION ON WORKER’S ABSENTEEISM
A PRESENTATION ON  WORKER’S ABSENTEEISM A PRESENTATION ON  WORKER’S ABSENTEEISM
A PRESENTATION ON WORKER’S ABSENTEEISM
 
Presentation- Research.pptx
Presentation- Research.pptxPresentation- Research.pptx
Presentation- Research.pptx
 
Chapter iv data analysis and interpretation
Chapter iv data analysis and interpretationChapter iv data analysis and interpretation
Chapter iv data analysis and interpretation
 
Determination and Analysis of Sample size
Determination and Analysis of Sample sizeDetermination and Analysis of Sample size
Determination and Analysis of Sample size
 
Statistical Analysis.02.06.2022 (1).pdf
Statistical Analysis.02.06.2022 (1).pdfStatistical Analysis.02.06.2022 (1).pdf
Statistical Analysis.02.06.2022 (1).pdf
 
customer service question in spss
customer service question in spsscustomer service question in spss
customer service question in spss
 

Dernier

Histor y of HAM Radio presentation slide
Histor y of HAM Radio presentation slideHistor y of HAM Radio presentation slide
Histor y of HAM Radio presentation slidevu2urc
 
Handwritten Text Recognition for manuscripts and early printed texts
Handwritten Text Recognition for manuscripts and early printed textsHandwritten Text Recognition for manuscripts and early printed texts
Handwritten Text Recognition for manuscripts and early printed textsMaria Levchenko
 
How to Troubleshoot Apps for the Modern Connected Worker
How to Troubleshoot Apps for the Modern Connected WorkerHow to Troubleshoot Apps for the Modern Connected Worker
How to Troubleshoot Apps for the Modern Connected WorkerThousandEyes
 
How to convert PDF to text with Nanonets
How to convert PDF to text with NanonetsHow to convert PDF to text with Nanonets
How to convert PDF to text with Nanonetsnaman860154
 
Advantages of Hiring UIUX Design Service Providers for Your Business
Advantages of Hiring UIUX Design Service Providers for Your BusinessAdvantages of Hiring UIUX Design Service Providers for Your Business
Advantages of Hiring UIUX Design Service Providers for Your BusinessPixlogix Infotech
 
Boost PC performance: How more available memory can improve productivity
Boost PC performance: How more available memory can improve productivityBoost PC performance: How more available memory can improve productivity
Boost PC performance: How more available memory can improve productivityPrincipled Technologies
 
08448380779 Call Girls In Diplomatic Enclave Women Seeking Men
08448380779 Call Girls In Diplomatic Enclave Women Seeking Men08448380779 Call Girls In Diplomatic Enclave Women Seeking Men
08448380779 Call Girls In Diplomatic Enclave Women Seeking MenDelhi Call girls
 
Real Time Object Detection Using Open CV
Real Time Object Detection Using Open CVReal Time Object Detection Using Open CV
Real Time Object Detection Using Open CVKhem
 
Scaling API-first – The story of a global engineering organization
Scaling API-first – The story of a global engineering organizationScaling API-first – The story of a global engineering organization
Scaling API-first – The story of a global engineering organizationRadu Cotescu
 
Apidays Singapore 2024 - Building Digital Trust in a Digital Economy by Veron...
Apidays Singapore 2024 - Building Digital Trust in a Digital Economy by Veron...Apidays Singapore 2024 - Building Digital Trust in a Digital Economy by Veron...
Apidays Singapore 2024 - Building Digital Trust in a Digital Economy by Veron...apidays
 
Boost Fertility New Invention Ups Success Rates.pdf
Boost Fertility New Invention Ups Success Rates.pdfBoost Fertility New Invention Ups Success Rates.pdf
Boost Fertility New Invention Ups Success Rates.pdfsudhanshuwaghmare1
 
What Are The Drone Anti-jamming Systems Technology?
What Are The Drone Anti-jamming Systems Technology?What Are The Drone Anti-jamming Systems Technology?
What Are The Drone Anti-jamming Systems Technology?Antenna Manufacturer Coco
 
TrustArc Webinar - Stay Ahead of US State Data Privacy Law Developments
TrustArc Webinar - Stay Ahead of US State Data Privacy Law DevelopmentsTrustArc Webinar - Stay Ahead of US State Data Privacy Law Developments
TrustArc Webinar - Stay Ahead of US State Data Privacy Law DevelopmentsTrustArc
 
Raspberry Pi 5: Challenges and Solutions in Bringing up an OpenGL/Vulkan Driv...
Raspberry Pi 5: Challenges and Solutions in Bringing up an OpenGL/Vulkan Driv...Raspberry Pi 5: Challenges and Solutions in Bringing up an OpenGL/Vulkan Driv...
Raspberry Pi 5: Challenges and Solutions in Bringing up an OpenGL/Vulkan Driv...Igalia
 
04-2024-HHUG-Sales-and-Marketing-Alignment.pptx
04-2024-HHUG-Sales-and-Marketing-Alignment.pptx04-2024-HHUG-Sales-and-Marketing-Alignment.pptx
04-2024-HHUG-Sales-and-Marketing-Alignment.pptxHampshireHUG
 
Axa Assurance Maroc - Insurer Innovation Award 2024
Axa Assurance Maroc - Insurer Innovation Award 2024Axa Assurance Maroc - Insurer Innovation Award 2024
Axa Assurance Maroc - Insurer Innovation Award 2024The Digital Insurer
 
The Codex of Business Writing Software for Real-World Solutions 2.pptx
The Codex of Business Writing Software for Real-World Solutions 2.pptxThe Codex of Business Writing Software for Real-World Solutions 2.pptx
The Codex of Business Writing Software for Real-World Solutions 2.pptxMalak Abu Hammad
 
Mastering MySQL Database Architecture: Deep Dive into MySQL Shell and MySQL R...
Mastering MySQL Database Architecture: Deep Dive into MySQL Shell and MySQL R...Mastering MySQL Database Architecture: Deep Dive into MySQL Shell and MySQL R...
Mastering MySQL Database Architecture: Deep Dive into MySQL Shell and MySQL R...Miguel Araújo
 
Strategies for Unlocking Knowledge Management in Microsoft 365 in the Copilot...
Strategies for Unlocking Knowledge Management in Microsoft 365 in the Copilot...Strategies for Unlocking Knowledge Management in Microsoft 365 in the Copilot...
Strategies for Unlocking Knowledge Management in Microsoft 365 in the Copilot...Drew Madelung
 
2024: Domino Containers - The Next Step. News from the Domino Container commu...
2024: Domino Containers - The Next Step. News from the Domino Container commu...2024: Domino Containers - The Next Step. News from the Domino Container commu...
2024: Domino Containers - The Next Step. News from the Domino Container commu...Martijn de Jong
 

Dernier (20)

Histor y of HAM Radio presentation slide
Histor y of HAM Radio presentation slideHistor y of HAM Radio presentation slide
Histor y of HAM Radio presentation slide
 
Handwritten Text Recognition for manuscripts and early printed texts
Handwritten Text Recognition for manuscripts and early printed textsHandwritten Text Recognition for manuscripts and early printed texts
Handwritten Text Recognition for manuscripts and early printed texts
 
How to Troubleshoot Apps for the Modern Connected Worker
How to Troubleshoot Apps for the Modern Connected WorkerHow to Troubleshoot Apps for the Modern Connected Worker
How to Troubleshoot Apps for the Modern Connected Worker
 
How to convert PDF to text with Nanonets
How to convert PDF to text with NanonetsHow to convert PDF to text with Nanonets
How to convert PDF to text with Nanonets
 
Advantages of Hiring UIUX Design Service Providers for Your Business
Advantages of Hiring UIUX Design Service Providers for Your BusinessAdvantages of Hiring UIUX Design Service Providers for Your Business
Advantages of Hiring UIUX Design Service Providers for Your Business
 
Boost PC performance: How more available memory can improve productivity
Boost PC performance: How more available memory can improve productivityBoost PC performance: How more available memory can improve productivity
Boost PC performance: How more available memory can improve productivity
 
08448380779 Call Girls In Diplomatic Enclave Women Seeking Men
08448380779 Call Girls In Diplomatic Enclave Women Seeking Men08448380779 Call Girls In Diplomatic Enclave Women Seeking Men
08448380779 Call Girls In Diplomatic Enclave Women Seeking Men
 
Real Time Object Detection Using Open CV
Real Time Object Detection Using Open CVReal Time Object Detection Using Open CV
Real Time Object Detection Using Open CV
 
Scaling API-first – The story of a global engineering organization
Scaling API-first – The story of a global engineering organizationScaling API-first – The story of a global engineering organization
Scaling API-first – The story of a global engineering organization
 
Apidays Singapore 2024 - Building Digital Trust in a Digital Economy by Veron...
Apidays Singapore 2024 - Building Digital Trust in a Digital Economy by Veron...Apidays Singapore 2024 - Building Digital Trust in a Digital Economy by Veron...
Apidays Singapore 2024 - Building Digital Trust in a Digital Economy by Veron...
 
Boost Fertility New Invention Ups Success Rates.pdf
Boost Fertility New Invention Ups Success Rates.pdfBoost Fertility New Invention Ups Success Rates.pdf
Boost Fertility New Invention Ups Success Rates.pdf
 
What Are The Drone Anti-jamming Systems Technology?
What Are The Drone Anti-jamming Systems Technology?What Are The Drone Anti-jamming Systems Technology?
What Are The Drone Anti-jamming Systems Technology?
 
TrustArc Webinar - Stay Ahead of US State Data Privacy Law Developments
TrustArc Webinar - Stay Ahead of US State Data Privacy Law DevelopmentsTrustArc Webinar - Stay Ahead of US State Data Privacy Law Developments
TrustArc Webinar - Stay Ahead of US State Data Privacy Law Developments
 
Raspberry Pi 5: Challenges and Solutions in Bringing up an OpenGL/Vulkan Driv...
Raspberry Pi 5: Challenges and Solutions in Bringing up an OpenGL/Vulkan Driv...Raspberry Pi 5: Challenges and Solutions in Bringing up an OpenGL/Vulkan Driv...
Raspberry Pi 5: Challenges and Solutions in Bringing up an OpenGL/Vulkan Driv...
 
04-2024-HHUG-Sales-and-Marketing-Alignment.pptx
04-2024-HHUG-Sales-and-Marketing-Alignment.pptx04-2024-HHUG-Sales-and-Marketing-Alignment.pptx
04-2024-HHUG-Sales-and-Marketing-Alignment.pptx
 
Axa Assurance Maroc - Insurer Innovation Award 2024
Axa Assurance Maroc - Insurer Innovation Award 2024Axa Assurance Maroc - Insurer Innovation Award 2024
Axa Assurance Maroc - Insurer Innovation Award 2024
 
The Codex of Business Writing Software for Real-World Solutions 2.pptx
The Codex of Business Writing Software for Real-World Solutions 2.pptxThe Codex of Business Writing Software for Real-World Solutions 2.pptx
The Codex of Business Writing Software for Real-World Solutions 2.pptx
 
Mastering MySQL Database Architecture: Deep Dive into MySQL Shell and MySQL R...
Mastering MySQL Database Architecture: Deep Dive into MySQL Shell and MySQL R...Mastering MySQL Database Architecture: Deep Dive into MySQL Shell and MySQL R...
Mastering MySQL Database Architecture: Deep Dive into MySQL Shell and MySQL R...
 
Strategies for Unlocking Knowledge Management in Microsoft 365 in the Copilot...
Strategies for Unlocking Knowledge Management in Microsoft 365 in the Copilot...Strategies for Unlocking Knowledge Management in Microsoft 365 in the Copilot...
Strategies for Unlocking Knowledge Management in Microsoft 365 in the Copilot...
 
2024: Domino Containers - The Next Step. News from the Domino Container commu...
2024: Domino Containers - The Next Step. News from the Domino Container commu...2024: Domino Containers - The Next Step. News from the Domino Container commu...
2024: Domino Containers - The Next Step. News from the Domino Container commu...
 

Mm

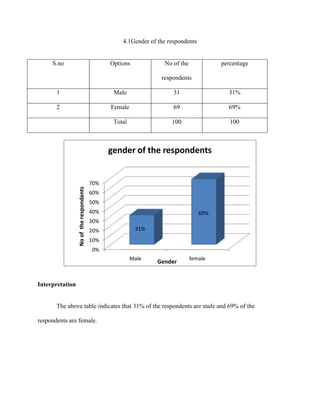
  • 1. 4.1Gender of the respondents S.no Options No of the respondents percentage 1 Male 31 31% 2 Female 69 69% Total 100 100 Interpretation The above table indicates that 31% of the respondents are male and 69% of the respondents are female. 0% 10% 20% 30% 40% 50% 60% 70% Male female 31% 69% Nooftherespondents Gender gender of the respondents
  • 2. 4.1.2 Age of the respondents S.no Options No of the respondents Percentage 1 20-30 69 69% 2 30-40 16 16% 3 40-50 13 13% 4 Above 50 2 2% Total 100 100 Interpretation The table shows that 69% of the respondents are belongs to 20-30 Age group and 16% of the respondents are belongs to 30-40 age group and 13% of the respondents are belongs to 40- 50 age group and 2% of the respondents are belongs to more than 50 age group. 69% 16% 13% 2% 0% 10% 20% 30% 40% 50% 60% 70% 80% 20-30 30-40 40-50 Above 50 Nooftherespondents Age Age of the respondents
  • 3. 4.1.3Experience of the respondents S.no Options No of the respondents Percentage 1 1-5 years 63 62% 2 5-10years 20 21% 3 10-15 years 11 10% 4 Above 15years 6 6% Total 100 100 Interpretation The table shows that 63% of the respondents have 1-5years of experience and 20%of the respondents have 5-10 years of experience and 11% of the respondents have 10-15 years of experience and 6% of the respondents have above 15years of experience. 63% 20% 11% 6% 0 10 20 30 40 50 60 70 1-5 years 5-10years 10-15 years Above 15years Nooftherespondents Experience
  • 4. 4.1.4Table showing the satisfied with your position at your department S.no Options No of the respondents Percentage 1 Satisfied 81 81% 2 Dissatisfied 9 9% 3 Minimal satisfaction 2 2% TOTAL 100 100 Interpretation The table shows that 81% of the respondents said that they are satisfied with their position at their department and 9% of the respondents said that they are dissatisfied with their position at their department and 2% of the respondents said that they are minimally satisfied with their position at their department. 81% 9% 2% 0% 10% 20% 30% 40% 50% 60% 70% 80% 90% Satisfied Dissatisfied Minimal satisfaction Nooftherespondents options position at your depatment
  • 5. 4.1.5Table showing the feel sufficient and appropriate on-the- job performance. S.no Options No of the respondents Percentage 1 Always 45 45% 2 Never 12 12% 3 Some times 26 26% 4 Neutral 15 15% Total 100 100 Interpretation The table shows that 45% of the respondents feel that they always receive sufficient and appropriate on-the-job performance and recognition and 12% of the respondents feel that they never receive sufficient and appropriate on-the-job performance and recognition and 26% of the respondents feels that sometimes they receive sufficient and appropriate on-the-job performance and recognition and 15% the respondents feel neutral. 45% 12% 26% 15% 0% 5% 10% 15% 20% 25% 30% 35% 40% 45% 50% Always Never Some times Neutral Nooftherespondents options Appropriate job performance
  • 6. 4.16 Table showing the motivated assist department in meeting objectives S.no Options No of the respondents Percentage 1 Motivated 75 75% 2 Not motivated 12 12% 3 Some what motivated 13 13% Total 100 100 Interpretation The table shows that 75% of the respondents said that they were motivated to assist their department in meeting objectives and 12% the respondents said that they were not motivated to assist their department in meeting its objectives and 13% of the respondents said that they were somewhat motivated to assist their department in meeting its objectives. 75% 12% 13% 0% 10% 20% 30% 40% 50% 60% 70% 80% Motivated Not motivated Some what motivated Nooftherespondents options Department meeting its objectives
  • 7. 4.1.7 Table showing the reasons for staying present job s.no Options No of the respondents Percentage 1 Challenging job assignment 11 11% 2 Salary/benefits/ stability 33 33% 3 Interesting work 37 37% 4 Good boss 9 9% 5 Work assignments vary training 4 4% 6 Location is convenient 5 5% 7 Others 1 1% Total 100 100 Interpretation The Table shows that 11% of the respondents stay in their job because of the challenging assignment of their job. 33% of the respondents stay in their job because of the salary. 37% of the respondents stay in their job because of their interest in that job. 9% of the respondents stay in their job because they thought they had good boss. 4% of the respondents stay in their job because of the job assignments. 5% of the respondents stay in their job because of the location. 1% of the respondents stay in their job with other reasons. 11 33 37 9 4 5 1 0 5 10 15 20 25 30 35 40 Nooftherespondents options
  • 8. 4.18Table showing the rate current workload S.no Options No of the respondents Percentage 1 Adequate 91 91% 2 Inadequate 9 9% Total 100 100 Interpretation The table shows that 91% of the respondents have adequate rate of current work load and 9% of the have inadequate rate of current workload. 91% 9% 0 10 20 30 40 50 60 70 80 90 100 Adequate Inadequate Nooftherespondents workload Rate of current work load
  • 9. 4.19 Table showing the health benefits compare to the health benefits offered other companies S.no Options No of the respondents Percentage 1 Betters 81 81% 2 Similar 11 11% 3 Worse 5 5% 4 N/A 3 3% Total 100 100 Interpretation The table above shows 81% of the respondents said that their company provides better health benefits than other companies. 11% of the respondents said that their company provides similar health benefits like other companies. 5% of the respondents said that their company provides worse health benefits compared to other companies. 3% of the respondents stay neutral. 81% 11% 5% 3% 0 20 40 60 80 100 Betters Similar Worse N/A Nooftherespondents Health benefits Health benefits offered other companies
  • 10. 4.1.10 Table showing the encouraged within my department S.no Options No of the respondents Percentage 1 Strongly Disagree 5 5% 2 Somewhat dissatisfied 10 10% 3 Neutral 24 24% 4 Somewhat agree 14 14% 5 Strongly agree 47 47% Total 100 100 Interpretation The table shows 5% of the respondents strongly disagree with the team work encouragement within the department. 10% of the respondents somewhat disagree with the team work encouragement within the department. 24% of the respondents respond with neutral. 14% of the respondents somewhat agree with the team work encouragement within the department. 47% of the respondents strongly agree with the team work encouragement within the department. 5% 10% 24% 14% 47% 0 10 20 30 40 50 Strongly Disagree Some what dissatisfied Neutral Some what agree Strongly agree Nooftherespondents Team work Team work encouraged with in my department
  • 11. 4.1.11 Table showing the encouraged with other departments. S.no Options No of the respondents Percentage 1 Strongly Disagree 9 9% 2 Somewhat dissatisfied 7 7% 3 Neutral 26 26% 4 Somewhat agree 17 17% 5 Strongly agree 41 41% Total 100 100 Interpretation The table shows 9% of the respondents strongly agree with the team work encouragement with the other department. 7% of the respondents somewhat disagree with the team work encouragement with the other department. 26% of the respondents stay neutral. 17% of the respondents somewhat agree with the team work encouragement with the other department. 41% of the respondents strongly agree with the team work encouragement with the other department 9% 7% 26% 17% 41% 0 5 10 15 20 25 30 35 40 45 Strongly Disagree Some what dissatisfied Neutral Some what agree Strongly agree Nooftherespondents team work Team work encouages other department
  • 12. 4.1.12Table showing the held accountable for the decision they made S.no Options No of the respondents Percentage 1 Strongly Disagree 6 6% 2 Somewhat Dissatisfied 3 3% 3 Neutral 35 35% 4 Somewhat agree 17 17% 5 Strongly agree 41 41% total 100 100 Interpretation The table shows 6% of the respondents strongly disagree that the team members are held accountable for the decisions they make. 5% of the respondents somewhat disagree that the team members are held accountable for the decisions they make. 35% of the respondents stay neutral. 17% of the respondents somewhat agree that the team members are held accountable for the decisions they make. 41% of the respondents strongly agree that the team members are held accountable for the decisions they make. 6% 3% 35% 17% 41% 0 5 10 15 20 25 30 35 40 45 Strongly Disagree Some what Dissatisfied Neutral Some what agree Strongly agree Nooftherespondents Decision making Accounting for decision making
  • 13. 4.1.13Table showing the work assignments are distributed fairly S.no Options No of the respondents Percentage 1 Strongly Disagree 7 7% 2 Somewhat dissatisfied 5 5% 3 Neutral 30 30% 4 Somewhat agree 14 14% 5 Strongly agree 44 44% Total 100 100 Interpretation The table above indicates 44% of the respondents strongly agree that the work assignments are distributed fairly. 30% of the respondents stay neutral. 14% of the respondents somewhat agree that the work assignments are distributed fairly. 7% of the respondents strongly disagree that the work assignments are distributed fairly. 5% of the respondent somewhat disagree that the work assignments are distributed fairly. 7% 5% 30% 14% 44% 0 5 10 15 20 25 30 35 40 45 50 Strongly Disagree Some what dissatisfied Neutral Some what agree Strongly agree Nooftherespondents work assignments Work assignment distribution fairly
  • 14. 4.1.14Table showing to get opinions and ideas of employees S.no Options No of the respondents Percentage 1 Strongly Disagree 7 7% 2 Somewhat dissatisfied 8 8% 3 Neutral 25 25% 4 Somewhat agree 27 27% 5 Strongly agree 33 33% Total 100 100 Interpretation The table shows that 33% of the respondents strongly agree that sufficient effort is made to get the opinions and ideas of the employees. 27% of the respondents somewhat agree that sufficient effort is made to get the opinions and ideas of the employees. 25% of the respondents stay neutral. 8% of the respondents somewhat disagree that sufficient effort is made to get the opinions and ideas of the employees. 7% of the respondents strongly disagree that sufficient effort is made to get the opinions and ideas of the employees. 7% 8% 25% 27% 33% 0 5 10 15 20 25 30 35 Strongly Disagree Some what dissatisfied Neutral Some what agree Strongly agree Nooftherespondentz opinions opinions and ideas of the employees
  • 15. 4.1.15Table showing good alignment between my department and others with whom I need to Co-ordinate S.no Options No of the respondents Percentage 1 Strongly Disagree 3 3% 2 Somewhat dissatisfied 3 3% 3 Neutral 30 30% 4 Somewhat agree 26 26% 5 Strongly agree 38 38% Total 100 100 Interpretation The table shows that 38% of the respondents strongly agree that there is good alignment between the department and others who are related to the department. 30% of the respondents stay neutral. 26% of the respondents somewhat agree that there is good alignment between the department and others who are related to the department. 3% of the respondents strongly disagree that there is good alignment between the department and others who are related to the department. 3% of the respondents somewhat disagree that there is good alignment between the department and others who are related to the department 0 10 20 30 40 Strongly Disagree Some what dissatisfied Neutral Some what agree Strongly agree 3% 3% 30% 26% 38% Nooftherespondents Alingment Alingnment between my department and others
  • 16. 4.1.16Table showing the factors affect level of motivation towards work S.no Options No of the respondents Percentage 1 Praise and acknowledgement 19 19% 2 Job security 22 22% 3 Public recognition 49 9% 4 Monetary benefits 8 8% Total 100 100 Interpretation The above table shows that 49% of the respondents say that job security affects the level of motivation towards work. 22% of the respondents say that job security affects the level of motivation towards work. 19% of the respondents say that praise and acknowledgment affects the level of motivation towards work. 8% of the respondents say that monetary benefits affect the level of motivation towards the work. 19% 22% 49% 8% 0 10 20 30 40 50 60 Nooftherespondents Factors Factors affecting level of motivation
  • 17. 4.1.17 Table showing the factors de-motivate in doing your work. S.no Options No of the respondents Percentage 1 No opportunities for learning advancement 13 13% 2 Boredom 6 6% 3 Poor working conditions 9 9% 4 Lack of skills needed for the job 28 28% 5 Others 45 45% Total 100 100 Interpretation The above table shows that 45% of the respondents say that other factors demotivate them in doing their work. 28% of the respondents say that lack of skills needed for the job demotivate them in doing their work. 13% of the respondents say that no opportunities for learning advancement demotivate them in doing their work. 9% stay neutral.6 % of the respondents say that boredom demotivate them in doing their work. 13% 6% 9% 28% 45% 0 10 20 30 40 50 No opportunities for learning advancement Boredom Poor working conditions Lack of skills needed for the job Others Nooftherespondents De-motivate De-motivate the work
  • 18. 4.1.18 Table showing level of satisfaction in your work S.no Options No of the respondents Percentage 1 More than satisfied 23 23% 2 Satisfied 74 74% 3 Not satisfied 3 3% Total 100 100 Interpretation The above table shows that78% of the respondents says that they are satisfied with their work. 23% of the respondents say that they are more than satisfied with their work. 3% of the respondents say that they are dissatisfied with the work. 23% 74% 3% 0 10 20 30 40 50 60 70 80 More then satisfied Satisfied Not satistifed Nooftherespondents Motivation Level of satisfaction at your work
  • 19. 4.1.19Table showing things that best in your work place S.no Options No of the respondents Percentage 1 People and work environment 25 25% 2 Challenging and exciting job 22 22% 3 Flexibility 44 44% 4 Salary 9 9% Total 100 100 Interpretation The above table shows that 44% of the respondents say that flexibility is the best things in their workplace. 25% of the respondents say that people and work environment is the best thing in their workplace. 22% of the respondents say that challenging and exciting job is the best thing in their workplace. 9% of the respondents say that salary is the best thing in their work place 25% 22% 44% 9% 0 5 10 15 20 25 30 35 40 45 50 People and work environment Challenging and exciting job Flexibility Salary Nooftherespondents work place Best in your work place
  • 20. 4.1.20Table showing level of satisfaction with the working culture of the organization S.no Options No of the respondents Percentage 1 Highly satisfied 12 12% 2 Satisfied 74 74% 3 Average 11 11% 4 Dissatisfied 3 3% 5 Highly Dissatisfied 6 6% Total 100 100 Interpretation The above table shows that 74% of the respondents satisfied with the working culture of the organization. 12% of the respondents highly satisfied with the working culture of the organization. 11% of the respondents averagely satisfied with the working culture of the organization. 3% of the respondents are dissatisfied with working culture of the organization. 6% of the respondents are highly dissatisfied with working culture of the organization 12% 74% 11% 3% 6% 0 10 20 30 40 50 60 70 80 Highly satisfied Satisfied Average Dissatisfied Highly Dissatisfied Nooftherespondents culture Culture on the organization
  • 21. 4.1.21 Table showing the top management is interested in motivating the employees S.no Options No of the respondents Percentage 1 Strongly agree 10 10% 2 Agree 74 74% 3 Neutral 11 11% 4 Disagree 3 3% 5 Strongly disagree 2 2% Total 100 100 Interpretation The table shows that 74% of the respondents agree that management is interested in motivating the employees , 11% of the respondents are Neutral that management is interested in motivating the employees, 10% of the respondents are strongly agree that management is interested in motivating the employees, 3% of the respondents are disagree that management is interested in motivating the employees, 2% of the respondents are strongly disagree that management is interested in motivating the employees. 0 20 40 60 80 Strongly agree Agree Neutral Disagree Strongly disagree 10% 74% 11% 3% 2% Nooftherespondents management interested in the employees mangement interested in the employees
  • 22. 4.1.22Table showing the kind of facilities provided by the organization S.no Options No of the respondents Percentage 1 Residential Facility 11 11% 2 Canteen facility 20 20% 3 School children facility 19 19% 4 All of the above 50 50% Total 100 100 Interpretation The tables showing that respondent’s opinion about kind of the facilities are provided by the all of the above and canteen facility is 20% and school children facility is19% and residential facility is 11%. 0 10 20 30 40 50 Residential Facility Canteen facility School children facility All of the above 11% 20% 19% 50% Nooftherespondents Facilities kind of facilities
  • 23. 4.1.23Table showing the satisfied with the working environment S.no Options No of the respondents Percentage 1 Highly satisfied 14 14% 2 Satisfied 80 80% 3 Can’t say 5 5% 4 Dissatisfied 1 1% Total 100 100 Interpretation From the above table there are 80 % of the feels satisfied, 14% of the respondents feels highly satisfied, 5% of the respondents feels can’t say and 1% of the respondents dissatisfied with the working environment of the organization. 14% 80% 5% 1% 0 20 40 60 80 100 Highly satisfied Satisfied Can’t say Dissatisfied Nooftherespondents working environrment satisfied with the working environment
  • 24. 4.1.24Table showing the management to improve work efficiency S.no Options No of the respondents Percentage 1 Highly satisfied 11 11% 2 Satisfied 80 80% 3 Can’t say 3 3% 4 Dissatisfied 6 6% Total 100 100 Interpretation From the table we can found that there are 80% of the respondents feel satisfied, 11% of the respondents feel highly satisfied, 6% of the respondents feel dissatisfied, 3% of the respondents can’t say with expect from management to improve work efficiency. 0 10 20 30 40 50 60 70 80 Highly satisfied Satisfied Can’t say Dissatisfied 11% 80% 3% 6% Nooftherespondents work efficiency To impreove work efficiency
  • 25. 4.1.25Table showing the management involves you in decision making in your department S.no Options No of the respondents Percentage 1 Highly satisfied 11 11% 2 Satisfied 80 80% 3 Can’t say 3 3% 4 Dissatisfied 6 6% Total 100 100 Interpretation From the table we can found that there are 80% of the respondents feel satisfied, 11% of the respondents feel highly satisfied, 6% of the respondents feel dissatisfied, 3% of the respondents can’t say with expect from management to improve work efficiency. 0 10 20 30 40 50 60 70 80 Highly satisfied Satisfied Can’t say Dissatisfied 11% 80% 3% 6% Nooftherespondents work efficiency To impreove work efficiency
  • 26. 4.1.26 Table showing holidays provided to you in a year S.no Options No of the respondents Percentage 1 0-10 58 58% 2 10-20 33 33% 3 20-30 5 5% 4 30-40 4 4% Total 100 100 Interpretation From the above the table showing respondent’s opinion about holidays provided 0-10 is 58% and 10-20 is 33% and 20-30 is 5% and 30 -40 is 4% 58% 33% 5% 4% 0 10 20 30 40 50 60 70 0-10 15-20 20-25 Above 30 Nooftherespondents holidays