MEA2010 Poster
- 1. Exploring Granger Causality As A Tool For Understanding
Connectivity In Patterned Networks
Sankaraleengam Alagapan, Liangbin Pan, Eric Franca, Bruce Wheeler, and Thomas DeMarse
J Crayton Pruitt Department of Biomedical Engineering, University of Florida, USA
Introduction Results
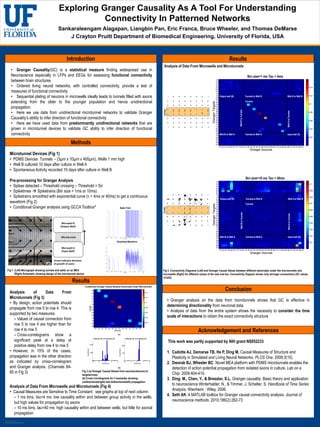
Analysis of Data From Microwells and Microtunnels
• Granger Causality(GC) is a statistical measure finding widespread use in
Neuroscience especially in LFPs and EEGs for assessing functional connectivity Bin size=1 ms Tau = 4ms
between brain structures
• Ordered living neural networks, with controlled connectivity, provide a test of
measures of functional connectivity
• Sequential plating of neurons in microwells ideally leads to tunnels filled with axons Output well (B) Tunnels to Well B Well A to Well B
extending from the older to the younger population and hence unidirectional Tunnels
propagation.
Tunnels
Well B to Tunnels
• Here we use data from unidirectional microtunnel networks to validate Granger
Well A to Tunnels
Causality’s ability to infer direction of functional connectivity
• Here we have used data from predominantly unidirectional networks that are
grown in microtunnel devices to validate GC ability to infer direction of functional
connectivity Well B to Well A Tunnels to Well A Input well (A)
Methods
Microtunnel Devices (Fig 1)
• PDMS Devices Tunnels - (3µm x 10µm x 400µm), Wells 1 mm high
• Well B cultured 10 days after culture in Well A
• Spontaneous Activity recorded 10 days after culture in Well B
Input Well Well to Well
Bin size=10 ms Tau = 40ms
Pre-processing for Granger Analysis
• Spikes detected – Threshold crossing – Threshold = 5σ
• Spiketimes Spiketrains (Bin size = 1ms or 10ms)
• Spiketrains smoothed with exponential curve (τ = 4ms or 40ms) to get a continuous Output well (B) Tunnels to Well B Well A to Well B
waveform (Fig 2) Tunnels
• Conditional Granger analysis using GCCA Toolbox4 Spike Train
Tunnels
Well B to Tunnels
Well A to Tunnels
Microwell B
(Output Well)
Row 4
Microtunnels Well B to Well A Tunnels to Well A Input well (A)
Well to Well
Row 5 Smoothed Waveform
Microwell A
(Input Well)
Arrow indicates direction
100 µm of growth of axons
(a) (b)
Fig 1. (Left) Micrograph showing tunnels and wells on an MEA Fig 4. Connectivity Diagrams (Left) and Granger Causal Values between different electrodes under the microtunnels and
(Right) Schematic showing design of the microtunnel device microwells (Right) for different values of bin size and tau. Connectivity Diagram shows only stronger connections (GC values
>0.025)
Results
Conclusion
Conditional Granger Values Between Electrodes Under Microtunnels
Analysis of Data From
24
25 0.14
Microtunnels (Fig 3) 34
0.12
35
• Granger analysis on the data from microtunnels shows that GC is effective in
• By design, action potentials should 44
0.1
45
determining directionality from neuronal data.
propagate from row 5 to row 4. This is
Target
54 0.08
55
• Analysis of data from the entire system shows the necessity to consider the time
supported by two measures. 64 0.06
65
scale of interactions to obtain the exact connectivity structure
– Values of causal connection from 74
75
0.04
row 5 to row 4 are higher than for
0.02
84
85
row 4 to row 5 24 25 34 35 44 45 54 55 64 65 74 75 84 85
Source
Acknowledgement and References
– Cross-correlograms show a (a)
significant peak at a delay at
Channel_85 to Channel_84 Channel_55 to Channel_54
This work was partly supported by NIH grant NS052233
positive delay from row 4 to row 5 400
200
• However, in 15% of the cases,
Counts/bin
Counts/bin
200 100 1. Cadotte AJ, Demarse TB, He P, Ding M. Causal Measures of Structure and
propagation was in the other direction Plasticity in Simulated and Living Neural Networks. PLOS One. 2008;3(10).
as indicated by cross-correlogram 0
-2 -1 0
Time (ms)
1 2
0
-2 -1 0
Time (ms)
1 2
2. Dworak BJ, Wheeler BC. Novel MEA platform with PDMS microtunnels enables the
and Granger analysis. (Channels 84- (b) detection of action potential propagation from isolated axons in culture. Lab on a
85 in Fig 3) Fig 3 (a) Granger Causal Values from source(columns) to
targets(rows) Chip. 2009:404-410.
(b) Cross Correlograms for 2 examples showing 3. Ding, M., Chen, Y., & Bressler, S.L. Granger causality: Basic theory and application
unidirectional(right) and bidirectional(left) propagation
to neuroscience Winterhalder, N., & Timmer, J. Schelter. S. Handbook of Time Series
Analysis of Data From Microwells and Microtunnels (Fig 4)
Analysis. Wienheim : Wiley, 2006.
• Causal Measures are Sensitive to Time Constant: see graphs at top of next column
4. Seth AK. A MATLAB toolbox for Granger causal connectivity analysis. Journal of
– 1 ms bins, tau=4 ms: low causality within and between group activity in the wells,
neuroscience methods. 2010;186(2):262-73
but high values for propagation by axons
– 10 ms bins, tau=40 ms: high causality within and between wells, but little for axonal
propagation
TEMPLATE DESIGN © 2008
www.PosterPresentations.com