
Recommandé
Contenu connexe
Tendances
Tendances (12)
Similaire à July2010 stats
Similaire à July2010 stats (20)
Dernier
Dernier (20)
July2010 stats
- 1. For Immediate Release Sarasota Association of Realtors® Aug. 11, 2010 For more information contact Kathy Roberts, 941-328-1170 Sarasota real estate market returns to pre-tax credit numbers As expected, property sales in the Sarasota real estate market in July 2010 slowed to pre-tax credit numbers following the expiration of the federal $8,000 homebuyer incentive. Property sales in July 2010 stood at 525 total sales, declining 47.8 percent from the June 2010 figure of 776 sales. The sales figure was much closer to the 506 sales in January 2010 and the 528 sales in February 2010, when the homebuyer credit wasn’t a factor in the market. In July, 374 single family homes were sold, compared to 576 single family homes sold in June 2010. The median price also trended lower at $155,000, compared to June’s figure of $175,000. The figure was more in line with the 12-month rolling median sale price of $162,000. Condo sales in July stood at 151, a drop from last month’s figure of 200. The median price of condos also fell in July to $127,000, which again primarily reflected distressed property sales. Non-distressed condo sales saw a median price of $227,500, while for distressed properties, the median sale price was $73,000 for bank-owned condos and $121,700 for condos involved in short sales. For the last 12 months combined, the median sale price for single family homes was $162,000. For condos, the median price over the last 12 months was $175,000. Pending sales also dropped to 653 - slower than the period during which homebuyers were eligible for tax credits. The March and April pending sales figures both topped 1,000 and reflected a last minute rush to beat the federal homebuyer tax credit deadline. “We are seeing what was predicted – a slower period following the expiration of the tax credits and the rush of buyers to the closing table,” said 2010 SAR President Erick Shumway. “There logically had to come a time when sales would taper off from the highs we hadn’t experienced in almost five years. We are not immune to the economic forces which continue to limit our nation’s recovery – high unemployment, lower consumer demand, and other factors. But we remain confident that better days are ahead.”
- 2. The level of sales of distressed properties (foreclosures and short sales) rose in July 2010 to 48.7 percent of the overall market, from 44.6 percent in June 2010. The distressed market also topped 48 percent in late 2009. The property inventory level remained fairly consistent, rising slightly above the 6,000 level in July 2010 at 6,045, still one of the lowest monthly levels since late summer of 2005. The months of inventory for single family homes in July 2010 rose to 10.4 months from 6.6 months in June. This figure represents the number of months it would take to sell all available homes at the current pace. For condos, the figure rose to 14.4 months from 10.6 months, still lower than last July’s figure of 16.9 months. Once the market reaches the 6 month level it is considered to be in equilibrium between a buyers and sellers market. ###
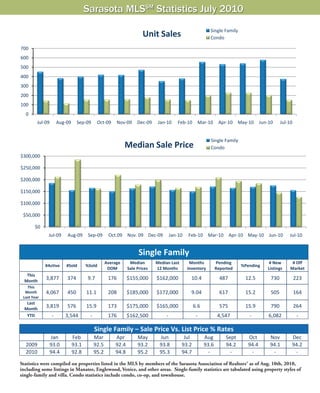
- 3. Sarasota MLSSM Statistics July 2010 Single Family Unit Sales Condo 700 600 500 400 300 200 100 0 Jul‐09 Aug‐09 Sep‐09 Oct‐09 Nov‐09 Dec‐09 Jan‐10 Feb‐10 Mar‐10 Apr‐10 May‐10 Jun‐10 Jul‐10 Single Family Median Sale Price Condo $300,000 $250,000 $200,000 $150,000 $100,000 $50,000 $0 Jul‐09 Aug‐09 Sep‐09 Oct.09 Nov. 09 Dec‐09 Jan‐10 Feb‐10 Mar‐10 Apr‐10 May‐10 Jun‐10 Jul‐10 Single Family Average Median Median Last Months Pending # New # Off #Active #Sold %Sold %Pending DOM Sale Prices 12 Months Inventory Reported Listings Market This Month 3,877 374 9.7 176 $155,000 $162,000 10.4 487 12.5 730 223 This Month 4,067 450 11.1 208 $185,000 $172,000 9.04 617 15.2 505 164 Last Year Last Month 3,819 576 15.9 173 $175,000 $165,000 6.6 575 15.9 790 264 YTD ‐ 3,544 ‐ 176 $162,500 ‐ ‐ 4,547 ‐ 6,082 ‐ Single Family – Sale Price Vs. List Price % Rates Jan Feb Mar Apr May Jun Jul Aug Sept Oct Nov Dec 2009 93.0 93.1 92.5 92.4 93.2 93.8 93.2 93.6 94.2 94.4 94.1 94.2 2010 94.4 92.8 95.2 94.8 95.2 95.3 94.7 ‐ ‐ ‐ ‐ ‐ Statistics were compiled on properties listed in the MLS by members of the Sarasota Association of Realtors® as of Aug. 10th, 2010, including some listings in Manatee, Englewood, Venice, and other areas. Single-family statistics are tabulated using property styles of single-family and villa. Condo statistics include condo, co-op, and townhouse. Source: Sarasota Association of Realtors®
- 4. Sarasota MLSSM Statistics July 2010 Single Family Inventory Condo 5,000 4,000 3,000 2,000 1,000 0 Jul‐09 Aug‐09 Sep‐09 Oct‐09 Nov‐09 Dec‐09 Jan‐10 Feb‐10 Mar‐10 Apr‐10 May‐10 Jun‐10 Jul‐10 Single Family Pending Sales Condo 900 800 700 600 500 400 300 200 100 0 Jul‐09 Aug‐09 Sep‐09 Oct‐09 Nov‐09 Dec‐09 Jan‐10 Feb‐10 Mar‐10 Apr‐10 May‐10 Jun‐10 Jul‐10 Condo Average Median Sale Median Last Months of Pending # New # Off #Active #Sold %Sold %Pending DOM Prices 12 Months Inventory Reported Listings Market This Month 2,177 151 6.9 203 $127,000 $175,000 14.4 166 7.6 261 189 This Month 2,447 145 5.9 225 $212,000 $212,010 16.9 185 7.6 245 233 Last Year Last Month 2,174 200 9.2 203 $145,000 $185,000 10.9 192 8.9 260 219 YTD ‐ 1,185 ‐ 204 $185,000 ‐ ‐ 1,763 ‐ 2,262 ‐ Condo – Sale Price Vs. List Price % Rates Jan Feb Mar Apr May Jun Jul Aug Sept Oct Nov Dec 2009 91.0 90.2 90.4 92.2 90.1 91.4 92.1 92.4 91.5 92.4 92.3 93.1 2010 92.5 92.4 92.5 93.2 94.2 93.7 94.2 ‐ ‐ ‐ ‐ ‐ Median sales price is the middle value, where half of the homes sold for more, and half sold for less. Listings sold were closed transac- tions during the month. Pending sales are sales where an offer has been accepted during the month, but the sale has not yet closed. Even though some pending sales never close, pending sales are an indicator of current buyer activity. DOM indicates the average number of days that sold properties were on the market before a contract was executed. Sarasota Association of Realtors® MLS