SlideShare une entreprise Scribd logo
1  sur  13
Transport Policies for Liveable City-
Vancouver, Canada
Saumya Gupta | TP/644
24.03.2020
Transport Policy & Legislation- Assignment II
Image Source- Transportation 2040 ReportSchool of Planning and Architecture, New Delhi
Coastal Seaport city in Western Canada with an area of 114.97 km2
and a population of 0.63 mn (2016 Census).
Image Source- Google Maps
In Canada In British Columbia Province
Vancouver city
The top 10 most liveable cities in the world, and their scores according to
different indices. (2019)
According to WEF 2019,
LIVEABILITY
means
Well-being
of
Individuals
Building
communities
Sustainable
Society
Safe,
Social Connection,
Inclusion
Environmentally
Sustainable
Access to affordable and diverse housing
options linked via public transport, walking
and cycling infrastructure to
Critical factors for liveable communities-
*Economic Intelligence Unit
Source- The Economist Global Liveability Index 2019 Report, Mercer Quality of Life Ranking 2019 Report, Monocle
Quality of Life Survey 2019 Website, Deutsche Bank Quality of Life Ranking 2019 Website
School of Planning and Architecture, New Delhi
Rank
EIU*
GLI
Mercer
QOL
Monocle
QOL
Deutsche Bank
QOL
1 Vienna (99.1) Vienna (108.6) Zurich Zurich
2 Melbourne Zurich Tokyo Wellington
3 Sydney Auckland Munich Copenhagen
4 Osaka Vancouver (107.4) Copenhagen Edinburgh
5 Calgary Munich Vienna Vienna
6 Vancouver (97.3) Dusseldorf Helsinki Helsinki
7 Tokyo Frankfurt Hamburg Melbourne
8 Toronto Copenhagen Madrid Boston
9 Copenhagen Geneva Berlin San Francisco
10 Adelaide (96.6) Basel Lisbon Sydney
Parameters
•Healthcare
•Culture
•Environment
•Education
•Infrastructure
•Political strength
•Economics
•Env, Safety
•Education
•Pub. Transport
•Pub. Services
•Cost of PT
•House Rent
•Food
Affordability
•Safety
•Cost of
consumer
staples
Score
Out of 100
Comparative from
NYC (100)
Only Rank Available
School of Planning and Architecture, New Delhi
EXISTING TRANSPORTATION CHARACTERISTICS OF THE CITY
AND CHALLENGES
Work
19% BT
3%
Edu
2%Shopping
11%
D/R
7%
R/S/E
11%
D/P
8%
Return
Trip
39%
City Area 115 km2
City Population 0.63 mn (2016)
City Density 5492/km2
Metro Area 2,878 km2
Metro Population 24 mn (2016)
GDP per capita USD 44337
ABOUT THE CITY’S PLANNING
• Grid city shaped by the original
transportation system.
• The original road pattern form the
foundation of a walkable city.
• Called as the city of neighborhoods.
• Characterized by high rise residential
buildings and mixed use development
since the 1950s.
• Unlike other cities, Vancouver has no
freeways into the downtown area.
CITY STATISTICS
• Past 25 years saw investments in
walking and cycling infrastructure.
• Until Jan2020, city was one of the few
major cities in North America without
ride-sharing company.
TRANSPORT SYSTEMS AVAILABLE
1. Metro train (TransLink)
2. Heavy Commuter Rail (West Coast
Express)
3. LRT (SkyTrain)
4. Trolley Bus (BC Transit)
5. Pedestrian and Bicycle Ferry
Service (SeaBus)
6. Bicycle-Sharing system (Mobi)
Source- Wikipedia
Source- Transportation 2040 Plan
Total no/ of trips- 1.99mn
PCTR- 3.8
TRIP PURPOSE DISTRIBUTION MODE SHARE 2018
School of Planning and Architecture, New Delhi Source- Vancouver Panel Survey Report, 2018
Source- Transportation of Vancouver Source- Transportation Plan 2040
BT- Business Trip
Edu- Education
D/R- Dining/Restaurant
R/S/E- Recreational
D/P- Drop off/Pick up
Transit work trips have ATL 7 km, whereas
automobile has 10.6 km
Walk
29%
Bike
sharing
7%
Transit
17%Car-share
5%
Personal
Car
42%
School of Planning and Architecture, New Delhi
OVERALL MODE SHARE
Source- Vancouver Panel Survey Report, 2018
MODE SHARE (Work vs School; by-age) ATL- Mode-wise
MODE SHARE- Income wise TREND IN VEHICLES ENTERING THE
CITY
93% with access to private vehicles
75% with access to private vehicles
83% with access to private vehicles
2.9 3.6 4.0 3.9Trip Rate
37% households with annual income >100k use
active transportation whereas 93% own vehicle.
42% personal car and 17% use transit.
School has just 20% active transport use.
School of Planning and Architecture, New Delhi
Decline in VKT over the years
Trends in Sustainable Mode Share
CHALLENGES
1. A growing city with limited
road space
2. Demand for Transit
3. Costs of sedentary lifestyle 4. High cost of Housing
5. Aging Population 6. Rising Fuel Prices
7. Climate Change 8. Growing Downtown
•Population expected to rise by 0.13
mn; jobs by 0.09 mn by 2041.
•Very few opportunity for new
roads.
•Demand far exceeds capacity.
•Strategic investments for
increasing capacity are needed.
•45% people are obese and
overweight.
•Rate of obesity in children has
tripled in past 25 years.
•Over the years, even with rising population, total VKT has
reduced. meaning increase in use of NMT.
•Share of sustainable mode (transit, walking, cycling) has
increased significantly for walking.
•Housing costs is the main problem,
tpn is a big part of the solution. By
reducing the need to drive or
own a car.
•60+ population will double by 2048,
changes in travel patterns.
•Universal options in
transportation are needed for all
people.
•Fossil fuel prices increased
significantly in past decade.
•Reducing oil dependency and
enable local industry to thrive in
post-carbon world.
•Vehicles account for 30% GHG
emissions in the city.
•Shift to cleaner fuel is reqd.
•Downtown is core area, providing
range of mobility options with
limited road space is the challenge.
Source- Transportation 2040 Plan
School of Planning and Architecture, New Delhi
TRANSPORTATION POLICY
School of Planning and Architecture, New Delhi Source- Transportation 2040 Plan
Goals-
• Make the majority of trips on foot, bike, and
transit
• Eliminate dependence on fossil fuels
• Breathe the cleanest air of any major city in the
world.
GREEN TRANSPORTATION POLICY, VANCOUVER
ECONOMY
PEOPLE
A smart and efficient transportation system that
supports a thriving economy while increasing
affordability.
ENVIRONMENT
Healthy citizens who are mobile in a safe, accessible,
and vibrant city.
An enhanced natural environment that ensures
a healthy future for people and the planet.
TARGETS
TARGET 1: MODE SHARE
2/3 of all trips will be made by foot,
bike, and transit.
TARGET 1: DISTANCE DRIVEN
Distance driven per resident to will be
reduced by 20%.
Emissions will further reduce by 33%
TARGET 3: ZERO TRAFFIC-RELATED FATALITIES
• Eliminate all fatalities
from the transportation
system by engineering,
enforcement and
education
interventions.
• Special focus on
vulnerable road users.
Transportation 2040 builds upon the success of the
previous plan (1997), which committed the City to not
expanding road space despite a growing population
and workforce.
Since then, the total number of car trips into the city and
downtown has decreased, despite growth in total person
trips.
Walking, cycling, and transit have grown whereas
motor trips have declined.
TRANSPORTATION PLAN, VANCOUVER
School of Planning and Architecture, New Delhi Source- Transportation 2040 Plan
1. LAND USE
Policy-
1. Prioritize and encourage dense
and diverse mix of services,
amenities, jobs, and housing types
in areas well served by frequent,
high-capacity transit.
2. Locate major trip generators near
rapid transit stations or along
transit corridors.
3. Design buildings to contribute to a
public realm that feels interesting
and safe.
Land
Use
Walking
Cycling
Transit
Motor
Vehicles
Goods and
Emergency
Response
The Plan is a long term vision
covering policies for various
aspects and tpn modes as follows- Appropriate land use decisions can
encourage walking, cycling, and transit
improving mode share which is key to
accommodating more trips.
Design buildings that put “eyes on the
street” to foster feelings of safety, and
locate density to support efficient transit
service.
Policy Background
The walking network is fairly complete, in areas with poor pedestrian
connectivity, new or improved pathways and signalized crossings will
be created where feasible.
Extending curbs at intersections to minimize crossing distances,
installing countdown timers and reviewing signal timing to make sure
people can cross safely, and maximizing visibility through lighting, and
pavement markings.
TRANSPORTATION PLAN, VANCOUVER
School of Planning and Architecture, New Delhi Source- Transportation 2040 Plan
2. WALKING
Target-
Increase walk share to
22% of total trips.
Policy-
Pedestrian Network
1. Make streets safer for
walking.
1. Provide generous, unobstructed sidewalks on all streets
2. Make streets accessible for all people
3. Make streets and public spaces rain-friendly
4. Address gaps in the pedestrian network
5. Provide a blueprint for great pedestrian realm design
6. Make the city easy to navigate on foot
Public Spaces
1. Enable and encourage creative uses of the street
2. Create public plazas and gathering spaces throughout the city
3. CYCLING
Increase bike share to
12% of total trips.
Target-
Policy Background
>50% of all trips in the city are under 5 km—less than 20 minutes by
bike. Yet over half of these trips are currently made by car.
Policy-
Cycling Network
1. Build cycling routes that feel comfortable for people of all
ages and abilities
2. Upgrade and expand the cycling network to efficiently connect
people to destinations
3. Maintain bikeways in a state of good repair
4. Make the cycling network easy to navigate
Parking and End-of-Trip Facilities
1. Provide abundant and convenient bicycle parking and end-
of-trip facilities
Multi-Modal Integration
1. Make it easy to combine cycling with other forms of tpn
2. Provide a public bicycle system
Easier way-finding and
consistent cycle tracks across
municipal boundaries.
Identifying collision hotspots.
Policy-
Transit Network
1. Advance new and
improved rapid and local
transit
2. Improve transit reliability
and speed using transit
priority measures
3. Support water-based
transit and interregional
transit
Transit-Supportive Public
Realm
1. Support an easy to
navigate system
2. Provide easy transfers
and comfortable waiting
areas
TRANSPORTATION PLAN, VANCOUVER
School of Planning and Architecture, New Delhi Source- Transportation 2040 Plan
4. TRANSIT
Target-
33% fewer trips by private vehicle.
5. MOTOR VEHICLES
Integration with Other Modes
1. Make it easy to combine cycling
and transit trips
2. Provide a public bicycle system
Accessibility
Support a universally accessible
transit system for people of all
incomes, ages, and abilities
Neighbourhood Impacts
1. Reduce transit-related env.l and
noise emissions
2. Maintain transit streets to a high
standard
Transit Financing
1. Support effective fares that
encourage transit use.
Target-
33% modal share expected by
2040.
Policy-
Road Network
1. Optimize network operations to
manage congestion impacts
2. Consider impacts to transit,
comm. vehicles, and general
traffic flow prior to reallocating
road space
Parking
1. Separate parking and
housing costs to increase
housing affordability
2. Provide accessible parking for
persons with disabilities
3. Support cycling, low-carbon
vehicles, and car sharing
Other Demand Mgt Tools
1. Support tpn demand programs
that are employer-, institutional-,
and district-based
2. Support regional road or
congestion pricing, with revenue
directed towards sustainable tpn
improvements
3. Support insurance options that
reward drivers for driving less
Low-Carbon Vehicles
1. Provide charging infrastructure
to support e-vehicles
Taxis
1. Support safe use of taxis for
persons with disabilities
Policy Background
Even with increase in W/B/T, there will still be cars on the road.
Widespread use of low- and zero-emission vehicles is critical to meeting
our GHG reduction targets
Policy Background
Strategically locating transit priority measures such as bus bulges,
queue jumpers, signal priority, and lane priority or reallocation can
be effective ways to improve transit capacity, speed, and reliability.
Car sharing is a system where a fleet of
communal vehicles is available in
convenient locations to regd. members.
Policy Background
Containers leaving Port Metro Vancouver, 63% go directly by rail,
and another 22% are transferred to rail before leaving the region as
it is most efficient.
TRANSPORTATION PLAN, VANCOUVER
School of Planning and Architecture, New Delhi Source- Transportation 2040 Plan
6. GOODS, AND EMERGENCY RESPONSE VEHICLES
REVIEW
• Relatively fine-grain street network has many benefits. It results in
fairly direct travel routes, minimizing overall trip distances. It also
provides greater flexibility to close off or modify portions of routes—
for traffic management, traffic calming, repair works and to host
street celebrations or festivals at neighbourhood level, for
example—since parallel routes are usually close by.
• Such road pattern usually increases the scope of choosing private
vehicle over public transit as the public transit has low viability for
passengers in grid networks apart from operational non-viability.
• With ATL of work as 10 km, and the radius of the city is 8 km, it
directs towards maximum work trips as regional and even then it’s
done by private vehicle instead of public transit. Detail on policy is
lacking.
• Self sufficient neighbourhoods are important for reducing inter-
neighbourhood trips and becomes extremely important for
upkeeping liveability which is lacking in the Policy.
• Traffic volume is completely skipped in the policy formulation
process, data is entirely dependent upon sample panel.
• Trip Rate of age group 65+ is 3.9 whereas the trip rate of working
age group is 4.0 and the mode share for private vehicle in these age
groups is 45% and 49% respectively. The purpose and ATL is
missing which would’ve helped to understand this statistics better.
Policy-
Regional-and-Beyond Goods and Services Movement
1. Support truck movement on key regional routes
Local Goods and Services Movement
1. Maintain an efficient network of designated truck routes
2. Provide for efficient loading and unloading
3. Support low-impact goods and services movement and delivery
4. Support local production and distribution to reduce the need for
large-scale transport
Emergency Response
1. Consider emergency vehicle access in street designs and traffic
calming measures
2. Provide up-to-date, readily accessible information on traffic
calming measures and closures
Rightsizing for the job is another way to reduce neighbourhood
impacts. For ex: Cargo bikes and small vehicles for urban deliveries.
A combination of well-designed traffic calming, appropriately sized
vehicles, and response strategies is needed to both prevent and
respond to traffic collisions.
School of Planning and Architecture, New Delhi
References-
1. https://www.weforum.org/agenda/2019/09/this-is-what-makes-a-city-liveable/
2. https://www.eiu.com/public/topical_report.aspx?campaignid=liveability2019
3. https://mobilityexchange.mercer.com/Insights/quality-of-living-rankings
4. https://www.cnbc.com/2019/05/20/these-cities-offer-the-best-quality-of-life-deutsche-bank-says.html
5. https://monocle.com/film/affairs/quality-of-life-survey-top-25-cities-2019/
6. https://en.wikipedia.org/wiki/Vancouver#Urban_planning
7. https://vancouver.ca/files/cov/2018-transportation-panel-survey.pdf
8. https://vancouver.ca/files/cov/transportation-2040-plan.pdf
9. https://vancouver.ca/streets-transportation/walk-bike-and-transit.aspx
THANK YOU!

Contenu connexe

Tendances

Growing Station Areas: The Variety and Potential of Transit Oriented Developm...
Growing Station Areas: The Variety and Potential of Transit Oriented Developm...Growing Station Areas: The Variety and Potential of Transit Oriented Developm...
Growing Station Areas: The Variety and Potential of Transit Oriented Developm...
Metropolitan Area Planning Council
 
Report on sustainable urban travel bw
Report on sustainable urban travel bwReport on sustainable urban travel bw
Report on sustainable urban travel bw
Gargee Ghosh
 
Peter Newman - Zero Carbon Transport
Peter Newman - Zero Carbon TransportPeter Newman - Zero Carbon Transport
Peter Newman - Zero Carbon Transport
Beyond Zero Emissions
 

Tendances (20)

Sustainable transportation presentation
Sustainable transportation presentationSustainable transportation presentation
Sustainable transportation presentation
 
Smart remoteness and world-class non-motorised transport in Alice Springs
Smart remoteness and world-class non-motorised transport in Alice SpringsSmart remoteness and world-class non-motorised transport in Alice Springs
Smart remoteness and world-class non-motorised transport in Alice Springs
 
Retrofitting Plan To Promote NMT For IUT Final_KK Joaddder
Retrofitting Plan To Promote NMT For IUT Final_KK JoaddderRetrofitting Plan To Promote NMT For IUT Final_KK Joaddder
Retrofitting Plan To Promote NMT For IUT Final_KK Joaddder
 
Transforming the Urban Space through TOD: The 3V Approach
Transforming the Urban Space through TOD: The 3V ApproachTransforming the Urban Space through TOD: The 3V Approach
Transforming the Urban Space through TOD: The 3V Approach
 
Transit oriented development
Transit oriented developmentTransit oriented development
Transit oriented development
 
Forward Thinking: A Study In Transportation, Land Use And Urban Design In Nag...
Forward Thinking: A Study In Transportation, Land Use And Urban Design In Nag...Forward Thinking: A Study In Transportation, Land Use And Urban Design In Nag...
Forward Thinking: A Study In Transportation, Land Use And Urban Design In Nag...
 
Transit oriented Development
Transit oriented DevelopmentTransit oriented Development
Transit oriented Development
 
Sustainable Transportation
Sustainable Transportation   Sustainable Transportation
Sustainable Transportation
 
Developing A Sustainable Transportation Environmental Improvement Plan
Developing A Sustainable Transportation Environmental Improvement PlanDeveloping A Sustainable Transportation Environmental Improvement Plan
Developing A Sustainable Transportation Environmental Improvement Plan
 
9/8 THUR 14:30 | TOD Toolbox :Regional & Statewide Coord. Efforts
9/8 THUR 14:30 | TOD Toolbox :Regional & Statewide Coord. Efforts9/8 THUR 14:30 | TOD Toolbox :Regional & Statewide Coord. Efforts
9/8 THUR 14:30 | TOD Toolbox :Regional & Statewide Coord. Efforts
 
Transportation for make in india
Transportation for make in indiaTransportation for make in india
Transportation for make in india
 
New Developments in Transit Oriented Development
New Developments in Transit Oriented DevelopmentNew Developments in Transit Oriented Development
New Developments in Transit Oriented Development
 
Growing Station Areas: The Variety and Potential of Transit Oriented Developm...
Growing Station Areas: The Variety and Potential of Transit Oriented Developm...Growing Station Areas: The Variety and Potential of Transit Oriented Developm...
Growing Station Areas: The Variety and Potential of Transit Oriented Developm...
 
Making Transport Sustainable
Making Transport Sustainable   Making Transport Sustainable
Making Transport Sustainable
 
Report on sustainable urban travel bw
Report on sustainable urban travel bwReport on sustainable urban travel bw
Report on sustainable urban travel bw
 
Land-use transport planning
Land-use transport planning Land-use transport planning
Land-use transport planning
 
Sustainability in Transport Sector
Sustainability in Transport SectorSustainability in Transport Sector
Sustainability in Transport Sector
 
City Structure and Urban Mobility
City Structure and Urban MobilityCity Structure and Urban Mobility
City Structure and Urban Mobility
 
Peter Newman - Zero Carbon Transport
Peter Newman - Zero Carbon TransportPeter Newman - Zero Carbon Transport
Peter Newman - Zero Carbon Transport
 
Mumbai Urban Transport Project Study
Mumbai Urban Transport Project StudyMumbai Urban Transport Project Study
Mumbai Urban Transport Project Study
 

Similaire à Transport Policies for Van Couver, Canada

Public Transit: Not Just Trains
Public Transit:  Not Just TrainsPublic Transit:  Not Just Trains
Public Transit: Not Just Trains
Cynthia Hoyle
 
ddot amst 140
ddot amst 140ddot amst 140
ddot amst 140
maryaphd
 
Ddot amst 140
Ddot amst 140Ddot amst 140
Ddot amst 140
maryaphd
 
Ddot amst 140
Ddot amst 140Ddot amst 140
Ddot amst 140
maryaphd
 
Mobility In The 21st Century ITE Conference 2010final
Mobility In The 21st Century ITE Conference 2010finalMobility In The 21st Century ITE Conference 2010final
Mobility In The 21st Century ITE Conference 2010final
Cynthia Hoyle
 
Transportation Summit08 Tom Prendergast
Transportation Summit08 Tom PrendergastTransportation Summit08 Tom Prendergast
Transportation Summit08 Tom Prendergast
Crooky
 
CO2 Reduction through Better Urban Design: Portland's Story - Rex Burkholder
CO2 Reduction through Better Urban Design: Portland's Story - Rex BurkholderCO2 Reduction through Better Urban Design: Portland's Story - Rex Burkholder
CO2 Reduction through Better Urban Design: Portland's Story - Rex Burkholder
WRI Ross Center for Sustainable Cities
 

Similaire à Transport Policies for Van Couver, Canada (20)

Micro Urbana Communities- Creating and Implementing Livable Transportatino So...
Micro Urbana Communities- Creating and Implementing Livable Transportatino So...Micro Urbana Communities- Creating and Implementing Livable Transportatino So...
Micro Urbana Communities- Creating and Implementing Livable Transportatino So...
 
Public Transit: Not Just Trains
Public Transit:  Not Just TrainsPublic Transit:  Not Just Trains
Public Transit: Not Just Trains
 
ddot amst 140
ddot amst 140ddot amst 140
ddot amst 140
 
Ddot amst 140
Ddot amst 140Ddot amst 140
Ddot amst 140
 
Ddot amst 140
Ddot amst 140Ddot amst 140
Ddot amst 140
 
Mobility In The 21st Century ITE Conference 2010final
Mobility In The 21st Century ITE Conference 2010finalMobility In The 21st Century ITE Conference 2010final
Mobility In The 21st Century ITE Conference 2010final
 
April 21 Complete Streets Open House Boards
April 21 Complete Streets Open House BoardsApril 21 Complete Streets Open House Boards
April 21 Complete Streets Open House Boards
 
Session 7b: Scene-setting- Transport Sector Decarbonization Strategy in Indon...
Session 7b: Scene-setting- Transport Sector Decarbonization Strategy in Indon...Session 7b: Scene-setting- Transport Sector Decarbonization Strategy in Indon...
Session 7b: Scene-setting- Transport Sector Decarbonization Strategy in Indon...
 
transportation-2040-plan.pdf
transportation-2040-plan.pdftransportation-2040-plan.pdf
transportation-2040-plan.pdf
 
Bicycling: How do we achieve greater mode share?
Bicycling: How do we achieve greater mode share?Bicycling: How do we achieve greater mode share?
Bicycling: How do we achieve greater mode share?
 
NYC 2
NYC 2NYC 2
NYC 2
 
Transportation Summit08 Tom Prendergast
Transportation Summit08 Tom PrendergastTransportation Summit08 Tom Prendergast
Transportation Summit08 Tom Prendergast
 
CO2 Reduction through Better Urban Design: Portland's Story - Rex Burkholder
CO2 Reduction through Better Urban Design: Portland's Story - Rex BurkholderCO2 Reduction through Better Urban Design: Portland's Story - Rex Burkholder
CO2 Reduction through Better Urban Design: Portland's Story - Rex Burkholder
 
Sustainable Transportation in Melbourne
Sustainable Transportation in MelbourneSustainable Transportation in Melbourne
Sustainable Transportation in Melbourne
 
Sustainable Mobility Plan for Udaipur - 2014 by Ashutosh Nirvadyaachari
Sustainable Mobility Plan for Udaipur - 2014 by Ashutosh NirvadyaachariSustainable Mobility Plan for Udaipur - 2014 by Ashutosh Nirvadyaachari
Sustainable Mobility Plan for Udaipur - 2014 by Ashutosh Nirvadyaachari
 
Ministry of Urban Development’s initiatives on Transit-Oriented Development (...
Ministry of Urban Development’s initiatives on Transit-Oriented Development (...Ministry of Urban Development’s initiatives on Transit-Oriented Development (...
Ministry of Urban Development’s initiatives on Transit-Oriented Development (...
 
Federal Funding for Active Transportation and Recreation-Wesley Blount
Federal Funding for Active Transportation and Recreation-Wesley BlountFederal Funding for Active Transportation and Recreation-Wesley Blount
Federal Funding for Active Transportation and Recreation-Wesley Blount
 
Building Sustainable Communities: Urban Planning in the Portland Metro Regi...
Building Sustainable Communities: Urban Planning in the Portland Metro Regi...Building Sustainable Communities: Urban Planning in the Portland Metro Regi...
Building Sustainable Communities: Urban Planning in the Portland Metro Regi...
 
The Streets in a Livable City
The Streets in a Livable CityThe Streets in a Livable City
The Streets in a Livable City
 
Transformative Solutions: Cities for People
Transformative Solutions: Cities for PeopleTransformative Solutions: Cities for People
Transformative Solutions: Cities for People
 

Dernier

case-study-marcopper-disaster in the philippines.pdf
case-study-marcopper-disaster in the philippines.pdfcase-study-marcopper-disaster in the philippines.pdf
case-study-marcopper-disaster in the philippines.pdf
garthraymundo123
 
一比一原版(UMiami毕业证书)迈阿密大学毕业证如何办理
一比一原版(UMiami毕业证书)迈阿密大学毕业证如何办理一比一原版(UMiami毕业证书)迈阿密大学毕业证如何办理
一比一原版(UMiami毕业证书)迈阿密大学毕业证如何办理
zubnm
 

Dernier (20)

case-study-marcopper-disaster in the philippines.pdf
case-study-marcopper-disaster in the philippines.pdfcase-study-marcopper-disaster in the philippines.pdf
case-study-marcopper-disaster in the philippines.pdf
 
Russian Call girls in Dubai 0508644382 Dubai Call girls
Russian Call girls in Dubai 0508644382 Dubai Call girlsRussian Call girls in Dubai 0508644382 Dubai Call girls
Russian Call girls in Dubai 0508644382 Dubai Call girls
 
Hook Up Call Girls Rajgir 9332606886 High Profile Call Girls You Can Get T...
Hook Up Call Girls Rajgir   9332606886  High Profile Call Girls You Can Get T...Hook Up Call Girls Rajgir   9332606886  High Profile Call Girls You Can Get T...
Hook Up Call Girls Rajgir 9332606886 High Profile Call Girls You Can Get T...
 
Call girl in Ajman 0503464457 Ajman Call girl services
Call girl in Ajman 0503464457 Ajman Call girl servicesCall girl in Ajman 0503464457 Ajman Call girl services
Call girl in Ajman 0503464457 Ajman Call girl services
 
Green Marketing
Green MarketingGreen Marketing
Green Marketing
 
RA 7942:vThe Philippine Mining Act of 1995
RA 7942:vThe Philippine Mining Act of 1995RA 7942:vThe Philippine Mining Act of 1995
RA 7942:vThe Philippine Mining Act of 1995
 
NO1 Google Kala Jadu Expert Specialist In Qatar Kala Jadu Expert Specialist I...
NO1 Google Kala Jadu Expert Specialist In Qatar Kala Jadu Expert Specialist I...NO1 Google Kala Jadu Expert Specialist In Qatar Kala Jadu Expert Specialist I...
NO1 Google Kala Jadu Expert Specialist In Qatar Kala Jadu Expert Specialist I...
 
Enhancing forest data transparency for climate action
Enhancing forest data transparency for climate actionEnhancing forest data transparency for climate action
Enhancing forest data transparency for climate action
 
Cyclone Case Study Odisha 1999 Super Cyclone in India.
Cyclone Case Study Odisha 1999 Super Cyclone in India.Cyclone Case Study Odisha 1999 Super Cyclone in India.
Cyclone Case Study Odisha 1999 Super Cyclone in India.
 
Test bank for beckmann and ling s obstetrics and gynecology 8th edition by ro...
Test bank for beckmann and ling s obstetrics and gynecology 8th edition by ro...Test bank for beckmann and ling s obstetrics and gynecology 8th edition by ro...
Test bank for beckmann and ling s obstetrics and gynecology 8th edition by ro...
 
一比一原版(UMiami毕业证书)迈阿密大学毕业证如何办理
一比一原版(UMiami毕业证书)迈阿密大学毕业证如何办理一比一原版(UMiami毕业证书)迈阿密大学毕业证如何办理
一比一原版(UMiami毕业证书)迈阿密大学毕业证如何办理
 
Water Pollution
Water Pollution Water Pollution
Water Pollution
 
Russian Escort Dubai 0503464457 Dubai Escorts
Russian Escort Dubai 0503464457 Dubai EscortsRussian Escort Dubai 0503464457 Dubai Escorts
Russian Escort Dubai 0503464457 Dubai Escorts
 
Fuel Cells and Hydrogen in Transportation - An Introduction
Fuel Cells and Hydrogen in Transportation - An IntroductionFuel Cells and Hydrogen in Transportation - An Introduction
Fuel Cells and Hydrogen in Transportation - An Introduction
 
Vip Salem Call Girls 8250092165 Low Price Escorts Service in Your Area
Vip Salem Call Girls 8250092165 Low Price Escorts Service in Your AreaVip Salem Call Girls 8250092165 Low Price Escorts Service in Your Area
Vip Salem Call Girls 8250092165 Low Price Escorts Service in Your Area
 
Yil Me Hu Spring 2024 - Nisqually Salmon Recovery Newsletter
Yil Me Hu Spring 2024 - Nisqually Salmon Recovery NewsletterYil Me Hu Spring 2024 - Nisqually Salmon Recovery Newsletter
Yil Me Hu Spring 2024 - Nisqually Salmon Recovery Newsletter
 
Environmental Topic : Soil Pollution by Afzalul Hoda.pptx
Environmental Topic : Soil Pollution by Afzalul Hoda.pptxEnvironmental Topic : Soil Pollution by Afzalul Hoda.pptx
Environmental Topic : Soil Pollution by Afzalul Hoda.pptx
 
Sensual Call Girls in Surajpur { 9332606886 } VVIP NISHA Call Girls Near 5 St...
Sensual Call Girls in Surajpur { 9332606886 } VVIP NISHA Call Girls Near 5 St...Sensual Call Girls in Surajpur { 9332606886 } VVIP NISHA Call Girls Near 5 St...
Sensual Call Girls in Surajpur { 9332606886 } VVIP NISHA Call Girls Near 5 St...
 
FYP1 FINAL PRESENTATION POLITEKNIK MALAYSIA
FYP1 FINAL PRESENTATION POLITEKNIK MALAYSIAFYP1 FINAL PRESENTATION POLITEKNIK MALAYSIA
FYP1 FINAL PRESENTATION POLITEKNIK MALAYSIA
 
Presentation: Farmer-led climate adaptation - Project launch and overview by ...
Presentation: Farmer-led climate adaptation - Project launch and overview by ...Presentation: Farmer-led climate adaptation - Project launch and overview by ...
Presentation: Farmer-led climate adaptation - Project launch and overview by ...
 

Transport Policies for Van Couver, Canada

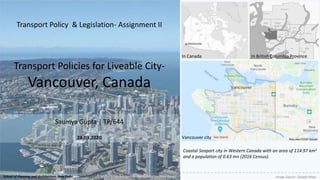
  • 1. Transport Policies for Liveable City- Vancouver, Canada Saumya Gupta | TP/644 24.03.2020 Transport Policy & Legislation- Assignment II Image Source- Transportation 2040 ReportSchool of Planning and Architecture, New Delhi Coastal Seaport city in Western Canada with an area of 114.97 km2 and a population of 0.63 mn (2016 Census). Image Source- Google Maps In Canada In British Columbia Province Vancouver city
  • 2. The top 10 most liveable cities in the world, and their scores according to different indices. (2019) According to WEF 2019, LIVEABILITY means Well-being of Individuals Building communities Sustainable Society Safe, Social Connection, Inclusion Environmentally Sustainable Access to affordable and diverse housing options linked via public transport, walking and cycling infrastructure to Critical factors for liveable communities- *Economic Intelligence Unit Source- The Economist Global Liveability Index 2019 Report, Mercer Quality of Life Ranking 2019 Report, Monocle Quality of Life Survey 2019 Website, Deutsche Bank Quality of Life Ranking 2019 Website School of Planning and Architecture, New Delhi Rank EIU* GLI Mercer QOL Monocle QOL Deutsche Bank QOL 1 Vienna (99.1) Vienna (108.6) Zurich Zurich 2 Melbourne Zurich Tokyo Wellington 3 Sydney Auckland Munich Copenhagen 4 Osaka Vancouver (107.4) Copenhagen Edinburgh 5 Calgary Munich Vienna Vienna 6 Vancouver (97.3) Dusseldorf Helsinki Helsinki 7 Tokyo Frankfurt Hamburg Melbourne 8 Toronto Copenhagen Madrid Boston 9 Copenhagen Geneva Berlin San Francisco 10 Adelaide (96.6) Basel Lisbon Sydney Parameters •Healthcare •Culture •Environment •Education •Infrastructure •Political strength •Economics •Env, Safety •Education •Pub. Transport •Pub. Services •Cost of PT •House Rent •Food Affordability •Safety •Cost of consumer staples Score Out of 100 Comparative from NYC (100) Only Rank Available
  • 3. School of Planning and Architecture, New Delhi EXISTING TRANSPORTATION CHARACTERISTICS OF THE CITY AND CHALLENGES
  • 4. Work 19% BT 3% Edu 2%Shopping 11% D/R 7% R/S/E 11% D/P 8% Return Trip 39% City Area 115 km2 City Population 0.63 mn (2016) City Density 5492/km2 Metro Area 2,878 km2 Metro Population 24 mn (2016) GDP per capita USD 44337 ABOUT THE CITY’S PLANNING • Grid city shaped by the original transportation system. • The original road pattern form the foundation of a walkable city. • Called as the city of neighborhoods. • Characterized by high rise residential buildings and mixed use development since the 1950s. • Unlike other cities, Vancouver has no freeways into the downtown area. CITY STATISTICS • Past 25 years saw investments in walking and cycling infrastructure. • Until Jan2020, city was one of the few major cities in North America without ride-sharing company. TRANSPORT SYSTEMS AVAILABLE 1. Metro train (TransLink) 2. Heavy Commuter Rail (West Coast Express) 3. LRT (SkyTrain) 4. Trolley Bus (BC Transit) 5. Pedestrian and Bicycle Ferry Service (SeaBus) 6. Bicycle-Sharing system (Mobi) Source- Wikipedia Source- Transportation 2040 Plan Total no/ of trips- 1.99mn PCTR- 3.8 TRIP PURPOSE DISTRIBUTION MODE SHARE 2018 School of Planning and Architecture, New Delhi Source- Vancouver Panel Survey Report, 2018 Source- Transportation of Vancouver Source- Transportation Plan 2040 BT- Business Trip Edu- Education D/R- Dining/Restaurant R/S/E- Recreational D/P- Drop off/Pick up
  • 5. Transit work trips have ATL 7 km, whereas automobile has 10.6 km Walk 29% Bike sharing 7% Transit 17%Car-share 5% Personal Car 42% School of Planning and Architecture, New Delhi OVERALL MODE SHARE Source- Vancouver Panel Survey Report, 2018 MODE SHARE (Work vs School; by-age) ATL- Mode-wise MODE SHARE- Income wise TREND IN VEHICLES ENTERING THE CITY 93% with access to private vehicles 75% with access to private vehicles 83% with access to private vehicles 2.9 3.6 4.0 3.9Trip Rate 37% households with annual income >100k use active transportation whereas 93% own vehicle. 42% personal car and 17% use transit. School has just 20% active transport use.
  • 6. School of Planning and Architecture, New Delhi Decline in VKT over the years Trends in Sustainable Mode Share CHALLENGES 1. A growing city with limited road space 2. Demand for Transit 3. Costs of sedentary lifestyle 4. High cost of Housing 5. Aging Population 6. Rising Fuel Prices 7. Climate Change 8. Growing Downtown •Population expected to rise by 0.13 mn; jobs by 0.09 mn by 2041. •Very few opportunity for new roads. •Demand far exceeds capacity. •Strategic investments for increasing capacity are needed. •45% people are obese and overweight. •Rate of obesity in children has tripled in past 25 years. •Over the years, even with rising population, total VKT has reduced. meaning increase in use of NMT. •Share of sustainable mode (transit, walking, cycling) has increased significantly for walking. •Housing costs is the main problem, tpn is a big part of the solution. By reducing the need to drive or own a car. •60+ population will double by 2048, changes in travel patterns. •Universal options in transportation are needed for all people. •Fossil fuel prices increased significantly in past decade. •Reducing oil dependency and enable local industry to thrive in post-carbon world. •Vehicles account for 30% GHG emissions in the city. •Shift to cleaner fuel is reqd. •Downtown is core area, providing range of mobility options with limited road space is the challenge. Source- Transportation 2040 Plan
  • 7. School of Planning and Architecture, New Delhi TRANSPORTATION POLICY
  • 8. School of Planning and Architecture, New Delhi Source- Transportation 2040 Plan Goals- • Make the majority of trips on foot, bike, and transit • Eliminate dependence on fossil fuels • Breathe the cleanest air of any major city in the world. GREEN TRANSPORTATION POLICY, VANCOUVER ECONOMY PEOPLE A smart and efficient transportation system that supports a thriving economy while increasing affordability. ENVIRONMENT Healthy citizens who are mobile in a safe, accessible, and vibrant city. An enhanced natural environment that ensures a healthy future for people and the planet. TARGETS TARGET 1: MODE SHARE 2/3 of all trips will be made by foot, bike, and transit. TARGET 1: DISTANCE DRIVEN Distance driven per resident to will be reduced by 20%. Emissions will further reduce by 33% TARGET 3: ZERO TRAFFIC-RELATED FATALITIES • Eliminate all fatalities from the transportation system by engineering, enforcement and education interventions. • Special focus on vulnerable road users.
  • 9. Transportation 2040 builds upon the success of the previous plan (1997), which committed the City to not expanding road space despite a growing population and workforce. Since then, the total number of car trips into the city and downtown has decreased, despite growth in total person trips. Walking, cycling, and transit have grown whereas motor trips have declined. TRANSPORTATION PLAN, VANCOUVER School of Planning and Architecture, New Delhi Source- Transportation 2040 Plan 1. LAND USE Policy- 1. Prioritize and encourage dense and diverse mix of services, amenities, jobs, and housing types in areas well served by frequent, high-capacity transit. 2. Locate major trip generators near rapid transit stations or along transit corridors. 3. Design buildings to contribute to a public realm that feels interesting and safe. Land Use Walking Cycling Transit Motor Vehicles Goods and Emergency Response The Plan is a long term vision covering policies for various aspects and tpn modes as follows- Appropriate land use decisions can encourage walking, cycling, and transit improving mode share which is key to accommodating more trips. Design buildings that put “eyes on the street” to foster feelings of safety, and locate density to support efficient transit service.
  • 10. Policy Background The walking network is fairly complete, in areas with poor pedestrian connectivity, new or improved pathways and signalized crossings will be created where feasible. Extending curbs at intersections to minimize crossing distances, installing countdown timers and reviewing signal timing to make sure people can cross safely, and maximizing visibility through lighting, and pavement markings. TRANSPORTATION PLAN, VANCOUVER School of Planning and Architecture, New Delhi Source- Transportation 2040 Plan 2. WALKING Target- Increase walk share to 22% of total trips. Policy- Pedestrian Network 1. Make streets safer for walking. 1. Provide generous, unobstructed sidewalks on all streets 2. Make streets accessible for all people 3. Make streets and public spaces rain-friendly 4. Address gaps in the pedestrian network 5. Provide a blueprint for great pedestrian realm design 6. Make the city easy to navigate on foot Public Spaces 1. Enable and encourage creative uses of the street 2. Create public plazas and gathering spaces throughout the city 3. CYCLING Increase bike share to 12% of total trips. Target- Policy Background >50% of all trips in the city are under 5 km—less than 20 minutes by bike. Yet over half of these trips are currently made by car. Policy- Cycling Network 1. Build cycling routes that feel comfortable for people of all ages and abilities 2. Upgrade and expand the cycling network to efficiently connect people to destinations 3. Maintain bikeways in a state of good repair 4. Make the cycling network easy to navigate Parking and End-of-Trip Facilities 1. Provide abundant and convenient bicycle parking and end- of-trip facilities Multi-Modal Integration 1. Make it easy to combine cycling with other forms of tpn 2. Provide a public bicycle system Easier way-finding and consistent cycle tracks across municipal boundaries. Identifying collision hotspots.
  • 11. Policy- Transit Network 1. Advance new and improved rapid and local transit 2. Improve transit reliability and speed using transit priority measures 3. Support water-based transit and interregional transit Transit-Supportive Public Realm 1. Support an easy to navigate system 2. Provide easy transfers and comfortable waiting areas TRANSPORTATION PLAN, VANCOUVER School of Planning and Architecture, New Delhi Source- Transportation 2040 Plan 4. TRANSIT Target- 33% fewer trips by private vehicle. 5. MOTOR VEHICLES Integration with Other Modes 1. Make it easy to combine cycling and transit trips 2. Provide a public bicycle system Accessibility Support a universally accessible transit system for people of all incomes, ages, and abilities Neighbourhood Impacts 1. Reduce transit-related env.l and noise emissions 2. Maintain transit streets to a high standard Transit Financing 1. Support effective fares that encourage transit use. Target- 33% modal share expected by 2040. Policy- Road Network 1. Optimize network operations to manage congestion impacts 2. Consider impacts to transit, comm. vehicles, and general traffic flow prior to reallocating road space Parking 1. Separate parking and housing costs to increase housing affordability 2. Provide accessible parking for persons with disabilities 3. Support cycling, low-carbon vehicles, and car sharing Other Demand Mgt Tools 1. Support tpn demand programs that are employer-, institutional-, and district-based 2. Support regional road or congestion pricing, with revenue directed towards sustainable tpn improvements 3. Support insurance options that reward drivers for driving less Low-Carbon Vehicles 1. Provide charging infrastructure to support e-vehicles Taxis 1. Support safe use of taxis for persons with disabilities Policy Background Even with increase in W/B/T, there will still be cars on the road. Widespread use of low- and zero-emission vehicles is critical to meeting our GHG reduction targets Policy Background Strategically locating transit priority measures such as bus bulges, queue jumpers, signal priority, and lane priority or reallocation can be effective ways to improve transit capacity, speed, and reliability. Car sharing is a system where a fleet of communal vehicles is available in convenient locations to regd. members.
  • 12. Policy Background Containers leaving Port Metro Vancouver, 63% go directly by rail, and another 22% are transferred to rail before leaving the region as it is most efficient. TRANSPORTATION PLAN, VANCOUVER School of Planning and Architecture, New Delhi Source- Transportation 2040 Plan 6. GOODS, AND EMERGENCY RESPONSE VEHICLES REVIEW • Relatively fine-grain street network has many benefits. It results in fairly direct travel routes, minimizing overall trip distances. It also provides greater flexibility to close off or modify portions of routes— for traffic management, traffic calming, repair works and to host street celebrations or festivals at neighbourhood level, for example—since parallel routes are usually close by. • Such road pattern usually increases the scope of choosing private vehicle over public transit as the public transit has low viability for passengers in grid networks apart from operational non-viability. • With ATL of work as 10 km, and the radius of the city is 8 km, it directs towards maximum work trips as regional and even then it’s done by private vehicle instead of public transit. Detail on policy is lacking. • Self sufficient neighbourhoods are important for reducing inter- neighbourhood trips and becomes extremely important for upkeeping liveability which is lacking in the Policy. • Traffic volume is completely skipped in the policy formulation process, data is entirely dependent upon sample panel. • Trip Rate of age group 65+ is 3.9 whereas the trip rate of working age group is 4.0 and the mode share for private vehicle in these age groups is 45% and 49% respectively. The purpose and ATL is missing which would’ve helped to understand this statistics better. Policy- Regional-and-Beyond Goods and Services Movement 1. Support truck movement on key regional routes Local Goods and Services Movement 1. Maintain an efficient network of designated truck routes 2. Provide for efficient loading and unloading 3. Support low-impact goods and services movement and delivery 4. Support local production and distribution to reduce the need for large-scale transport Emergency Response 1. Consider emergency vehicle access in street designs and traffic calming measures 2. Provide up-to-date, readily accessible information on traffic calming measures and closures Rightsizing for the job is another way to reduce neighbourhood impacts. For ex: Cargo bikes and small vehicles for urban deliveries. A combination of well-designed traffic calming, appropriately sized vehicles, and response strategies is needed to both prevent and respond to traffic collisions.
  • 13. School of Planning and Architecture, New Delhi References- 1. https://www.weforum.org/agenda/2019/09/this-is-what-makes-a-city-liveable/ 2. https://www.eiu.com/public/topical_report.aspx?campaignid=liveability2019 3. https://mobilityexchange.mercer.com/Insights/quality-of-living-rankings 4. https://www.cnbc.com/2019/05/20/these-cities-offer-the-best-quality-of-life-deutsche-bank-says.html 5. https://monocle.com/film/affairs/quality-of-life-survey-top-25-cities-2019/ 6. https://en.wikipedia.org/wiki/Vancouver#Urban_planning 7. https://vancouver.ca/files/cov/2018-transportation-panel-survey.pdf 8. https://vancouver.ca/files/cov/transportation-2040-plan.pdf 9. https://vancouver.ca/streets-transportation/walk-bike-and-transit.aspx THANK YOU!