Development of a Reproduction Method of a Stream of People for Intuitively Recognize a State of Congestion
•Télécharger en tant que PPTX, PDF•
0 j'aime•854 vues

This document describes a method to intuitively recognize congestion levels in urban areas using sensor data and 3D modeling. Sensors were installed in an underground passage in Sapporo, Japan to measure pedestrian traffic over time. While the raw sensor data provides numerical insights, it can be difficult to intuitively understand congestion levels. To address this, the researchers developed a method to reproduce the stream of people using a 3D model based on the sensor measurements. This allows congestion states to be recognized visually rather than just through numbers. A demonstration video shows the 3D modeling approach in action.

Recommandé
Recommandé
Contenu connexe
Plus de Sayoko Shimoyama
Plus de Sayoko Shimoyama (19)
Dernier
Dernier (20)
Development of a Reproduction Method of a Stream of People for Intuitively Recognize a State of Congestion
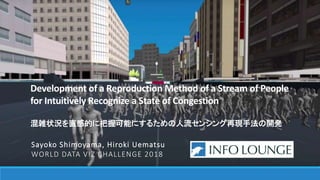
- 1. Development of a Reproduction Method of a Stream of People for Intuitively Recognize a State of Congestion 混雑状況を直感的に把握可能にするための人流センシング再現手法の開発 Sayoko Shimoyama, Hiroki Uematsu WORLD DATA VIZ CHALLENGE 2018
- 2. 2018/11/14 SAYOKO SHIMOYAMA, HIROKI UEMATSU 2 Congestion - one serious problem in a city
- 3. 2018/11/14 SAYOKO SHIMOYAMA, HIROKI UEMATSU 3 Japanese major cities are sometimes badly congested. This picture shows the train platform in the rush hours in Tokyo.
- 4. 2018/11/14 SAYOKO SHIMOYAMA, HIROKI UEMATSU 4 can be life-threatening accident
- 5. 2018/11/14 SAYOKO SHIMOYAMA, HIROKI UEMATSU 5 decreasing QOL of residents
- 6. 2018/11/14 SAYOKO SHIMOYAMA, HIROKI UEMATSU 6 寿司詰め Sushi-Zume (n) jam-packed; packed in like sushi (like sardines)
- 7. How to resolve congestion? 2018/11/14 SAYOKO SHIMOYAMA, HIROKI UEMATSU 7 congestion Decentralize a stream of people Increase a capacity in a place Eliminating causes of congestion
- 8. How to resolve congestion? 2018/11/14 SAYOKO SHIMOYAMA, HIROKI UEMATSU 8 congestion Decentralize a stream of people Increase a capacity in a place Eliminating causes of congestion Understanding of the current situation
- 9. Our solution helps 2018/11/14 SAYOKO SHIMOYAMA, HIROKI UEMATSU 9 congestion Decentralize a stream of people Increase a capacity in a place Eliminating causes of congestion Understanding of the current situation
- 10. Demonstration Project in the Underground Passage in Sapporo City passage length: 520m The most longest under ground passege in japan Put sensors that were developed by Infolounge Co., Ltd at 5 point to measure the stream of people. 2018/11/14 SAYOKO SHIMOYAMA, HIROKI UEMATSU 10 By 663highland, CC BY 2.5 Sapporo, Hokkaido, Japan
- 11. 2018/11/14 SAYOKO SHIMOYAMA, HIROKI UEMATSU 11 Total Count 0 0 Ultrasonic Sensor ceiling
- 12. Detect the existence of a person by the change of the ultrasonic distance 2018/11/14 SAYOKO SHIMOYAMA, HIROKI UEMATSU 12 Total Count 0 0
- 13. 2018/11/14 SAYOKO SHIMOYAMA, HIROKI UEMATSU 13 Total Count 0 0
- 14. 2018/11/14 SAYOKO SHIMOYAMA, HIROKI UEMATSU 14 Total Count 1 1Detect the moving direction by the time difference of the change of the ultrasonic distance
- 15. 2018/11/14 SAYOKO SHIMOYAMA, HIROKI UEMATSU 15 Total Count 2 1
- 16. 2018/11/14 SAYOKO SHIMOYAMA, HIROKI UEMATSU 16 Total Count 2 2
- 17. 2018/11/14 SAYOKO SHIMOYAMA, HIROKI UEMATSU 17 sensors installed on a ceiling
- 18. 2018/11/14 SAYOKO SHIMOYAMA, HIROKI UEMATSU 18 number of people who passed at a point in underground pass in 1 minute majored by sensors
- 19. 2018/11/14 SAYOKO SHIMOYAMA, HIROKI UEMATSU 19 from station to station sum number of people
- 20. PROBLEM:It’s difficult to recognize the state of congestion intuitively Visualizing numerical value as a chart helps us understand the situation But it’s difficult to know how much congestion degree is there 2018/11/14 SAYOKO SHIMOYAMA, HIROKI UEMATSU 20 ? Sushi-Zume Not Sushi-Zume
- 21. SOLUTION:Reproduce the stream of people using 3D model Reproduce the stream of people from the numeric value measured by sensors using 3D model It enables intuitively recognize a state of congestion 2018/11/14 SAYOKO SHIMOYAMA, HIROKI UEMATSU 21
- 22. 2018/11/14 SAYOKO SHIMOYAMA, HIROKI UEMATSU 22 デモンストレーション Demostración https://youtu.be/UrThqlsh7Ug
Notes de l'éditeur
- Me gustaria presentarme. Me llamo Sayoko Shimoyama Y su nombre es Hiroki Uematsu
- 人混みが好きな人…なんていないですよね
- 日本においても都市部の混雑は深刻な社会問題
- 混雑は時に人命に関わる危険を伴い、
- 都市の住人のQOLを著しく下げる
- 混雑問題を解決するアプローチは大きく分けて3種類あると考えている 混雑の原因を排除する 人流を空間や時間で分散化させる 場所の受け入れ可能量を増やす
- いずれのアプローチにおいても、まず現状を把握することが必要
- 今回私たちのプロジェクトでは「現状把握」と「人流の分散化」に役立つソリューションを提案する
- 全5箇所にセンサーを設置し人流を計測 インフォ・ラウンジ株式会社がセンサーの開発と計測を実施
- 人数だけでなく移動方向も計測する仕組み: 超音波センサーを2本のライン状に配置することで、センサーが反応した時間の変化から人の移動方向を計測
- 天井からの距離の変化から人の存在を検知
- 人数だけでなく移動方向も計測する仕組み: センサーを2本のライン状に配置することで、センサーが反応した時間の変化から人の移動方向を計測
- 1列目と2列目のセンサーによって計測された超音波距離の変化の時間差から、人の移動方向を特定
- 人数だけでなく移動方向も計測する仕組み: センサーを2本のライン状に配置することで、センサーが反応した時間の変化から人の移動方向を計測
- 人数だけでなく移動方向も計測する仕組み: センサーを2本のライン状に配置することで、センサーが反応した時間の変化から人の移動方向を計測
- 実際に地下歩行空間に設置されたセンサー 天井にライン状に配置されている
- 実際に計測された人流データ(管理画面)
- 実際に計測された人流データ 1分ごとに集計したデータ
- 数値やグラフでは混雑状況が分かりにくい 数値化・グラフ化することは分析を行う上では重宝する しかし人流の増減を数値やグラフで見せるだけでは、その場所が混んでるのか、空いているのかを直感的に把握することが難しい
- 3Dで可視化することで、混雑状況を直感的にで把握することが可能になる