
Recommandé
Contenu connexe
Tendances
Tendances (20)
En vedette
Similaire à 3 4 ratio analysis (1)
Similaire à 3 4 ratio analysis (1) (20)
Plus de sdwaltton
Plus de sdwaltton (20)
Dernier
Dernier (20)
3 4 ratio analysis (1)
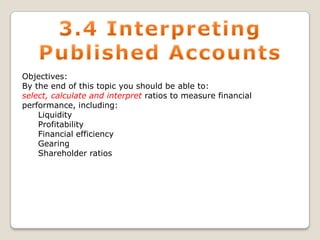
- 1. Objectives: By the end of this topic you should be able to: select, calculate and interpret ratios to measure financial performance, including: Liquidity Profitability Financial efficiency Gearing Shareholder ratios
- 2. Acid Test Ratio Ratio analysis Liquidity Current Ratio Financial efficiency ratio Profitability Ratios ROCE Inventory turnover Shareholder ratios Dividend Yield Payables period Asset Turnover Gearing Dividend per share Receivables period
- 3. A method of assessing a firm’s financial situation by comparing two sets of linked data Ratio’s turn financial accounts into easy-to-understand numbers You can compare firm to firm, division to division or year to year We usually look at the balance sheet and the income statement to extract the figures Stakeholders can draw conclusions about a company’s performance
- 4. Profitability Liquidity Gearing Financial Efficiency Shareholders ratios TASK 1:In pairs, using a range of resources including textbooks, Business Review and tutor2u – fill in the ratio grid sheet
- 5. Profitability ratios can help answer questions like… Is the business making a profit? Is it growing? How efficient is the business at turning revenues into profit? Is the profit enough to finance reinvestment? Is it sustainable (high quality)? How does it compare to the rest of the industry
- 6. Gross Profit Margin Net Profit Margin Return On Capital Employed (ROCE)
- 7. Gross Profit Margin Formula Example Margin % = Gross profit Sales Revenue Income Statement Revenue Cost of sales Gross Profit 800 2,000 = 40% x 100 x 100 30.06.09 (£000s) £2,000 (£1,200) 800
- 8. Net Profit Margin Formula Margin % = Operating profit Sales Revenue x 100 The net profit margin should be compared with other competitors in the same market and over time Example Sales revenue Net Profit Net Margin Company A 150 50 20% Company A makes a higher net profit than company B, even though revenue is lower Company B 250 25 10% Company C 500 125 25% •Company C has the highest net profit margin •Indicates that it is doing well turning sales to profit •Is adding value to the production process
- 9. Return On Capital Employed (ROCE) Formula ROCE % = Operating profit Capital Employed x 100 Capital employed = total equity + non-current liabilities Evaluation Higher % is better Watch out for trends over time Considered the best measure of a firms size
- 10. Current Ratio Acid Test Ratio
- 11. Current Ratio Formula Current ratio = Current assets Current liabilities Example Balance Sheet Non-current assets Stocks Receivables (debtors) Cash Total current assets Payables (creditors) Current liabilities 200 250 = 0.8 Below 1 indicates cash problems (£000’s) 1,250 150 25 25 200 (250) (250) Evaluation Ratio of 1.5-2.00 suggests efficient management of working capital
- 12. Acid Test Ratio Formula Current ratio = Current assets - stock Current liabilities Example Balance Sheet Non-current assets Stocks Receivables (debtors) Cash Total current assets Payables (creditors) Current liabilities 200 - 150 250 = 0.2 Below 1 indicates liquidity problems (£000’s) 1,250 150 25 25 200 (250) (250) Evaluation A good warning sign of liquidity problems for businesses that hold stocks Less relevant for businesses with high stock turnover
- 13. Formula Gearing % = Non current liabilities Capital Employedx 100 Capital employed = total equity + non-current liabilities 2009 Non-current liabilities Net assets (1356) 4417 (1532) 4085 Share capital Reserves and retained earnings Example 2008 (2907) (1510) (2899) (1186) 4417 4085 Total equity 1356 4417 – 1356 x 100 1532 4085 – 1532 x 100 = 44% = 60%
- 14. Evaluation Focuses on the long term financial stability of the business Gearing above 50% suggests potential problems in financing It indicates it has borrowed a lot of money in relation to its capital Low gearing is below 25% It indicates a firm has raised most of its capital from shareholders Gearing may not be bad – often cheaper than equity If interest rates are low businesses may wish to take advantage
- 15. Asset turnover Stock turnover Debtor days Creditor days
- 16. Asset turnover Formula Asset turnover = Revenue Net assets Example Income Statement Revenue Net assets 30.06.09 (£000s) £2,000 600 2,000 600 = 3.3 times Evaluation Measures how well a company uses its assets to achieve revenue Takes no account of profit Average figure for UK business in 2007 was 3.3 High figure = business using assets well to achieve sales and vice versa
- 17. Stock turnover Formula Stock turnover = Cost of sales Average stock held Example Income Statement Revenue Cost of sales 1,200 150 = 8 times 30.06.09 (£000s) £2,000 £1,200 Balance Sheet Non-current assets Stocks 150 Evaluation Shows how quickly stock is converted to sales High figure = stock sold quickly The figure shows how many times in that year the firm sells its value of stock Here 8 times indicates this business sells its stock 8 times a year (8/365 = 45 days) Holding more stock may mean the business can improve customer service Seasonal fluctuations not accounted for Not relevant for all businesses i.e. retailers
- 18. Debtor days Formula Example 25 2,000 Debtor days = Trade debtors Revenue Balance Sheet Non-current assets Stocks Receivables (debtors) 150 25 Income Statement Revenue X 365 = 4.5 (5 days) x 365 30.06.09 (£000s) £2,000 Evaluation Shows the number of days it takes to convert debtors into cash Each industry will have a ‘norm’ Firms generally want to have a low value Marketing dept may wish to offer long credit terms Comparisons with competitors is useful
- 19. Creditor days Formula Example Creditor days = Trade payables Cost of sales Balance Sheet Non-current assets Stocks Receivables (debtors) Cash Total current assets Payables (creditors) 250 1200 x 365 = 76 days x 365 150 25 25 (250) Income Statement Revenue Cost of sales 30.06.09 (£000s) £2,000 (£1,200) Evaluation Shows the number of days it takes to pay back Generally the higher the better A very high figure may suggest liquidity problems Creditor days should exceed debtor days
- 20. Dividend per share Dividend yield
- 21. Dividend per share Formula Dividend per share £ = Total dividends paid Number of shares issued Example Number of shares issued Dividends paid 400 80 400 80 = £0.05p Evaluation Limited usefulness as it lacks context Basic calculation Does not reveal how much the shares cost to buy only the first stage of the calculation
- 22. Dividend yield Formula Dividend yield % = Dividend per share (p) Share price (p) Example Share price x 100 £0.50 0.05 0.50 = 10% Evaluation Good to compare with companies in the same sector Helps shareholders decide on investment Good to compare to other investment rates i.e. Banks, property, savings accounts etc
- 23. Managers Employees Shareholders Competitors Creditors Customers Suppliers Government TASK 3:Mind map these on your sheet
- 24. 1. How effective is stock control in a business 2. Are shareholders likely to be happy with their share of the profit? 3. Is the business likely to be able to avoid a liquidity problem in the short term if it can convert all of its liquid assets into cash? 4. Is the business able to pay its short term debts if its inventories become unfashionable and difficult to sell? 5. Is the business likely to experience a liquidity problem in the long run? 6. How successful is the business at generating profit? 7. How successful is the business at generating sales revenue? 8. How quickly is the business receiving money from customers who buy goods on credit? 9. Would shareholders receive more money from putting their savings elsewhere? 10. Are suppliers providing the business with good credit terms? Discuss in pairs and be ready to feedback
- 25. TASK 5: The three essay questions below are similar in nature. Pick one, use your books and notes and have a go at answering it Ratio analysis is of limited use because it shows the past and not the future. To what extent is this statement valid? (9 marks) How useful are profitability ratios in assessing the financial position of a business (10 marks) Discuss what value ratio analysis has in predicting future performance (12 marks)
Notes de l'éditeur
- Business Review:o Volume 9 Number 2 Nov 2002 – ‘Profitability Ratios’o Volume 9 Number 3 Feb 2003 – ‘Finance: Just a Game?’ (Working capital ratios)o Volume 13 Number 1 Sep 2006 – ‘Ratio analysis’.• http://news.bbc.co.uk/1/hi/programmes/working_lunch/7141959.stm Working Lunchdvd Series 9 Lesson 7 – ‘Deciphering Company Accounts’.
- Ratio analysis compares items listed on a single financial statement (vertical analysis) - for example - current assets in relation to current liabilities - or compares items listed on separate financial statements relating to a business in the same financial year - for example - expressing operating profit as a percentage of total capital (long-term debt and equity) employed. Liquidity (or solvency) ratios measure the amount of cash available to meet the business’s daily requirements ie they measure the ability of the business to meet debts as they fall due. The current ratio assesses the business’s liquidity position by comparing current assets to current liabilities. It measures how many current assets the firm has for every one current liability. It is calculated by dividing current assets by current liabilities and is expressed in the form of a ratio eg 2 to 1. The acid test ratio assesses the business’s liquidity position by comparing current assets excluding inventories (stocks), to current liabilities. It is calculated in the same way as the current ratio, ie by dividing current assets less inventories (stock) by current liabilities. Profitability ratios measure the ability of the business to generate profit. ROCE which stands for return on capital employed expresses the operating profit of the business as a percentage of the capital invested. It is calculated by dividing operating profit (or net profit before interest and tax) into the total capital employed in the business (total equity + non-current liabilities or owners / shareholders’ equity and any long-term loan capital) and multiplying by a hundred. Financial Efficiency ratios measure the ability of a firm to use or control the use of its assets. Asset turnover is a measurement of how many pounds worth of sales a business generates from the assets employed within the business. It is calculated by dividing the revenue (turnover) of the business into the figure for net assets and is expressed as number of times. Inventory (Stock) turnover measures the frequency with which a business sells and replenishes inventory (stock) within a year. It can be expressed as the number of times it takes inventory (stock) to turnover in a year or the number of days (or even weeks or months) inventory (stock) is held within the business. The former is calculated by dividing cost of sales by the average inventory (stock) held in the period. The latter is calculated by dividing the average inventory (stock) held by cost of sales and multiplying by 365 to give the number of days, or 52 to give a figure for the number of weeks, or 12 to give a figure for months.Payables’ (Credit) collection period measures the number of days it takes a business to pay any money owed to its suppliers (ie its creditors). It is calculated by dividing the average figure for payables (creditors) in the period by the value of purchase made on credit during the period (or cost of sales if this figure is not available) and multiplying by 365.Receivables’ (Debt) collection period measures the number of days it takes a business to collect any money owed by its customers (ie its debtors). It is calculated by dividing the average receivables (debtors) over the period by the value of sales made on credit over the period (or figure for revenue if this figure is not available) and multiplying the resultant figure by 365. Gearing ratios measure the extent to which a business is dependent on borrowed funds. It is most commonly calculated by dividing long-term debt / liabilities (or non-current liabilities) by the total capital employed in a business ie total equity plus non-current liabilities (or owners / shareholders equity + long-term debt finance) and multiplying by 100 to give a percentage. Shareholder ratios measure the ability of the business to generate a return to shareholders on their investment. Dividend per share measures the amount of money shareholders receive per share. It is calculated by dividing the total amount of dividends declared (or paid) by directors, with the number of shares issued, and is expressed as amount per share eg X pence per share. Dividend yield measures the rate of return a shareholder gets by comparing the market value of the shares with the dividend received. It is calculated by dividing the dividend per share paid to ordinary shareholders by the market price per share and multiplying by 100 to give a percentage.
- Profitability – sometimes described as performance ratios, compare profits with the size of the firmLiquidity – thesew show whether the firm is able to meet its short term liabilities. Need liquidity to pay debtsGearing – focuses on long term liquidity and shows whether a firms capital structure is able to meet interest paymentsFinancial Efficiency – firms management of working capital, used to assess the efficiency of the firm in management of its assets and short term liabilitiesShareholders ratios – drawing conclusions about whether shareholders will benefit from their shareholding in a company
- ManagersEmployees