06877 Topic Implicit Association TestNumber of Pages 1 (Doub.docx
Chaplowe - M&E Planning 2008 - shortcuts
1. Introduction
This edition of Short Cuts is intended to provide concise guidance needed
to develop a comprehensive monitoring and evaluation (M&E) system for
international humanitarian relief and development programs. It covers the
key planning documents and processes needed to set up and implement
an M&E system for project planning, implementation, and evaluation.
It is designed for use by M&E specialists, managers of humanitarian and
development programs, and decision makers who are responsible for
program oversight and funding.
The first four key components of M&E planning trace a logical train of
thought, from hypotheses on how the project will bring about change in a
specific sector, to the specific objectives needed for these changes, methods
for measuring the project’s achievement of its stated objectives, and protocols
for collecting and analyzing data and information used in the measurement.
The latter three components of M&E planning are key considerations for
implementing an M&E plan.
Keep in mind that M&E planning should begin during or immediately after
the project design stage and should involve stakeholders. Early planning will
inform the project design and allow sufficient time to arrange for resources
and personnel prior to project implementation. Involvement of project staff
and key stakeholders will ensure feasibility, understanding, and ownership of
the M&E system.
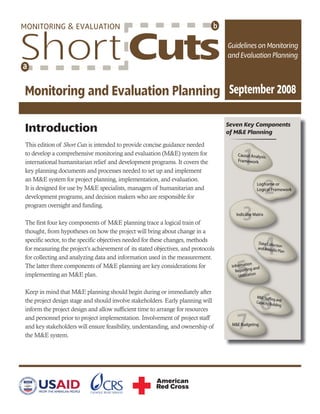
Seven Key Components
of M&E Planningf g
2. Monitoring and Evaluation Planning Page 2
The causal analysis framework seeks to identify the following:
The major problem and condition(s) that the project seeks to change1.
The factors that cause the condition(s)2.
The ways to influence the causal factors, based on hypotheses of the relationships between the causes and3.
likely solutions
The interventions to influence the causal factors4.
The expected changes or desired outcomes (see Table 1).5.
Table 1: Causal Analysis Framework
Causal Analysis Hypothesis Development Project Design
Cause/Conditions
Mothers do not know
that unclean water
will make infants sick
(knowledge).
IF mothers are aware of the dangers of
unclean water
Interventions
Educate mothers about the dangers of
unclean water
Mothers believe that
breastmilk alone does
not satisfy infants
younger than 6 months
(attitude).
AND that breastmilk is nutritionally
sufficient for infants younger than 6
months
Educate mothers about the nutritional
value of breastmilk for infants younger
than 6 months
Mothers are giving
breastmilk substitutes to
infants younger than 6
months (practice).
THEN they will breastfeed their infant
exclusively to avoid exposure to unclean
water
Desired Outcomes
Increased breastfeeding of infants younger
than 6 months
Problem
High diarrhea rates
among infants younger
than 6 months
THEREBY contributing to reductions in
diarrhea among infants younger than 6
months
Reduced diarrhea among infants younger
than 6 months
Consequence
High rates of infant
mortality
THEREBY contributing to reductions in
infant mortality
Overall Goal
Reduce infant mortality
Source: Author.
Causal Analysis Framework
3. The framework presented in Table 1 hypothesizes that mothers will breastfeed their infants once they
learn about the dangers of unclean water. However, if mothers are not breastfeeding for other reasons,
such as cultural norms or working away from home, then different interventions are needed. In effect,
the M&E system tests the hypotheses to determine whether the project’s interventions and outputs have
contributed to the desired outcomes.
Causal analysis should be based on a careful study of local conditions and available data as well as
consultation with potential beneficiaries, program implementers, other stakeholders, and technical
experts. Such information may be available in needs assessments, feasibility studies, participatory rapid
appraisals, community mapping, and other forms of analysis.
Other forms of analysis include problem analysis, such as problem trees, to isolate conditions and
consequences that help identify objectives and strategies, and theory of change analysis, which uses
backwards mapping to identify conditions required to bring about desired outcomes.
Monitoring and Evaluation Planning Page 3
A logframe or logical framework shows the conceptual foundation upon which the project’s
M&E system is built, identifying what the project is intended to achieve (objectives) and how
this achievement will be measured (indicators). Other frameworks can be used (such as a results
framework). The logframe is a valuable M&E planning tool and is widely used for development
projects. Table 2 defines the key terms and components of a classic logframe matrix. Note that
different organizations in the development community use different formats and terms for the types
of objectives.
Indicator selection is critical. Indicators should have validity (be able to measure the intended concept
accurately) and reliability (yield the same data in repeated observations of a variable); be easy to
interpret and explain; and be timely, cost-effective, and technically feasible. Indicators should also be
developed with consideration of donor requirements and any recognized industry standards.
It is also important to understand the logframe’s hierarchy of indicators. For instance, it is usually
easier to measure lower-level indicators such as the number of workshop participants, whereas the
higher-level indicators, such as behavioral change, typically require more analysis and synthesis of
information. This affects the M&E data collection methods and analysis and has implications for
staffing, budgets, and timeframe.
Logframe or Logical Framework
4. Monitoring and Evaluation Planning Page 4
Table 2: Logframe Definition Table
Project Objectives Indicators Means of Verification Assumptions
Goal
Simple clear statement
of the impact or results
that the project should
achieve
Impact Indicator
Quantitativeorqualitative
meanstomeasureachievement
ortoreflectthechanges
connectedtostatedgoal
Measurement method,
data source, and frequency
of data collection for stated
indicator
External factors necessary
to sustain the long-term
impact, but beyond the
project’s control
Outcomes
Set of beneficiary
and population-level
changes needed to
achieve the goal (usually
knowledge, attitudes
and practices, or KAP)
Outcome Indicator
Quantitative or qualitative
means to measure
achievement or to reflect the
changes connected to stated
outcomes
Measurement method,
data source, and frequency
of data collection for stated
indicator
External conditions
necessary if the outcomes
are to contribute to
achieving the goal
Outputs
Products or services
needed to achieve the
outcomes
Output Indicator
Quantitative or qualitative
means to measure
completion of stated outputs
(measures the immediate
product of an activity)
Measurement method,
data source, and frequency
of data collection for stated
indicator
Factors out of the project’s
control that could restrict
or prevent the outputs
from achieving the
outcomes
Activities
Regular efforts needed
to produce the outputs
Process Indicator
Quantitative or qualitative
means to measure
completion of stated activities
Measurement method,
data source, and frequency
of data collection for stated
indicator
Factors out of the project’s
control that could restrict
or prevent the activities
from achieving the
outcomes
Inputs
Resources used to
implement activities
(financial, materials,
human)
Input Indicator
Quantitative or qualitative
means to measure utilization
of stated inputs (resources
used for activities)
Measurement method,
data source, and frequency
of data collection for stated
indicator
Factors out of the project’s
control that could restrict
or prevent access to the
inputs
Source: Author based on an example from Caldwell (Project Design Handbook, 2002, 130).
The indicator matrix expands the logframe to identify key information requirements for each indicator
and summarizes the key M&E tasks for the project. The indicator matrix—also known as a data
collection plan or M&E plan—may have different formats, but the overall function remains the same.
Table 3 provides a sample format for an indicator matrix, with column definitions in the first row and a
sample indicator in the second row.
Indicator Matrix
5. Monitoring and Evaluation Planning Page 5
It is critical that the indicator matrix be developed with the participation of those who will be using it.
Completing the matrix requires detailed knowledge of the project and context to be provided by the
local project team and partners. Their involvement contributes to data quality because it reinforces their
understanding of what data they are to collect and how they will collect them.
Table 3: Indicator Matrix Example
Indicators Indicator
Definition
Methods /
Sources
Frequency /
Schedules
Person(s)
Responsible
Data
Analysis
Information
Use
Indicators
can be either
quantitative
(numeric) or
qualitative
(descriptive
observations)
and are
typically taken
directly from
the logframe.
Definekeyterms
inindicator
forprecise
measurement
andexplainhow
theindictorwillbe
calculated,i.e.,the
numeratorand
denominatorofa
percentmeasure;
alsonoteany
disaggregation,
i.e.,bysex,age,or
ethnicity
Identify
information
sources and
data collection
methods/tools
Indicate whether
data collection
tools (surveys,
checklists) exist
or need to be
developed
Identify how
often the data
will be collected,
i.e., monthly,
quarterly, or
annually
List start-up and
end dates for
data collection
and deadlines to
develop tools
Identify
the people
responsible
and
accountable
for data
collection/
analysis
List each
person’s
name and
position title
to ensure
clarity in case
of personnel
changes
Describe
process for
compiling
and analyzing
data, i.e.,
statistical
analysis
Identify intended
audience and
use of data, i.e.,
monitoring,
evaluation, or
reporting to
policy makers or
donors
State ways the
findings will be
formatted and
disseminated
Sample
Indicator
Outcome 1a
percent of
target schools
that successfully
conduct a
minimum of
one disaster
drill per quarter
1. “Schools”
refers to K-12 in
Matara District.
2. Criteria of
“Success”:
unannounced
drill through
early warning
system; response
time under 20
minutes, school
members report
to designated
area per the
School Crisis
Response Plan
3. Numerator:
# of schools
with successful
scenario per
quarter
4. Denominator:
total # of
targeted schools
1. Pre-arranged
site visits during
disaster drill
2. Complete
disaster drill
checklist &
entered into
quarterly project
report
3. School
focus group
discussions
(FGDs) (teachers,
students,
administration)
1. Checklist
data collected
quarterly
2. FGD: every 6
months
3. Begin data
collection on
4/15/06
4. Scenario
Checklist
completed by
3/8/06
School Field
Officer (SFO):
Shantha
Mande
1. Post-drill
meeting with
School Disaster
Committee,
facilitated by
SFO
2. Project
management
team during
quarterly
reflection
meeting
1. Project
implementation
with School
Disaster
Committees
2. Monitoring
school outreach
training with
management
with Sri Lankan
Red Cross Society
3. Tsunami
Recovery
Program
management
4. Impact
evaluation
to justify
intervention
to Ministry of
Disaster Relief,
donors, etc.
Source: Author.
6. Monitoring and Evaluation Planning Page 6
The data collection and analysis plan expands upon the information provided in the indicator matrix,
typically with a detailed narrative that explains how each type of data will be reliably collected with
sound research practices. Key plan components include: the unit of analysis; the link(s) between
indicators, variables, and questionnaires; the sampling frame and methodology; data collection timing
and mode; research staff responsibilities; enumerator selection, training and supervision; fieldwork
timing and logistics; data quality checks; data entry and storage; hypothesized relationships among
the variables; data analysis methods; and any special analyses, such as disaggregating data by gender,
age, or location and socio-economic status.
It is important to provide the rationale for the data collection and analysis methods. This includes the
triangulation of methods (quantitative and/or qualitative) and sources to reduce bias and ensure data
reliability and completeness. Planning should be informed by standards that guide good practice of
project evaluation and ensure ethical, accountable, and quality evaluations.
Some major data sources that should be described include any secondary data, sample surveys,
project output data, qualitative studies, checklists, external assessments–midterm and final
evaluations–and participatory assessments.
Practical considerations in data collection planning include:
Prepare data collection guidelines to ensure standardization, consistency, and reliability• over
time and among different people
Pretest data collection tools• to detect problematic questions or techniques, verify collection
times, identify potential ethical issues, and build the competence of data collectors
Train data collectors• to reliably understand the data collection system, collection techniques,
tools, ethics, and culturally appropriate interpersonal communication skills
Address ethical concerns• by identifying and responding to any concerns expressed by the target
population; ensure that the necessary authorization has been obtained, that customs and attire
are respected, and that confidentiality and voluntary participation are maintained
Plan for data management• , including the set of procedures, people, skills, and equipment
needed to systematically store and manage data to ensure that the data are reliably recorded.
A data analysis plan should identify:
Timing of data analysis: The data analysis is not an isolated event at the end of data collection,•
but an ongoing task from project start; it can be structured through meetings and other forums to
coincide with key project implementation and reporting benchmarks.
The extent to which analysis will be quantitative and/or qualitative, and any specialized skills and•
equipment required for analysis
Who will do the analysis – i.e., external experts, project staff, beneficiaries and/or other•
stakeholders
If and how subsequent analysis will occur, i.e., to verify findings, or to inform future programming.•
Data Collection and Analysis Plan
7. Monitoring and Evaluation Planning Page 7
An important consideration in planning for data collection and analysis is to identify any limitations,
biases, and threats to the accuracy of the data and analysis. Data distortion can occur due to limitations
or errors in design, sampling, field interviews, and data recording and analysis. To avoid data distortion,
it is best to monitor the research process carefully and seek expert advice, when needed.
Collecting information on project activities and achievements can serve many important functions,
such as improving the quality of services; ensuring accountability to beneficiaries, donors, and other
stakeholders; and advancing learning. Project reporting is closely related to M&E work, since data are
needed to support the major findings and conclusions presented in a project report. Often the focus
and frequency of M&E processes are determined by reporting requirements and schedules.
Practical considerations in information reporting and utilization planning include:
Design the M&E communication plan around the information needs of the users• : The
content and format of data reports will vary, depending on whether the reports are to be used
to monitor processes, conduct strategic planning, comply with requirements, identify problems,
justify a funding request, or conduct an impact evaluation.
Identify the frequency of data reporting needs• : For example, project managers may want to
review M&E data frequently to assess project progress and make decisions, whereas donors
may only need data once or twice a year to ensure accountability.
Tailor reporting formats to the intended audience• : Reporting may entail different levels of
complexity and technical language; the report format and media should be tailored to specific
audiences and different methods used to solicit feedback.
Identify appropriate outlets and media channels for communicating M&E data• : Consider
both internal reporting, such as regular project reports to management, and progress reports
to donors, as well as external reporting, such as public forums, news releases, briefings, and
Internet Web sites.
Staffing is a special concern for M&E work because it demands special training and a combination
of research and project management skills. Also, the effectiveness of M&E work often relies on
assistance from staff and volunteers who are not M&E experts. Thus, capacity building is a critical
aspect of implementing good M&E work. (See the Hiring M&E Staff, Preparing for an Evaluation, and
Capacity-Building Guidance ShortCuts and modules for further information on this topic.)
Information Reporting and Utilization
M&E Staffing and Capacity Building
8. Suggestions for ensuring adequate M&E support are to:
Identify the various tasks and related skills needed• , such as adequate data collection systems
in the field, research design, and data entry and analysis
Assess the relevant skills• of the project team, partner organizations, and the community
beneficiaries themselves
Specify to what extent local stakeholders will or will not participate in the M&E process•
(Table 4 identifies some of the potential advantages and disadvantages in participatory M&E.)
Assign specific roles and responsibilities to team members and designate an overall M&E•
manager
Recruit consultants, students, and others to fill in the skill gaps and special needs• such as
translation, statistical analysis, and cultural knowledge
Identify the topics for which formal training is needed and hold training sessions•
Encourage staff to provide informal training• through on-the-job guidance and feedback, such
as commenting on a report or showing how to use computer software programs
Give special attention to building local M&E capacity.•
Monitoring and Evaluation Planning Page 8
Table 4: Participatory M&E
Potential Advantages Potential Disadvantages
Empowers beneficiaries to analyze and act on their•
own situation (as “active participants” rather than
“passive recipients”)
Builds local capacity to manage, own, and sustain•
the project as people are likely to accept and in-
ternalize findings and recommendations that they
provide
Builds collaboration and consensus at different•
levels—between beneficiaries, local staff and part-
ners, and senior management
Reinforces beneficiary accountability, preventing•
one perspective from dominating the M&E process
Saves time and money in data collection compared•
with the cost of using project staff or hiring outside
support
Provides timely and relevant information directly•
from the field for management decision making to
execute corrective actions
Requires more time and cost to train and manage•
local staff and community members
Requires skilled facilitators to ensure that everyone•
understands the process and is equally involved
Can jeopardize the quality of collected data due to•
local politics; data analysis and decision making can
be dominated by the more powerful voices in the
community (related to gender, ethnic, or religious
factors)
Demands the genuine commitment of local people•
and the support of donors, since the project may not
use the traditional indicators or formats for reporting
findings
9. A key function of planning for M&E is to estimate the costs, staff, and other resources that are needed
for M&E work. It is important for M&E specialists to weigh in on M&E budget needs at the project
design stage so that funds are allocated specifically to M&E and are available to implement key M&E
tasks.
Program managers often ask what proportion of a project’s budget should be allocated to M&E. There
is no set formula; various donors and organizations recommend that between 3 to 10 percent of a
project’s budget be allocated to M&E. A general rule of thumb is that the M&E budget should not be
so small as to compromise the accuracy and credibility of results, but neither should it divert project
resources to the extent that programming is impaired.
Suggestions for building a realistic budget:
List all M&E tasks and overall responsibilities, analyze the necessary items associated with•
each task, and determine their cost
Budget for staffing,• including full-time staff, external consultants, capacity building/training and
other human resource expenses
Ensure that the budget includes all capital expenses,• including facility costs, office equipment
and supplies, travel and lodging, computer hardware and software, and other expenses
Determine whether all tasks are covered in the overall project budget• , such as support for an
information management system, field transportation and vehicle maintenance, translation, and
publishing M&E documents/tools
Review the donor’s requirements to determine whether there are any extra items that need to•
be budgeted, or conversely, that the donor can fund directly
Allow for unexpected contingencies• such as inflation, currency devaluation, equipment theft, or
the need for additional data collection/analysis to verify findings
Write a narrative explaining each line item• to clarify or justify expenses; this budget justification
may help to guard against arbitrary budget cuts.
Monitoring and Evaluation Planning Page 9
This edition of Short Cuts was produced in
2008. Please send your comments or feedback
to: m&efeedback@crs.org.
Budgeting for M&E
10. This publication is part of a series on key aspects of monitoring and evaluation (M&E) for
humanitarian and socioeconomic development programs. The American Red Cross and Catholic
Relief Services (CRS) produced this series under their respective USAID/Food for Peace
Institutional Capacity Building Grants. The topics covered were designed to respond to field-
identified needs for specific guidance and tools that did not appear to be available in existing
publications. Program managers as well as M&E specialists are the intended audience for the
modules; the series can also be used for M&E training and capacity building. The Short Cuts series
provides a ready reference tool for people who have already used the full modules, those who simply
need a refresher in the subject, or those who want to fast-track particular skills.
The M&E series is available on these Web sites:
www.crs.org/publications•
www.foodsecuritynetwork.org/icbtools.html•
www.redcross.org•
Author: Scott G. Chaplowe, American Red Cross
Based on the full module by: Scott G. Chaplowe, American Red Cross
Series Editor: Guy Sharrock
Readers/Editors: Cynthia Green, Joe Schultz, Dina Towbin
Graphic Designers: Guy Arceneaux, Ephra Graham
Monitoring and Evaluation Planning Page 10
11. The M&E modules and Short Cuts series were produced by CRS and the American Red Cross with
financial support from U.S. Agency for International Development Food for Peace grants: CRS
Institutional Capacity Building Grant (AFP-A-00-03-00015-00) and American Red Cross Institutional
Capacity Building Grant (AFP-A-00-00007-00). The views expressed in this document are those of
the author and do not necessarily represent those of the U.S. Agency for International Development
or Food for Peace.