To Make Graphs Such as Scatter Plots Numerically Readable (PacificVis 2018, Kobe, Poster)
•
1 j'aime•180 vues

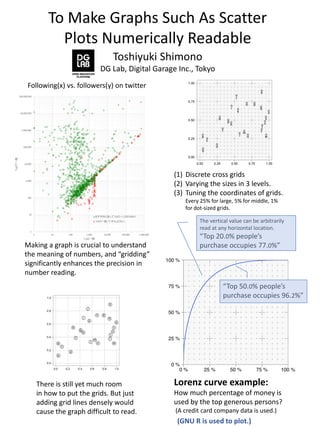
The document discusses methods for making graphs with scatter plots numerically readable by adding grid lines. It presents an example of a Lorenz curve graph with credit card purchase data. Adding grid lines at varying densities, such as every 25% for large spacing, 5% for medium, and 1% for fine spacing, can significantly improve the precision of reading numerical values from the graph. Proper gridding enhances readability without overcrowding the graph.

Recommandé
Contenu connexe
Tendances
Tendances (20)
Similaire à To Make Graphs Such as Scatter Plots Numerically Readable (PacificVis 2018, Kobe, Poster)
Similaire à To Make Graphs Such as Scatter Plots Numerically Readable (PacificVis 2018, Kobe, Poster) (10)
Plus de Toshiyuki Shimono
Plus de Toshiyuki Shimono (20)
Dernier
Dernier (20)
To Make Graphs Such as Scatter Plots Numerically Readable (PacificVis 2018, Kobe, Poster)
- 1. To Make Graphs Such As Scatter Plots Numerically Readable Toshiyuki Shimono DG Lab, Digital Garage Inc., Tokyo Lorenz curve example: How much percentage of money is used by the top generous persons? (A credit card company data is used.) The vertical value can be arbitrarily read at any horizontal location. “Top 20.0% people’s purchase occupies 77.0%” “Top 50.0% people’s purchase occupies 96.2%” Following(x) vs. followers(y) on twitter Making a graph is crucial to understand the meaning of numbers, and “gridding” significantly enhances the precision in number reading. There is still yet much room in how to put the grids. But just adding grid lines densely would cause the graph difficult to read. Index NA a b c d e f g h i j k l m n o p q r s t u v w x 0.00 0.25 0.50 0.75 1.00 0.00 0.25 0.50 0.75 1.00 (1) Discrete cross grids (2) Varying the sizes in 3 levels. (3) Tuning the coordinates of grids. Every 25% for large, 5% for middle, 1% for dot-sized grids. (GNU R is used to plot.)
- 2. How much percentage of money is used by the top paying persons by credit cards? The vertical value can be arbitrarily read at any horizontal location. “Top 20.0% people’s purchase occupies 77.0%” “Top 50.0% people’s sales occupies 96.2%” To Make Graphs Such As Scatter Plots Numerically Readable Toshiyuki Shimono, Digital Garage. Lorenz curve example This graph is *an example* to show how precisely you can read the coordinates. “3-layered gridding in background” helps you read the coordinates in a graph. (The gridding here plays the scaling marks of 25%, 5%, 1%. ) This page is for the 30-seconds speech.
Notes de l'éditeur
- Normal statistical graphs lack the numerical readability as of now. I conceived a new method for reading the number of coordinates of any point on a curve by the means of background latticed gridding. Now you can read the coordinates with the error less than as few as 0.5% for this graph with the help of cross grids. I want to propagate this kind of drawing method for analysis tasks.