1. HIPPOCAMPUS 00:000–000 (2010)
RAPID COMMUNICATION
Layer-Specific Alterations to CA1 Dendritic Spines in a
Mouse Model of Alzheimer’s Disease
P. Merino-Serrais,1 S. Knafo,1,2* L. Alonso-Nanclares,1 I. Fernaud-Espinosa,1 and J. DeFelipe1
ABSTRACT: Why memory is a particular target for the pathological et al., 2009a, in press). Apart from amyloid plaques,
changes in Alzheimer’s Disease (AD) has long been a fundamental ques- the Ab peptide accumulates in different forms in AD:
tion when considering the mechanisms underlying this disease. It has
been established from numerous biochemical and morphological studies intracellular Ab and oligomeric Ab. Indeed, it has
that AD is, at least initially, a consequence of synaptic malfunction been demonstrated that spine heads are targets of
provoked by Amyloid b (Ab) peptide. APP/PS1 transgenic mice accumu- oligomeric Ab (Lacor et al., 2007), and it has been
late Ab throughout the brain, and they have therefore been employed to suggested that targeting and functional disruption of
investigate the effects of Ab overproduction on brain circuitry and particular synapses by Ab oligomers may provide a
cognition. Previous studies show that Ab overproduction affects spine
morphology in the hippocampus and amygdala, both within and outside molecular basis for the specific memory loss in AD
plaques (Knafo et al., (2009) Cereb Cortex 19:586-592; Knafo et al., (Lacor et al., 2007). Nevertheless, previous studies
(in press) J Pathol). Hence, we conducted a detailed analysis of dendri- indicate that there is only a weak correlation between
tic spines located in the stratum oriens and stratum radiatum of the plaque load and cognitive functions (Terry et al.,
CA1 hippocampal subfield of APP/PS1 mice. Three-dimensional analysis 1991). In fact, plaques are sometimes detected even in
of 18,313 individual dendritic spines revealed a substantial layer-specific
decrease in spine neck length and an increase in the frequency of spines nondemented patients (Price et al., 2009) and cogni-
with a small head volume. Since dendritic spines bear most of the tive decline is better reflected by the level of soluble
excitatory synapses in the brain, changes in spine morphology may be Ab oligomers, distributed diffusely outside the plaques
one of the factors contributing to the cognitive impairments observed in (Selkoe, 2002). Moreover, at least in aged mice
this AD model. V 2010 Wiley-Liss, Inc.
C
bearing AD mutations, plaques occupy a negligible
KEY WORDS: morphology; confocal microscopy; amyloid beta;
fraction of the neuropil, less than 5% (Cohen et al.,
unbiased stereology; amyloid precursore protein 2009;Knafo et al., 2009a, in press), and therefore, it
is unlikely that cognitive impairment in these mice
arises solely from changes in synapses within the
plaques. Hence, AD neuropathological research is
INTRODUCTION increasingly focusing on the changes in plaque-free
regions of the neuropil and in AD-like pathology
The presence of Ab plaques is one of the pathological hallmarks of prior to plaque appearance. Here we have analyzed
AD, and they have been associated with changes in neurite morphology dendritic spines in the CA1 subfield, an area critical
and dendritic spine density (Tsai et al., 2004; Spires et al., 2005; Knafo for spatial orientation and learning (Andersen et al.,
2006), in order to determine the microstructural basis
1 of the hippocampal-dependent cognitive impairment
Instituto Cajal (CSIC), Madrid, Spain and Laboratorio de Circuitos Cor-
´ ´ ´
ticales, Centro de Tecnologıa Biomedica, Universidad Politecnica de in APP/PS1 mice (Malm et al., 2007). Dendritic
Madrid, Madrid, Spain; 2 Centro de Biologıa Molecular ‘‘Severo Ochoa’’,
´ spines represent the major postsynaptic elements of
´
Consejo Superior de Investigaciones Cientıficas (CSIC)-Universidad excitatory synapses in the cerebral cortex (Gray, 1959)
´
Autonoma de Madrid, Madrid, Spain and they are fundamental to memory, learning and
Additional Supporting Information may be found in the online version of
this article. cognition (Lamprecht and LeDoux, 2004). Dendritic
P. Merino-Serrais and S. Knafo contributed equally to this work. spines undergo remarkable activity-dependent struc-
Grant sponsor: CIBERNED; Grant number: CB06/05/0,066; Grant spon- tural changes (Lang et al., 2004; Tsai et al., 2004)
sor: EU 6th Framework Program; Grant number: PROMEMORIA LSHM- and they are targets of oligomeric Ab (Lacor et al.,
´
CT-2,005–512012; Grant sponsor: Spanish Ministerio de Educacion Cien- 2007). Therefore, spine morphology may be associ-
´
cia e Innovacion; Grant numbers: BFU2006–13395, SAF2009–09394,
´
BES-2,007–16542; Grant sponsors: Fundacion CIEN (Financiacion de ´ ated with Ab pathology and synaptic malfunction. We
´
Proyectos de Investigacion de Enfermedad de Alzheimer y enfermedades show that in APP/PS1 mice, CA1 spines necks are sig-
relacionadas 2008), Ministry of Science and Technology. nificantly shorter in the stratum oriens. In addition,
´
*Correspondence to: Dr S. Knafo, Centro de Biologıa Molecular ‘‘Severo the frequency of spines with a small head augments in
´
Ochoa’’, Consejo Superior de Investigaciones Cientıficas (CSIC)-Universi- the same stratum radiatum of the same subfield. These
´
dad Autonoma de Madrid, Madrid, Spain. E-mail: sknafo@cbm.uam.es
Accepted for publication 25 June 2010 findings indicate that circuits in the stratum radiatum
DOI 10.1002/hipo.20861 and the stratum oriens might be affected differently by
Published online in Wiley Online Library (wileyonlinelibrary.com). AD-related mutations. In addition, this study suggests
V 2010
C WILEY-LISS, INC.
2. 2 MERINO-SERRAIS ET AL.
that dendritic spine morphology reflects the synaptic malfunc- tracing. To assess the morphology of spines, a solid surface that
tion arising from Ab overexpression. exactly matched the contours of the head was constructed for
We used a transgenic mouse line (12 to 14-month-old male each spine using Imaris (Fig. 1i), and the length of the spine
mice) expressing a Mo/Hu APP695swe construct in conjunc- neck was measured manually in three-dimensions using the
tion with the exon 9 deleted variant of human presenilin 1 same software (Isosurface module, see detailed methods). To
(PS1-dE9: (Scheuner et al., 1996). Age-matched littermates estimate the density of plaques, plaques were immunostained
served as controls (Tg-). The mice were perfused with 4% with an anti-Ab antibody in serial sections taken from the
paraformaldehyde and coronal sections of the fixed brain were same mice, and unbiased stereology rules were applied using
obtained. A total of 270 pyramidal neurons from Tg2 mice optical fractionation and the Nucleator probe (Moller et al.,
and 262 neurons from APP/PS1 mice were microinjected 1990). For all the morphological parameters measured, the val-
individually with Alexa594 (Invitrogen, Eugene, OR, ues were averaged to give a neuron mean, and neurons from
Figs. 1a,b), and plaques were counterstained with thioflavin-s each animal were averaged for the animal mean. Normality was
after injection (Figs. 1a–c). The plaques and dendrites in the tested using the Kolmogorov-Smirnov test and a two-tailed
stratum oriens (corresponding to basal dendrites) and in the unpaired t-test was used to test for the overall effect. When
stratum radiatum (collateral apical dendrites) were scanned with more than two groups were compared, a one-way ANOVA was
a Leica laser scanning multispectral confocal microscope (TCS used, followed by Tukey’s Multiple Comparison post hoc test.
SP5) using 488 and 594 nm laser lines. Image stacks (Physical Data are presented as the mean 6 SEM.
size 76.9 3 76.9 lm, logical size 1,024 3 1,024 pixels) con- We examined 1,475 amyloid plaques and 532 injected
sisted of 100–350 image planes. A 633 Glycerol-immersion pyramidal neurons by confocal microscopy (Fig. 1a). We
lens (NA, 1.3; working distance, 280 lm; refraction index, encountered only five dendrites that passed within plaques in
1.45) was used with a calculated optimal zoom factor of 3.2 the stratum oriens (basal dendrites) and no such dendrites in
and a z-step of 0.14 lm (voxel size, 75.1 3 75.1 3 136.4 the stratum radiatum (apical dendrites). Typical plaques that
nm). These settings and optics represent the highest resolution were positive for thioflavin-s consisted of a core surrounded by
currently possible with confocal microscopy. After acquisition, a diffuse less dense ring. The dendrites passing through the pla-
the stacks were processed over 10 iterations with a three-dimen- ques were located in the diffuse peripheral ring, as described
sional blind deconvolution algorithm (Autodeblur; Autoquant, previously (Cruz et al., 1997; Knafo et al., 2009a, in press).
Media Cybernetics) to reduce the out-of-focus light, and Dendrites were categorized according to their location with
thereby removing the haze and the blur, restoring vital details respect to the Ab plaques, as: (1) dendrites from transgene-
to the datasets (Supporting Information Fig. 1b). The stacks negative (control) mice (Tg-); (2) dendrites located in a
were then opened with Imaris 6.0 (Bitplane AG, Zurich, Swit- plaque-free area (Plaque-free); (3) segments of dendrites within
zerland), a three-dimensional image processing software. In a plaque (Plaque).
stacks containing images of Ab plaques (green), the green chan-
nel was deleted and the stacks were coded (the codes were not
broken until the quantitative analysis had been completed). Spines Have a Shorter Neck in Plaque-Free
Spine density measurements and their morphology were Regions of the Stratum Oriens of APP/PS1 Mice
assessed by another investigator using only the red channel to The spine density in the stratum oriens was significantly
assure impartiality (Figs. 1f,i). For spine density measurements, different among the three categories of dendrites (P 5 0.006,
image stacks were viewed with a computerized data collection one-way ANOVA, Fig. 1d). Accordingly, the spine density was
system (Neurolucida 7.1 Confocal module; MicroBrightfield, significantly lower within plaques than in other categories of
Inc., Williston, VT), the image of the acquired dendrites was dendrites (0.85 6 0.17 spines/lm, N 5 4). However, spine
traced in three-dimensions and the spines were marked during density for Plaque-free dendrites (1.33 6 0.054, N 5 7) did
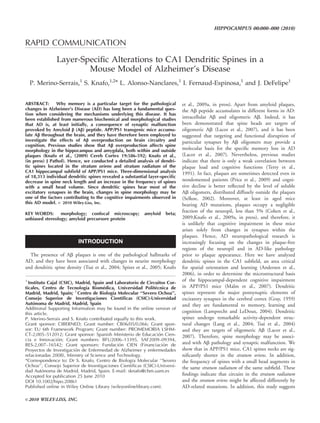
FIGURE 1. Spines are shorter in the stratum oriens of APP/ in Tg- and APP/PS1 mice in plaque-free regions. Note the similar-
PS1 mice. (a) A panoramic view of neurons injected with Alexa ity in spine density along the length of the dendrite. (f ) Represen-
594 (red) and thioflavin-s positive plaques (green) in the hippo- tative projection images of dendrites from Tg- and APP/PS1 mice
campus (203, oil). (b) Representative projection images (403, oil) (633, glycerol). Necks are marked as was done for measurements
of injected neurons and plaques in Tg- (left) and APP/PS1 mice (g) Decreased average neck length for spines in APP/PS1 mice
(right). The plaques seen in the stratum radiatum (apical outside plaques. (h) Cumulative frequency plots showing the dis-
dendrites) are located close to labeled dendrites but they do not tribution of spine neck length, indicating a shift towards lower
contain dendrites, as determined by three-dimensional analysis. values in the entire spine population. (i) Representative images
(c) An example of a dendrite located in the stratum oriens passing of dendritic segments with the contours of the spine heads of
through a plaque and showing a decrease in spine density within APP/PS1 mice constructed for each spine (see Supporting Infor-
the plaque. (d) Spine density is decreased significantly within the mation Fig. 1 for details). (j-k) The head volume is similar for Tg-
plaques. Note that the spine density is similar in Tg- mice and in and APP/PS1 mice. *P < 0.05, Tukey’s Multiple Comparison post
the plaque-free areas of APP/PS1 mice. (e) The spine density as a hoc test. Scale bar, (a) 250 lm, (b) 25 lm, (c) 5 lm (f ) 0.6 lm (i)
function of the distance from the soma (Sholl Analysis) is similar 0.8 lm.
Hippocampus
4. 4 MERINO-SERRAIS ET AL.
FIGURE 2. Increased frequency of spines with a small head in spine neck length, indicating a similar distribution for both spine
the stratum radiatum of APP/PS1 mice. (a) Representative projection populations. (f) The frequency of small spines increases substantially
images of dendrites from Tg- and APP/PS1 mice (633, glycerol). (b) in plaque-free areas of APP/PS1 mice. (g) Cumulative frequency
The spine density is similar in Tg- mice and in the plaque-free areas curves showing a shift towards smaller head volumes in APP/PS1
of APP/PS1 mice. (c) Spine density as a function of distance from mice. (h) A bar graph depicting a significant increase in the frequency
apical trunk is similar in Tg- mice and APP/PS1 mice in plaque-free of small spines (volume < 0.03 lm3) in the stratum radiatum of
regions. (d) Constant average neck length for spines in APP/PS1 APP/PS1 mice. Scale bar, 0.6 lm.
mice. (e) Cumulative frequency plots showing the distribution of
not differ significantly from that of control (Tg-) dendrites among the two categories of dendrites (P 5 0.88, t-test,
(1.348 6 0.070, N 5 6). Moreover, a Sholl analysis of the Figs. J,k), and was 0.056 6 0.003 lm3, for Tg- dendrites (N 5
spine density at different distances from the soma revealed that 6, 5,709 spines) and 0.055 6 0.003 lm3 for plaque-free
the spine density for Plaque-free dendrites was similar to that dendrites (N 5 7, 5,145 spines). Thus, in the stratum oriens
of control dendrites over their entire length (Fig. 1e). of APP/PS1 mice, spine density is decreased within plaques and
Spine neck length and head volume were measured in three spines are shorter outside plaques.
dimensions in confocal image stacks. Because of the extensive
loss of spines within plaques, the spines within plaques (31
Small-Headed Spines Are More Frequent
spines) were not included in the analysis of head and neck
in Plaque-Free Regions of the Stratum
dimensions. Significant differences in the average spine neck
Radiatum of APP/PS1 Mice
length were found between the two dendritic categories (P 5
0.018, t-test, Figs. 1g,h). Spines in the APP/PS1 mice had a Spine density and morphology were examined in apical
significantly shorter neck (26%) than spines in Tg- mice spines branches protruding from the main apical trunk. These den-
(0.548 6 0.040). Head volume was not significantly different drites were located up to 300 lm from the stratum pyramidale
Hippocampus
5. ALTERED SPINES IN APP/PS1 MICE 5
(cell body layer). Dendrites located in the stratum lacunosum- TABLE 1.
moleculare were not included in the analysis. The average spine
density along the apical dendrites in the stratum radiatum did Plaque Volume and Density
not differ significantly in APP/PS1 mice when compared with
S. Oriens S. Radiatum
the control mice (1.71 6 0.08 for Tg- mice and 1.83 6 0.08
Parameter (N 5 4) (N 5 5)
for APP/PS1 mice: P 5 0.62, student t-test; Figs. 2a,b). A
Sholl analysis revealed that the density of spines on Plaque-free Estimated total number of plaques 1551 6 272.6 1985 6 183.8
dendrites was not significantly different to that of control (Tg-) Plaque density (plaque/mm3) 1138 6 214.4 1174 6 113.0
dendrites over their entire length (Fig. 2c). By contrast to Individual plaque volume (lm3) 0.019 6 0.002 0.029 6 0.003
the stratum oriens, the neck length was similar in both groups Volume occupied by plaques (%) 1.421 6 0.201 1.554 6 0.195
(P 5 0.43, t-test, Figs. 2d,e), as it was 0.519 6 0.017 lm for
Tg- dendrites and 0.494 6 0.024 lm in APP/PS1 mice. The
average head volume in this layer did not differ significantly whereas the neck was significantly shorter in the stratum ori-
between Tg- dendrites (0.038 6 0.003 lm3: N 5 6; 4,437 ens of APP/PS1 mice. Moreover, spines in the stratum oriens
spines) and plaque-free regions (0.033 6 0.003 lm3: N 5 7; are affected differently to spines in stratum radiatum, even
6,044 spines. P 5 0.29, t-test, Fig. 2f ). Nevertheless, the within the CA1. These layer-specific morphological altera-
cumulative frequency curves clearly indicated a distinct distri- tions are underscored by the fact that Ab plaques occupy a
bution of head volumes in the smaller values (Fig. 2g) and similar total volume of both layers (Table 1), implying a sim-
indeed, a significant increase (29%, P 5 0.01, t-test) in the ilar Ab load. Thus, we conclude that AD-related mutations
frequency of small-headed spines (head volume < 0.03 lm3) have distinct effects on spines depending on their location.
was evident in the plaque-free areas of APP/PS1 mice We also show here that dendrites within plaques are deficient
(Fig. 2h). Thus, we found an increase in the frequency of in spines, in accordance with observations in other brain
small-headed spines in the stratum radiatum of APP/PS1 mice. regions (Tsai et al., 2004; Knafo et al., 2009a, in press).
Spine loss within Ab plaques can affect local synaptic cir-
cuits. However, since plaques occupy a minor fraction of the
Amyloid Plaques Occupy a Small
CA1 (below 2%), the morphological changes observed out-
Fraction of the CA1
side plaques are more likely to contribute to the synaptic and
We have described changes in dendritic spines within and cognitive impairments found in APP/PS1 mice (Malm et al.,
outside of plaques that can affect local synaptic circuits. To 2007). We also found that spine density outside plaques is
quantitatively determine the impact of plaques on CA1 connec- unchanged in APP/PS1 mice, in accordance to our previous
tivity, we immunocytochemically stained Ab plaques in serial studies into the dentate gyrus and amygdala (Knafo et al.,
sections of APP/PS1 brains (Supporting Information Fig. 2). 2009a, in press). These findings imply that cognitive impair-
Using unbiased stereology, we then determined the total ment in these mice (Malm et al., 2007) does not arise from
number of plaques and their volume in the stratum oriens and changes in spine density in plaque-free areas. Rather, it is
stratum radiatum, from which we could calculate the total likely that changes in spine morphology outside plaques con-
volume occupied by the plaques. The estimated total number tribute to these cognitive deficits.
of CA1 plaques per mouse in one hemisphere was 1,551 6 The data presented here shows that the average spine neck
272.6 (range, 1,045–2,081 plaques/mouse; N 5 4: Table 1) in length is shorter in the stratum oriens of APP/PS1 mice, both
the stratum oriens and 1985 6 183.8 (range 1,533–2,628 within and outside of the plaques. The morphology of the
plaques/mouse, N 5 5) in the stratum radiatum. The density spine neck fulfils a key role in controlling the time window
of plaques in the stratum oriens was 1,138 6 214.4 plaques/ compartmentalization of calcium and other second messengers
mm3, while it was 1,174 6 113.0 plaques/mm3 in the stratum in spines (Yuste et al., 2000). The shortening of the spine neck
radiatum (Table 1). The average plaque volume was 0.019 6 in APP/PS1 mice may increase the diffusion between the
0.002 mm3 in the stratum oriens and 0.029 6 0.0,029 mm3 in spine and the dendrite. Spines with a fast diffusion equili-
the stratum radiatum (P 5 0.04, t-test). The estimated volume bration along the spine neck may be unable to retain second
occupied by Ab plaques was 1.421 6 0.201% in the stratum messengers or activate proteins upon the LTP inducing stimu-
oriens and 1.554 6 0.195% in the stratum radiatum (Table 1). lus (Bloodgood and Sabatini, 2005). This altered plasticity
These results suggest that under our experimental conditions, Ab may eventually contribute to the cognitive impairment seen in
plaques occupy a relatively small fraction of the CA1 neuropil. APP/PS1 mice (Malm et al., 2007).
This study shows that dendritic spines in the CA1 subfield are We also found that APP/PS1 mice have a higher proportion
significantly affected by Ab, both within plaques and in plaque- of spines with a small head volume in the stratum radiatum.
free regions. Importantly, some changes in spine morphology in Importantly, small spines are more abundant after processes
this region were not evident in the dentate gyrus (Knafo et al., of long-term depression (LTD), a form of synaptic plasticity
2009a) or the amygdala (Knafo et al., 2009b) when studied significantly enhanced in many models of AD (Shankar et al.,
with the same tools. For example, no significant differences 2008). Spine head size determines the size and duration of
were found in the length of spine neck in these regions, synaptic Ca21 transients (Majewska et al., 2000) and it is
Hippocampus
6. 6 MERINO-SERRAIS ET AL.
therefore correlated with the magnitude of signals transmitted Spine density
to the dendritic shaft (Harris and Stevens, 1989; Murthy et al.,
Dendritic spine density was determined by tracing the
2000). Spines with smaller heads have smaller postsynaptic
image of the acquired dendrites in three dimensions (with
densities (Harris and Stevens, 1989) and contain less AMPA
Neurolucida). Spines were marked during tracing and all pro-
receptors on their heads when compared to spines with larger
trusions were considered as spines, applying no correction fac-
heads (Kharazia and Weinberg, 1999), resulting in less sensitiv-
tors to the spine counts. After tracing all the dendrites, each
ity to glutamate at these spines (Matsuzaki et al., 2001). It is
2-channel stack (containing the green channel with amyloid
therefore possible that the increase in the frequency of small-
plaques) was viewed with Imaris and we determined whether
headed spines reflects long-term synaptic depression, thereby
a dendrite entered a plaque (Knafo et al., 2009a). The traced
contributing to the cognitive impairment seen in this AD
dendrites were viewed with Neurolucida and the correspond-
model. Moreover, it is possible that the greater frequency of
ing stack with the green channel was opened. The traced den-
spines with large heads in this layer reflects the loss of LTP
drites were categorized as dendrites that passed through an
in APP/PS1 mice (Trinchese et al., 2004). Therefore, the
amyloid plaque, or dendrites whose entire length was in a pla-
laminar specific changes observed in spine length might have
que-free area. The reconstructed data were exported to Neuro-
an important functional consequence in certain hippocampal
lucida Explorer (MicroBrightField Inc., Williston, VT) for
circuits. In summary, we show here that spines in the CA1 are
quantitative analysis. Spine density was calculated for each
morphologically modified, which may reflect the functional
dendrite by dividing the dendritic length by the number of
alterations at synapses induced by Ab overexpression in APP/
spines. Spine density was also analyzed as a function of its dis-
PS1 mice.
tance from its origin (Sholl analysis), dividing the length of
the dendritic segment by the number of spines in each 10 lm
stretch from the origin.
DETAILED METHODS
Head volume measurement
Intracellular Injections With Alexa 594 Intensity thresholds were applied to each dendritic segment
Mice were anesthetized with pentobarbital (0.04 mg/kg) to generate a model of the data that was visualized as a solid
and transcardially perfused with 20 ml phosphate buffer (PB) surface (the Spot module, Imaris). With this module, volume
followed by 100 ml of 4% paraformaldehyde (pH 7.4) based measurements are added to the volume rendering. The
prepared in the same buffer. The brains were postfixed in the Spots module models point-like structures in the data (e.g.,
same solution for 24 h, and coronal sections (150 lm) dendritic spines) providing a procedure to automatically detect
were obtained on a vibratome and labeled with 10–5 M 4,6- such structures, an editor to manually correct any errors
diamidino-2-phenylindole (DAPI, Sigma D9542). Pyramidal detected, a viewer to visualize the point-like structures as
neurons in CA1 were injected individually with Alexa594 spheres, and a statistics output that includes the volume of the
(Invitrogen, Eugene, OR) by passing a steady hyper- spine heads (Supporting Information Fig. 1b). A solid surface
polarizing current through the electrode (0.5 to 21.0 nA, that exactly matched the contours of the head was created for
Figs. 1a,b). The current was applied until the distal tips of each dendritic spine (Fig. 1i). The image of each dendrite was
each neuron fluoresced brightly. then rotated in three dimensions and examined to ensure that
the solid surface created for each spine head was correct. Head-
less spines were extremely rare and they were not included in
the analysis. Having taken the measurements, the 2-channels
Morphology stacks were opened to view the plaques and the spines were
Confocal microscopy categorized according to their location (within or outside of
plaques). As described previously in an electron microscopy
For each pyramidal neuron (5–7 neurons from each mouse, study of hippocampal dendritic spines (Trommald and Hulle-
6–7 mice per group), 1–5 randomly selected dendrites were berg, 1997), we did not observe a multimodal distribution for
scanned from the soma (basal dendrites) or apical trunk (apical neck length or for head volume (Fig. 1–2). Consequently, we
dendrites) to the tip (125 dendrites total). In APP/PS1 mice, were unable to identify spine groups such as thin, stubby or
dendrites located within the plaques were also scanned. For mushroom (Harris et al., 1992). Therefore, we chose to
each stack, the laser intensity and detector sensitivity were set describe spine morphology using measured dimensions rather
so that the fluorescence signal from the spines occupied the full than shape categories.
dynamic range of the detector. Therefore, while scanning, some
pixels were saturated in the dendritic shaft but no pixels
Neck length measurement
were saturated in the spines. In stacks containing images of Ab
plaques (green) the green channel was deleted. The stacks were To measure the neck length, each dendrite was visualized
coded and the codes were not broken until the quantitative with the Volume mode of Imaris. Individual spine necks were
analysis had been completed. measured manually in three dimensions from the interface of
Hippocampus
7. ALTERED SPINES IN APP/PS1 MICE 7
the spine neck with the dendritic stalk to the beginning of the To estimate the plaque volume after each amyloid plaque
spine head (MeasurementPro module) while rotating the was marked, the edges the plaque were marked with the Nucle-
dendritic image (Knafo et al., 2009a). If the spine head was ator probe (Moller et al., 1990). The number of labeled
connected directly to the dendritic stalk, the neck length was plaques was estimated using the optical fractionator method in
recorded as zero. As the resolution in the z axis is significantly Stereo Investigator. Plaques were marked only if their edges lay
lower than in the x-y axes, spines protruding perpendicular to within the dissector area and they did not intersect forbidden
the dendritic stalk in the z axis were not measured. Thus, lines, and if they came into the focus as the optical plane
60% of spines were measured. moved through the height of the dissector (20 lm). The guard
zone thickness was set to 2 lm. The sum areas of the sampling
site represented around 15% of the total area of the slice. This
Estimation of the Volume and sampling method and the section interval was tested in a pilot
Number of Plaques experiment to ensure that the estimation of the number of
Immunocytochemistry plaques was representative of the total number.
In slices taken from brains of the same mice used for the
morphological studies, amyloid plaques were stained with an Acknowledgments
antihuman Ab antibody in systematically sampled coronal ´ ´
The authors thank C. Hernandez and B. Garcıa for assis-
sections (50 lm thick, every sixth section in the hippocampus). tance with the confocal microscopy, and Dr I. Ferrer (Institut
A pilot study confirmed that this antibody exclusively marks `
Neuropatologia, Servei Anatomia Patologica, IDIBELL-Hospi-
thioflavin-s positive plaques (Knafo et al., 2009a). Free-floating tal Universitari de Bellvitge, Universitat de Barcelona, Hospi-
sections were pretreated with 55% formic acid (r-Aldrich, talet de Llobregat, Spain) for supplying the animals.
ACS) and washed with 0.1 M PB. Sections were treated with
1% H202 for 30 min to deplete the endogenous peroxidase
activity, and they were then submerged for 1 h in PB with
0.25% Triton-X and 3% horse serum (Vector laboratories Inc., REFERENCES
Burlingame, CA). Sections were incubated overnight at 48C
with a mouse antihuman Ab antibody (1:50; clone 6F/3D, Andersen P, Morris RG, Amaral D, Bliss T, O’Keefe J. 2006. The
Dako Glostrup, Denmark) and on the following day, the Hippocampus Book. USA: Oxford University Press.
sections were rinsed and incubated for 2 h with a biotinylated Bloodgood BL, Sabatini BL. 2005. Neuronal activity regulates diffu-
sion across the neck of dendritic spines. Science 310:866–869.
horse antimouse antibody (1:200; BA-1,000; Vector). The
Cohen E, Paulsson JF, Blinder P, Burstyn-Cohen T, Du D, Estepa G,
sections were then incubated for 1 h in an avidin-biotin per- Adame A, Pham HM, Holzenberger M, Kelly JW, Masliah E, Dil-
oxidase complex (Vectastain ABC Elite PK6100, Vector) and lin A. 2009. Reduced IGF-1 signaling delays age-associated proteo-
finally, the staining was visualized with the chromogen 3, 30 toxicity in mice. Cell 139:1157–1169.
diaminobenzidine tetrahydrochloride (DAB; r-Aldrich, St Louis, Cruz L, Urbanc B, Buldyrev SV, Christie R, Gomez-Isla T, Havlin S,
McNamara M, Stanley HE, Hyman BT. 1997. Aggregation and
MO). After staining, sections were dehydrated, cleared with disaggregation of senile plaques in Alzheimer disease. Proc Natl
xylene and cover-slipped. As a control, some sections were Acad Sci USA 94:7612–7616.
processed as above but without the primary antibody, which Gray EG. 1959. Electron microscopy of synaptic contacts on dendrite
produced no significant staining. Slices were then counterstained spines of the cerebral cortex. Nature 183:1592–1593.
by the Nissl technique to visualize the hippocampal strata. Harris KM, Jensen FE, Tsao B. 1992. Three-dimensional structure of
dendritic spines and synapses in rat hippocampus (CA1) at post-
natal day 15 and adult ages: Implications for the maturation of
synaptic physiology and long-term potentiation [published erratum
Unbiased stereology appears in J Neurosci 1992 Aug; 12(8): following table of con-
Unbiased stereology was used to quantify and measure pla- tents]. J Neurosci 12:2685–2705.
Harris KM, Stevens JK. 1989. Dendritic spines of CA 1 pyramidal
ques since counting spherical plaques in two-dimensional cross cells in the rat hippocampus: Serial electron microscopy with refer-
sections provides an imprecise measure of the amount of Ab ence to their biophysical characteristics. J Neurosci 9:2982–2997.
(Stark et al., 2005). Using a stereotaxic atlas (Paxinos and Kharazia VN, Weinberg RJ. 1999. Immunogold localization of AMPA
Franklin, 2001) as a reference, eight slices at 21.1 to 23.8 and NMDA receptors in somatic sensory cortex of albino rat.
mm from bregma were analyzed in each brain. The Stereo In- J Comp Neurol 412:292–302.
Knafo S, Alonso-Nanclares L, Gonzalez-Soriano J, Merino-Serrais P,
vestigator software (Microbrightfield, Colchester, VT) was used Fernaud-Espinosa I, Ferrer I, Defelipe J. 2009a. Widespread changes
to drive a motorized stage (Prior Scientific, Houston, TX) on a in dendritic spines in a model of Alzheimer’s disease. Cereb Cortex
dual optical head microscope (Oltmpus BX 51) and to mark 19:586–592.
and measure plaques at 40x (NA, 0.85) under brightfield Knafo S, Venero C, Merino-Serrais P, Gonzalez-Soriano J, Fernaud-Espi-
optics. The software sequentially chose random counting frames nosa I, Ferrer I, Santpere G, Defelipe J. 2009b. Morphological altera-
tions to neurons of the amygdala and impaired fear conditioning in a
(100 3 100 lm) in the xyz axes, moving the motorized stage transgenic mouse model of Alzheimer’s disease. J Pathol 219:41–51.
automatically within the previously delimited zones in the stra- Lacor PN, Buniel MC, Furlow PW, Sanz Clemente A, Velasco PT,
tum oriens and the stratum radiatum. Wood M, Viola KL, Klein WL. 2007. A{beta} Oligomer-induced
Hippocampus
8. 8 MERINO-SERRAIS ET AL.
aberrations in synapse composition, shape, and density provide beta-protein similar to that in the senile plaques of Alzheimer’s dis-
a molecular basis for loss of connectivity in Alzheimer’s disease. ease is increased in vivo by the presenilin 1 and 2 and APP muta-
J Neurosci 27:796–807. tions linked to familial Alzheimer’s disease. Nat Med 2:864–870.
Lamprecht R, LeDoux J. 2004. Structural plasticity and memory. Nat Selkoe DJ. 2002. Alzheimer’s disease is a synaptic failure. Science 298:789–
Rev Neurosci 5:45–54. 791.
Lang C, Barco A, Zablow L, Kandel ER, Siegelbaum SA, Zakharenko Shankar GM, Li S, Mehta TH, Garcia-Munoz A, Shepardson NE,
SS. 2004. Transient expansion of synaptically connected dendritic Smith I, Brett FM, Farrell MA, Rowan MJ, Lemere CA, Regan
spines upon induction of hippocampal long-term potentiation. CM, Walsh DM, Sabatini BL, Selkoe DJ. 2008. Amyloid-b protein
Proc Natl Acad Sci USA 101:16665–16670. dimers isolated directly from Alzheimer’s brains impair synaptic plas-
Majewska A, Tashiro A, Yuste R. 2000. Regulation of spine calcium ticity and memory. Nat Med 14:837–842.
dynamics by rapid spine motility. J Neurosci 20:8262–8268. Spires TL, Meyer-Luehmann M, Stern EA, McLean PJ, Skoch J,
Malm TM, Iivonen H, Goldsteins G, Keksa-Goldsteine V, Ahtoniemi Nguyen PT, Bacskai BJ, Hyman BT. 2005. Dendritic spine abnor-
T, Kanninen K, Salminen A, Auriola S, Van Groen T, Tanila H, malities in amyloid precursor protein transgenic mice demonstrated
Koistinaho J. 2007. Pyrrolidine dithiocarbamate activates akt and by gene transfer and intravital multiphoton microscopy. J Neurosci
improves spatial learning in APP/PS1 mice without affecting 25:7278–7287.
{beta}-amyloid burden. J Neurosci 27:3712–3721. Stark AK, Pelvig DP, Jorgensen AM, Andersen BB, Pakkenberg B. 2005.
Matsuzaki M, Ellis-Davies GC, Nemoto T, Miyashita Y, Iino M, Kasai Measuring morphological and cellular changes in Alzheimer’s demen-
H. 2001. Dendritic spine geometry is critical for AMPA receptor tia: A review emphasizing stereology. Curr Alzheimer Res 2:449–481.
expression in hippocampal CA1 pyramidal neurons 1. Nat Neuro-
Terry RD, Masliah E, Salmon DP, Butters N, DeTeresa R, Hill R,
sci 4:1086–1092.
Hansen LA, Katzman R. 1991. Physical basis of cognitive altera-
Moller A, Strange P, Gundersen HJ. 1990. Efficient estimation of cell
tions in Alzheimer’s disease: Synapse loss is the major correlate of
volume and number using the nucleator and the disector. J Microsc
cognitive impairment. Ann Neurol 30:572–580.
159:61–71.
Murthy VN, Sejnowski TJ, Stevens CF. 2000. Dynamics of dendritic Trinchese F, Liu S, Battaglia F, Walter S, Mathews PM, Arancio O.
calcium transients evoked by quantal release at excitatory hippo- 2004. Progressive age-related development of Alzheimer-like
campal synapses. Proc Natl Acad Sci USA 97:901–906. pathology in APP/PS1 mice. Ann Neurol 55:801–814.
Paxinos G, Franklin KBJ. 2001. The Mouse Brain in Stereotaxic Trommald M, Hulleberg G. 1997. Dimensions and density of dendri-
Coordinates, Deluxe, 2nd ed. San Diego, California: Acedemic tic spines from rat dentate granule cells based on reconstructions
Press. from serial electron micrographs. J Comp Neurol 377:15–28.
Price JL, McKeel DW, Jr, Buckles VD, Roe CM, Xiong C, Grundman Tsai J, Grutzendler J, Duff K, Gan WB. 2004. Fibrillar amyloid depo-
M, Hansen LA, Petersen RC, Parisi JE, Dickson DW. 2009. Neuro- sition leads to local synaptic abnormalities and breakage of neuro-
pathology of nondemented aging: Presumptive evidence for preclini- nal branches. Nat Neurosci 7:1181–1183.
cal Alzheimer disease. Neurobiol Aging 30:1026–1036. Yuste R, Majewska A, Holthoff K. 2000. From form to function: Cal-
Scheuner D, Eckman C, Jensen M, Song X, Citron M, Suzuki N, cium compartmentalization in dendritic spines. Nat Neurosci 3:
Bird TD, Hardy J, Hutton M, Kukull W. 1996. Secreted amyloid 653–659.
Hippocampus