SlideShare une entreprise Scribd logo
1  sur  12
Statistics is all about data but data alone is not interesting. It is the interpretation of the data that
we are interested in…
Data Science field is evolving like never before. Many companies are now looking for professionals
who can sift their goldmine data and help them drive swift business decisions efficiently. It also
gives the edge to many working professionals to switch their careers to the Data Science field.
Having this AI, Data Science buzz around many college students also wants to pursue their careers
in the Data Science field. And this hype around Data Science is correctly proclaimed by Thomas
H. Davenport and D.J. Patil in one of the Harvard Business Review articles that,
“Data Scientist: The Sexiest Job of the 21st Century”
In today’s analytics world building machine learning models has become relatively easy (thanks to
more robust and flexible tools and algorithms), but still the fundamental concepts are very
confusing. One of such concepts is Hypothesis Testing.
In this post, I’m attempting to clarify the basic concepts of Hypothesis Testing with illustrations.
What is Hypothesis Testing? What are we trying to achieve? Why do we need to perform
Hypothesis Testing? We must know the answers to all these questions before we proceed.
Statistics is all about data. Data alone is not interesting. It is the interpretation of the data that we
are interested in. Using Hypothesis Testing, we try to interpret or draw conclusions about the
population using sample data.
A Hypothesis Test evaluates two mutually exclusive statements about a population to determine
which statement is best supported by the sample data. Whenever we want to make claims about the
distribution of data or whether one set of results are different from another set of results in applied
machine learning, we must rely on statistical hypothesis tests.
There are two possible outcomes: if the result confirms the hypothesis, then you’ve made a
measurement. If the result is contrary to the hypothesis, then you’ve made a discovery — Enrico
Fermi
Let’s look at the terminology that we should be aware of in Hypothesis Testing
1. Parameter and Statistic:
A Parameter is a summary description of a fixed characteristic or measure of the target population.
A Parameter denotes the true value that would be obtained if a census rather than a sample were
undertaken
Ex: Mean (μ), Variance (σ²), Standard Deviation (σ), Proportion (π)
Population: Population is a collection of objectsthat we want to study/test.Thecollection of objects
could be Cities, Students, Factories, etc. It depends on the study at hand.
In the real world, it’s tough ask to get complete information about the population. Hence, we draw
a sample out of that population and derive the same statistical measures mentioned above. And
these measures are called Sample Statistics. In other words,
A Statistic is a summary description of a characteristic or measure of the sample. The Sample
Statistic is used as an estimate of the population parameter.
Ex: Sample Mean (x̄ ), Sample Variance (S²), Sample Standard Deviation (S), Sample Proportion
(p)
2. Sampling Distribution:
A Sampling Distribution is a probability distribution of a statistic obtained through a large number
of samples drawn from a specific population.
Ex: Suppose a simple random sample of five hospitals is to be drawn from a population of 20
hospitals. The possibilities could be, (20, 19, 18, 17, 16) or (1,2,4,7,8) or any of the 15,504 (using
20C₅ combinations) different samples of size 5 can be drawn.
In general, the mean of the sampling distribution will be approximately equivalent to the population
mean i.e. E(x̄ ) = μ
To know more about Sampling Distribution please do check this below video:
Video from Khan Academy
3. Standard Error (SE):
The standard error (SE) is very similar to the standard deviation. Both are measures of spread. The
higher the number, the more spread out your data is. To put it simply, the two terms are essentially
equal — but there is one important difference. While the standard error uses statistics (sample data)
standard deviation use parameters (population data)
The standard error tells you how far your sample statistic (like the sample mean) deviates from the
actual population mean. The larger your sample size, the smaller the SE. In other words, the larger
your sample size, the closer your sample mean is to the actual population mean.
To know more about Standard Error (SE) please do watch below video
Now let’s consider the following example to better understand the remaining concepts.
4. (a). Null Hypothesis (H₀ ):
A statement in which no difference or effect is expected. If the null hypothesis is not rejected, no
changes will be made.
The word “null” in this context meansthat it’sa commonly acceptedfact that researchers tonullify.
It doesn’t mean that the statement is null itself! (Perhaps the term should be called the “nullifiable
hypotheiss” as that might cause less confusion)
4. (b). Alternate Hypothesis (H₁ ):
A statement that some difference or effect is expected. Accepting the alternative hypothesis will
lead to changes in opinions or actions. It is the opposite of the null hypothesis.
To know more about Null and Alternate hypotheses please watch this below video
5. (a). One-Tailed Test:
A one-tailed test is a statistical hypothesis test in which the critical area of a distribution is one-
sided so that it is either greater than or less than a certain value, but not both. If the sample being
tested falls into the one-sided critical area, the alternative hypothesis will be accepted instead of the
null hypothesis.
A one-tailed test is also known as a directional hypothesis or directional test.
Critical Region: The critical region is the region of values that corresponds to the rejection of the
null hypothesis at some chosen probability level.
5. (b). Two-Tailed Test:
A two-tailed test is a method in which the critical area of a distribution is two-sided and tests
whether a sample is greater than or less than a certain range of values. If the sample being tested
falls into either of the critical areas, the alternative hypothesis is accepted instead of the null
hypothesis.
By convention, two-tailed tests are used to determine significance at the 5% level, meaning each
side of the distribution is cut at 2.5%
6. Test Statistic:
The teststatistic measures how close the sample has come to the null hypothesis. Its observed value
changes randomly from one random sample to a different sample. A test statistic contains
information about the data that is relevant for deciding whether to reject the null hypothesis or not.
Different hypothesis tests use different test statistics based on the probability model assumed in the
null hypothesis. Common tests and their test statistics include:
Image from https://support.minitab.com
In general, the sample data must provide sufficient evidence to reject the null hypothesis and
conclude that the effect exists in the population. Ideally, a hypothesis test fails to reject the null
hypothesis when the effect is not present in the population, and it rejects the null hypothesis when
the effect exists.
By now we understand that the entire hypothesis testing works on based on the sample that is at
hand. We may come to a different conclusion if the sample is changed. There are two types of errors
that relate to incorrect conclusions about the null hypothesis.
7. (a). Type-I Error:
Type-I error occurs when the sample results, lead to the rejection of the null hypothesis when it is
in fact true. Type-I errors are equivalent to false positives.
Type-I errors can be controlled. The value of alpha, which is related to the levelof Significance that
we selected has a direct bearing on Type-I errors.
7. (b). Type-II Error:
Type-II error occurs when based on the sample results, the null hypothesis is not rejected when it
is in fact false. Type-II errors are equivalent to false negatives.
Level of Significance (α):
The probability of making a Type-I error and it is denoted by alpha (α). Alpha is the maximum
probability that we have a Type-I error. For a 95% confidence level, the value of alpha is 0.05. This
means that there is a 5% probability that we will reject a true null hypothesis.
P-Value:
The p-valueis used all over statistics, from t-tests to simple regression analysis to tree-based models
almost in all the machine learning models. We all use P-values to determine statistical significance
in a hypothesis test. Despite being so important, the P-value is a slippery concept that people often
interpret incorrectly.
P-values evaluate how well the sample data support the devil’s advocate argument that the null
hypothesis is true. It measures how compatible your data are with the null hypothesis. How likely
the effect observed in your sample data if the null hypothesis is true?
In other words, given the null hypothesis is true, a P-Value is a probability of getting a result as or
more extreme than the sample result by random chance alone.
High P-Values: Your data are likely with a true null
Low P-Values: Your data are unlikely with a true null
Ex: Suppose you are testing the following hypothesis at a significance level (α) of 5% and you got
the p-value as 3%, and your sample statistic is x̄ = 25
H₀ : μ = 20
H₁ : μ > 20
The interpretation of the p-value as follows:
We saw above that α is also known as committing Type-I error. When we say α=5%, we are fine to
reject our null hypothesis 5 out of 100 times even though it is true. Now that our P-value is 3%
which is less than α (we are definitely below the threshold of committing Type-I error), means
obtaining a sample statistic as extreme as possible (x̄ >= 25) given that H₀ is true is very less. In
other words, we can’t obtain our sample statisticas long as we assume H₀ is true. Hence, we reject
H₀ and accept H₁ . Suppose you get P-Value as 6% i.e. the probability of obtaining the sample
statistic as extreme as possible is higher given that the null hypothesis is true. So we fail to reject
H₀ , comparing with α we can’t take risk of committing Type-I error more than the agreed level of
significance. Hence, we fail to reject the null hypothesis and reject the alternative hypothesis.
Now that we understood the basic terminology in the Hypothesis Testing, now let’s look at the
steps involved in the Hypothesis Testing and an illustration with an example.
For example, a major department store is considering the introduction of an Internet shopping
service. The new service will be introduced if more than 40 percent of the Internet users shop via
the Internet.
Step1: Formulate the Hypotheses:
The appropriate way to formulate the hypotheses is:
H₀ : π ≤ 0.40
H₁ : π > 0.40
If the null hypothesis H₀ is rejected, then the alternative hypothesis H₁ will be accepted and the
new Internet shopping service will be introduced. On the other hand, if we fail to reject H₀ then
the new service should not be introduced unless additional evidence is obtained. This test of the
null hypothesis is a one-tailed test, because the alternative hypothesis is expressed directionally:
The proportion of Internet users who use the Internet for shopping is greater than 0.40.
Step2: Select an appropriate Test:
To test the null hypothesis, it is necessary to select an appropriate statistical technique. For this
example, the z statistic, which follows the standard normal distribution would be appropriate.
z = (p-π)/σₚ, where σₚ=sqrt(π(1-π)/n)
Step3: Choose Level of Significance, α:
We understood that Level of Significance refers to Type-I error. In our example, a Type-I error
would occur if we concluded, based on the sample data, that the proportion of customers preferring
the new service plan was greater than 0.40, when in fact it was less than or equal to 0.40.
The Type-II error would occur if we concluded, based on the sample data, that the proportion of
customers preferring the new service plan was less than or equal to 0.40 when, in fact, it was greater
than 0.40.
It is necessary to balance the two types of errors. As a compromise, α is often set at 0.05; sometimes
it is 0.01; other values of α are rare. We will consider 0.05 for our example.
Step4: Collect Data and Calculate Test Statistic:
Sample size is determined after taking into account the desired α and other qualitative
considerations, such as budget constraints to collect the sample data. For our example, let's say, 30
users were surveyed and 17 indicated that they used the Internet for shopping.
Thus, the value of the sample proportion is p=17/30=0.567.
The value of σₚ=sqrt((0.40)(0.60)/30)=0.089.
The test statistic z can be calculated as
z=(p-π)/σₚ=(0.567–0.40)/0.089=1.88
Step5: Determine the Probability (or Critical Value):
Using standard normal tables from the above, the probability of obtaining a z value of 1.88 is
0.96995 i.e. P(z≤1.88)=0.96995. But we wanted to calculate the probability to the right of z
(because we are interested in obtaining the probability value that falls in the rejection region or
critical region), i.e. 1–0.96995=0.03005. This Probability is directly comparable to α (since α is
committing a Type-I error and the probability value that we calculated also falls in the critical
region)
If you wanted to understand how to look up for the probability values for the given z scores, please
watch below video:
Alternatively, the critical value of z, which will give an area to the right side of the critical value of
0.05, is between 1.64 (at 1.64 the probability is 0.94950) and 1.65 (at 1.65 the probability is
0.95053) and equals 1.645 (the probability is 0.95, i.e. from the left of the normaldistribution, which
means to the right it is 0.05).
Note that in determining the critical value of the test statistic, the area in the tail beyond the critical
value is either α or α/2. It is α for a one-tailed test and α/2 for a two-tailed test. Our example is a
one-tailed test.
If you wanted to understand how to look up for the critical value of α, Please watch below video:
Step 6 and 7: Compare the probability (or Critical value) and make the decision:
The probability associated with the calculated or observed value of the test statistic is 0.03005. This
is the probability of getting a P-Value of 0.567 (sample proportion = p) when π=0.40. This is less
than the level of significance of 0.05. Hence, the null hypothesis is rejected.
Alternatively, the calculated value of the test statistic z=1.88 lies in the rejection region, beyond the
value of 1.645. Again, the same conclusion to reject the null hypothesis is reached.
Note that two ways of testing the null hypothesis are equivalent but mathematically opposite in the
direction of comparison. If the probability associated with the calculated or observed value of the
test statistic (TSCAL) is less than the level of significance (α), the null hypothesis is rejected.
However, if the absolute value of the calculated value of the test statistic is greater thanthe absolute
value of the critical value of the test statistic (TSCR), the null hypothesis is rejected. The reason for
this sign shift is that the larger the absolute value of TSCAL, the smaller the probability of obtaining
a more extreme value of the test statistic under the null hypothesis.
if the probability of TSCAL < significance level (α), then reject H₀ .
But, if |TSCAL| > |TSCR|, then reject H₀
Step8: Conclusion:
In our example, we conclude that there is evidence that the proportion of Internet users who shop
via the Internet is significantly greater than 0.40. Hence, the recommendation to the department
store would be to introduce the new Internet shopping service.
This example refers to one sample test of proportions. However, there are several types of tests exist
depends on the knowledge about the population and the problem at hand.
For Example, We have a t-test, Z-test. Chi-Square Test, Mann-Whitney Test, Wilcoxon Test, etc.
With this, I would like to conclude the Part-I of “Everything You Need To Know about Hypothesis
Testing”. I will discuss the Parametric and Non-Parametric tests and which test to use in what
scenario in Part-II. Until then Happy Learning…

Contenu connexe

Tendances (19)

Math3010 week 5
Math3010 week 5Math3010 week 5
Math3010 week 5
 
Hypothesis testing, error and bias
Hypothesis testing, error and biasHypothesis testing, error and bias
Hypothesis testing, error and bias
 
PyGotham 2016
PyGotham 2016PyGotham 2016
PyGotham 2016
 
Hypothesis Testing: Central Tendency – Normal (Compare 1:1)
Hypothesis Testing: Central Tendency – Normal (Compare 1:1)Hypothesis Testing: Central Tendency – Normal (Compare 1:1)
Hypothesis Testing: Central Tendency – Normal (Compare 1:1)
 
Types of error in hypothesis
Types of error in hypothesisTypes of error in hypothesis
Types of error in hypothesis
 
Critical Value and The P Value
Critical Value and The P ValueCritical Value and The P Value
Critical Value and The P Value
 
Basis of statistical inference
Basis of statistical inferenceBasis of statistical inference
Basis of statistical inference
 
P value
P valueP value
P value
 
Chap#9 hypothesis testing (3)
Chap#9 hypothesis testing (3)Chap#9 hypothesis testing (3)
Chap#9 hypothesis testing (3)
 
Testing of hypothesis
Testing of hypothesisTesting of hypothesis
Testing of hypothesis
 
Hypothesis testing - Primer
Hypothesis testing - PrimerHypothesis testing - Primer
Hypothesis testing - Primer
 
Testing of hypothesis
Testing of hypothesisTesting of hypothesis
Testing of hypothesis
 
Inferential statistics powerpoint
Inferential statistics powerpointInferential statistics powerpoint
Inferential statistics powerpoint
 
Basics of statistics
Basics of statisticsBasics of statistics
Basics of statistics
 
April 3 2014 slides mayo
April 3 2014 slides mayoApril 3 2014 slides mayo
April 3 2014 slides mayo
 
hypothesis testing
hypothesis testinghypothesis testing
hypothesis testing
 
Applied statistics part 1
Applied statistics part 1Applied statistics part 1
Applied statistics part 1
 
Inferential statistics
Inferential statisticsInferential statistics
Inferential statistics
 
Applied statistics part 2
Applied statistics  part 2Applied statistics  part 2
Applied statistics part 2
 

Similaire à Hypothesis testing

Page 266LEARNING OBJECTIVES· Explain how researchers use inf.docx
Page 266LEARNING OBJECTIVES· Explain how researchers use inf.docxPage 266LEARNING OBJECTIVES· Explain how researchers use inf.docx
Page 266LEARNING OBJECTIVES· Explain how researchers use inf.docxkarlhennesey
 
Hypothesis testing
Hypothesis testingHypothesis testing
Hypothesis testingpraveen3030
 
Steps in hypothesis.pptx
Steps in hypothesis.pptxSteps in hypothesis.pptx
Steps in hypothesis.pptxYashwanth Rm
 
Chapter8 introduction to hypothesis testing
Chapter8 introduction to hypothesis testingChapter8 introduction to hypothesis testing
Chapter8 introduction to hypothesis testingBOmebratu
 
What So Funny About Proportion Testv3
What So Funny About Proportion Testv3What So Funny About Proportion Testv3
What So Funny About Proportion Testv3ChrisConnors
 
Sample Size Determination.23.11.2021.pdf
Sample Size Determination.23.11.2021.pdfSample Size Determination.23.11.2021.pdf
Sample Size Determination.23.11.2021.pdfstatsanjal
 
Topic Learning TeamNumber of Pages 2 (Double Spaced)Num.docx
Topic Learning TeamNumber of Pages 2 (Double Spaced)Num.docxTopic Learning TeamNumber of Pages 2 (Double Spaced)Num.docx
Topic Learning TeamNumber of Pages 2 (Double Spaced)Num.docxAASTHA76
 
Testing of Hypothesis.pptx
Testing of Hypothesis.pptxTesting of Hypothesis.pptx
Testing of Hypothesis.pptxhemamalini398951
 
Hypothesis Testing Definitions A statistical hypothesi.docx
Hypothesis Testing  Definitions A statistical hypothesi.docxHypothesis Testing  Definitions A statistical hypothesi.docx
Hypothesis Testing Definitions A statistical hypothesi.docxwilcockiris
 
Hypothesis Testing.pptx
Hypothesis Testing.pptxHypothesis Testing.pptx
Hypothesis Testing.pptxheencomm
 
Aron chpt 5 ed revised
Aron chpt 5 ed revisedAron chpt 5 ed revised
Aron chpt 5 ed revisedSandra Nicks
 
Review Z Test Ci 1
Review Z Test Ci 1Review Z Test Ci 1
Review Z Test Ci 1shoffma5
 
Hypothesis TestingThe Right HypothesisIn business, or an.docx
Hypothesis TestingThe Right HypothesisIn business, or an.docxHypothesis TestingThe Right HypothesisIn business, or an.docx
Hypothesis TestingThe Right HypothesisIn business, or an.docxadampcarr67227
 
PAGE O&M Statistics – Inferential Statistics Hypothesis Test.docx
PAGE  O&M Statistics – Inferential Statistics Hypothesis Test.docxPAGE  O&M Statistics – Inferential Statistics Hypothesis Test.docx
PAGE O&M Statistics – Inferential Statistics Hypothesis Test.docxgerardkortney
 

Similaire à Hypothesis testing (20)

Page 266LEARNING OBJECTIVES· Explain how researchers use inf.docx
Page 266LEARNING OBJECTIVES· Explain how researchers use inf.docxPage 266LEARNING OBJECTIVES· Explain how researchers use inf.docx
Page 266LEARNING OBJECTIVES· Explain how researchers use inf.docx
 
Hypothesis testing
Hypothesis testingHypothesis testing
Hypothesis testing
 
Steps in hypothesis.pptx
Steps in hypothesis.pptxSteps in hypothesis.pptx
Steps in hypothesis.pptx
 
40007 chapter8
40007 chapter840007 chapter8
40007 chapter8
 
Chapter8 introduction to hypothesis testing
Chapter8 introduction to hypothesis testingChapter8 introduction to hypothesis testing
Chapter8 introduction to hypothesis testing
 
Hypothesis test
Hypothesis testHypothesis test
Hypothesis test
 
What So Funny About Proportion Testv3
What So Funny About Proportion Testv3What So Funny About Proportion Testv3
What So Funny About Proportion Testv3
 
Sample Size Determination.23.11.2021.pdf
Sample Size Determination.23.11.2021.pdfSample Size Determination.23.11.2021.pdf
Sample Size Determination.23.11.2021.pdf
 
4_5875144622430228750.docx
4_5875144622430228750.docx4_5875144622430228750.docx
4_5875144622430228750.docx
 
Rm 3 Hypothesis
Rm   3   HypothesisRm   3   Hypothesis
Rm 3 Hypothesis
 
Topic Learning TeamNumber of Pages 2 (Double Spaced)Num.docx
Topic Learning TeamNumber of Pages 2 (Double Spaced)Num.docxTopic Learning TeamNumber of Pages 2 (Double Spaced)Num.docx
Topic Learning TeamNumber of Pages 2 (Double Spaced)Num.docx
 
Testing of Hypothesis.pptx
Testing of Hypothesis.pptxTesting of Hypothesis.pptx
Testing of Hypothesis.pptx
 
Hypothesis Testing Definitions A statistical hypothesi.docx
Hypothesis Testing  Definitions A statistical hypothesi.docxHypothesis Testing  Definitions A statistical hypothesi.docx
Hypothesis Testing Definitions A statistical hypothesi.docx
 
Hypothesis Testing.pptx
Hypothesis Testing.pptxHypothesis Testing.pptx
Hypothesis Testing.pptx
 
Aron chpt 5 ed revised
Aron chpt 5 ed revisedAron chpt 5 ed revised
Aron chpt 5 ed revised
 
Aron chpt 5 ed
Aron chpt 5 edAron chpt 5 ed
Aron chpt 5 ed
 
Review Z Test Ci 1
Review Z Test Ci 1Review Z Test Ci 1
Review Z Test Ci 1
 
Hypothesis TestingThe Right HypothesisIn business, or an.docx
Hypothesis TestingThe Right HypothesisIn business, or an.docxHypothesis TestingThe Right HypothesisIn business, or an.docx
Hypothesis TestingThe Right HypothesisIn business, or an.docx
 
PAGE O&M Statistics – Inferential Statistics Hypothesis Test.docx
PAGE  O&M Statistics – Inferential Statistics Hypothesis Test.docxPAGE  O&M Statistics – Inferential Statistics Hypothesis Test.docx
PAGE O&M Statistics – Inferential Statistics Hypothesis Test.docx
 
Statistics
StatisticsStatistics
Statistics
 

Plus de Shivasharana Marnur (10)

Isuues management
Isuues managementIsuues management
Isuues management
 
Mod 4 of eco ru extra
Mod 4 of eco ru extraMod 4 of eco ru extra
Mod 4 of eco ru extra
 
Mod 4 of eco ru extra
Mod 4 of eco ru extraMod 4 of eco ru extra
Mod 4 of eco ru extra
 
Sharanafms
SharanafmsSharanafms
Sharanafms
 
Consumer durables-industry-in-india
Consumer durables-industry-in-indiaConsumer durables-industry-in-india
Consumer durables-industry-in-india
 
Ssscmmodule 1-4th sem
Ssscmmodule 1-4th semSsscmmodule 1-4th sem
Ssscmmodule 1-4th sem
 
Scmscd4thsem
Scmscd4thsemScmscd4thsem
Scmscd4thsem
 
Sssjfacts
SssjfactsSssjfacts
Sssjfacts
 
Cars a to z
Cars a to zCars a to z
Cars a to z
 
Workshop art of selling.
Workshop   art of selling.Workshop   art of selling.
Workshop art of selling.
 

Dernier

Keppel Ltd. 1Q 2024 Business Update Presentation Slides
Keppel Ltd. 1Q 2024 Business Update  Presentation SlidesKeppel Ltd. 1Q 2024 Business Update  Presentation Slides
Keppel Ltd. 1Q 2024 Business Update Presentation SlidesKeppelCorporation
 
Call Girls In DLf Gurgaon ➥99902@11544 ( Best price)100% Genuine Escort In 24...
Call Girls In DLf Gurgaon ➥99902@11544 ( Best price)100% Genuine Escort In 24...Call Girls In DLf Gurgaon ➥99902@11544 ( Best price)100% Genuine Escort In 24...
Call Girls In DLf Gurgaon ➥99902@11544 ( Best price)100% Genuine Escort In 24...lizamodels9
 
RE Capital's Visionary Leadership under Newman Leech
RE Capital's Visionary Leadership under Newman LeechRE Capital's Visionary Leadership under Newman Leech
RE Capital's Visionary Leadership under Newman LeechNewman George Leech
 
MONA 98765-12871 CALL GIRLS IN LUDHIANA LUDHIANA CALL GIRL
MONA 98765-12871 CALL GIRLS IN LUDHIANA LUDHIANA CALL GIRLMONA 98765-12871 CALL GIRLS IN LUDHIANA LUDHIANA CALL GIRL
MONA 98765-12871 CALL GIRLS IN LUDHIANA LUDHIANA CALL GIRLSeo
 
Eni 2024 1Q Results - 24.04.24 business.
Eni 2024 1Q Results - 24.04.24 business.Eni 2024 1Q Results - 24.04.24 business.
Eni 2024 1Q Results - 24.04.24 business.Eni
 
Call Girls Pune Just Call 9907093804 Top Class Call Girl Service Available
Call Girls Pune Just Call 9907093804 Top Class Call Girl Service AvailableCall Girls Pune Just Call 9907093804 Top Class Call Girl Service Available
Call Girls Pune Just Call 9907093804 Top Class Call Girl Service AvailableDipal Arora
 
Best VIP Call Girls Noida Sector 40 Call Me: 8448380779
Best VIP Call Girls Noida Sector 40 Call Me: 8448380779Best VIP Call Girls Noida Sector 40 Call Me: 8448380779
Best VIP Call Girls Noida Sector 40 Call Me: 8448380779Delhi Call girls
 
Creating Low-Code Loan Applications using the Trisotech Mortgage Feature Set
Creating Low-Code Loan Applications using the Trisotech Mortgage Feature SetCreating Low-Code Loan Applications using the Trisotech Mortgage Feature Set
Creating Low-Code Loan Applications using the Trisotech Mortgage Feature SetDenis Gagné
 
A DAY IN THE LIFE OF A SALESMAN / WOMAN
A DAY IN THE LIFE OF A  SALESMAN / WOMANA DAY IN THE LIFE OF A  SALESMAN / WOMAN
A DAY IN THE LIFE OF A SALESMAN / WOMANIlamathiKannappan
 
The CMO Survey - Highlights and Insights Report - Spring 2024
The CMO Survey - Highlights and Insights Report - Spring 2024The CMO Survey - Highlights and Insights Report - Spring 2024
The CMO Survey - Highlights and Insights Report - Spring 2024christinemoorman
 
Catalogue ONG NUOC PPR DE NHAT .pdf
Catalogue ONG NUOC PPR DE NHAT      .pdfCatalogue ONG NUOC PPR DE NHAT      .pdf
Catalogue ONG NUOC PPR DE NHAT .pdfOrient Homes
 
Tech Startup Growth Hacking 101 - Basics on Growth Marketing
Tech Startup Growth Hacking 101  - Basics on Growth MarketingTech Startup Growth Hacking 101  - Basics on Growth Marketing
Tech Startup Growth Hacking 101 - Basics on Growth MarketingShawn Pang
 
0183760ssssssssssssssssssssssssssss00101011 (27).pdf
0183760ssssssssssssssssssssssssssss00101011 (27).pdf0183760ssssssssssssssssssssssssssss00101011 (27).pdf
0183760ssssssssssssssssssssssssssss00101011 (27).pdfRenandantas16
 
It will be International Nurses' Day on 12 May
It will be International Nurses' Day on 12 MayIt will be International Nurses' Day on 12 May
It will be International Nurses' Day on 12 MayNZSG
 
Monte Carlo simulation : Simulation using MCSM
Monte Carlo simulation : Simulation using MCSMMonte Carlo simulation : Simulation using MCSM
Monte Carlo simulation : Simulation using MCSMRavindra Nath Shukla
 
M.C Lodges -- Guest House in Jhang.
M.C Lodges --  Guest House in Jhang.M.C Lodges --  Guest House in Jhang.
M.C Lodges -- Guest House in Jhang.Aaiza Hassan
 
Yaroslav Rozhankivskyy: Три складові і три передумови максимальної продуктивн...
Yaroslav Rozhankivskyy: Три складові і три передумови максимальної продуктивн...Yaroslav Rozhankivskyy: Три складові і три передумови максимальної продуктивн...
Yaroslav Rozhankivskyy: Три складові і три передумови максимальної продуктивн...Lviv Startup Club
 
Sales & Marketing Alignment: How to Synergize for Success
Sales & Marketing Alignment: How to Synergize for SuccessSales & Marketing Alignment: How to Synergize for Success
Sales & Marketing Alignment: How to Synergize for SuccessAggregage
 
Ensure the security of your HCL environment by applying the Zero Trust princi...
Ensure the security of your HCL environment by applying the Zero Trust princi...Ensure the security of your HCL environment by applying the Zero Trust princi...
Ensure the security of your HCL environment by applying the Zero Trust princi...Roland Driesen
 
Call Girls Navi Mumbai Just Call 9907093804 Top Class Call Girl Service Avail...
Call Girls Navi Mumbai Just Call 9907093804 Top Class Call Girl Service Avail...Call Girls Navi Mumbai Just Call 9907093804 Top Class Call Girl Service Avail...
Call Girls Navi Mumbai Just Call 9907093804 Top Class Call Girl Service Avail...Dipal Arora
 

Dernier (20)

Keppel Ltd. 1Q 2024 Business Update Presentation Slides
Keppel Ltd. 1Q 2024 Business Update  Presentation SlidesKeppel Ltd. 1Q 2024 Business Update  Presentation Slides
Keppel Ltd. 1Q 2024 Business Update Presentation Slides
 
Call Girls In DLf Gurgaon ➥99902@11544 ( Best price)100% Genuine Escort In 24...
Call Girls In DLf Gurgaon ➥99902@11544 ( Best price)100% Genuine Escort In 24...Call Girls In DLf Gurgaon ➥99902@11544 ( Best price)100% Genuine Escort In 24...
Call Girls In DLf Gurgaon ➥99902@11544 ( Best price)100% Genuine Escort In 24...
 
RE Capital's Visionary Leadership under Newman Leech
RE Capital's Visionary Leadership under Newman LeechRE Capital's Visionary Leadership under Newman Leech
RE Capital's Visionary Leadership under Newman Leech
 
MONA 98765-12871 CALL GIRLS IN LUDHIANA LUDHIANA CALL GIRL
MONA 98765-12871 CALL GIRLS IN LUDHIANA LUDHIANA CALL GIRLMONA 98765-12871 CALL GIRLS IN LUDHIANA LUDHIANA CALL GIRL
MONA 98765-12871 CALL GIRLS IN LUDHIANA LUDHIANA CALL GIRL
 
Eni 2024 1Q Results - 24.04.24 business.
Eni 2024 1Q Results - 24.04.24 business.Eni 2024 1Q Results - 24.04.24 business.
Eni 2024 1Q Results - 24.04.24 business.
 
Call Girls Pune Just Call 9907093804 Top Class Call Girl Service Available
Call Girls Pune Just Call 9907093804 Top Class Call Girl Service AvailableCall Girls Pune Just Call 9907093804 Top Class Call Girl Service Available
Call Girls Pune Just Call 9907093804 Top Class Call Girl Service Available
 
Best VIP Call Girls Noida Sector 40 Call Me: 8448380779
Best VIP Call Girls Noida Sector 40 Call Me: 8448380779Best VIP Call Girls Noida Sector 40 Call Me: 8448380779
Best VIP Call Girls Noida Sector 40 Call Me: 8448380779
 
Creating Low-Code Loan Applications using the Trisotech Mortgage Feature Set
Creating Low-Code Loan Applications using the Trisotech Mortgage Feature SetCreating Low-Code Loan Applications using the Trisotech Mortgage Feature Set
Creating Low-Code Loan Applications using the Trisotech Mortgage Feature Set
 
A DAY IN THE LIFE OF A SALESMAN / WOMAN
A DAY IN THE LIFE OF A  SALESMAN / WOMANA DAY IN THE LIFE OF A  SALESMAN / WOMAN
A DAY IN THE LIFE OF A SALESMAN / WOMAN
 
The CMO Survey - Highlights and Insights Report - Spring 2024
The CMO Survey - Highlights and Insights Report - Spring 2024The CMO Survey - Highlights and Insights Report - Spring 2024
The CMO Survey - Highlights and Insights Report - Spring 2024
 
Catalogue ONG NUOC PPR DE NHAT .pdf
Catalogue ONG NUOC PPR DE NHAT      .pdfCatalogue ONG NUOC PPR DE NHAT      .pdf
Catalogue ONG NUOC PPR DE NHAT .pdf
 
Tech Startup Growth Hacking 101 - Basics on Growth Marketing
Tech Startup Growth Hacking 101  - Basics on Growth MarketingTech Startup Growth Hacking 101  - Basics on Growth Marketing
Tech Startup Growth Hacking 101 - Basics on Growth Marketing
 
0183760ssssssssssssssssssssssssssss00101011 (27).pdf
0183760ssssssssssssssssssssssssssss00101011 (27).pdf0183760ssssssssssssssssssssssssssss00101011 (27).pdf
0183760ssssssssssssssssssssssssssss00101011 (27).pdf
 
It will be International Nurses' Day on 12 May
It will be International Nurses' Day on 12 MayIt will be International Nurses' Day on 12 May
It will be International Nurses' Day on 12 May
 
Monte Carlo simulation : Simulation using MCSM
Monte Carlo simulation : Simulation using MCSMMonte Carlo simulation : Simulation using MCSM
Monte Carlo simulation : Simulation using MCSM
 
M.C Lodges -- Guest House in Jhang.
M.C Lodges --  Guest House in Jhang.M.C Lodges --  Guest House in Jhang.
M.C Lodges -- Guest House in Jhang.
 
Yaroslav Rozhankivskyy: Три складові і три передумови максимальної продуктивн...
Yaroslav Rozhankivskyy: Три складові і три передумови максимальної продуктивн...Yaroslav Rozhankivskyy: Три складові і три передумови максимальної продуктивн...
Yaroslav Rozhankivskyy: Три складові і три передумови максимальної продуктивн...
 
Sales & Marketing Alignment: How to Synergize for Success
Sales & Marketing Alignment: How to Synergize for SuccessSales & Marketing Alignment: How to Synergize for Success
Sales & Marketing Alignment: How to Synergize for Success
 
Ensure the security of your HCL environment by applying the Zero Trust princi...
Ensure the security of your HCL environment by applying the Zero Trust princi...Ensure the security of your HCL environment by applying the Zero Trust princi...
Ensure the security of your HCL environment by applying the Zero Trust princi...
 
Call Girls Navi Mumbai Just Call 9907093804 Top Class Call Girl Service Avail...
Call Girls Navi Mumbai Just Call 9907093804 Top Class Call Girl Service Avail...Call Girls Navi Mumbai Just Call 9907093804 Top Class Call Girl Service Avail...
Call Girls Navi Mumbai Just Call 9907093804 Top Class Call Girl Service Avail...
 

Hypothesis testing

  • 1. Statistics is all about data but data alone is not interesting. It is the interpretation of the data that we are interested in… Data Science field is evolving like never before. Many companies are now looking for professionals who can sift their goldmine data and help them drive swift business decisions efficiently. It also gives the edge to many working professionals to switch their careers to the Data Science field. Having this AI, Data Science buzz around many college students also wants to pursue their careers in the Data Science field. And this hype around Data Science is correctly proclaimed by Thomas H. Davenport and D.J. Patil in one of the Harvard Business Review articles that, “Data Scientist: The Sexiest Job of the 21st Century” In today’s analytics world building machine learning models has become relatively easy (thanks to more robust and flexible tools and algorithms), but still the fundamental concepts are very confusing. One of such concepts is Hypothesis Testing. In this post, I’m attempting to clarify the basic concepts of Hypothesis Testing with illustrations. What is Hypothesis Testing? What are we trying to achieve? Why do we need to perform Hypothesis Testing? We must know the answers to all these questions before we proceed.
  • 2. Statistics is all about data. Data alone is not interesting. It is the interpretation of the data that we are interested in. Using Hypothesis Testing, we try to interpret or draw conclusions about the population using sample data. A Hypothesis Test evaluates two mutually exclusive statements about a population to determine which statement is best supported by the sample data. Whenever we want to make claims about the distribution of data or whether one set of results are different from another set of results in applied machine learning, we must rely on statistical hypothesis tests. There are two possible outcomes: if the result confirms the hypothesis, then you’ve made a measurement. If the result is contrary to the hypothesis, then you’ve made a discovery — Enrico Fermi Let’s look at the terminology that we should be aware of in Hypothesis Testing 1. Parameter and Statistic: A Parameter is a summary description of a fixed characteristic or measure of the target population. A Parameter denotes the true value that would be obtained if a census rather than a sample were undertaken Ex: Mean (μ), Variance (σ²), Standard Deviation (σ), Proportion (π) Population: Population is a collection of objectsthat we want to study/test.Thecollection of objects could be Cities, Students, Factories, etc. It depends on the study at hand. In the real world, it’s tough ask to get complete information about the population. Hence, we draw a sample out of that population and derive the same statistical measures mentioned above. And these measures are called Sample Statistics. In other words, A Statistic is a summary description of a characteristic or measure of the sample. The Sample Statistic is used as an estimate of the population parameter. Ex: Sample Mean (x̄ ), Sample Variance (S²), Sample Standard Deviation (S), Sample Proportion (p)
  • 3. 2. Sampling Distribution: A Sampling Distribution is a probability distribution of a statistic obtained through a large number of samples drawn from a specific population. Ex: Suppose a simple random sample of five hospitals is to be drawn from a population of 20 hospitals. The possibilities could be, (20, 19, 18, 17, 16) or (1,2,4,7,8) or any of the 15,504 (using 20C₅ combinations) different samples of size 5 can be drawn. In general, the mean of the sampling distribution will be approximately equivalent to the population mean i.e. E(x̄ ) = μ To know more about Sampling Distribution please do check this below video: Video from Khan Academy 3. Standard Error (SE): The standard error (SE) is very similar to the standard deviation. Both are measures of spread. The higher the number, the more spread out your data is. To put it simply, the two terms are essentially equal — but there is one important difference. While the standard error uses statistics (sample data) standard deviation use parameters (population data) The standard error tells you how far your sample statistic (like the sample mean) deviates from the actual population mean. The larger your sample size, the smaller the SE. In other words, the larger your sample size, the closer your sample mean is to the actual population mean.
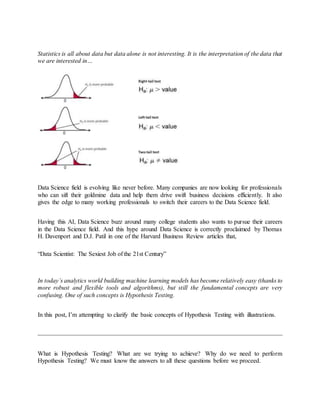
  • 4. To know more about Standard Error (SE) please do watch below video Now let’s consider the following example to better understand the remaining concepts. 4. (a). Null Hypothesis (H₀ ): A statement in which no difference or effect is expected. If the null hypothesis is not rejected, no changes will be made. The word “null” in this context meansthat it’sa commonly acceptedfact that researchers tonullify. It doesn’t mean that the statement is null itself! (Perhaps the term should be called the “nullifiable hypotheiss” as that might cause less confusion) 4. (b). Alternate Hypothesis (H₁ ): A statement that some difference or effect is expected. Accepting the alternative hypothesis will lead to changes in opinions or actions. It is the opposite of the null hypothesis. To know more about Null and Alternate hypotheses please watch this below video 5. (a). One-Tailed Test: A one-tailed test is a statistical hypothesis test in which the critical area of a distribution is one- sided so that it is either greater than or less than a certain value, but not both. If the sample being tested falls into the one-sided critical area, the alternative hypothesis will be accepted instead of the null hypothesis. A one-tailed test is also known as a directional hypothesis or directional test. Critical Region: The critical region is the region of values that corresponds to the rejection of the null hypothesis at some chosen probability level. 5. (b). Two-Tailed Test: A two-tailed test is a method in which the critical area of a distribution is two-sided and tests whether a sample is greater than or less than a certain range of values. If the sample being tested
  • 5. falls into either of the critical areas, the alternative hypothesis is accepted instead of the null hypothesis. By convention, two-tailed tests are used to determine significance at the 5% level, meaning each side of the distribution is cut at 2.5% 6. Test Statistic: The teststatistic measures how close the sample has come to the null hypothesis. Its observed value changes randomly from one random sample to a different sample. A test statistic contains information about the data that is relevant for deciding whether to reject the null hypothesis or not. Different hypothesis tests use different test statistics based on the probability model assumed in the null hypothesis. Common tests and their test statistics include:
  • 6. Image from https://support.minitab.com In general, the sample data must provide sufficient evidence to reject the null hypothesis and conclude that the effect exists in the population. Ideally, a hypothesis test fails to reject the null hypothesis when the effect is not present in the population, and it rejects the null hypothesis when the effect exists. By now we understand that the entire hypothesis testing works on based on the sample that is at hand. We may come to a different conclusion if the sample is changed. There are two types of errors that relate to incorrect conclusions about the null hypothesis. 7. (a). Type-I Error: Type-I error occurs when the sample results, lead to the rejection of the null hypothesis when it is in fact true. Type-I errors are equivalent to false positives. Type-I errors can be controlled. The value of alpha, which is related to the levelof Significance that we selected has a direct bearing on Type-I errors. 7. (b). Type-II Error: Type-II error occurs when based on the sample results, the null hypothesis is not rejected when it is in fact false. Type-II errors are equivalent to false negatives. Level of Significance (α):
  • 7. The probability of making a Type-I error and it is denoted by alpha (α). Alpha is the maximum probability that we have a Type-I error. For a 95% confidence level, the value of alpha is 0.05. This means that there is a 5% probability that we will reject a true null hypothesis. P-Value: The p-valueis used all over statistics, from t-tests to simple regression analysis to tree-based models almost in all the machine learning models. We all use P-values to determine statistical significance in a hypothesis test. Despite being so important, the P-value is a slippery concept that people often interpret incorrectly. P-values evaluate how well the sample data support the devil’s advocate argument that the null hypothesis is true. It measures how compatible your data are with the null hypothesis. How likely the effect observed in your sample data if the null hypothesis is true? In other words, given the null hypothesis is true, a P-Value is a probability of getting a result as or more extreme than the sample result by random chance alone. High P-Values: Your data are likely with a true null Low P-Values: Your data are unlikely with a true null Ex: Suppose you are testing the following hypothesis at a significance level (α) of 5% and you got the p-value as 3%, and your sample statistic is x̄ = 25 H₀ : μ = 20 H₁ : μ > 20 The interpretation of the p-value as follows: We saw above that α is also known as committing Type-I error. When we say α=5%, we are fine to reject our null hypothesis 5 out of 100 times even though it is true. Now that our P-value is 3% which is less than α (we are definitely below the threshold of committing Type-I error), means obtaining a sample statistic as extreme as possible (x̄ >= 25) given that H₀ is true is very less. In other words, we can’t obtain our sample statisticas long as we assume H₀ is true. Hence, we reject H₀ and accept H₁ . Suppose you get P-Value as 6% i.e. the probability of obtaining the sample
  • 8. statistic as extreme as possible is higher given that the null hypothesis is true. So we fail to reject H₀ , comparing with α we can’t take risk of committing Type-I error more than the agreed level of significance. Hence, we fail to reject the null hypothesis and reject the alternative hypothesis. Now that we understood the basic terminology in the Hypothesis Testing, now let’s look at the steps involved in the Hypothesis Testing and an illustration with an example. For example, a major department store is considering the introduction of an Internet shopping service. The new service will be introduced if more than 40 percent of the Internet users shop via the Internet. Step1: Formulate the Hypotheses: The appropriate way to formulate the hypotheses is: H₀ : π ≤ 0.40 H₁ : π > 0.40 If the null hypothesis H₀ is rejected, then the alternative hypothesis H₁ will be accepted and the new Internet shopping service will be introduced. On the other hand, if we fail to reject H₀ then the new service should not be introduced unless additional evidence is obtained. This test of the
  • 9. null hypothesis is a one-tailed test, because the alternative hypothesis is expressed directionally: The proportion of Internet users who use the Internet for shopping is greater than 0.40. Step2: Select an appropriate Test: To test the null hypothesis, it is necessary to select an appropriate statistical technique. For this example, the z statistic, which follows the standard normal distribution would be appropriate. z = (p-π)/σₚ, where σₚ=sqrt(π(1-π)/n) Step3: Choose Level of Significance, α: We understood that Level of Significance refers to Type-I error. In our example, a Type-I error would occur if we concluded, based on the sample data, that the proportion of customers preferring the new service plan was greater than 0.40, when in fact it was less than or equal to 0.40. The Type-II error would occur if we concluded, based on the sample data, that the proportion of customers preferring the new service plan was less than or equal to 0.40 when, in fact, it was greater than 0.40. It is necessary to balance the two types of errors. As a compromise, α is often set at 0.05; sometimes it is 0.01; other values of α are rare. We will consider 0.05 for our example. Step4: Collect Data and Calculate Test Statistic: Sample size is determined after taking into account the desired α and other qualitative considerations, such as budget constraints to collect the sample data. For our example, let's say, 30 users were surveyed and 17 indicated that they used the Internet for shopping. Thus, the value of the sample proportion is p=17/30=0.567. The value of σₚ=sqrt((0.40)(0.60)/30)=0.089. The test statistic z can be calculated as z=(p-π)/σₚ=(0.567–0.40)/0.089=1.88
  • 10. Step5: Determine the Probability (or Critical Value): Using standard normal tables from the above, the probability of obtaining a z value of 1.88 is 0.96995 i.e. P(z≤1.88)=0.96995. But we wanted to calculate the probability to the right of z (because we are interested in obtaining the probability value that falls in the rejection region or critical region), i.e. 1–0.96995=0.03005. This Probability is directly comparable to α (since α is committing a Type-I error and the probability value that we calculated also falls in the critical region)
  • 11. If you wanted to understand how to look up for the probability values for the given z scores, please watch below video: Alternatively, the critical value of z, which will give an area to the right side of the critical value of 0.05, is between 1.64 (at 1.64 the probability is 0.94950) and 1.65 (at 1.65 the probability is 0.95053) and equals 1.645 (the probability is 0.95, i.e. from the left of the normaldistribution, which means to the right it is 0.05). Note that in determining the critical value of the test statistic, the area in the tail beyond the critical value is either α or α/2. It is α for a one-tailed test and α/2 for a two-tailed test. Our example is a one-tailed test. If you wanted to understand how to look up for the critical value of α, Please watch below video: Step 6 and 7: Compare the probability (or Critical value) and make the decision: The probability associated with the calculated or observed value of the test statistic is 0.03005. This is the probability of getting a P-Value of 0.567 (sample proportion = p) when π=0.40. This is less than the level of significance of 0.05. Hence, the null hypothesis is rejected. Alternatively, the calculated value of the test statistic z=1.88 lies in the rejection region, beyond the value of 1.645. Again, the same conclusion to reject the null hypothesis is reached. Note that two ways of testing the null hypothesis are equivalent but mathematically opposite in the direction of comparison. If the probability associated with the calculated or observed value of the test statistic (TSCAL) is less than the level of significance (α), the null hypothesis is rejected. However, if the absolute value of the calculated value of the test statistic is greater thanthe absolute value of the critical value of the test statistic (TSCR), the null hypothesis is rejected. The reason for this sign shift is that the larger the absolute value of TSCAL, the smaller the probability of obtaining a more extreme value of the test statistic under the null hypothesis. if the probability of TSCAL < significance level (α), then reject H₀ . But, if |TSCAL| > |TSCR|, then reject H₀ Step8: Conclusion:
  • 12. In our example, we conclude that there is evidence that the proportion of Internet users who shop via the Internet is significantly greater than 0.40. Hence, the recommendation to the department store would be to introduce the new Internet shopping service. This example refers to one sample test of proportions. However, there are several types of tests exist depends on the knowledge about the population and the problem at hand. For Example, We have a t-test, Z-test. Chi-Square Test, Mann-Whitney Test, Wilcoxon Test, etc. With this, I would like to conclude the Part-I of “Everything You Need To Know about Hypothesis Testing”. I will discuss the Parametric and Non-Parametric tests and which test to use in what scenario in Part-II. Until then Happy Learning…