Breaking of Drought in cental area of NSW Australia
•
0 j'aime•334 vues

NSW Drought Breaking

Recommandé
Contenu connexe
Dernier
Dernier (20)
En vedette
En vedette (20)
Breaking of Drought in cental area of NSW Australia
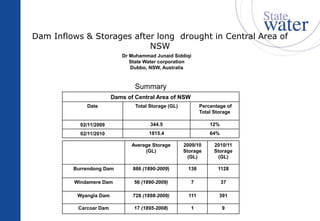
- 1. Dam Inflows & Storages after long drought in Central Area of NSW Dr Muhammad Junaid Siddiqi State Water corporation Dubbo, NSW, Australia Summary Dams of Central Area of NSW Date Total Storage (GL) Percentage of Total Storage 02/11/2009 344.5 12% 02/11/2010 1815.4 64% Average Storage (GL) 2009/10 Storage (GL) 2010/11 Storage (GL) Burrendong Dam 886 (1890-2009) 138 1128 Windamere Dam 56 (1890-2009) 7 37 Wyangla Dam 728 (1898-2009) 111 391 Carcoar Dam 17 (1895-2008) 1 9
- 2. Burrendong Dam Burrendong Dam Inflows 0 100 200 300 400 500 Jul Aug Sep Oct Nov Dec Jan Feb Mar Apr May Jun Months TotalMonthlyInflows(GL) 0 20 40 60 80 100 120 140 MeanInflows(GL)from1890to2009 Mean Monthly Inflows 2009/10 2008/09 2010/11 2007/08
- 3. Windamere Dam Windamere Dam Inflows 0 4 8 12 16 Jul Aug Sep Oct Nov Dec Jan Feb Mar Apr May Jun Months TotalInflows(GL) 0 2 4 6 8 MeanInflowsfrom1890to2009(GL) 2009/10 2008/09 2010/11 2007/08 Mean Monthly Inflows
- 4. Wyangla Dam Wyangla Dam Inflows 0 50 100 150 Jul Aug Sep Oct Nov Dec Jan Feb Mar Apr May Jun Months TotalMonthlyInflows(GL) 0 20 40 60 80 100 120 140 MeanInflows(GL)from1898to2009 2008/09 2010/11 2009/10 2007/08 Mean Monthly Inflows
- 5. Carcoar Dam Carcoar Dam Inflows 0 1 2 3 4 5 Jul Aug Sep Oct Nov Dec Jan Feb Mar Apr May Jun Months TotalMonthlyInflows(GL) 0 1 2 3 4 MeanMonthlyInflows(GL)from1895 to2008 2008/09 2010/11 Mean MonthlyInflows 2009/10 2007/08
- 6. Burrendong Dam Capacity (%) 0% 10% 20% 30% 40% 50% 60% 70% 80% 90% 100% 110% 120% 130% 140% 150% Jul/95N ov/95M ar/96Jul/96N ov/96M ar/97Jul/97N ov/97M ar/98Jul/98N ov/98M ar/99Jul/99N ov/99M ar/00Jul/00N ov/00M ar/01Jul/01N ov/01M ar/02Jul/02N ov/02M ar/03Jul/03N ov/03M ar/04Jul/04N ov/04M ar/05Jul/05N ov/05M ar/06Jul/06N ov/06M ar/07Jul/07N ov/07M ar/08Jul/08N ov/08M ar/09Jul/09N ov/09M ar/10Jul/10 Date BurrendongStorage(%)
- 7. Wyangla Dam Capacity (%) 0% 10% 20% 30% 40% 50% 60% 70% 80% 90% Jun/01 O ct/01 Feb/02 Jun/02 O ct/02 Feb/03 Jun/03O ct/03 Feb/04 Jun/04 O ct/04 Feb/05 Jun/05O ct/05 Feb/06 Jun/06 O ct/06 Feb/07 Jun/07 O ct/07 Feb/08 Jun/08O ct/08 Feb/09 Jun/09 O ct/09 Feb/10 Jun/10O ct/10 Date WyanagalaStorage(%)
- 8. Comparison of Dam Storages on 02/11/09 & 02/11/10 Dam Storages in Central Area of NSW 5.3% 38.8% 7.7% 29.8% 14.2% 103.5% 21.1% 27.6% 0% 20% 40% 60% 80% 100% 120% 02-Nov-09 02-Nov-10 Date DamCapacity(%) Wyangala Dam Carcoar Dam Burrendong Dam Windamere Dam
- 9. Comparison of Dam Volumes on 02/11/09 & 02/11/10 Dam Volumes in Central Area of NSW 65 473 3 11 198 1229 79 102 0 200 400 600 800 1,000 1,200 1,400 02-Nov-09 02-Nov-10 Date DamVolume(GL) Wyangala Dam Carcoar Dam Burrendong Dam Windamere Dam