SlideShare une entreprise Scribd logo
1  sur  4
Xinmin Secondary School
                                Sec 3E A Maths IT Worksheet
                    Topic: Graphs of Exponential and Logarithmic Functions

Name:                                     (    )          Class:                Date:


Objectives: At the end of the lesson, you should be able to
1. sketch exponential graphs, indicating clearly the asymptotes & intercepts.
2. sketch logarithmic graphs, indicating clearly the asymptotes & intercepts.
3. draw the straight lines required to solve equations.


Instructions:
1. In Graphmatica, under the View menu, ensure that Rectangular is selected.
2. For each of the following graphs, focus on the following:
        shape
        asymptote
        axes intercepts, if any.
3. Deduce relationships among graphs.

A. EXPONENTIAL GRAPHS

 Graph                       A                               B                             C
 Equation                  y = ex                         y = e− x                      y = − ex
 Asymptote                 x-axis
 y-intercept                 1
 x-intercept                 


 Sketch


1. Graph B is of the form y = e−x. Describe how you can obtain this graph from y = ex (Graph A)?


2. Graph C is of the form y = −ex. Describe how you can obtain this graph from y = ex (Graph A)?


3. Why do you think the x-axis is the asymptote in the above graphs?


4. Without using Graphmatica, sketch the graph of y = −e−x.

3E/AM/IT/Exp&LogGraphs                                1
(a) Asymptote       :

                                                           (b) y-intercept     :

                                                           (c) x-intercept     :


   To verify your answer, use Graphmatica to plot the above graph. Describe how you obtained the graph
   of y = −e−x from y = ex.


   Graph                      D                              E                             F
   Equation                 y = 2x                      y = 2− x – 1                  y = − 2x + 3
   Asymptote
   y-intercept
   x-intercept


   Sketch


1. Graph D has the same shape, asymptote and intercept as Graph A? Why is that so?


2. Graph E is of the form y = 2−x – 1. Describe how you can obtain this graph from y = 2x (Graph D)?


3. Graph F is of the form y = −2x + 3. Describe how you can obtain this graph from y = 2x (Graph D)?


B. LOGARITHMIC GRAPHS


3E/AM/IT/Exp&LogGraphs                             2
Graph                   A                       B                        C                         D
Equation             y = lg x              y = lg (− x)              y = − lg x              y = − lg (− x)
Asymptote
y-intercept
x-intercept


Sketch


 1. Graph B is of the form y = lg (−x). Describe how you can obtain this graph from y = lg x (Graph A)?


 2. Graph C is of the form y = − lg x. Describe how you can obtain this graph from y = lg x (Graph A)?


 3. Graph D is of the form y = −lg (−x). Describe how you can obtain this graph from y = lg x (Graph A)?


 4. When the coefficient of x in an equation changes from positive to negative, what do you notice about
     the change in the graphs?


 5. When an equation changes from positive y to negative y, what do you notice about the change in the
     graphs?


 6. Do you expect any difference in the shape, asymptote and intercept of the graphs of y = lg x and
     y = ln x? Why?


 7. Without using Graphmatica, sketch the following graphs.

     (i) y = ln (3 – x).
 3E/AM/IT/Exp&LogGraphs                               3
To find asymptote: Let (3 – x) = 0

                                                                                            x=         .


                                                         To find x-intercept: Let ln(3 – x) = 0

                                                                                      (3 – x) = 1

                                                                                            x=         .


   (ii) y = 1 – ln (x + 2)

                                                         To find asymptote: Let (x + 2) = 0

                                                                                       x=.


                                                         To find x-intercept: Let 1 – ln (x + 2) = 0

                                                                                     ln (x + 2) = 1

                                                                                         x + 2 = e1

                                                                                                 x=        .

                                                        To find y-intercept:: x = 0 ∴ y =                  .

    To verify your answers, use Graphmatica to plot the above graphs.


   Summary
   1. In sketching exponential and logarithmic graphs, focus on the

           (i)

           (ii)

           (iii)

   2. When the coefficient of x in an equation changes from positive to negative, the
       graphs are a reflection of each other in the           -axis.

   3. When an equation changes from positive y to negative y, the graphs are a reflection
       of each other in the            -axis.


3E/AM/IT/Exp&LogGraphs                            4

Contenu connexe

Tendances

Spm Add Maths Formula List Form4
Spm Add Maths Formula List Form4Spm Add Maths Formula List Form4
Spm Add Maths Formula List Form4guest76f49d
 
Add Math(F5) Graph Of Function Ii 2.1
Add Math(F5) Graph Of Function Ii 2.1Add Math(F5) Graph Of Function Ii 2.1
Add Math(F5) Graph Of Function Ii 2.1roszelan
 
2.2 Polynomial Function Notes
2.2 Polynomial Function Notes2.2 Polynomial Function Notes
2.2 Polynomial Function Noteslgemgnani
 
Graphs of polynomial functions
Graphs of polynomial functionsGraphs of polynomial functions
Graphs of polynomial functionsCarlos Erepol
 
Module 2 lesson 4 notes
Module 2 lesson 4 notesModule 2 lesson 4 notes
Module 2 lesson 4 notestoni dimella
 
5HBC: How to Graph Implicit Relations Intro Packet!
5HBC: How to Graph Implicit Relations Intro Packet!5HBC: How to Graph Implicit Relations Intro Packet!
5HBC: How to Graph Implicit Relations Intro Packet!A Jorge Garcia
 
Polynomial functionsandgraphs
Polynomial functionsandgraphsPolynomial functionsandgraphs
Polynomial functionsandgraphsJerlyn Fernandez
 
Exp&log graphs assignment
Exp&log graphs assignmentExp&log graphs assignment
Exp&log graphs assignmentbryan
 
3 Forms Of A Quadratic Function
3 Forms Of A Quadratic Function3 Forms Of A Quadratic Function
3 Forms Of A Quadratic Functionguestc8e5bb
 
Rational functions
Rational functionsRational functions
Rational functionszozima
 
Quadratic Function by Robert & Phillip
Quadratic Function by Robert & PhillipQuadratic Function by Robert & Phillip
Quadratic Function by Robert & PhillipHope Scott
 
Mathematics 9 Lesson 3: Quadratic Functions
Mathematics 9 Lesson 3: Quadratic FunctionsMathematics 9 Lesson 3: Quadratic Functions
Mathematics 9 Lesson 3: Quadratic FunctionsJuan Miguel Palero
 
Linear Functions
Linear FunctionsLinear Functions
Linear Functionskliegey524
 
3 1 Quadratic Functions
3 1 Quadratic Functions3 1 Quadratic Functions
3 1 Quadratic Functionssilvia
 
Module 10 Graphs Of Functions
Module 10 Graphs Of FunctionsModule 10 Graphs Of Functions
Module 10 Graphs Of Functionsguestcc333c
 

Tendances (19)

Spm Add Maths Formula List Form4
Spm Add Maths Formula List Form4Spm Add Maths Formula List Form4
Spm Add Maths Formula List Form4
 
Add Math(F5) Graph Of Function Ii 2.1
Add Math(F5) Graph Of Function Ii 2.1Add Math(F5) Graph Of Function Ii 2.1
Add Math(F5) Graph Of Function Ii 2.1
 
Inequações
InequaçõesInequações
Inequações
 
2.2 Polynomial Function Notes
2.2 Polynomial Function Notes2.2 Polynomial Function Notes
2.2 Polynomial Function Notes
 
Graphs of polynomial functions
Graphs of polynomial functionsGraphs of polynomial functions
Graphs of polynomial functions
 
Module 2 lesson 4 notes
Module 2 lesson 4 notesModule 2 lesson 4 notes
Module 2 lesson 4 notes
 
Quadratic functions
Quadratic functionsQuadratic functions
Quadratic functions
 
5HBC: How to Graph Implicit Relations Intro Packet!
5HBC: How to Graph Implicit Relations Intro Packet!5HBC: How to Graph Implicit Relations Intro Packet!
5HBC: How to Graph Implicit Relations Intro Packet!
 
Polynomial functionsandgraphs
Polynomial functionsandgraphsPolynomial functionsandgraphs
Polynomial functionsandgraphs
 
Exp&log graphs assignment
Exp&log graphs assignmentExp&log graphs assignment
Exp&log graphs assignment
 
Polinômios 1
Polinômios 1Polinômios 1
Polinômios 1
 
3 Forms Of A Quadratic Function
3 Forms Of A Quadratic Function3 Forms Of A Quadratic Function
3 Forms Of A Quadratic Function
 
Sistemas lineares 2
Sistemas lineares 2Sistemas lineares 2
Sistemas lineares 2
 
Rational functions
Rational functionsRational functions
Rational functions
 
Quadratic Function by Robert & Phillip
Quadratic Function by Robert & PhillipQuadratic Function by Robert & Phillip
Quadratic Function by Robert & Phillip
 
Mathematics 9 Lesson 3: Quadratic Functions
Mathematics 9 Lesson 3: Quadratic FunctionsMathematics 9 Lesson 3: Quadratic Functions
Mathematics 9 Lesson 3: Quadratic Functions
 
Linear Functions
Linear FunctionsLinear Functions
Linear Functions
 
3 1 Quadratic Functions
3 1 Quadratic Functions3 1 Quadratic Functions
3 1 Quadratic Functions
 
Module 10 Graphs Of Functions
Module 10 Graphs Of FunctionsModule 10 Graphs Of Functions
Module 10 Graphs Of Functions
 

Similaire à Exp&log graphs it worksheet

2 3 graphing polynomials
2 3 graphing polynomials2 3 graphing polynomials
2 3 graphing polynomialshisema01
 
Exercise #13 notes ~ graphing
Exercise #13 notes ~ graphingExercise #13 notes ~ graphing
Exercise #13 notes ~ graphingKelly Scallion
 
sol page 104 #1,2,3.
sol page 104 #1,2,3.sol page 104 #1,2,3.
sol page 104 #1,2,3.Garden City
 
Graph of rational function
Graph of rational functionGraph of rational function
Graph of rational functionJecel Ginga
 
Midterm Study Guide
Midterm Study GuideMidterm Study Guide
Midterm Study Guidevhiggins1
 
X2 T07 03 addition, subtraction, multiplication & division (2011)
X2 T07 03 addition, subtraction,  multiplication & division (2011)X2 T07 03 addition, subtraction,  multiplication & division (2011)
X2 T07 03 addition, subtraction, multiplication & division (2011)Nigel Simmons
 
X2 T04 03 cuve sketching - addition, subtraction, multiplication and division
X2 T04 03 cuve sketching - addition, subtraction,  multiplication and divisionX2 T04 03 cuve sketching - addition, subtraction,  multiplication and division
X2 T04 03 cuve sketching - addition, subtraction, multiplication and divisionNigel Simmons
 
Rational functions
Rational functionsRational functions
Rational functionsTarun Gehlot
 
chapter1_part2.pdf
chapter1_part2.pdfchapter1_part2.pdf
chapter1_part2.pdfAliEb2
 
X2 t07 03 addition, subtraction, multiplication & division (2012)
X2 t07 03 addition, subtraction,  multiplication & division (2012)X2 t07 03 addition, subtraction,  multiplication & division (2012)
X2 t07 03 addition, subtraction, multiplication & division (2012)Nigel Simmons
 
Whats u need to graphing polynomials
Whats u  need to  graphing polynomialsWhats u  need to  graphing polynomials
Whats u need to graphing polynomialsTarun Gehlot
 
Graphs of trigonometric exponential functions lecture
Graphs of trigonometric exponential functions lectureGraphs of trigonometric exponential functions lecture
Graphs of trigonometric exponential functions lectureAdnanBukhari13
 
Vertical asymptotes to rational functions
Vertical asymptotes to rational functionsVertical asymptotes to rational functions
Vertical asymptotes to rational functionsTarun Gehlot
 
Jan. 13 polynonial sketching
Jan. 13 polynonial sketchingJan. 13 polynonial sketching
Jan. 13 polynonial sketchingRyanWatt
 
02.21.2020 Algebra I Quadraic Functions.ppt
02.21.2020  Algebra I Quadraic Functions.ppt02.21.2020  Algebra I Quadraic Functions.ppt
02.21.2020 Algebra I Quadraic Functions.pptjannelewlawas
 
Straight Line Graphs
Straight Line GraphsStraight Line Graphs
Straight Line GraphsTrishdooley
 
P2 Graphs Function
P2  Graphs FunctionP2  Graphs Function
P2 Graphs Functionguestcc333c
 
Straight line properties
Straight line propertiesStraight line properties
Straight line propertiesAwais Khan
 
Jacob's and Vlad's D.E.V. Project - 2012
Jacob's and Vlad's D.E.V. Project - 2012Jacob's and Vlad's D.E.V. Project - 2012
Jacob's and Vlad's D.E.V. Project - 2012Jacob_Evenson
 
ISI MSQE Entrance Question Paper (2008)
ISI MSQE Entrance Question Paper (2008)ISI MSQE Entrance Question Paper (2008)
ISI MSQE Entrance Question Paper (2008)CrackDSE
 

Similaire à Exp&log graphs it worksheet (20)

2 3 graphing polynomials
2 3 graphing polynomials2 3 graphing polynomials
2 3 graphing polynomials
 
Exercise #13 notes ~ graphing
Exercise #13 notes ~ graphingExercise #13 notes ~ graphing
Exercise #13 notes ~ graphing
 
sol page 104 #1,2,3.
sol page 104 #1,2,3.sol page 104 #1,2,3.
sol page 104 #1,2,3.
 
Graph of rational function
Graph of rational functionGraph of rational function
Graph of rational function
 
Midterm Study Guide
Midterm Study GuideMidterm Study Guide
Midterm Study Guide
 
X2 T07 03 addition, subtraction, multiplication & division (2011)
X2 T07 03 addition, subtraction,  multiplication & division (2011)X2 T07 03 addition, subtraction,  multiplication & division (2011)
X2 T07 03 addition, subtraction, multiplication & division (2011)
 
X2 T04 03 cuve sketching - addition, subtraction, multiplication and division
X2 T04 03 cuve sketching - addition, subtraction,  multiplication and divisionX2 T04 03 cuve sketching - addition, subtraction,  multiplication and division
X2 T04 03 cuve sketching - addition, subtraction, multiplication and division
 
Rational functions
Rational functionsRational functions
Rational functions
 
chapter1_part2.pdf
chapter1_part2.pdfchapter1_part2.pdf
chapter1_part2.pdf
 
X2 t07 03 addition, subtraction, multiplication & division (2012)
X2 t07 03 addition, subtraction,  multiplication & division (2012)X2 t07 03 addition, subtraction,  multiplication & division (2012)
X2 t07 03 addition, subtraction, multiplication & division (2012)
 
Whats u need to graphing polynomials
Whats u  need to  graphing polynomialsWhats u  need to  graphing polynomials
Whats u need to graphing polynomials
 
Graphs of trigonometric exponential functions lecture
Graphs of trigonometric exponential functions lectureGraphs of trigonometric exponential functions lecture
Graphs of trigonometric exponential functions lecture
 
Vertical asymptotes to rational functions
Vertical asymptotes to rational functionsVertical asymptotes to rational functions
Vertical asymptotes to rational functions
 
Jan. 13 polynonial sketching
Jan. 13 polynonial sketchingJan. 13 polynonial sketching
Jan. 13 polynonial sketching
 
02.21.2020 Algebra I Quadraic Functions.ppt
02.21.2020  Algebra I Quadraic Functions.ppt02.21.2020  Algebra I Quadraic Functions.ppt
02.21.2020 Algebra I Quadraic Functions.ppt
 
Straight Line Graphs
Straight Line GraphsStraight Line Graphs
Straight Line Graphs
 
P2 Graphs Function
P2  Graphs FunctionP2  Graphs Function
P2 Graphs Function
 
Straight line properties
Straight line propertiesStraight line properties
Straight line properties
 
Jacob's and Vlad's D.E.V. Project - 2012
Jacob's and Vlad's D.E.V. Project - 2012Jacob's and Vlad's D.E.V. Project - 2012
Jacob's and Vlad's D.E.V. Project - 2012
 
ISI MSQE Entrance Question Paper (2008)
ISI MSQE Entrance Question Paper (2008)ISI MSQE Entrance Question Paper (2008)
ISI MSQE Entrance Question Paper (2008)
 

Plus de bryan

Debate writeup1
Debate writeup1Debate writeup1
Debate writeup1bryan
 
Mobile phone security advisory for parents
Mobile phone security advisory for parentsMobile phone security advisory for parents
Mobile phone security advisory for parentsbryan
 
Demerit point system
Demerit point systemDemerit point system
Demerit point systembryan
 
Xmss ict lesson zhuang haoyang
Xmss  ict lesson zhuang haoyangXmss  ict lesson zhuang haoyang
Xmss ict lesson zhuang haoyangbryan
 
Distance time graphs
Distance time graphsDistance time graphs
Distance time graphsbryan
 
Xmss ict lesson template yip minghao
Xmss  ict lesson template   yip minghaoXmss  ict lesson template   yip minghao
Xmss ict lesson template yip minghaobryan
 
Xmss ict lesson template aichin
Xmss  ict lesson template aichinXmss  ict lesson template aichin
Xmss ict lesson template aichinbryan
 
Ict lesson plan for sec 1 e (fuctions and graphs)
Ict lesson plan for sec 1 e (fuctions and graphs)Ict lesson plan for sec 1 e (fuctions and graphs)
Ict lesson plan for sec 1 e (fuctions and graphs)bryan
 
Ict lesson plan
Ict lesson planIct lesson plan
Ict lesson planbryan
 
Xmss ict lesson on graphs of trigonometrical functions
Xmss  ict lesson on graphs of trigonometrical functionsXmss  ict lesson on graphs of trigonometrical functions
Xmss ict lesson on graphs of trigonometrical functionsbryan
 
Worksheets on graphs of trigonometry 2010
Worksheets on graphs of trigonometry 2010Worksheets on graphs of trigonometry 2010
Worksheets on graphs of trigonometry 2010bryan
 
Xmss ict lesson template
Xmss  ict lesson templateXmss  ict lesson template
Xmss ict lesson templatebryan
 
Meiosis animation + microscopy + interactive game worksheet
Meiosis animation + microscopy + interactive game worksheetMeiosis animation + microscopy + interactive game worksheet
Meiosis animation + microscopy + interactive game worksheetbryan
 
So you think you can dance instructional sheet
So you think you can dance instructional sheetSo you think you can dance instructional sheet
So you think you can dance instructional sheetbryan
 
Teacher's powerpoint
Teacher's powerpointTeacher's powerpoint
Teacher's powerpointbryan
 
Xmss ict lesson plan jane toh
Xmss ict lesson plan jane tohXmss ict lesson plan jane toh
Xmss ict lesson plan jane tohbryan
 
Xmss ict lesson template
Xmss  ict lesson templateXmss  ict lesson template
Xmss ict lesson templatebryan
 
Xmss ict lesson template
Xmss  ict lesson templateXmss  ict lesson template
Xmss ict lesson templatebryan
 
Xmss ict lesson template (clement)
Xmss  ict lesson template (clement)Xmss  ict lesson template (clement)
Xmss ict lesson template (clement)bryan
 
Cindy's ict lesson template
Cindy's ict lesson templateCindy's ict lesson template
Cindy's ict lesson templatebryan
 

Plus de bryan (20)

Debate writeup1
Debate writeup1Debate writeup1
Debate writeup1
 
Mobile phone security advisory for parents
Mobile phone security advisory for parentsMobile phone security advisory for parents
Mobile phone security advisory for parents
 
Demerit point system
Demerit point systemDemerit point system
Demerit point system
 
Xmss ict lesson zhuang haoyang
Xmss  ict lesson zhuang haoyangXmss  ict lesson zhuang haoyang
Xmss ict lesson zhuang haoyang
 
Distance time graphs
Distance time graphsDistance time graphs
Distance time graphs
 
Xmss ict lesson template yip minghao
Xmss  ict lesson template   yip minghaoXmss  ict lesson template   yip minghao
Xmss ict lesson template yip minghao
 
Xmss ict lesson template aichin
Xmss  ict lesson template aichinXmss  ict lesson template aichin
Xmss ict lesson template aichin
 
Ict lesson plan for sec 1 e (fuctions and graphs)
Ict lesson plan for sec 1 e (fuctions and graphs)Ict lesson plan for sec 1 e (fuctions and graphs)
Ict lesson plan for sec 1 e (fuctions and graphs)
 
Ict lesson plan
Ict lesson planIct lesson plan
Ict lesson plan
 
Xmss ict lesson on graphs of trigonometrical functions
Xmss  ict lesson on graphs of trigonometrical functionsXmss  ict lesson on graphs of trigonometrical functions
Xmss ict lesson on graphs of trigonometrical functions
 
Worksheets on graphs of trigonometry 2010
Worksheets on graphs of trigonometry 2010Worksheets on graphs of trigonometry 2010
Worksheets on graphs of trigonometry 2010
 
Xmss ict lesson template
Xmss  ict lesson templateXmss  ict lesson template
Xmss ict lesson template
 
Meiosis animation + microscopy + interactive game worksheet
Meiosis animation + microscopy + interactive game worksheetMeiosis animation + microscopy + interactive game worksheet
Meiosis animation + microscopy + interactive game worksheet
 
So you think you can dance instructional sheet
So you think you can dance instructional sheetSo you think you can dance instructional sheet
So you think you can dance instructional sheet
 
Teacher's powerpoint
Teacher's powerpointTeacher's powerpoint
Teacher's powerpoint
 
Xmss ict lesson plan jane toh
Xmss ict lesson plan jane tohXmss ict lesson plan jane toh
Xmss ict lesson plan jane toh
 
Xmss ict lesson template
Xmss  ict lesson templateXmss  ict lesson template
Xmss ict lesson template
 
Xmss ict lesson template
Xmss  ict lesson templateXmss  ict lesson template
Xmss ict lesson template
 
Xmss ict lesson template (clement)
Xmss  ict lesson template (clement)Xmss  ict lesson template (clement)
Xmss ict lesson template (clement)
 
Cindy's ict lesson template
Cindy's ict lesson templateCindy's ict lesson template
Cindy's ict lesson template
 

Exp&log graphs it worksheet

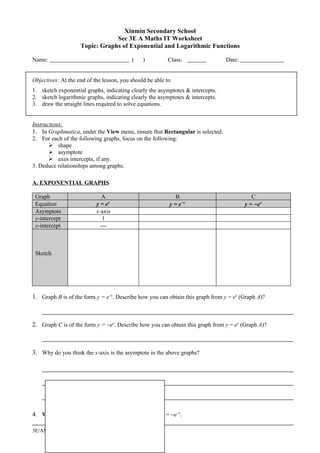
  • 1. Xinmin Secondary School Sec 3E A Maths IT Worksheet Topic: Graphs of Exponential and Logarithmic Functions Name: ( ) Class: Date: Objectives: At the end of the lesson, you should be able to 1. sketch exponential graphs, indicating clearly the asymptotes & intercepts. 2. sketch logarithmic graphs, indicating clearly the asymptotes & intercepts. 3. draw the straight lines required to solve equations. Instructions: 1. In Graphmatica, under the View menu, ensure that Rectangular is selected. 2. For each of the following graphs, focus on the following:  shape  asymptote  axes intercepts, if any. 3. Deduce relationships among graphs. A. EXPONENTIAL GRAPHS Graph A B C Equation y = ex y = e− x y = − ex Asymptote x-axis y-intercept 1 x-intercept  Sketch 1. Graph B is of the form y = e−x. Describe how you can obtain this graph from y = ex (Graph A)? 2. Graph C is of the form y = −ex. Describe how you can obtain this graph from y = ex (Graph A)? 3. Why do you think the x-axis is the asymptote in the above graphs? 4. Without using Graphmatica, sketch the graph of y = −e−x. 3E/AM/IT/Exp&LogGraphs 1
  • 2. (a) Asymptote : (b) y-intercept : (c) x-intercept : To verify your answer, use Graphmatica to plot the above graph. Describe how you obtained the graph of y = −e−x from y = ex. Graph D E F Equation y = 2x y = 2− x – 1 y = − 2x + 3 Asymptote y-intercept x-intercept Sketch 1. Graph D has the same shape, asymptote and intercept as Graph A? Why is that so? 2. Graph E is of the form y = 2−x – 1. Describe how you can obtain this graph from y = 2x (Graph D)? 3. Graph F is of the form y = −2x + 3. Describe how you can obtain this graph from y = 2x (Graph D)? B. LOGARITHMIC GRAPHS 3E/AM/IT/Exp&LogGraphs 2
  • 3. Graph A B C D Equation y = lg x y = lg (− x) y = − lg x y = − lg (− x) Asymptote y-intercept x-intercept Sketch 1. Graph B is of the form y = lg (−x). Describe how you can obtain this graph from y = lg x (Graph A)? 2. Graph C is of the form y = − lg x. Describe how you can obtain this graph from y = lg x (Graph A)? 3. Graph D is of the form y = −lg (−x). Describe how you can obtain this graph from y = lg x (Graph A)? 4. When the coefficient of x in an equation changes from positive to negative, what do you notice about the change in the graphs? 5. When an equation changes from positive y to negative y, what do you notice about the change in the graphs? 6. Do you expect any difference in the shape, asymptote and intercept of the graphs of y = lg x and y = ln x? Why? 7. Without using Graphmatica, sketch the following graphs. (i) y = ln (3 – x). 3E/AM/IT/Exp&LogGraphs 3
  • 4. To find asymptote: Let (3 – x) = 0 x= . To find x-intercept: Let ln(3 – x) = 0 (3 – x) = 1 x= . (ii) y = 1 – ln (x + 2) To find asymptote: Let (x + 2) = 0 x=. To find x-intercept: Let 1 – ln (x + 2) = 0 ln (x + 2) = 1 x + 2 = e1 x= . To find y-intercept:: x = 0 ∴ y = . To verify your answers, use Graphmatica to plot the above graphs. Summary 1. In sketching exponential and logarithmic graphs, focus on the (i) (ii) (iii) 2. When the coefficient of x in an equation changes from positive to negative, the graphs are a reflection of each other in the -axis. 3. When an equation changes from positive y to negative y, the graphs are a reflection of each other in the -axis. 3E/AM/IT/Exp&LogGraphs 4