2. Air pollution levels halved in a New Zealand prison
2
Air pollution levels were halved in a New Zealand prison
We placed a fine particle (≤2.5 μm in diameter) monitor
(TSI SidePak AM510 Personal Aerosol Monitor, TSI Inc,
St. Paul) in the West Division, Unit 2 staff base on May 24, 2011
(1 week before the sales ban), and ceased measurements on
August 10, 2011. Although we had planned to place the moni-
tor closer to the source of pollution (prisoner’s cells), fear of
tampering with the device lead us to place it in the staff base.
The particular base chosen had a door that was often open and
in direct communication with the area containing the prisoners’
cells. The monitor was set on a ledge that had free airflow
from the common, recreation area, and four wings of individual
cells. The wings spread in a “V” shape, from the common area,
with two upstairs and two downstairs, each containing 12 prison-
ers. At the end of each wing were communal bathrooms. Prison
staff reported that all rooms were occupied during the period of
the study. Staff estimated that about 80% of prisoners smoked
in this area before the ban (compared with the average of about
two-thirds of inmates being smokers in prisons nationwide).
Smoking prevalence is much lower among the general adult
population in New Zealand (~20%; Ministry of Health, 2008).
The meter measured the concentration of PM2.5
by estimating
the dispersion of a laser beam that passed through continuously
pumped air, sampled from the immediate environment. The
monitor was zero-calibrated at each visit (weekly to monthly) and
was fitted with a 2.5 μm impactor with an airflow rate of 1.7 L/
min. When visits were made, the monitor was reset to log data
and the impactor regreased. The airflow rate was validated in the
New Zealand setting using a pneumotachograph (Hans Rudolph
4813 pneumotachograph, vacuumed differential pressure trans-
ducer 4500, Vacumetrics, CA), and was within 10% of the stated
flow rate. A calibration factor of 0.32 was applied based on cali-
bration work with a ThermoMIE personalDataRAM model
pDR-1200 real-time aerosol monitor (ThermoAndersen, Inc.,
Smyrna, GA). Additional calibration work subsequently has cal-
culated a very similar calibration factor for secondhand smoke
(0.28–0.29; Jiang et al., 2011). This type of monitor had been
used extensively in previous similar studies assessing particulate
levels from SHS, including in a study from Delaware where
the SidePak AM510 was calibrated against standard pump-and-
filter gravimetric methods (Repace, 2004).
The monitor was fixed in place for 3 months in total. Air
pollution levels were recorded before any restrictions were
introduced (“baseline”), during the first month in which pur-
chase was restricted (“sales ban”), then for 2 months after the
policy was enacted (“smoking ban”).
During our visits to prison, we informally asked four staff
about their perceptions of compliance with the new smokefree
policy; however, this was a minor adjunct to the study, and no
prisoners were interviewed.
Statistical Analysis
Data were recorded at 5-min intervals and logged within the
device. The monitors were checked and data downloaded at
weekly to monthly intervals throughout the observation period.
The data were then converted to daily averages, and compari-
sons were made between the baseline, sales ban, and smoking
ban phases of the monitoring, using regression methods. Serial
correlation between measurements was investigated and models
that incorporate an autocorrelated error term were used to
Table 1. Daily Summaries of Indoor-Fine-
Particulate Concentration (μg/m3
) During
the Study Period
Period Date Geometric mean Maximum Minimum
Baseline 24/05 5.37 20 2
25/05 3.67 167 1
26/05 3.92 688 1
27/05 6.92 76 2
28/05 6.11 97 1
29/05 13.37 86 1
30/05 8.38 41 2
31/05 6.81 1,700 1
Sales ban 1/06 10.81 81 2
2/06 7.04 91 1
27/06 4.51 70 1
28/06 3.81 20 1
29/06 3.87 58 2
30/06 3.56 106 1
Smoking ban 4/07 3.91 20 2
5/07 2.45 27 1
18/07 10.62 32 2
19/07 6.70 33 2
20/07 1.37 9 1
21/07 1.43 11 1
22/07 0.91 6 0
23/07 1.30 12 0
24/07 3.37 36 1
25/07 1.46 9 0
26/07 3.21 26 0
27/07 1.16 10 0
3/08 5.57 20 2
4/08 2.93 24 1
5/08 2.84 11 1
model the effect of time on the PM2.5
concentration. We used
the “gls” (generalized least squares) function, from the nlme
library that accompanies R software, to carry out these analyses
(R Development Core Team, 2007). Time was considered, in
separate analyses, as both a continuous and a categorical vari-
able. The categories included baseline (before the sales ban), the
sales ban period (June 2011), and the tobacco ban period (July 1
onward). Plots of residuals by fitted values were used to investigate
the model fit.
Approval for the study was sought through the Department
of Corrections’ external research committee, which facilitated
the research process.
Results
A broken time series of PM2.5
measurements was obtained
between May 17 and August 5, 2011. Daily summaries of the
raw data are recorded in the Table 1. Between 2 and June 27 and
June 30 to July 4, no data were recorded. The periods of missing
data were due to the monitor being inadvertently unplugged by
prison staff. We observed a gradual decline in maxima and geo-
metric means with a modest decline in minima. Before the ban,
the geometric mean 5-min PM2.5
ranged from 3 to 13 μg/m3
,
344
atUniversityofAucklandonMay31,2016http://ntr.oxfordjournals.org/Downloadedfrom
3. Nicotine & Tobacco Research, Volume 15, Number 2 (February 2013)
3
Nicotine & Tobacco Research
while after the ban, a single peak occurred on July 18 (10.6 μg/m3
),
with subsequent means ranging from 2 to 5 μg/m3
.
There were a total of 7,107 five-minute PM recordings. The
PM2.5
values were approximately log-normally distributed and
were, therefore, log-transformed to stabilize their variance in
regression analyses, and associated geometric means were
reported. Of the 7,107 observations, 2,137 were recorded before
the sales ban, 1,409 during the sales ban, and 3,561 after the
tobacco ban was enforced. Before the sales ban, the geometric
mean daily average was 6.58 μg/m3
(95% CI = 6.29–6.58), which
declined to 5.17 μg/m3
(95% CI = 4.93–5.41) during the sales
ban, and fell to 2.44 μg/m3
(95% CI = 2.37–2.52) after the
smoking ban.
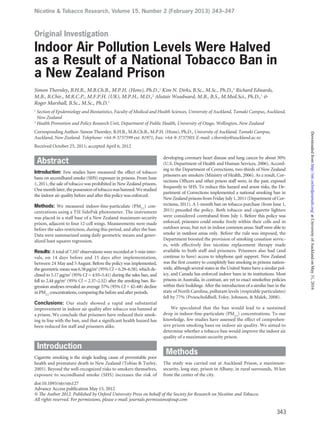
The distribution of 5-minute PM2.5
during these periods is
depicted in the Figure 1. The plot shows a reduction in the
median values, with fewer high, extreme measurements after
the sales and smoking ban was enforced.
Regression analysis was undertaken on log-transformed
values to determine a time trend. We added 0.25 μg/m3
to zero
values to allow the log transformation. The autocorrelation
between measurements was about 0.9 with serial decay of the
coefficient with increasing lag. The partial autocorrelation
coefficient indicated little (~0.07) residual correlation after
the correlation between immediately adjacent terms had
been adjusted for.
A locally weighted regression (lowess) plot of the log-
transformed PM2.5
concentration by time, revealed a linear-
downward trend in fine particle levels throughout the period of
the study. After regression analysis, using a first order autocor-
relation term, we derived an exponentiated beta-coefficient of
0.987 (95% CI = 0.983–0.990), which indicated the average
daily percentage decline in particulate during the study was 1.3%.
This was equivalent to a halving of concentration during any
52-day period (95% CI = 40–76 days), throughout the course of
the study. During the 71 days of monitoring, therefore, the
magnitude of the decline was 61% (95% CI = 48%–71%). When
Figure 1. Boxplot of 5-min PM2.5
concentration, by prison—tobacco—
policy period (0.25 added to zero-value measurements so that they may
be depicted on a log scale).
we divided time into three categorical periods—baseline, sales
ban, and smoking ban—a model that incorporated a first order
autoregression term indicated the sales ban resulted in a 34%
(exponentiated beta-coefficient 0.66; 95% CI = 0.49–0.90) and
the tobacco ban was associated with a 57% drop (exponentiated
beta-coefficient 0.43; 95% CI = 0.32–0.58) in fine particle levels,
compared with the preban period. Plots of residuals versus
fitted values indicated acceptable model fit.
We repeated the regression analysis by adding 0.5 μg/m3
(rather than 0.25) to 0 PM2.5
values (to allow the log transforma-
tion), but effect estimates were effectively unchanged (<1% change
in point estimates).
We then limited the analysis to data collected during waking
hours (07:00–22:59), when most smoking was likely to have
occurred. The magnitude of the drop associated with the ban
was higher for measures restricted to these intervals (baseline:
geometric mean 9.64 μg/m3
, 95% CI = 9.17–10.1; during sales
ban: 6.57, 95% CI = 6.21–6.94; during smoking ban: 2.63, 95%
CI = 2.54–2.73).
Staff reported that prisoners had, by and large, complied
with the prison policy, and no tobacco had been seized after
the ban date. Occasional cigarette lighters had been found
and confiscated. Although an increase in violence had been
feared, no increase in incidents was reported by the unit man-
ager, who accompanied us, while obtaining measurements from
the monitor.
Discussion
We observed a reduction in indoor air concentrations of fine
particles after a comprehensive tobacco ban in a maximum-
security prison in Auckland, New Zealand. Overall, levels of
particulates were very low after the ban was enacted and this,
together with reports from staff, suggests that short-term
breaches of the ban were low.
The study was limited by its scope, missing data, and inability
to monitor close to the source of pollution. Due to limited
resources, only one particulate monitor was available, so that
our results only describe the effect on indoor air quality in one
section of the prison. The site was chosen due to the continuity
of airflow with the prisoner’s cells and also to provide an assess-
ment of real, workplace exposures for Corrections officers. Also,
the prison site, located in a semi-rural setting, was not close to
any other sources of pollution, such as traffic or industrial sites.
Missing information resulted in an interrupted time series, so
that we cannot describe the full trajectory of particulate mea-
surements during the sales ban period. However, we can infer
that concentrations were lower after the ban was implemented
than before.
Ideally, we would have liked to monitor in the common area
used by prisoners outside their cells. However, due to the nature
of the equipment and the likelihood of tampering, a compro-
mise had to be made. In addition, the monitor was close to a
microwave and toaster. Both of these have the potential to
release particulate matter into air (such as burnt toast). We
speculated that some of the outlying measurements were due to
this source. The extreme values were all recorded before the
345
atUniversityofAucklandonMay31,2016http://ntr.oxfordjournals.org/Downloadedfrom
4. Air pollution levels halved in a New Zealand prison
4
Air pollution levels were halved in a New Zealand prison
tobacco ban, so may have been a result of smoking in close
proximity to the monitor. If extreme values, greater than 1.5
times the interquartile range of the log-transformed measure-
ments, (>100 μg/m3
) were excluded in the regression analysis,
the before–after effect of the total ban was reduced by three
percentage-points (55%).
Many other studies have documented reductions in indoor
levels of particulates as a result of smoking bans in public places,
such as pubs and bars (Brennan et al., 2010; Connolly et al.,
2009; Valente et al., 2007). Studies in prisons are rarer. Three
other reports, to our knowledge, have similarly analyzed the
impact of a smoking ban in prisons: two in the United States and
another in Switzerland. One study was undertaken in the state
of North Carolina, United States, before and after a complete
smoking ban (Proescholdbell et al., 2008). While this study
monitored a variety of sites in six prisons before and after the
smoking ban, the monitoring only occurred for short periods
(mean: 96 min). Also, the time immediately after the ban was
not monitored: only 2 months intervals before and 12 months
after implementing the ban. Despite the methodological differ-
ences, the U.S. study showed a consistent decline of fine particulate
concentration, with an average decline of 33% in the 24 areas of
the six prisons monitored. Our analysis was consistent with this
result, showing a 57% overall decline when the ban periods were
divided into categories in the regression analysis.
A second study of indoor air quality in two prisons in Vermont
and one in Massachusetts, before and after a tobacco ban, showed
a decline in the indoor concentration of aerosolized nicotine,
from 3–11 to 1.5–2.2 μg/m3
in weekly means (Hammond &
Emmons, 2005). Measurements were taken from a range of living
quarters and common areas in the prisons. This study detected
a larger percentage decline in nicotine levels than we observed
with PM2.5
. Nicotine is more specific than particulate to emis-
sions from cigarettes, and so such a finding is expected.
In Switzerland, a partial ban of smoking (limiting use of
cigarettes to cells and outside areas only) resulted in a drop in
both nicotine (70%) and particulate matter (PM10
; 45%), when
the air quality was assessed 2 months before and 11 months after
the policy enactment in one prison (Ritter, Huynh, Etter, & Elger,
2011). The authors described the difference in nicotine as statis-
tically significant, but not the change in particulate levels. Their
findings, of a 45% decrease, is similar to ours of a 57% overall
reduction.
Inmate views were sought in response to an indoor ban,
effected in prisons in Quebec, Canada, in 2008. Interviews with
smoking prisoners revealed that only 40% of smokers thought
that the policy had reduced the amount they smoked. About
half of inmates interviewed thought their exposure to SHS had
reduced (Lasnier et al., 2011).
The absolute levels of fine particles that we measured
throughout the study were low. The recorded low levels, how-
ever, were likely to be due to the proximity of the monitor
(placed in the staff base) rather than at the source of pollution
(prisoner’s cells). For comparison, the Ministry for the Environ-
ment in New Zealand suggests that a daily average of 25 μg/m3
or greater for ambient air is cause for concern (Ministry for the
Environment, 2002). The World Health Organization, similarly,
recommends that levels of PM2.5
should be below an annual
mean of 10 μg/m3
and 25 μg/m3
as a daily mean (World Health
Organization, 2005). The rationale underlying the WHO guide-
line is based on an American Cancer Society Study of the effects
of long-term exposure to particulates, recorded outdoors, on
mortality. A threshold was identified at the lower range of par-
ticles at which adverse effects on survival were detected (Krewski
et al., 2005). The daily means were well under that threshold, even
before the ban was enforced. While the evidence for adverse
health effects is strongest for chronic exposure, the daily standard
is also recommended to prevent temporary peaks that may lead
to excess mortality and morbidity.
Relative to these standard levels, enforcement of the smoking
ban has brought about an improvement in the concentration of
fine particles, such that daily indoor geometric means were
well below the World Health Organization’s annual threshold
of 10 μg/m3
on all but 1 of 15 days after the smoking ban, whereas
before the ban, the World Health Organization annual average
air quality standard of 10 μg/m3
was exceeded on 2 out of 14
days. Although we monitored for a short time, the annual aver-
age was unlikely to exceed this threshold, and so the levels of
fine particles we observed were low overall. Despite the low
absolute levels of pollution, which were likely to be much higher
within cells when cigarettes were being smoked, we believe the
more important finding is the relative change in pollutant level.
Such relative changes indicate that exposure to particulates,
within cells, is also likely to be dropping by similar ratios
for staff and prisoners alike. Very high isolated levels, which
occurred before the policy was enacted, were less commonly
observed after the ban. The source of the PM2.5
that caused these
peaks is unknown.
Comparisons of the levels found in our study, however,
with World Health Organization guideline levels should be
carried out with caution. First, guidelines apply to ambient air
pollution. The World Health Organization observes that “no
threshold for PM2.5
has been identified below which no damage
to health is observed” so that any involuntary exposure of non-
smokers to SHS should be avoided, if possible (World Health
Organization, 2005). The high levels of carcinogens in SHS
mean that the risk of cancer is likely to be higher when people
are exposed to this source, compared with ambient air pollution,
when levels of fine particles are otherwise comparable (Interna-
tional Agency for Research on Cancer, 2004). To balance this
concern, however, the exposure of officers and inmates to par-
ticulates may be lower than the measured levels we report, due
to time spent in other areas of the prison compound than the
cell areas (such as working or training), and for prison officers,
time away from the prison compound.
About 7,000 prisoners inhabit 19 prisons in New Zealand
and the Department of Corrections employs about 6,000 staff to
service them. We observed that indoor air quality improved as a
result of a comprehensive smoking ban, which suggested that
the ban has successfully restricted the smoking of cigarettes and
so resulted in a safer environment for prison employees, prisoners,
and visitors. The ban was accompanied by the provision of
nicotine replacement therapy to both staff and prisoners to
assist quit attempts and defuse resistance to the change in policy.
The improvements in air quality support the prison staff’s
observations that prisoner compliance with the smoking ban
was high. Future studies could be undertaken to investigate the
346
atUniversityofAucklandonMay31,2016http://ntr.oxfordjournals.org/Downloadedfrom
5. Nicotine & Tobacco Research, Volume 15, Number 2 (February 2013)
5
Nicotine & Tobacco Research
extent of compliance with the policy. This is the first time in the
world that tobacco has been banned completely from a nation’s
prisons, and the improvement in indoor air quality, as a result,
sets a precedent for other nations to introduce a similar com-
prehensive policy.
Funding
This study was funded by the University of Auckland.
Declaration of Interests
None.
Acknowledgments
We gratefully acknowledge the Department of Corrections for
supporting this project, and Mr. Pete Phelan for his help in
gaining access to the study site and information about the
implementation of the policy.
References
Brennan, E., Cameron, M., Warne, C., Durkin, S., Borland, R.,
Travers, M. J., et al. (2010). Secondhand smoke drift: Examining
the influence of indoor smoking bans on indoor and outdoor
air quality at pubs and bars. Nicotine & Tobacco Research, 12,
271–277. doi:10.1093/ntr/ntp204
Connolly, G. N., Carpenter, C. M., Travers, M. J., Cummings,
K. M., Hyland, A., Mulcahy, M., et al. (2009). How smoke-free
laws improve air quality: A global study of Irish pubs. Nicotine
& Tobacco Research, 11, 600–605. doi:10.1093/ntr/ntp038
Department of Corrections. (2011). Corrections news: May to
June 2011. Retrieved from http://www.corrections.govt.nz/news-
and-publications/magazines-and-newsletters/corrections-
news/2012/corrections_news_may-june_2011/last_puff.html
Hammond, S. K., & Emmons, K. M. (2005). Inmate exposure to
secondhand smoke in correctional facilities and the impact of
smoking restrictions. Journal of Exposure Analysis and Environ-
mental Epidemiology, 15, 205–211. doi:10.1038/sj.jea.7500387 [pii]
International Agency for Research on Cancer. (2004). Tobacco
smoke and involuntary smoking (vol. 83). Lyon, France: Author.
Jiang, R. T., Acevedo-Bolton, V., Cheng, K. C., Klepeis, N. E.,
Ott, W. R., & Hildemann, L. M. (2011). Determination of
response of real-time SidePak AM510 monitor to secondhand
smoke, other common indoor aerosols, and outdoor aerosol.
Journal of Environmental Monitoring, 13, 1695–1702. doi:10.1039/
C0em00732c
Krewski, D., Burnett, R., Jerrett, M., Pope, C. A., Rainham, D.,
Calle, E., et al. (2005). Mortality and long-term exposure to
ambient air pollution: Ongoing analyses based on the American
Cancer Society cohort. Journal of Toxicology and Environmental
Health, Part A, 68, 1093–1109. doi:U1GUU27WN030558X [pii]
1080/15287390590935941
Lasnier, B., Cantinotti, M., Guyon, L., Royer, A., Brochu, S., &
Chayer, L. (2011). Implementing an Indoor Smoking Ban in
Prison: Enforcement Issues and Effects on Tobacco Use, Expo-
sure to Second-hand Smoke and Health of Inmates. Canadian
Journal of Public Health-Revue Canadienne De Sante Publique,
102, 249–253.
Ministry for the Environment. (2002). Ambient air quality
guidelines. Wellington, New Zealand: Author.
Ministry of Health. (2006). Results from the prisoner health sur-
vey. Wellington, New Zealand: Author. Retrieved from http://
www.moh.govt.nz/moh.nsf/pagesmh/5650/$File/prisoner-
health-survey-2005.pdf
Ministry of Health. (2008). A Portrait of Health: Key Results of
the 2006/07 New Zealand Health Survey. Wellington, New Zealand:
Author.
Proescholdbell, S. K., Foley, K. L., Johnson, J., & Malek, S. H.
(2008). Indoor air quality in prisons before and after implemen-
tation of a smoking ban law. Tobacco Control, 17, 123–127.
doi:10.1136/tc.2007.022038
R Development Core Team. (2007). R: A language and environment
for statistical computing. Vienna, Austria: Author.
Repace, J. (2004). Respirable particles and carcinogens in the
air of delaware hospitality venues before and after a smoking
ban. Journal of Occupational and Environmental Medicine, 46,
887–905. doi:10.1097/01.jom.0000141644.69355.52
Ritter, C., Huynh, C. K., Etter, J.-F., & Elger, B. S. (2011). Expo-
sure to tobacco smoke before and after a partial smoking ban in
prison: Indoors air quality measures. Tobacco Control. doi:10.1136/
tc.2011.043356
Tobias, M., & Turley, M. (2005). Causes of death classified by risk
and condition, New Zealand 1997. Australian and New Zealand
JournalofPublicHealth,29,5–12.doi:10.1111/j.1467-842X.2005.
tb00740.x
U.S. Department of Health and Human Services. (2006). The
health consequences of involuntary exposure to tobacco smoke:
A report of the Surgeon General. Atlanta, GA: US Department of
Health and Human Services, Centers for Disease Control and
Prevention. National Center for Chronic Disease Prevention
and Health Promotion, Office on Smoking and Health.
Valente, P., Forastiere, F., Bacosi, A., Cattani, G., Di Carlo, S.,
Ferri, M., et al. (2007). Exposure to fine and ultrafine particles
from secondhand smoke in public places before and after
the smoking ban, Italy 2005. Tobacco Control, 16, 312–317.
doi:10.1136/tc.2006.019646
World Health Organization. (2005). WHO air quality guidelines
global update 2005. Copenhagen, Denmark: Author.
347
atUniversityofAucklandonMay31,2016http://ntr.oxfordjournals.org/Downloadedfrom