CRUD Matrix Shows SQL Functions

This document discusses various techniques used in software project management including CRUD matrices, Gantt charts, PERT charts, feasibility analysis, and cost-benefit analysis. A CRUD matrix identifies the database tables involved in create, read, update, and delete operations for different user scenarios of a website. Gantt charts show project activities and timelines while PERT charts illustrate task dependencies in a project. Feasibility analysis evaluates the technical, economic, operational, and legal viability of a project. Cost-benefit analysis compares monetary costs and benefits to determine if a project's benefits outweigh its costs. These techniques help software project managers effectively plan, schedule, and control development projects.
![Metadata / Data Dictionary
The term metadata (also called the data dictionary) can be understood as “data about data.” It holds the following
information about each data element in the databases, it normally includes:
+ Name
+ Type
+ Range of values
+ Source
+ Access authorization
+ Indicates which application programs use the data so that, when a change in a data structure is contemplated, a list of
the affected programs can be generated.
For example, when looking at one of the values of Year of Birth in the Students table, the data itself may be “1992”. The
metadata about that value would be the field name Year of Birth, the time it was last updated, and the data type (integer).
Another example of metadata could be for an MP3 music file, like the one shown in the image below; information such as
the length of the song, the artist, the album, the file size, and even the album cover art, are classified as metadata. When
a database is being designed, a “data dictionary” is created to hold the metadata, defining the fields and structure of the
database.
Data dictionary is used to actually control the database operation, data integrity and accuracy. Metadata is used by
developers to develop the programs, queries, controls and procedures to manage and manipulate the data. Metadata is
available to database administrators (DBAs), designers and authorized user as on-line system documentation. This
improves the control of database administrators (DBAs) over the information system and the user's understanding and
use of the system.
Active and Passive Data Dictionaries
Data dictionary may be either active or passive. An active data dictionary (also called integrated data dictionary) is
managed automatically by the database management software. Consistent with the current structure and definition of the
database. Most of the relational database management systems contain active data dictionaries that can be derived from
their system catalog. The passive data dictionary (also called non-integrated data dictionary) is the one used only for
documentation purposes. Data about fields, files, people and so on, in the data processing environment are. Entered into
the dictionary and cross-referenced. Passive dictionary is simply a self-contained application. It is managed by the users
of the system and is modified whenever the structure of the database is changed. Since this modification must be
performed manually by the user, it is possible that the data dictionary will not be current with the current structure of the
database. However, the passive data dictionaries may be maintained as a separate database. Thus, it allows developers
to remain independent from using a particular relational database management system. It may be extended to contain
information about organizational data that is not computerized.
Importance of Data Dictionary
Data dictionary is essential in DBMS because of the following reasons:
• Data dictionary provides the name of a data element, its description and data structure in which it may be found.
• Data dictionary provides great assistance in producing a report of where a data element is used in all programs that
mention it.
• It is also possible to search for a data name, given keywords that describe the name. For example, one might want to
determine the name of a variable that stands for net pay. Entering keywords would produce a list of possible identifiers
and their definitions. Using keywords one can search the dictionary to locate the proper identifier to use in a program.
These days, commercial data dictionary packages are available to facilitate entry, editing and to use the data elements.
Software Project Management
Software project management is the art and science of planning and leading software projects.
[1]
It is a sub-discipline of
project management in which software projects are planned, implemented, monitored and controlled.
The job pattern of an IT company engaged in software development can be seen split in two parts:
• Software Creation
• Software Project Management
A project is well-defined task, which is a collection of several operations done in order to achieve a goal (for example,
software development and delivery). A Project can be characterized as:
• Every project may has a unique and distinct goal.
• Project is not routine activity or day-to-day operations.
• Project comes with a start time and end time.
• Project ends when its goal is achieved hence it is a temporary phase in the lifetime of an organization.
• Project needs adequate resources in terms of time, manpower, finance, material and knowledge-bank.](data:image/gif;base64,R0lGODlhAQABAIAAAAAAAP///yH5BAEAAAAALAAAAAABAAEAAAIBRAA7)
Recommandé
Contenu connexe
Similaire à CRUD Matrix Shows SQL Functions
Similaire à CRUD Matrix Shows SQL Functions (20)
Plus de Cheryl Brown
Plus de Cheryl Brown (20)
Dernier
Dernier (20)
CRUD Matrix Shows SQL Functions
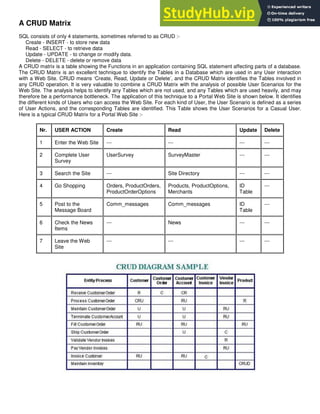
- 1. A CRUD Matrix SQL consists of only 4 statements, sometimes referred to as CRUD :- Create - INSERT - to store new data Read - SELECT - to retrieve data Update - UPDATE - to change or modify data. Delete - DELETE - delete or remove data A CRUD matrix is a table showing the Functions in an application containing SQL statement affecting parts of a database. The CRUD Matrix is an excellent technique to identify the Tables in a Database which are used in any User interaction with a Web Site. CRUD means ‘Create, Read, Update or Delete’, and the CRUD Matrix identifies the Tables involved in any CRUD operation. It is very valuable to combine a CRUD Matrix with the analysis of possible User Scenarios for the Web Site. The analysis helps to identify any Tables which are not used, and any Tables which are used heavily, and may therefore be a performance bottleneck. The application of this technique to a Portal Web Site is shown below. It identifies the different kinds of Users who can access the Web Site. For each kind of User, the User Scenario is defined as a series of User Actions, and the corresponding Tables are identified. This Table shows the User Scenarios for a Casual User. Here is a typical CRUD Matrix for a Portal Web Site :- Nr. USER ACTION Create Read Update Delete 1 Enter the Web Site --- --- --- --- 2 Complete User Survey UserSurvey SurveyMaster --- --- 3 Search the Site --- Site Directory --- --- 4 Go Shopping Orders, ProductOrders, ProductOrderOptions Products, ProductOptions, Merchants ID Table --- 5 Post to the Message Board Comm_messages Comm_messages ID Table --- 6 Check the News Items --- News --- --- 7 Leave the Web Site --- --- --- ---
- 2. Metadata / Data Dictionary The term metadata (also called the data dictionary) can be understood as “data about data.” It holds the following information about each data element in the databases, it normally includes: + Name + Type + Range of values + Source + Access authorization + Indicates which application programs use the data so that, when a change in a data structure is contemplated, a list of the affected programs can be generated. For example, when looking at one of the values of Year of Birth in the Students table, the data itself may be “1992”. The metadata about that value would be the field name Year of Birth, the time it was last updated, and the data type (integer). Another example of metadata could be for an MP3 music file, like the one shown in the image below; information such as the length of the song, the artist, the album, the file size, and even the album cover art, are classified as metadata. When a database is being designed, a “data dictionary” is created to hold the metadata, defining the fields and structure of the database. Data dictionary is used to actually control the database operation, data integrity and accuracy. Metadata is used by developers to develop the programs, queries, controls and procedures to manage and manipulate the data. Metadata is available to database administrators (DBAs), designers and authorized user as on-line system documentation. This improves the control of database administrators (DBAs) over the information system and the user's understanding and use of the system. Active and Passive Data Dictionaries Data dictionary may be either active or passive. An active data dictionary (also called integrated data dictionary) is managed automatically by the database management software. Consistent with the current structure and definition of the database. Most of the relational database management systems contain active data dictionaries that can be derived from their system catalog. The passive data dictionary (also called non-integrated data dictionary) is the one used only for documentation purposes. Data about fields, files, people and so on, in the data processing environment are. Entered into the dictionary and cross-referenced. Passive dictionary is simply a self-contained application. It is managed by the users of the system and is modified whenever the structure of the database is changed. Since this modification must be performed manually by the user, it is possible that the data dictionary will not be current with the current structure of the database. However, the passive data dictionaries may be maintained as a separate database. Thus, it allows developers to remain independent from using a particular relational database management system. It may be extended to contain information about organizational data that is not computerized. Importance of Data Dictionary Data dictionary is essential in DBMS because of the following reasons: • Data dictionary provides the name of a data element, its description and data structure in which it may be found. • Data dictionary provides great assistance in producing a report of where a data element is used in all programs that mention it. • It is also possible to search for a data name, given keywords that describe the name. For example, one might want to determine the name of a variable that stands for net pay. Entering keywords would produce a list of possible identifiers and their definitions. Using keywords one can search the dictionary to locate the proper identifier to use in a program. These days, commercial data dictionary packages are available to facilitate entry, editing and to use the data elements. Software Project Management Software project management is the art and science of planning and leading software projects. [1] It is a sub-discipline of project management in which software projects are planned, implemented, monitored and controlled. The job pattern of an IT company engaged in software development can be seen split in two parts: • Software Creation • Software Project Management A project is well-defined task, which is a collection of several operations done in order to achieve a goal (for example, software development and delivery). A Project can be characterized as: • Every project may has a unique and distinct goal. • Project is not routine activity or day-to-day operations. • Project comes with a start time and end time. • Project ends when its goal is achieved hence it is a temporary phase in the lifetime of an organization. • Project needs adequate resources in terms of time, manpower, finance, material and knowledge-bank.
- 3. Software Project A Software Project is the complete procedure of software development from requirement gathering to testing and maintenance, carried out according to the execution methodologies, in a specified period of time to achieve intended software product. Need of software project management Software is said to be an intangible product. Software development is a kind of all new stream in world business and there’s very little experience in building software products. Most software products are tailor made to fit client’s requirements. The most important is that the underlying technology changes and advances so frequently and rapidly that experience of one product may not be applied to the other one. All such business and environmental constraints bring risk in software development hence it is essential to manage software projects efficiently. The image shows triple constraints for software projects. It is an essential part of software organization to deliver quality product, keeping the cost within client’s budget constrain and deliver the project as per scheduled. There are several factors, both internal and external, which may impact this triple constrain triangle. Any of three factor can severely impact the other two. Therefore, software project management is essential to incorporate user requirements along with budget and time constraints. In the 1970s and 1980s, the software industry grew very quickly, as computer companies quickly recognized the relatively low cost of software production compared to hardware production and circuitry. To manage new development efforts, companies applied the established project management methods, but project schedules slipped during test runs, especially when confusion occurred in the gray zone between the user specifications and the delivered software. To be able to avoid these problems, software project management methods focused on matching user requirements to delivered products, in a method known now as the waterfall model. As the industry has matured, analysis of software project management failures has shown that the following are the most common causes: [2][3][4] 1. Insufficient end-user involvement 2. Poor communication among customers, developers, users and project managers 3. Unrealistic or unarticulated project goals 4. Inaccurate estimates of needed resources 5. Badly defined or incomplete system requirements and specifications 6. Poor reporting of the project's status 7. Poorly managed risks 8. Use of immature technology 9. Inability to handle the project's complexity 10. Sloppy development practices 11. Stakeholder politics (e.g. absence of executive support, or politics between the customer and end-users) 12. Commercial pressures The first five items in the list above show the difficulties articulating the needs of the client in such a way that proper resources can deliver the proper project goals. Specific software project management tools are useful and often necessary, but the true art in software project management is applying the correct method and then using tools to support the method. Without a method, tools are worthless. Since the 1960s, several proprietary software project management methods have been developed by software manufacturers for their own use, while computer consulting firms have also developed similar methods for their clients. Today software project management methods are still evolving, but the current trend leads away from the waterfall model to a more cyclic project delivery model that imitates a software development process.
- 4. Gantt Charts A Gantt chart, commonly used in project management, is one of the most popular and useful ways of showing activities (tasks or events) displayed against time. On the left of the chart is a list of the activities and along the top is a suitable time scale. Each activity is represented by a bar; the position and length of the bar reflects the start date, duration and end date of the activity. This allows you to see at a glance: • What the various activities are • When each activity begins and ends • How long each activity is scheduled to last • Where activities overlap with other activities, and by how much • The start and end date of the whole project To summarize, a Gantt chart shows you what has to be done (the activities) and when (the schedule). A simple Gantt chart PERT chart (Program Evaluation Review Technique) A PERT chart is a project management tool used to schedule, organize, and coordinate tasks within a project. PERT stands for Program Evaluation Review Technique, a methodology developed by the U.S. Navy in the 1950s to manage the Polaris submarine missile program. A similar methodology, the Critical Path Method (CPM) was developed for project management in the private sector at about the same time. A PERT chart presents a graphic illustration of a project as a network diagram consisting of numbered nodes (either circles or rectangles) representing events, or milestones in the project linked by labelled vectors (directional lines) representing tasks in the project. The direction of the arrows on the lines indicates the sequence of tasks. In the diagram, for example, the tasks between nodes 1, 2, 4, 8, and 10 must be completed in sequence. These are called dependent or serial tasks. The tasks between nodes 1 and 2, and nodes 1 and 3 are not dependent on the completion of one to start the other and can be undertaken simultaneously. These tasks are called parallel or concurrent tasks. Tasks that must be completed in sequence but that don't require resources or completion time are considered to have event dependency.
- 5. These are represented by dotted lines with arrows and are called dummy activities. For example, the dashed arrow linking nodes 6 and 9 indicates that the system files must be converted before the user test can take place, but that the resources and time required to prepare for the user test (writing the user manual and user training) are on another path. Numbers on the opposite sides of the vectors indicate the time allotted for the task. The PERT chart is sometimes preferred over the Gantt chart, another popular project management charting method, because it clearly illustrates task dependencies. On the other hand, the PERT chart can be much more difficult to interpret, especially on complex projects. Frequently, project managers use both techniques. Feasibility and cost benefit analysis Jules Dupuit, a French engineer and economist, introduced the concepts behind CBA in the 1840s. It became popular in the 1950s as a simple way of weighing up project costs and benefits, to determine whether to go ahead with a project. As its name suggests, Cost-Benefit Analysis involves adding up the benefits of a course of action, and then comparing these with the costs associated with it. The results of the analysis are often expressed as a payback period – this is the time it takes for benefits to repay costs. Many people who use it look for payback in less than a specific period – for example, three years. You can use the technique in a wide variety of situations. For example, when you are: • Deciding whether to hire new team members. • Evaluating a new project or change initiative. • Determining the feasibility of a capital purchase. However, bear in mind that it is best for making quick and simple financial decisions. More robust approaches are commonly used for more complex, business-critical or high cost decisions. How to Use the Tool Follow these steps to do a Cost-Benefit Analysis. Step One: Brainstorm Costs and Benefits First, take time to brainstorm all of the costs associated with the project, and make a list of these. Then, do the same for all of the benefits of the project. Can you think of any unexpected costs? And are there benefits that you may not initially have anticipated? When you come up with the costs and benefits, think about the lifetime of the project. What are the costs and benefits likely to be over time? Step Two: Assign a Monetary Value to the Costs Costs include the costs of physical resources needed, as well as the cost of the human effort involved in all phases of a project. Costs are often relatively easy to estimate (compared with revenues). It's important that you think about as many related costs as you can. For example, what will any training cost? Will there be a decrease in productivity while people are learning a new system or technology, and how much will this cost? Remember to think about costs that will continue to be incurred once the project is finished. For example, consider whether you will need additional staff, if your team will need ongoing training, or if you'll have increased overheads. Step Three: Assign a Monetary Value to the Benefits This step is less straightforward than step two! Firstly, it's often very difficult to predict revenues accurately, especially for new products. Secondly, along with the financial benefits that you anticipate, there are often intangible, or soft, benefits that are important outcomes of the project. For instance, what is the impact on the environment, employee satisfaction, or health and safety? What is the monetary value of that impact? As an example, is preserving an ancient monument worth $500,000, or is it worth $5,000,000 because of its historical importance? Or, what is the value of stress-free travel to work in the morning? Here, it's important to consult with other stakeholders and decide how you'll value these intangible items. Step Four: Compare Costs and Benefits Finally, compare the value of your costs to the value of your benefits, and use this analysis to decide your course of action. To do this, calculate your total costs and your total benefits, and compare the two values to determine whether your benefits outweigh your costs. At this stage it's important to consider the payback time, to find out how long it will take for you to reach the break even point – the point in time at which the benefits have just repaid the costs. For simple examples, where the same benefits are received each period, you can calculate the payback period by dividing the projected total cost of the project by the projected total revenues: Total cost / total revenue (or benefits) = length of time (payback period).
- 6. Economic, technical, schedule, and operational feasibility Technical Feasibility In technical feasibility the following issues are taken into consideration. • Whether the required technology is available or not • Whether the required resources are available - - Manpower- programmers, testers & debuggers - Software and hardware Once the technical feasibility is established, it is important to consider the monetary factors also. Since it might happen that developing a particular system may be technically possible but it may require huge investments and benefits may be less. For evaluating this, economic feasibility of the proposed system is carried out. Economic Feasibility For any system if the expected benefits equal or exceed the expected costs, the system can be judged to be economically feasible. In economic feasibility, cost benefit analysis is done in which expected costs and benefits are evaluated. Economic analysis is used for evaluating the effectiveness of the proposed system. In economic feasibility, the most important is cost-benefit analysis. As the name suggests, it is an analysis of the costs to be incurred in the system and benefits derivable out of the system. Click on the link below which will get you to the page that explains what cost benefit analysis is and how you can perform a cost benefit analysis. Cost Benefit Analysis Operational Feasibility Operational feasibility is mainly concerned with issues like whether the system will be used if it is developed and implemented. Whether there will be resistance from users that will effect the possible application benefits? The essential questions that help in testing the operational feasibility of a system are following. • Does management support the project? • Are the users not happy with current business practices? Will it reduce the time (operation) considerably? If yes, then they will welcome the change and the new system. • Have the users been involved in the planning and development of the project? Early involvement reduces the probability of resistance towards the new system. • Will the proposed system really benefit the organization? Does the overall response increase? Will accessibility of information be lost? Will the system effect the customers in considerable way? Legal Feasibility It includes study concerning contracts, liability, violations, and legal other traps frequently unknown to the technical staff.