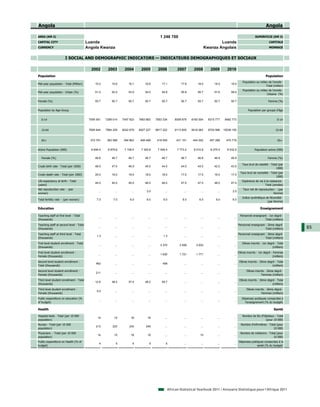
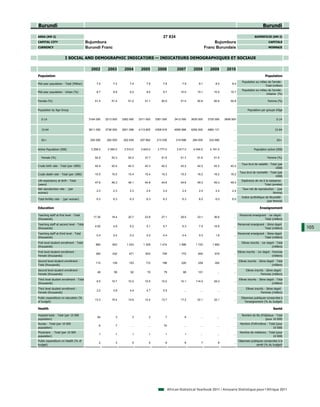
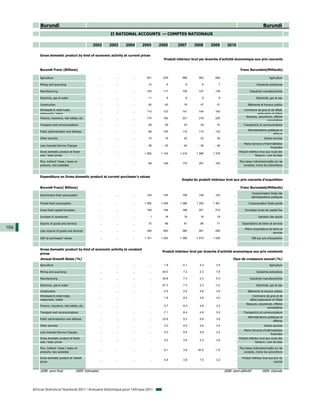
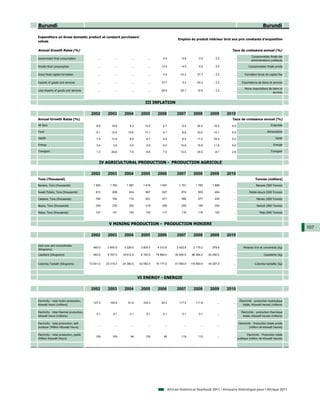
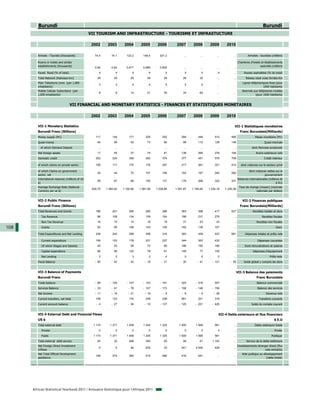
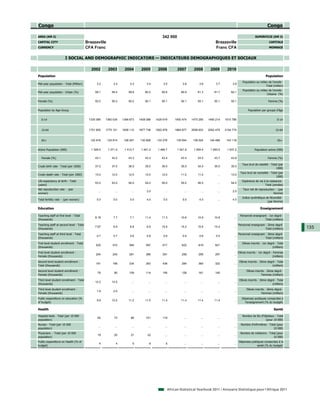
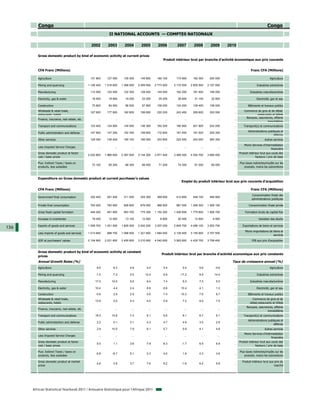
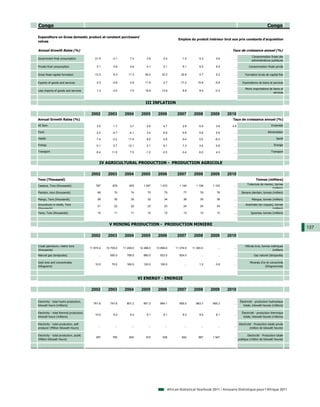
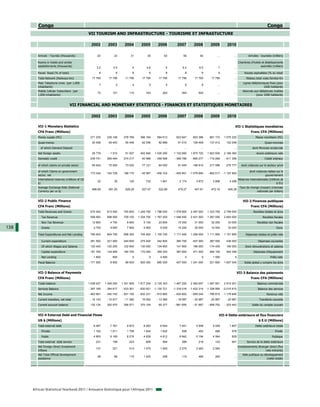
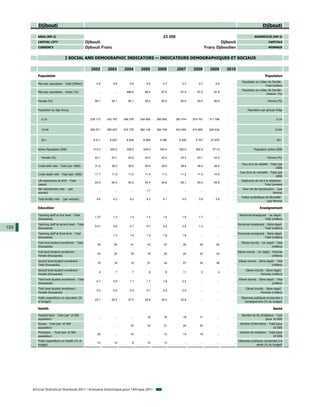
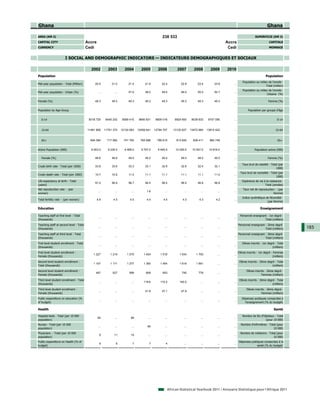
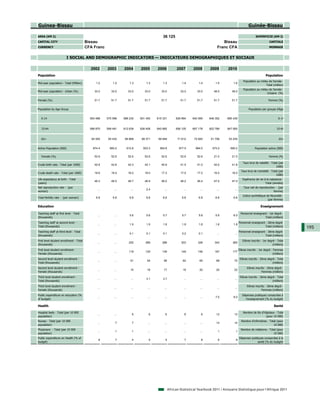
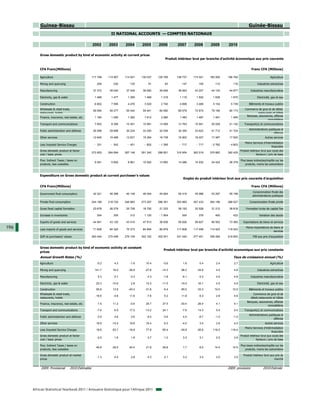
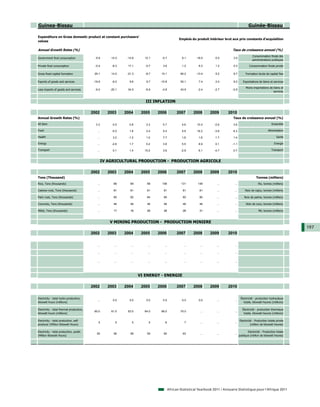
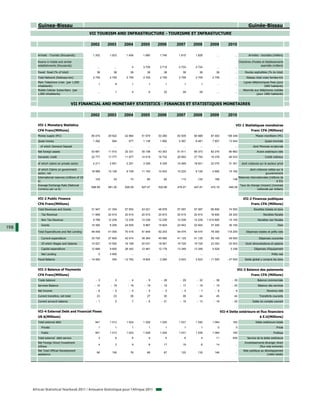
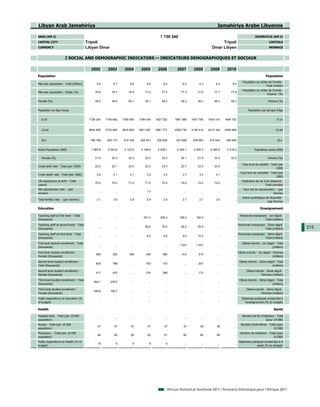
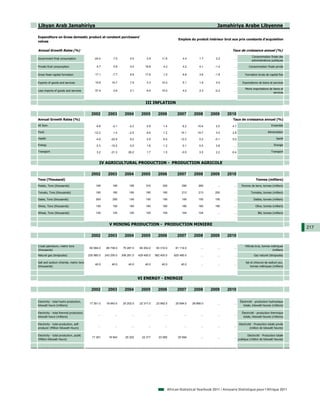
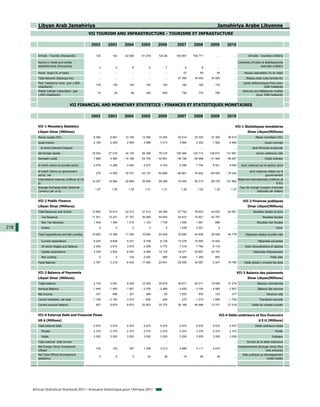
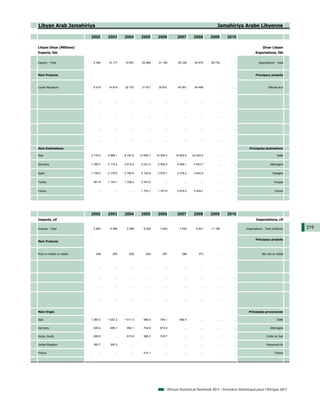
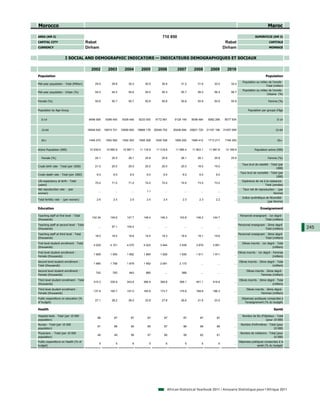
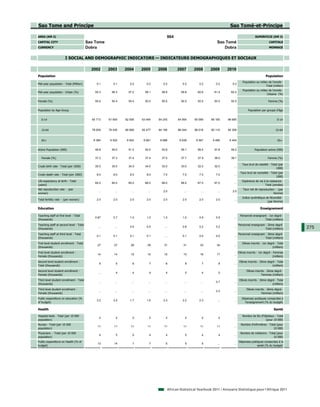
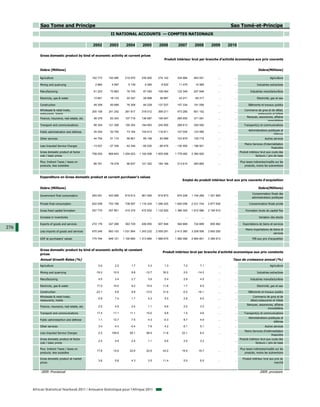
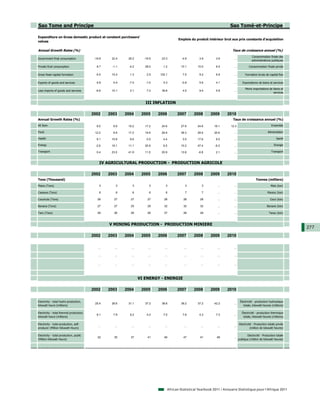
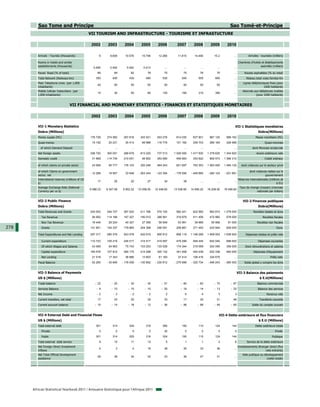
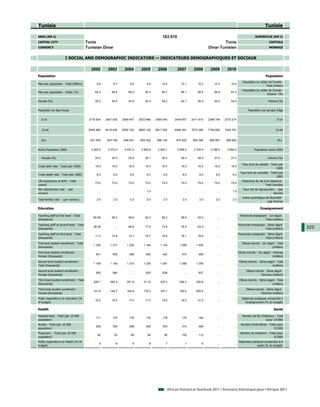
African
Statistical
Yearbook
Annuaire
statistique
pour l’Afrique
       2011
African Statistical Yearbook
Annuaire Statistique pour l’Afrique
               2011
Designations employed in this publication do not imply the expression of any opinion on the part of the African
              Development Bank Group (AfDB), the African Union Commission (AUC) and the United Nations Economic Com-
                mission for Africa (UNECA) concerning the legal status of any country or territory, or the delimitation of its
               frontiers. While every effort has been made to present reliable information, the three institutions accept no
                                         responsibility whatsoever for any consequences of its use.

            African Development Bank Group                                 African union               Economic Commission for Africa
             Temporary Relocation Agency (TRA)                              P.O. Box 3243                         P.O. Box 3001
           13 Avenue du Ghana BP 323, 1002 Tunis                  Roosvelt Street (Old Airport Area)         Addis Ababa Ethiopia
                  Belvédère Tunis, Tunisia                         W21K19 Addis Ababa Ethiopia               Tel: +251 11 551 7200
                   Tel : (216) 71 103 325                              Tel: (251) 11 551 77 00              Fax: +251 11 551 0365
                   Fax : (216) 71 103 743                              Fax:(251) 11 551 78 44              Email: ecainfo@uneca.org
                 Email : Statistics@afdb.org                                 www.au.int                         www.uneca.org
                       www.afdb.org


               Les dénominations employées dans cette publication n’impliquent, de la part de la Banque africaine de déve-
                loppement (BAD), la Commission de l’Union africaine (CUA) et la Commission économique pour l’Afrique des
               Nations Unies (UNECA) aucune prise de position sur le statut juridique ou le tracé des frontières des pays. Tout
                en s’étant efforcées de présenter des informations aussi fiables que possible, les trois institutions déclinent
                                 toute responsabilité quant à l’usage qui pourrait être fait de ces données.

2
              Groupe de la Banque africaine                              Union Africaine                Commission économique pour
                   de développement                                         P.O. Box 3243                           l’Afrique
          Agence Temporaire de Relocalisation (ATR)               Roosvelt Street (Old Airport Area)      P.O. Box 3001 Addis Abeba
           13 Avenue du Ghana BP 323, 1002 Tunis                       W21K19 Addis Abeba                            Ethiopie
                  Belvédère Tunis, Tunisie                                     Ethiopie                      Tel: +251 11 551 7200
                   Tel : (216) 71 103 325                              Tel: (251) 11 551 77 00               Fax:+251 11 551 0365
                   Fax : (216) 71 103 743                              Fax:(251) 11 551 78 44             Email: ecainfo@uneca.org
                 Email : Statistics@afdb.org                                 www.au.int                         www.uneca.org
                       www.afdb.org


                                                            Design/layout by Phoenix Design Aid
                                                               Printing by Scanprint, Denmark
                                                          ISO 14001 certified and EMAS-approved.

                                                                         ISSN 1561-2805


    African Statistical Yearbook 2011 / Annuaire Statistique pour l'Afrique 2011
2011
                                                              Acknowledgments
                                                                Remerciements


T    he 2011 African Statistical Yearbook was prepared
     under the overall umbrella of the African Statistical
Coordination Committee set up by major continental or-
                                                               L   ’annuaire statistique pour l’Afrique 2011 a été élaboré
                                                                   sous l’égide du Comité africain de coordination de la
                                                               statistique adopté par les principales organisations du
ganizations dealing with statistical development namely        continent en charge du développement de la statistique,
the African Development Bank (AfDB), the African Capac-        à savoir, la Banque africaine de développement (BAD),
ity Building Foundation (ACBF), the African Union Commis-      la Fondation africaine de renforcement des capacités
sion (AUC), and the United Na tions Economic Commission        (ACBF), la Commission de l’Union africaine (CUA), et la
for Africa (UNECA) in the framework of the implementa-         Commission économique pour l’Afrique des Nations Unies
tion of the Reference Regional Strategic Framework for         (UNECA) dans le cadre de la mise en œuvre du Cadre
Statistical Capacity Building in Africa (RRSF).                stratégique régional de référence pour le renforcement
                                                               des capacités statistiques en Afrique (CSRR).
It was prepared under the overall guidance of Dr. Dimitri
Sanga, Director of the African Centre for Statistics (ACS)     Il a été conçu sous la direction générale du Dr. Dimitri
of the UNECA, Dr. Charles Lufumpa, Director of the Statis-     Sanga, Directeur du Centre africain pour les statistiques
tics Department of the AfDB, Dr. Kouassi Réné Nguettia,        (CAS) de l’UNECA, de Dr. Charles Lufumpa, Directeur du
Director of Economic affairs (AUC) and the leadership of       Département des statistiques de la BAD, de Dr. Kouassi
Mr. Kokil Beejaye, Division Manager at the AfDB, Mr. Yeo       René Nguettia, Directeur des affaires économiques de
Dossina, Acting Head of Statistics Division at AUC and Dr.     la CUA et sous la conduite de M. Kokil Beejaye, Chef de
Chukwudozie Ezigbalike, Data Management Coordinator            Division à la BAD, M. Yeo Dossina, Chef par Interim de la Di-
at ACS.                                                        vision Statistique à la CUA et Dr. Chukwudozie Ezigbalike,
                                                               Cordonnateur et gestionnaire des données au CAS.
The joint AfDB-AUC-UNECA Technical Team comprised Mr.
Maurice Mubila, Mr. Kouakou Louis, Mr. Letsara Nirina, Mr.     L’équipe technique conjointe BAD, CUA, UNECA a été
Christophe Baradandikanya, Ms. Amel Feidi, Mr. Kadisha         composée de M. Maurice Mubila, M. Louis Kouakou, M.
Mbiya Hilaire from the AfDB; Mr. Gerard Osbert, Mr. Raj        Nirina Letsara, M. Christophe Baradandikanya, Mme Amel
Mitra, Ms. Fatouma Sissoko, Mr. Andry Andriantseheno,          Feidi, M. Kadisha Mbiya Hilaire pour la BAD, M. Gerard
Mr. Oumar Sarr, Mr. Molla Hunegnaw, Mr. Negussie Gorfe,        Osbert, M. Raj Mitra, Mme. Fatouma Sissoko, M. Andry
Mr. Steve Gui-Diby, Mr. Gulilat Tesfaye, Mr. Tesfaye Belay,    Andriantseheno, M. Oumar Sarr, M. Molla Hunegnaw, M.                           3
Mr. Michael Girma, Mr. Kidus Mengistu, Mr. Elias Fisseha       Negussie Gorfe, M. Steve Gui-Diby, , M. Gulilat Tesfaye, M.
from the ACS; and Mr. Jose Awong, from the AUC.                Tesfaye Belay, M. Kidus Mengistu, M. Michael Girma, M.
                                                               Elias Fisseha, pour le CAS et M. Jose Awong pour la CUA.
The following National Data Correspondents (NDC) pro-
vided useful data for their respective country: Burkina        Les corresponants Nationaux en Donnees (CND) suivants
Faso: Aboudrahyme Savadogo; Chad: Mbaiogoum Tinro              ont fourni des donnees pour leur pays : Burkina Faso :
Raoul; Congo: Gilbert Foumou; Burundi: Nizigiyimana Vé-        Aboudrahyme Savadogo ; Burundi : Nizigiyimana Véné-
nérand; Cameroun: Jazet Kengap Eric; Central African           rand ; Cameroun : Jazet Kengap Eric ; Comores : Anfaita
Republic: Bayo Christophe; Comoros: Anfaita Achirafi;          Achirafi  ; Congo : Gilbert Foumou ; Côte d’Ivoire : Lig-
Cote d’Ivoire: Ligbet Magloire; Democratic Republic            bet Magloire ; Gabon : Ondo Metoo Symolin ; Gambie :
of Congo: Kankwanda Ebulelang Grégoire; Gabon: Ondo            Ousman Dibba ; Guinée : Balde Saikou Ahmed Tidiane ;
Metoo Symolin; Gambia: Ousman Dibba; Guinea: Balde             Kenya : Pamela Audi ; Lesotho : Molato Celina Malehloa ;
Saikou Ahmed Tidiane; Kenya: Pamela Audi; Lesotho:             Madagascar : Randriambolamanitra Samue ; Malawi :
Molato Celina Malehloa; Malawi: Willie Asayilekachaka;         Willie Asayilekachaka  ; Mali  : Dembele Diakaridia  ;
Mali: Dembele Diakaridia; Mauritania: Sow Ali Ousman;          Maroc : Zerrou Abdelilah ; Maurice : Li Fa Cheung Kai
Mauritius: Li Fa Cheung Kai Suet; Mozambique: Saide            Suet  ; Mauritanie  : Sow Ali Ousman  ; Mozambique  :
Dada; Niger: Manou Anaroua; Nigeria: Ichedi Sunday             Saide Dada ; Niger : Manou Anaroua ; Nigeria : Ichedi
Joel; Sao Tome & Principe: Adelino de Freitas; Senegal:        Sunday Joel ; République Démocratique du Congo :
Mbaye Maganou; Sierra Leone: Abubakarr Turay; Sudan:           Kankwanda Ebulelang Grégoire ; République centrafri-
Elalim Abdel Ghani Mohamed; Swaziland: Hanson Sibo-            caine: Bayo Chistophe ; Sao Tome & Principe : Adelino
niso Dlamin; Tanzania: Gregory Luxford Elias; Uganda:          de Freitas ; Sénégal :Mbaye Maganou ; Sierra Leone :
Musoke John; Zambia: Tembo Joseph; Zimbabwe: Mak-              Abubakarr Turay ; Soudan : Elalim Abdel Ghani  Moha-
ware Godfrey.                                                  med ; Swaziland : Hanson Siboniso Dlamin ; Tanzanie :
                                                               Gregory Luxford Elias ; Tchad : Mbaiogoum Tinro Raoul ;
                                                               Ouganda : Musoke John ; Zambie : Tembo Joseph ; Zim-
                                                               babwe :Makware Godfrey.


                                                               African Statistical Yearbook 2011 / Annuaire Statistique pour l'Afrique 2011
4


                                                                                                        2011


                                                                                            Contents
                                                                                   Table des matières


    African Statistical Yearbook 2011 / Annuaire Statistique pour l'Afrique 2011
2011
                                                                                    Contents
                                                                           Table des matières

Foreword ..................................................................................................................................................    9
Préface
Introduction ..............................................................................................................................................   13
Abbreviations and Acronyms ..................................................................................................................                 15
Abréviations et acronymes
General Notes ...........................................................................................................................................     17
Notes Générales

SECTION I  SUMMARY TABLES
TABLEAUX I TABLEAUX RESUMES

1       Social and Demographic Indicators ............................................................................................. 33
        Indicateurs démographiques et sociaux
        1-1 Total Mid-Year Population ........................................................................................................ 34
            Population totale au milieu de l’année
        1-2 Female Population (as % of Total) ............................................................................................. 35
            Population féminine (% de la population totale)
        1-3 Economically Active Population............................................................................................... 36
            Population active
        1-4 Adult Illiteracy Rate ..................................................................................................................          37
            Taux d’analphabétisme des adultes
        1-5 Gross Enrolment Ratio in Primary Education........................................................................... 38                                5
            Taux brut de scolarisation au primaire
        1-6 Gross Enrolment Ratio in Secondary Education ......................................................................                               39
            Taux brut de scolarisation au secondaire
        1-7 Pupil/Teacher Ratios ................................................................................................................. 40
            Ratios élèves enseignants
        1-8 Primary Health Care .................................................................................................................             41
            Soins de santé primaire
2       Economic Statistics........................................................................................................................           43
        Statistiques économiques
        2.1 GDP at Current market prices .................................................................................................. 46
            PIB aux prix courant du marché
        2.2 Real GDP Growth Rate ..............................................................................................................               47
            Taux de croissance réelle du PIB
        2.3 Per Capita GDP .......................................................................................................................... 48
            PIB par habitant
        2.4 Structure of Output ..................................................................................................................            49
            Structure du PIB
        2.5 Structure of Demand ................................................................................................................ 50
            Structure de la demande


                                                                                     African Statistical Yearbook 2011 / Annuaire Statistique pour l'Afrique 2011
2.6 Consumer Prices .......................................................................................................................              51
                     Prix à la consommation
                 2.7 Agricultural and Food Production Index .................................................................................                             52
                     Indice de la production agricole et alimentaire
                 2.8 Industrial, Mining and Manufacturing Production Index ........................................................ 53
                     Indice de la production industrielle, minière et manufacturière
                 2.9 Electricity Production by Type ................................................................................................. 54
                     Production d’électricité par catégorie
          3      Monetary and Financial Statistics ...............................................................................................                        57
                 Statistiques monétaires et financières
                 3.1 Broad Money Supply (M2) ........................................................................................................                     59
                     Masse monétaire (M2)
                 3.2 Exchange Rate Indices .............................................................................................................. 60
                     Indice des taux de change
                 3.3 Public Finances .........................................................................................................................            61
                     Finances Publiques
                 3.4 External Debt ............................................................................................................................          62
                     Dette extérieure
                 3.5 Balance of Payments ................................................................................................................ 63
                     Balance des paiements
6                3.6 Financial Flows .......................................................................................................................... 64
                     Flux financiers
                 3.7 Intra-African Trade by Economic Groupings in 2009............................................................... 65
                     Commerce intra-africain par zones économiques en 2009
          4      Economic Infrastructure and Investment Climate
                 Infrastructures économiques et climat des affaires
                 4.1 Tourism and Infrastructure ......................................................................................................                    67
                     Tourisme et infrastructure
                 4.2 Doing Business in 2010 ............................................................................................................. 68
                     Climat des affaires en 2010
          5      Millennium Development Goals ...................................................................................................                         71
                 Objectifs du millénaire pour le développement

          SECTION II          COUNTRY TABLES
                              TABLEAUX PAR PAYS

          1.     Algeria - Algérie ...............................................................................................................................        80
          2.     Angola ..............................................................................................................................................    85
          3.     Benin - Bénin ....................................................................................................................................       90
          4.     Botswana .........................................................................................................................................       95
          5.     Burkina Faso ....................................................................................................................................       100
          6.     Burundi ............................................................................................................................................    105


    African Statistical Yearbook 2011 / Annuaire Statistique pour l'Afrique 2011
2010
                                                                                    Contents
                                                                           Table des matières

7.    Cameroon - Cameroun ....................................................................................................................                   110
8.    Cape Verde - Cap Vert .....................................................................................................................                115
9.    Central African Rep. - Rép. Centrafricaine ......................................................................................                          120
10.   Chad - Tchad.....................................................................................................................................          125
11.   Comoros - Comores .........................................................................................................................                130
12.   Congo ...............................................................................................................................................      135
13.   Congo, Dem. Rep. - Congo, Rép. Dém. ............................................................................................                           140
14.   Côte d’Ivoire ....................................................................................................................................         145
15.   Djibouti.............................................................................................................................................      150
16.   Egypt - Egypte..................................................................................................................................           155
17.   Equatorial Guinea - Guinée Equatoriale ..........................................................................................                          160
18.   Eritrea - Erythrée .............................................................................................................................           165
19.   Ethiopia - Ethiopie ............................................................................................................................           170
20.   Gabon ...............................................................................................................................................      175
21.   Gambia - Gambie ..............................................................................................................................             180
22.   Ghana ...............................................................................................................................................      185
23.   Guinea - Guinée ................................................................................................................................           190
24.   Guinea Bissau - Guinée Bissau.........................................................................................................                     195
25.   Kenya................................................................................................................................................      200
26.   Lesotho ............................................................................................................................................       205
27.   Liberia - Libéria ................................................................................................................................         210
28.   Libyan Arab Jamahiriya – Jamahiriya Arabe Libyenne ...................................................................                                     215
29.   Madagascar .....................................................................................................................................           220
30.   Malawi ..............................................................................................................................................      225
31.   Mali ...................................................................................................................................................   230
32.   Mauritania - Mauritanie ...................................................................................................................                235   7
33.   Mauritius - Maurice..........................................................................................................................              240
34.   Morocco - Maroc..............................................................................................................................              245
35.   Mozambique ....................................................................................................................................            250
36.   Namibia - Namibie............................................................................................................................              255
37.   Niger.................................................................................................................................................     260
38    Nigeria - Nigéria ...............................................................................................................................          265
39.   Rwanda ............................................................................................................................................        270
40.   Sao Tome & Principe ........................................................................................................................               275
41.   Senegal - Sénégal ............................................................................................................................             280
42.   Seychelles ........................................................................................................................................        285
43.   Sierra Leone .....................................................................................................................................         290
44.   Somalia - Somalie.............................................................................................................................             295
45.   South Africa - Afrique du Sud..........................................................................................................                    300
46.   Sudan - Soudan ................................................................................................................................            305
47.   Swaziland .........................................................................................................................................        310
48.   Tanzania – Tanzanie .........................................................................................................................              315
49.   Togo..................................................................................................................................................     320
50.   Tunisia - Tunisie ................................................................................................................................         325
51.   Uganda - Ouganda ...........................................................................................................................               330
52.   Zambia - Zambie...............................................................................................................................             335
53.   Zimbabwe ........................................................................................................................................          340


                                                                                     African Statistical Yearbook 2011 / Annuaire Statistique pour l'Afrique 2011
8


                                                                                                  2011


                                                                                      Foreword
                                                                                   Avant-propos


    African Statistical Yearbook 2011 / Annuaire Statistique pour l'Afrique 2011
2011
                                                                              Foreword
                                                                           Avant-propos


T   he coordination between the African Development
    Bank (AfDB), the African Union Commission (AUC),
and the United Nations Economic Commission for Africa
                                                                L   e partenariat dans le domaine de la statistique
                                                                    continue de se poursuivre entre la Banque africaine
                                                                de développement (BAD), la Commission économique
(ECA) in the field of statistics continues. The joint produc-   pour l’Afrique (CEA) et la Commission de l’Union africaine
tion of the annual African Statistical Yearbook (ASYB) is       (CUA). L’Annuaire statistique pour l’Afrique (ASA), qui
a testimony of the ever-stronger partnerships between           est une production conjointe de ces trois organisations
the three pan-African organizations. The joint produc-          panafricaines est un témoignage de ce partenariat sans
tion through a pan-African mechanism gives the ASYB a           cesse grandissant. Cette production conjointe, réalisée
continental seal of approval. Working together, we check        à travers un mécanisme panafricain, confère à l’ASA, un
and validate the data to improve the quality and reduce         sceau marquant son caractère continental approuvé.
potential inconsistencies that would have resulted from         En travaillant conjointement, les partenaires ont vérifié
separate go-it-alone products.                                  et validé les données afin d’améliorer leur qualité et de
                                                                réduire les incohérences éventuelles qui auraient résulté
                                                                de la production de publications séparées.

As with the previous two editions, this third edition           A l’instar des deux précédentes éditions, cette troisième
presents time series showing how African Countries              édition présente des séries temporelles montrant dans
performed on several economic and social thematic areas         quelles mesures les pays africains ont progressé dans
over the 2002 to 2010 period. We have continued our ef-         divers domaines socioéconomiques au cours de la
forts to privilege the use of data sourced from countries       période 2002 à 2010. Un effort continu a été fourni pour
national sources, validated through a rigorous process.         utiliser dans la mesure du possible les sources de don-
                                                                nées provenant des systèmes statistiques nationaux et
                                                                validées à travers une procédure rigoureuse.

Invariably, there are some data sets that have to be            Invariablement, une partie des données a été recueillie
sourced from international organization that have been          auprès de sources internationales qui se sont spéciali-                        9
designated to compile comparable statistics on specific         sées dans la compilation des données statistiques com-
themes for the whole world, including Africa. Still it is       parables sur des thèmes spécifiques pour l’ensemble
important that such series are confirmed by the countries       des pays du monde, incluant l’Afrique. Il n’en demeure
so that any variations resulting, for instance from meth-       pas moins que de telles séries de données aient été
odological differences, are reconciled before compiling         confirmées par les pays afin que tout écart résultant par
the final figures in the ASYB. We have therefore continued      exemple des différences méthodologiques soit réconcilié
to emphasize the importance of involving our member             et réajusté dans l’ASA. C’est pour cette raison que les
States in the validation process. This year, we were able       partenaires ont mis l’accent sur l’importance d’associer
to get 32 countries represented at the validation meeting       leurs pays membres au processus de validation de ces
of experts, compared to 18 last year.                           données. Cette année, 32 pays étaient représentés à la
                                                                réunion d’expert de validation des données, comparati-
                                                                vement à 18 pays l’année dernière.

One of the values of producing the ASYB is the bringing         Une des valeurs ajoutées obtenues par la production de
together, in one volume, of data on African countries.          l’ASA est la mise à disposition, en un seul volume, des
It however goes more than just compiling them in one            données sur les pays africains. Bien entendu, son intérêt
volume as new information products are generated that           va bien au delà d’une simple compilation des données
would otherwise not be available. For example, bringing         dans un seul volume car il présente des informations
the trade figures declared by African countries allows us       nouvelles qui n’auraient pas été disponibles autrement.
to compute volume of trade between and within several           A titre d’exemple, il présente des données commerciales
regional economic communities (RECs). We are therefore          déclarées par les pays africains permettant de calculer
able to compare the performance of the RECs with re-            des volumes du commerce entre et au sein des com-
spect to intra- and inter-REC trade. These reported trade       munautés économiques régionales (CER). Ce qui rend
figures show that in 2009, 12% of cumulative exports from       possible la comparaison des performances des CER au
African countries go to other African countries. Econo-         regard des commerces intra et inter-CER. Ces données
mists, researchers, African leaders and other decision          commerciales montrent qu’en 2009, 12% des exportations


                                                                African Statistical Yearbook 2011 / Annuaire Statistique pour l'Afrique 2011
2011
                                                                                                  Foreword
                                                                                               Avant-propos


           makers can interpret these figures to ascertain both the                 totales africaines sont réalisées avec d’autres pays afri-
           level of progress made in intra-African trade, and which                 cains. Economistes, chercheurs, dirigeants et décideurs
           RECs need more attention to improve the local and overall                africains peuvent interpréter ces données à la fois comme
           situation.                                                               un progrès en matière de commerce intra-africain et un
                                                                                    défi pour les CER pour améliorer leur situation localement
                                                                                    et globalement.

           We are therefore committed to continue producing,                        Les trois institutions sont donc résolues à poursuivre la
           jointly, the ASYB on an annual basis. And bearing in mind                production conjointe de l’Annuaire statistique sur une
           that the original collection of the statistics takes place at            base annuelle. Prenant en considération le fait que la
           the national level, we shall continue in our efforts, again              collecte originelle des données statistiques se fait au
           jointly, to reinforce the capacities of the national struc-              niveau national, nous poursuivrons nos efforts conjoints
           tures to produce quality and credible statistics, first for              de renforcer les capacités des structures nationales à
           their development needs, and then to feed into appropri-                 produire des statistiques crédibles et de qualité, d’abord
           ate continental and global databases and repositories.                   pour leurs propres besoins de développement et enfin en
                                                                                    vue d’alimenter une base de données régionale, appro-
                                                                                    priée et de référence.


10
            Dr. Charles Leyeka Lufumpa                         Dr. René N’Guettia Kouassi                       Dr. Dimitri Sanga
                           Director                                          Director                                  Director
                   Statistics Department                                  Economic Affairs                   African Centre for Statistics
                 African Development Bank                           African Union Commission            United Nations Economic Commission
                                                                                                                      for Africa


     African Statistical Yearbook 2011 / Annuaire Statistique pour l'Afrique 2011
2011
                                                                              Introduction


T    he Yearbook series, is a result of joint efforts by major
     African regional organizations to set up a joint data
collection mechanism of socioeconomic data on African
                                                                 L    ’annuaire publication de la série, est le résultat
                                                                      des efforts conjoints des principales organisations
                                                                 régionales africaines pour disposer d’un mécanisme
countries as well as the development of a common har-            commun de collecte des données socio-économiques
monized database. The Joint African Statistical Yearbook         et d’une base de données commune et harmonisée sur
is meant to break with the practices of the past where           les pays africains. L’annuaire statistique commun marque
each regional/sub-regional organization was publishing           le début d’une rupture avec les pratiques du passé où
statistical data on African countries of the continent           chaque organisation régionale/sous-régionale éditait
in an inefficient way, leading to duplication of efforts,        des données statistiques sur les pays africains d’une
inefficient use of scarce resources, increased burden on         manière inefficace. En effet, ces anciennes pratiques
countries and sending different signals to users involved        conduisaient à la duplication des efforts, à une mauvaise
in tracking development efforts on the continent. It is          utilisation des ressources rares et à l’accroissement des
expected that the joint collection and sharing of data           fardeaux sur les pays. En même temps, elles envoyaient
between regional institutions will promote wider use             des messages disparates aux utilisateurs impliqués dans
of country data, reduce costs and significantly improve          les efforts de suivi du développement du continent. On
the quality of the data and lead to better monitoring of         s’attend à ce que la collecte et le partage communs des
development initiatives on the continent.                        données entre les institutions régionales favorisent une
                                                                 utilisation plus large des données des pays, réduisent
                                                                 leurs coûts d’accès, améliorent de manière significative
                                                                 leur qualité et conduiront à un meilleur suivi des initiatives
                                                                 de développement du continent.

The data in this issue of the Yearbook are arranged gener-       Le présent annuaire présente généralement les don-
ally for the years 2002 to 2010 or for the last eight years      nées sur la période allant de 2002 à 2010 ou sur les huit
for which data are available.                                    dernières années pour lesquelles des données sont
                                                                 disponibles. L’annuaire est édité en un volume composé                         11
                                                                 de deux parties : un ensemble de tableaux synoptiques
                                                                 et un ensemble de profils-pays.

The Yearbook is published in one volume consisting of            Chaque tableau synoptique affiche les données pour
two parts: a set of summary tables followed by country           un secteur déterminé. Chaque secteur regroupe des
profiles. The summary tables are presented by selected           indicateurs couverts par tous les pays africains et facilite
sectors. Each table presents indicators for all African          la comparaison entre eux. Neuf principaux secteurs ont
countries for comparison purposes. The indicators are            été sélectionnés.
grouped in nine main sectors.


                                                                 African Statistical Yearbook 2011 / Annuaire Statistique pour l'Afrique 2011
12


                                                                                    2011


                                             Abbreviations and Acronyms
                                               Abréviations et acronymes


     African Statistical Yearbook 2011 / Annuaire Statistique pour l'Afrique 2011
2011
                  Abbreviations and Acronyms
                    Abréviations et acronymes


ACBF            African Capacity Building Foundation /
                    Fondation pour le renforcement des capacités en Afrique
AEO/PEA         African Economic Outlook/Perspectives de l'économie africaine
AfDB/BAD        African Development Bank / Banque africaine de développement
ACS/CAS         African Centre for Statistics / Centre africain pour la statistique
AUC/CUA         African Union Commission / Commission de l’Union africaine
CPC/CCP         Central Product Classification / Classification centrale des produits des Nations Unies
CPI/IPC         Consumer Price Index / Indice des prix à la consommation
COMTRADE        United Nations Commodity Trade Statistics Database /
                    Base de données des statistiques du commerce des Nations Unies
ECA/CEA         Economic Commission for Africa / Commission économique pour l’Afrique
FAO             Food and Agriculture Organization /
                    Organisation des Nations Unies pour l’alimentation et l’agriculture
F.O.B/F.À.B     Free On Board / Franco à bord
ILO/BIT         International Labor Organization / Bureau international du travail
IMF/FMI         International Monetary Fund / Fonds monétaire international
ISIC/CITI       International Standard Industrial Classification /
                    Classification internationale type par industrie
ITU/UIT         International Telecommunication Union / Union internationale des télécommunications
M1              Broad Money / Masse monétaire
MDG/OMD         Millennium Development Goals / Objectifs du millénaire pour le développement
NEPAD           New Partnership for Africa’s Development /
                    Nouveau partenariat pour le développement de l’Afrique
ODA/APD         Official Development Assistance / Aide publique au développement
OECD/OCDE       Organization for Economic Co-operation and Development /
                    Organisation de coopération et de développement économique                                                      13
PRS/SRP         Poverty Reduction strategy / Stratégie de réduction de la pauvreté
RRSF/CSRR       Regional Reference Strategic Framework / Cadre stratégique régional de référence
SDR/DTS         Special Drawing Rights / Droits de tirage spéciaux
SNA/SCN         System of National Accounts / Système de comptabilité nationale
UN/ONU          United Nations / Organisation des Nations Unies
UNCTAD/CNUCED   United Nations Conference on Trade and Development /
                    Conférence des Nations Unies sur le commerce et le développement
UNDATA          United Nations Statistical Databases / Bases des données statistiques des Nations Unies
UNESCO          United Nations Educational, Scientific and Cultural Organization /
                    Organisation des Nations Unies pour l’éducation, la science et la culture
US/EU           United States / Etats-Unis d’Amérique
WTO/OMC         World Trade Organization / Organisation mondiale du commerce


                                                     African Statistical Yearbook 2011 / Annuaire Statistique pour l'Afrique 2011
14


                                                                                                      2011


                                                                                     General notes
                                                                                    Notes générales


     African Statistical Yearbook 2011 / Annuaire Statistique pour l'Afrique 2011
2011
                                                                      General notes
                                                                     Notes générales


T   he statistics presented in the Yearbook are, as far
    as possible in accordance with international recom-
mendations and definitions. Where important deviations
                                                                L   es statistiques présentées dans cet Annuaire sont,
                                                                    autant que possible, conformes aux recommanda-
                                                                tions et définitions internationales. Lorsque des diver-
are known to exist, they are indicated in footnotes at the      gences importantes sont connues, elles ont été indiquées
end of each country’s table. Owing to the rounding of fig-      dans les notes figurant à la fin du tableau de chaque
ures, the totals shown in tables do not always correspond       pays concerné. A cause des chiffres arrondis, les totaux
exactly to the sum of their component items.                    indiqués dans certains tableaux ne correspondent pas
                                                                toujours exactement à la somme de leurs composantes.


I.     SOCIAL AND DEMOGRAPHIC                                   I.       INDICATEURS SOCIO-
       INDICATORS                                                        DEMOGRAPHIQUES

Population                                                      Population

D     ata presented in this section, are derived mainly
      from the following publications: «World Population
Prospects, estimates and projections of the UN Secretar-
                                                                L   es données présentées dans cette section sont
                                                                    tirées principalement des publications: «Perspec-
                                                                tives d’avenir de la population mondiale, estimations et
iat Population Division”, “World Urbanisation Prospects”        projections», «Perspectives d’Urbanisation Mondiale»
and «Labour Force Estimates and Projections, 1980-2020»         de la Division de la Population du Secrétariat de l’ONU,
prepared by the International Labour Organisation (ILO).        «Estimations et Projections de la Main d’Oeuvre, 1980-
National sources have been used to supplement missing           2020» du Bureau International du Travail (BIT). Les sources
data when comparable with the UN series.                        nationales ont été utilisées pour compléter les données
                                                                non disponibles, dans la mesure où elles étaient compa-
Mid-year population                                             rables aux séries de l’ONU.
 Unless otherwise stated, the figures shown relate to de                                                                                       15
facto population. Population (Urban) refers to the number       Population en milieu d’année
of persons living in areas defined as urban according to        Sauf indication contraire, les chiffres indiqués se rap-
national definitions of this concept. Since national defini-    portent à la population de fait. La population urbaine est
tions differ, cross-country comparisons should be made          le nombre des personnes vivant dans les zones considé-
with care.                                                      rées comme urbaines selon les définitions de ce concept
                                                                dans chaque pays. Etant donné que cette définition varie
Population by age groups                                        quelque peu d’un pays à un autre, la prudence s’impose
Three age groups are used in order to highlight the             lorsqu’on procède à des comparaisons entre pays.
proportion of active population vis-à-vis the depend-
ant population. Population aged 15-64 is the number of          Groupes d’âges
people who could potentially be economically active,            Trois groupes d’âge sont utilisés dans le but de mettre en
excluding children.                                             lumière la proportion du groupe d’âge actif par rapport
                                                                aux dépendants. La population âgée de 15- 64 ans est le
Economically active population                                  nombre de personnes qui peuvent potentiellement être
The economically active population comprises all em-            économiquement active, et exclut les enfants.
ployed and unemployed persons (including those seek-
ing jobs for the first time). It covers employers, persons      Population économiquement active
working on their own account, salaried employees, wage          La population active comprend toutes les personnes em-
earners, unpaid family workers, members of producers’           ployées ou non (y compris celles qui sont à la recherche
co-operatives and members of the armed forces.                  de leur premier emploi). Elle comprend les employeurs,
                                                                les travailleurs indépendants, les salariés, les rentiers, les
 Life expectancy, Crude birth and death rates                   travailleurs familiaux non rémunérés, les membres des
Life expectancy at birth is the average number of years a       coopératives de producteurs et ceux des forces armées.
newborn infant would live if prevailing patterns of mortal-
ity of the total population at the time of his/her birth were
to stay the same throughout his/her life. Crude birth and


                                                                African Statistical Yearbook 2011 / Annuaire Statistique pour l'Afrique 2011
death rates represent the number of live births and the                  Espérance de vie, taux bruts de natalité et de
           number of deaths respectively per 1000 people. Death is                  mortalité
           the permanent disappearance of all evidence of life at any               L’espérance de vie à la naissance indique le nombre
           time after live birth has taken place (postnatal cessation               moyen d’années que vivrait un nouveau-né si les ten-
           of vital functions without capability of resuscitation). This            dances de la mortalité observées pour l’ensemble de
           definition excludes foetal deaths.                                       la population au moment de sa naissance restaient
                                                                                    inchangées tout au long de sa vie. Les taux bruts de
           Net reproduction rate
                                                                                    natalité et de mortalité représentent respectivement le
           The net reproduction rate is the average number of                       nombre annuel moyen de naissances et de décès pour
           daughters that would be born to a woman if she passed                    1000 habitants. La mortalité est le fait d’une disparition
           through her lifetime conforming to the age-specific                      permanente de toute évidence de vie, à tout moment,
           fertility and mortality rates of a given year. This rate is              après que la naissance ait eu lieu (cette définition exclut
           similar to the gross reproduction rate but takes into ac-                les mort- nés).
           count that some women will die before completing their
           childbearing years.                                                      Taux net de reproduction
                                                                                    Le taux net de reproduction mesure le degré de rempla-
           Total fertility rate
                                                                                    cement d’une génération par la suivante. Il s’exprime par
           The total fertility rate is the average number of children               le nombre de filles mises au monde en descendance finale
           that would be born per woman if she experiences no                       par femme, rapport non corrigé de l’effet de mortalité ce
           mortality and were subject to a given set of age-specific                qui le différencie du taux brut de reproduction.
           fertility throughout her lifetime.
                                                                                    Indice synthétique de fécondité
           Education                                                                L’indice synthétique de fécondité est le nombre moyen
           The sources of the data on education, reported in this                   de naissances qu’une femme soumise à un ensemble de
           publication, consist of national publications and the                    fécondités spécifiques par âge, pourrait avoir au cours
16         UNESCO Statistical Yearbook. Data presented generally                    de sa période de procréation.
           relate to the public (official) and private (independent)
           schools. The indicated years refer to the beginning of                   Education
           school year. Adult education, apprenticeship courses                     Les sources des données sur l’éducation présentées dans
           and correspondence schools are excluded. Owing to vari-                  cette publication sont les publications nationales et l’An-
           ations in school systems, caution needs to be exercised                  nuaire statistique de l’UNESCO. Les données présentées
           when comparing the data across countries.                                portent en général sur les écoles de l’Etat (publiques) et
                                                                                    les écoles indépendantes (privées). Les années indiquées
           Teaching Staff at specific level
                                                                                    se rapportent au commencement de l’année scolaire.
           Teachers are defined as persons whose professional                       Sont exclus la formation des adultes, les stages d’appren-
           activity involves the transmitting of knowledge, attitudes               tissage et les cours par correspondance. Compte tenu des
           and skills that are stipulated in formal curriculum pro-                 différences des systèmes scolaires, la comparaison des
           grammes to students enrolled in a formal Educational in-                 données présentées est sujette à caution.
           stitution at specific level (primary, secondary or tertiary).
                                                                                    Personnel enseignant par degré
           Student enrolment at specific level
                                                                                    Les enseignants sont définis comme étant les personnes
           First level student enrolment is the number of pupils                    dont l’activité professionnelle consiste à transmettre des
           enrolled at the primary level of education, regardless of                connaissances, des aptitudes et le savoir-faire stipulés
           age. Second level student Enrolment is the total number                  dans un programme officiel d’études aux étudiants ins-
           of students enrolled at the secondary level of education,                crits dans une institution scolaire officielle selon le degré
           regardless of age.                                                       (premier, deuxième ou troisième degré).
           Adult Illiteracy Rate                                                    Elèves inscrits selon le degré
           Percentage of persons aged 15 and over who cannot                        La scolarisation dans le premier degré est le nombre d’en-
           read and write.                                                          fants de tous âges inscrits à l’école primaire. La scolarisa-
                                                                                    tion dans le second degré est le nombre d’élèves de tous
                                                                                    âges inscrits dans le cycle d’enseignement secondaire.


     African Statistical Yearbook 2011 / Annuaire Statistique pour l'Afrique 2011
General notes
                                                                Notes générales


Pupil-Teacher ratio                                           Taux d’analphabétisme des adultes
Pupil-teacher ratio is the average number of pupils (stu-     C’est le pourcentage des adultes âgés de plus de 15 ans
dents) per teacher at a specific level of education in a      qui ne savent ni lire ni écrire.
given school-year.
                                                              Ratio élèves-enseignants
Public expenditure on education                               Le rapport élève-maître est le nombre moyen d’élèves
Public Education expenditure is government expenditure        (étudiants) par enseignant dans un degré d’enseignement
on the provision, management, inspection and support          déterminé dans une année scolaire donnée.
of pre-primary, primary and secondary schools; universi-
ties and colleges; vocational, technical and other training   Dépenses publiques consacrées à l’enseignement
institutions; and general administration and subsidiary       Les dépenses publiques d’éducation sont des dépenses
services.                                                     engagées par l’Administration publique pour le fonction-
                                                              nement, l’administration, l’insertion et l’appui des écoles
Health                                                        maternelles, primaires et secondaires; des universités et
The figures for physicians and nurses relate to those reg-    des établissements d’enseignement supérieur; des éta-
istered at the government offices. The number of hospital     blissements d’enseignements professionnel, technique
beds refers to public and private hospitals.                  et autres; et de l’administration générale et des services
                                                              annexes.
Acces to safe water
It is measured by the number of people who have a rea-        Santé
sonable means of getting an adequate amount of clean          Les chiffres donnés se rapportent aux médecins et
water, expressed as a percentage of the total population.     infirmiers enregistrés au niveau des services du gou-
                                                              vernement. Le nombre de lits d’hôpitaux sont ceux du
                                                              public et du privé.

                                                              Accès à l’eau potable                                                          17
                                                              Il est mesuré par le pourcentage dans la population totale
                                                              de personnes qui disposent de moyen approprié pour
                                                              accéder à de l’eau buvable.


II.    NATIONAL ACCOUNTS                                      II.      COMPTES NATIONAUX

T   his section provides information on national ac-
    counts. National accounts data provide essential
information on the economic performance of African
                                                              C    ette section présente des informations sur la comp-
                                                                   tabilité nationale. Les données de la comptabilité
                                                              nationale fournissent des indications essentielles sur la
countries in terms of growth and structure of output,         performance économique des pays africains en termes
investments and savings. National accounts data are ob-       de croissance et de structure de production, d’investis-
tained from various national sources and supplemented         sement et d’épargne. Les données de la comptabilité
with data from international sources such as the UN           nationale proviennent de diverses sources nationales et
Yearbook of National accounts and ADB and ECA African         complétées par d’autres sources internationales telles
Centre for Statistics estimates. Where necessary, official    que l’Annuaire de Comptabilité nationale de l’ONU et
figures have been adjusted to conform with the System         les estimations de la BAD et du Centre africain pour la
of National Accounts (SNA). Many countries continue to        statistique de la CEA. Les chiffres officiels ont été ajustés
compile their national accounts in accordance with the        en fonction du Système de Comptabilité Nationale (SCN)
1968 SNA, but an increasing number is adopting the 1993       quand cela s’est avéré nécessaire. De nombreux pays
SNA. A few countries still use concepts from older SNA        continuent d’élaborer leurs comptes nationaux à partir
guidelines, including valuations such as factor cost, in      du SCN 1968. Mais de plus en plus de pays sont en train
describing major economic aggregates.                         de migrer vers le SCN 1993. Certains pays continuent
                                                              encore d’utiliser les concepts provenant des anciennes
Gross Domestic Product (GDP)                                  recommandations du SCN incluant la comptabilisation
GDP measures the total final output of goods and services     des agrégats économiques aux coûts des facteurs.


                                                              African Statistical Yearbook 2011 / Annuaire Statistique pour l'Afrique 2011
produced by a national economy, excluding provisions                     Produit intérieur brut (PIB)
           for depreciation.                                                        Le produit intérieur brut (PIB) mesure la production finale
                                                                                    totale des biens et services de l’économie nationale, en
           GDP by kind of economic activity (by sector)
                                                                                    excluant l’amortissement.
           GDP by sector gives value-added by the broad categories
           of the ISIC classification. Value added is evaluated at basic            Le PIB par branche d’activité (par secteur)
           prices or factor cost or at producer prices depending                    Le PIB par secteur donne la valeur ajoutée pour les
           on the current practice in the country. Data is provided                 grandes catégories de la classification CITC. La valeur
           at current prices and in terms of growth rates over the                  ajoutée est évaluée aux prix de base ou aux coûts des
           previous year based on data at constant prices.                          facteurs ou encore au prix du producteur selon la pratique
                                                                                    en vigueur du pays. Les données nominales sur les valeurs
           Expenditure on GDP
                                                                                    ajoutées sont fournies aux prix courants et les taux de
           General Government final consumption                                     croissance annuels pour chaque catégorie sont calculés
           General Government final consumption expenditure                         à partir des données à prix constants.
           comprises all current expenditure for purchases of goods
           and services by all levels of government, as well as capital             Emplois du PIB
           expenditure on national defense and security.                            La consommation finale des administrations
                                                                                    publiques
           Private final consumption
                                                                                    La consommation finale des administrations publiques
           Household final consumption expenditure represents                       comprend toutes les dépenses courantes consacrées à
           the final consumption of households and non-profit in-                   l’achat de biens et de services par les administrations de
           stitutions. It includes imputed rent for owner-occupied                  tous les niveaux, ainsi que les dépenses en capital au titre
           dwellings but excludes purchases of dwellings and it also                de la défense et de la sécurité nationale.
           includes any statistical discrepancy.
                                                                                    La consommation finale privée
18         Gross capital formation
                                                                                    La consommation finale privée représente la consom-
           Gross capital formation consists of gross domestic                       mation finale des ménages et des institutions à but non
           fixed capital formation plus net changes in the level of                 lucratif. Elle ne comprend pas les achats de logement mais
           inventories.                                                             elle inclut le loyer imputé des logements occupés par leur
                                                                                    propriétaire. Elle comprend aussi tout écart statistique.
           Exports and imports of goods and services
           Exports and imports of goods and services refer to the                   La formation brute de capital
           value of goods and non-factor services provided to or                    La formation brute de capital comprend les dépenses
           from the rest of the world. They do not include receipts                 consacrées à l’accroissement du capital fixe de l’écono-
           and payments for factor services such as investment                      mie, majorées des variations nettes du niveau des stocks.
           income, interest and labor income. The data are gener-
           ally estimated on the basis of foreign trade statistics and              Les exportations et importations de biens et services
           are not directly comparable with those from the balance                  Les exportations et importations de biens et services
           of payments.                                                             représentent la valeur des biens et services non fac-
                                                                                    teurs fournis au reste du monde ou reçus de celui-ci.
                                                                                    La valeur des revenus et des paiements des services
                                                                                    facteurs comme le produit des placements, les intérêts
                                                                                    et le revenu du travail, en est exclue. Les données sont
                                                                                    généralement estimées sur la base des statistiques du
                                                                                    commerce extérieur et ne sont pas directement compa-
                                                                                    rables à celles de la balance des paiements.


     African Statistical Yearbook 2011 / Annuaire Statistique pour l'Afrique 2011
General notes
                                                                Notes générales


III.   INFLATION                                              III.     INFLATION

I  nflation is measured by the annual percent changes
   in Consumer price index. Consumer price index (CPI)
shows the cost of acquisition of a basket of goods and
                                                              L    ’inflation est mesurée par la variation annuelle de
                                                                   l’indice des prix à la consommation (IPC). L’IPC montre
                                                              le coût d’acquisition par un consommateur moyen d’un
services purchased by the average consumer. Weights           panier de biens et services. Les coefficients de pondé-
for the computation of the index numbers are obtained         ration pour le calcul des indices sont obtenus à partir
from household budget surveys. CPI data are provided          d’enquêtes sur les dépenses des ménages. Les données
by the national statistical systems, mainly by the National   de l’IPC proviennent des systèmes statistiques nationaux,
Statistical Offices or Central banks.                         et essentiellement des Instituts nationaux de statistique
                                                              ou des Banques centrales.


IV.    AGRICULTURAL PRODUCTION                                IV.      PRODUCTION AGRICOLE

Agricultural production                                       Production agricole
The data on major crops produced is obtained from the         Les données sur les principales productions agricoles
National Statistical Offices of the following countries;      sont obtenues via les instituts nationaux de statistiques
Burkina Faso, Burundi, Cameroon, Congo, Côte d’Ivoire,        des pays suivants  : Burkina Faso, Burundi, Cameroun,
Democratic Republic of Congo, Gabon, Gambia, Guinea-          Congo, Côte d’Ivoire, République démocratique du
Bissau, Kenya, Lesotho, Madagascar, Malawi, Mali,             Congo, Gabon, Gambie, Guinée-Bissau, Kenya, Lesotho,
Mauritania, Mauritius, Morocco, Mozambique, Nigeria,          Madagascar, Malawi, Mali, Mauritanie, île Maurice, Maroc,
Senegal, Sudan, Swaziland, Zambia, and Zimbabwe. For          Mozambique, Nigeria, Sénégal, Soudan, Swaziland, Zam-
the remaining countries the data is obtained from the         bie, et Zimbabwe. Pour les autres pays les données sont
online database of the Food and Agricultural Organiza-        tirées de la base de données en ligne de l’Organisation
                                                                                                                                             19
tion (FAO). For those countries, the five major crops per     pour l’Alimentation et l’Agriculture (FAO). Pour ces pays,
country are obtained by calculating the average yearly        les cinq principales productions agricoles sont obtenues
production of each crop produced by a given country           en calculant la production annuelle moyenne de chaque
(considering only years when the crop is produced); and       produit du pays (seules les années où le produit est
ranking it in descending order.                               récolté sont retenues) et en rangeant ces productions
                                                              par ordre décroissant.
Agricultural and food production index
The various indices of agricultural production illustrate     Indices de la production agricole et alimentaire
the relative level of the aggregate volume of agricultural    Les différents indices de la production agricole illustrent
production for each year, compared to the base period         le niveau du volume global de production agricole chaque
1999-2001. These indices of agricultural production ob-       année, relativement à la période de base 1999-2001.
tained from the FAO online database are computed using        Ces indices sont obtenus à partir de la base de données
the Laspeyres formula, as the price weighted sum of the       en ligne de la FAO et calculés en utilisant la formule de
production of various commodities less seed and feed.         Laspeyres - somme pondérée par les prix des produc-
The price used for weighting the production quantity of       tions des différents produits hors semences et graines
each commodity is the average price during the years          d’alimentation. Le prix utilisé pour pondérer la quantité
indicated as the base year.                                   de chaque produit est le prix moyen au cours des années
                                                              de référence.


V.     MINING PRODUCTION                                      V.       PRODUCTION MINIERE

T   he sources for the data reported are national statis-
    tical offices (for those countries to which the AfDB,
AUC and UNECA questionnaire was sent), the United Na-
                                                              L   es sources des données présentées sont soit  : les
                                                                  instituts nationaux de statistiques, pour les pays
                                                              auxquels le questionnaire conjoint BAD- CUA – ECA a
tions Industrial Commodity Database accessed through          été envoyé, Soit : la base des données sur les produits


                                                              African Statistical Yearbook 2011 / Annuaire Statistique pour l'Afrique 2011
UNDATA (at http://data.un.org/) and the United Nations                   industriels des Nations Unies, accessible via UNDATA (à
           Industrial Commodity Yearbook. Data for some of the min-                 http://data.un.org/) ou l’annuaire des produits industriels
           erals were also obtained from British Geological Survey,                 des Nations Unies. Pour certains minerais, les données
           World Minerals Production 2003 – 2007 (at http://www.                    ont également été obtenues à partir de l’enquête géo-
           bgs.ac.uk/downloads/browse.cfm?sec=12&cat=135) and                       logique britannique « la production de minerais dans le
           the United States Geological Survey website (at http://                  monde en 2003 – 2007 » sur le site : http://www.bgs.ac.uk/
           minerals.usgs.gov/minerals/pubs/commodity/myb/).                         downloads/browse.cfm?sec=12&cat=135
                                                                                    0u sur le site de l’enquête géologique des Etats-Unis :
           Mining production                                                        http://minerals.usgs.gov/minerals/pubs/commodity/myb/
           For a details description of the minerals included in this
           publication, the user may refer to the Central Product                   Production minière
           Classification (CPC) Ver.1.1, Statistical Papers, Series                  Pour les descriptions détaillées des produits miniers
           M, No.77, Ver.1.1 (United Nations publication, Sales No.                 inclus dans cette publication, le lecteur peut se référer à
           E.03.XVII.3). It was difficult to identify the three major               la Classification Centrale des Produits (CCP), Papiers sta-
           commodities for each country because of the reference                    tistiques, Séries M, N077, Ver 1.1 (Publication des Nations
           period being too narrow and commodities varying from                     Unies, Ventes N0. E.03.XVII.3). Il était difficile d’identifier
           one country to another. First, we obtained the export                    les trois principaux produits puisque la période de réfé-
           values of minerals for the years 1998 through 2007. We                   rence était très variable et courte pour plusieurs produits
           then considered the average value (considering only years                et aussi les produits varient d’un pays à un autre. Dans
           when the commodity is available) to help us decide which                 un premier temps, nous avons obtenu les valeurs des
           commodity to include in the publication. In addition, we                 exportations des produits miniers pour les années 1998
           decided to choose strategic commodities (such as oil,                    à 2007. Nous avons ensuite agrégé sur la période où le
           gas and diamonds) when the country is produces them.                     produit est disponible avant de calculer la moyenne pour
                                                                                    pouvoir décider quel produit à inclure dans la publication.
                                                                                    Finalement, nous avons décidé de choisir les produits
20                                                                                  stratégiques (tels que le pétrole, le gaz et le diamant)
                                                                                    lorsque le pays continue de les produire.


           VI.      ENERGY                                                          VI.     ENERGIE

           T   he data provided for this section are from the United
               Nations Energy Statistical Yearbook and the Energy
           Database which could be accessed through UNDATA (at
                                                                                    L   es sources des données publiées proviennent de
                                                                                        l’Annuaire statistique sur l’énergie des Nations Unies
                                                                                    et de la base de données sur l’énergie accessible à travers
           http://data.un.org/).                                                    UNDATA (http://data.un.org).

           Electricity production                                                   Production d’électricité
           The figures reported for production refer to gross gen-                  Les chiffres publiés pour la production sont relatifs à la
           eration of electricity, which include the consumption by                 production brute d’électricité, qui inclut la consommation
           station auxiliaries and any losses in transformers as well               des stations auxiliaires et toutes pertes dans la trans-
           as electricity generated by pumping stations without de-                 formation et aussi l’électricité produite par les stations
           ducting the electric energy consumed by the pumps. The                   de pompage sans déduction de l’énergie consommée
           production of electricity includes public utilities, whose               par ces mêmes pompes. La production d’électricité
           primary purpose is to generate and transmit electric                     comprend, d’une part, les installations publiques, dont
           energy for use by the public, and self producers, who                    le but primaire est la génération et la transmission de
           produce electric energy intended, in whole or in part,                   l’énergie électrique pour la consommation publique,
           for their own uses.                                                      et d’autre part, les producteurs privés qui produisent
                                                                                    l’énergie électrique, totalement ou en partie, pour leur
                                                                                    propre consommation.


     African Statistical Yearbook 2011 / Annuaire Statistique pour l'Afrique 2011
General notes
                                                                  Notes générales


VII. TOURISM AND INFRASTRUCTURE                                 VII. TOURISME ET INFRASTRUCTURE

Tourism                                                         Tourisme

E   xcept for the countries that are listed below, and
    which provided the data on Tourism and Infra-
structure through their National Statistical Offices, the
                                                                A     l’exception des pays énumérés ci-dessous, dont les
                                                                      INS ont communique les données sur le tourisme
                                                                et les infrastructures, les données de cette section sont
data on Tourism have been obtained from the African             tirées du CD-ROM des indicateurs de développement de
Development Indicators CDROM of the World Bank. The             l’Afrique de la Banque mondiale. Les pays qui ont fourni
countries that provided data on Tourism and Infrastruc-         des données sur le tourisme et l’infrastructure sont  :
ture are: Burkina Faso, Burundi, Congo, Djibouti, Côte          le Burkina Faso, le Burundi, le Congo, Djibouti, la Côte
d’Ivoire, Gabon, Gambia, Guinea-Bissau, Kenya, Libyan           d’Ivoire, le Gabon, la Gambie, la Guinée-Bissau, le Kenya,
Arab Jamahiriya, Lesotho, Madagascar, Malawi, Mali,             la Jamahiriya arabe libyenne, le Lesotho, Madagascar, le
Mauritania, Mauritius, Morocco, Mozambique, Nigeria,            Malawi, le Mali, la Mauritanie, l’île Maurice, le Maroc, la
Senegal, Sudan, Swaziland, and Zambia. The last two             Mozambique, le Nigeria, le Sénégal, le Soudan, le Swazi-
countries provided only infrastructure data.                    land, et la Zambie. Ces deux derniers pays n’ont fourni
                                                                que les données d’infrastructures.
The indicators published are the number of arrivals in the
country and the number of hotel rooms. The number of            Les indicateurs publiés sont le nombre d’arrivées dans
tourists to a country, unless otherwise stated, refers to all   le pays et le nombre de chambres d’hôtel. Le nombre de
persons (checked at the frontier) travelling for pleasure,      touristes d’un pays se rapporte, sauf indication contraire,
health, business, meetings or studies and stopping in           à toutes les personnes contrôlées à la frontière et voya-
that country for twenty-four hours or more. The figures         geant pour le plaisir, la santé, les affaires, les réunions
exclude immigrants and residents in a frontier zone.            ou les études, s’arrêtant dans le pays pour vingt-quatre
                                                                heures ou plus. Les données excluent les immigrés et
                                                                résidants frontaliers.
                                                                                                                                               21


VIII. FINANCIAL AND MONETARY                                    VIII. FINANCES ET STATISTIQUES
      STATISTICS                                                MONETAIRES

Monetary Statistics                                             Statistiques monétaires

D    ata for this section are essentially obtained from the
     IMF International Financial Statistics Database and
National Central Banks.
                                                                L   es données de cette section proviennent essentielle-
                                                                    ment des banques centrales africaines et de la base
                                                                de données sur les Statistiques financières internatio-
                                                                nales du FMI.
Money supply (M1)
Money supply comprises transferable deposits and cur-           La masse monétaire
rency outside deposit money banks.                              La masse monétaire au sens strict (M1) comprend les
                                                                dépôts transférables et la circulation fiduciaire hors
Quasi money                                                     banques.
Quasi money comprises time, savings and foreign cur-
rency deposits.                                                 La quasi-monnaie
                                                                La quasi-monnaie englobe les dépôts à terme, les dépôts
Net foreign assets                                              d’épargne et les dépôts en devises.
Net foreign assets equal the sum of foreign assets, less
the sum of foreign liabilities of monetary authorities and      Les avoirs extérieurs nets
deposit money banks.                                            Les avoirs extérieurs nets sont égaux à la somme des
                                                                avoirs extérieurs moins la somme des engagements
Domestic credit                                                 extérieurs des autorités monétaires et des banques
Domestic credit includes all domestic assets of the bank-       créatrices de monnaie.


                                                                African Statistical Yearbook 2011 / Annuaire Statistique pour l'Afrique 2011
ing system. It is the sum of claims on the central govern-               Le crédit intérieur
           ment (net), on official entities and the private sector.                 Le crédit intérieur est égal à la somme des créances nettes
           Credit to the private sector is shown separately but as a                sur l’Etat, sur les entreprises publiques et le secteur privé.
           subset of domestic credit.                                               Le crédit au secteur privé est présenté séparément mais
                                                                                    en tant que sous-groupe du crédit intérieur.
           International reserves
           International reserves consist of the country’s holdings                 Les réserves internationales
           of monetary gold, Special Drawing Rights (SDRs) and                      Les réserves internationales comprennent les avoirs du
           foreign exchange, as well as its reserve position in the                 pays en or monétaire, droits de tirage spéciaux (DTS) et
           International Monetary Fund (IMF).                                       devises, ainsi que ses réserves auprès du Fonds moné-
                                                                                    taire international (FMI).
           Exchange rates
           Exchange rates expressed in national currency unit per                   Le taux de change
           US dollar unit are reported as end period and period av-                 Le taux de change, exprimés en unité de monnaie natio-
           erages of market exchange rates and official rates. The                  nale par rapport au dollar EU, sont indiqués comme des
           market rate is defined as the rate determined largely by                 taux de fin de période et des moyennes sur la période des
           market forces; and the official rate is that determined by               taux de change du marché et des taux officiels. Le taux du
           the authorities.                                                         marché est défini comme le taux déterminé grosso modo
                                                                                    par les forces du marché; et le taux officiel est celui fixé
           Public Finance                                                           par les autorités.
           Data for this section have been primarily collected from
           National Authorities such as National Statistics Offices,                Finances publiques
           Ministries of Finance and Central Banks; and where na-                   Les données de section sont principalement collectées
           tional sources are not available; data from IMF publica-                 par les autorités nationales, telles que les instituts
           tions (Country Reports) are used.                                        nationaux de statistiques, les ministères des finances et
22                                                                                  les banques centrales ; quand les sources nationales ne
           The data for Botswana, Egypt, Ethiopia, Kenya, Malawi,                   sont pas disponibles, les données des publications du
           Mauritius, Namibia, South Africa and Swaziland, were                     FMI (rapports des pays) sont employées.
           compiled following their respective fiscal period as an-
           nual data. Therefore, the years 2002 - 2010 represent                    Pour le Botswana, l'Egypte, l'Ethiopie, le Kenya, le Malawi,
           the ending calendar year according to the fiscal period                  les îles Maurice, la Namibie, l'Afrique du Sud et le Swazi-
           of each country.                                                         land, les données ont été compilées selon l’année fiscale,
                                                                                    comme données annuelles. Ainsi, les années 2002 à 2010
           Revenue and grants
                                                                                    représentent bien l'année civile selon la période fiscale
           These include all non-repayable receipts, requited and                   de chaque pays.
           unrequited, current and capital, and non-compulsory,
           nonrepayable, unrequited receipts from other govern-                     Recettes totales et dons
           ments (domestic or foreign) and international institutions.              Les recettes publiques incluent toutes les recettes non
                                                                                    remboursables de l’Etat, avec ou sans contrepartie, pro-
           Tax revenue
                                                                                    venant d’autres administrations (locales ou étrangères)
           This includes compulsory, unrequited, non-repayable                      et des institutions internationales.
           contributions exacted by a government for public pur-
           poses.                                                                   Recettes fiscales
                                                                                    Les recettes fiscales regroupent les impôts, taxes, droits
           Non-tax revenue
                                                                                    et autres transferts obligatoires autres que les cotisations
           This includes requited receipts from property incomes,                   de sécurité sociale. Elles sont la principale source de
           fees and charges, non-industrial and incidental sales, the               revenu de la plupart des administrations publiques et
           cash operating surpluses of departmental enterprises                     constituent des transferts obligatoires vers ce secteur.
           and unrequited receipts such as fines, forfeits and cur-
           rent private donations.                                                  Recettes non fiscales
                                                                                    Elles regroupent les impôts sur les revenus de la pro-
                                                                                    priété, les droits et taxes non industrielles et les ventes


     African Statistical Yearbook 2011 / Annuaire Statistique pour l'Afrique 2011
General notes
                                                                   Notes générales


Grants                                                           de biens existants, les amendes, les pénalités, les confis-
Unrequited, non-repayable, non-compulsory govern-                cations, les indemnisations accordées par un tribunal, et
ment receipts from other governments or international            les transferts volontaires autres que les dons.
institutions.
                                                                 Les dons
Expenditure and net lending                                      Les dons sont des transferts non obligatoires courants ou
These include all non-repayable payments by govern-              en capital qu’une administration publique peut recevoir
ment, whether requited or unrequited and whether                 d’une autre administration publique ou d’une organisa-
current or capital, as well as government transactions in        tion internationale.
debt and equity claims upon others acquired for purposes
                                                                 Dépenses et prêts nets
of public policy.
                                                                 Ils comprennent tous les paiements non remboursables
Current Expenditure                                              effectués par l’Administration publique, avec ou sans
It includes all non-repayable payments by government,            contrepartie, y compris les dépenses courantes et en
whether requited or unrequited, other than capital ex-           capital, les transactions au titre de la dette publique et
penditure or grants.                                             les participations au capital pour des raisons de politique
                                                                 publique.
Capital Expenditure
Expenditure for acquisition of fixed capital assets, stocks,     Dépenses courantes
land or intangible assets plus unrequited transfers for          Elles comprennent tous les paiements non rembour-
the purpose of permitting the recipient to acquire such          sables effectués par l’Administration publique, avec ou
assets. In order to be classified as a capital asset, an         sans contrepartie, autres que les dépenses en capital ou
asset acquired must exceed a minimum value and be                les subventions.
intended for use for more than one year in the process
                                                                 Dépenses en capital
of production.
                                                                 Il s’agit des dépenses pour l’acquisition d’immobilisa-                        23
Net lending                                                      tions, des stocks, des terrains ou des actifs incorporels
Net lending (lending minus repayments) comprises gov-            ainsi que les transferts sans contrepartie dans le but de
ernment transactions in claims upon others acquired for          permettre au bénéficiaire d’acquérir ces actifs. Pour être
purposes of public policy rather than for management of          classé comme un capital, un bien acquis doit dépasser une
government liquidity or earning a return. It covers both         valeur minimale et être destiné à plus d’un an d’utilisation
debt and equities and both payments and receipts.                dans le processus de production.

Fiscal Balance                                                   Les prêts nets
Fiscal balance or Government overall surplus/deficit is          Les prêts nets (total des prêts moins les remboursements)
defined as total revenue and grants received less total          comprennent les transactions de l’Etat relatives aux
expenditure and net lending.                                     créances sur des tiers obtenues à des fins de politique
                                                                 publique plutôt que d’en tirer profit. Ce chiffre porte à la
Balance of Payments                                              fois sur les paiements et les recettes.
The Balance of payments is a statistical statement that sum-
marizes, for a specific period, the economic transactions        Déficit fiscal
of an economy with the rest of the world. Transactions for       L’excédent/déficit global des finances publiques est la
the most part between residents and non-residents con-           différence entre, d’une part, les recettes courantes, les
sist of those involving goods, services, and income; those       recettes en capital et les dons publics reçus et, d’autre
involving financial claims on, and liabilities to, the rest of   part, les dépenses totales et les prêts moins les rem-
the world; and those classified as transfers which involve       boursements.
offsetting entries to balance, in an accounting sense, one-
sided transactions. Data in this section are obtained from       Balance des paiements
African Central Banks and where data are not available from      Il s’agit d’un état statistique où sont résumées, pour une
national sources or if country data do not meet the required     période donnée, les transactions économiques d’une
quality, IMF Country Reports are also used.                      économie avec le reste du monde. Les transactions, pour
                                                                 la plupart entre résidents et non-résidents, sont celles qui


                                                                 African Statistical Yearbook 2011 / Annuaire Statistique pour l'Afrique 2011
Trade balance                                                            portent sur les biens, services et revenus; celles qui font
           Trade balance is equal to exports less imports of goods,                 naître des créances financières sur le reste du monde ou
           both measured on the "free-on-board" (f.o.b.) basis - that               des engagements financiers envers celui-ci et celles qui
           is, by the value of the goods at the border of the exporting             sont considérées comme des transferts, pour lesquels il y a
           country. Goods cover general merchandise, goods for                      lieu de passer des contre-écritures de manière à solder les
           processing, repairs on goods, goods procured in ports                    transactions à sens unique. Les données de cette section
           by carriers, and non-monetary gold.                                      proviennent des Banques centrales africaines. Lorsque ces
                                                                                    données ne sont pas disponibles ou de mauvaise qualité,
           Services balance                                                         les Rapports pays du FMI ont été utilisés en remplacement.
           Services include transportation (freight and passenger
           transportation); travel; communication services; con-                    Balance commerciale
           struction services; insurance services; financial services;              Elle est égale à la différence entre les exportations et les
           computer and information services; royalties and license                 importations de biens, évalués sur la base f.à.b (franco à
           fees; personal, cultural, and recreational services; gov-                bord) c’est-à-dire à la frontière du pays exportateur. Le
           ernment services. Service Balance is defined as exports                  poste des biens englobe les marchandises générales, les
           minus imports of services.                                               biens importés ou exportés pour subir une transforma-
                                                                                    tion, la valeur des réparations de biens, les biens achetés
           Net income                                                               dans les ports par les transporteurs non-résidents, et l’or
           Income includes compensation of employees which                          non monétaire.
           covers wages, salaries, and other benefits; investment
           income which consist of direct investment income, port-                  Balance des services
           folio investment income and other investment income.                     Les services recouvrent les transports (Fret et transport
           Net income is income received from investments abroad                    international des passagers), la rubrique des voyages, les
           less income paid to foreigners investing in the country.                 services de communication, les services des bâtiments
                                                                                    et travaux publics, les services d’assurance, les services
24         Current transfers                                                        d’informatique et d’information; les redevances et droits
           Current transfers consist of all transfers that do not                   de licence: les services personnels, culturels et relatifs
           involve: (i) transfers of ownership of fixed assets; (ii)                aux loisirs; les services fournis ou reçus par les adminis-
           transfers of funds linked to acquisition or disposal of fixed            trations publiques. La balance des services est définie
           assets; (iii) forgiveness, without any counterparts being                par les revenus moins les paiements au titre des services.
           received in return, of liabilities by creditors.
                                                                                    Revenus nets
           Current account balance                                                  Le poste revenus enregistre deux types de flux: ceux qui
           Current account balance is the sum of net exports of                     relèvent de la rémunération des salariés qui comprend
           goods and services, net income, and net current trans-                   les salaires, traitements et autres prestations; et ceux qui
           fers.                                                                    correspondent au revenu des investissements qui com-
                                                                                    prend les revenus des investissements directs, des inves-
           External debt and Financial Flows                                        tissements de portefeuille et d’autres investissements.
           Data in this section are mainly obtained from the follow-
           ing international sources: IMF World Economic Outlook                    Transferts courants
           database, OECD Online Database and UNCTAD online                         Les transferts courants sont tous ceux qui ne font pas
           database. However, few countries have submitted their                    intervenir i) le transfert de propriété d’un actif fixe, ii) le
           data and they are published in this edition of the Year-                 transfert de fonds lié ou subordonné à l’acquisition ou à
           book. The purpose of the yearbook is to include data                     la cession d’un actif fixe, iii) la remise, sans contrepartie,
           from national sources to the extent possible when the                    d’une dette par un créancier.
           data quality is acceptable. Data from national sources
           relate to the following countries: Burkina Faso, Kenya,                  Solde du compte courant
           Lesotho, Madagascar, Mali, Mauritius, Mozambique,                        La balance des comptes des opérations courantes est la
           Senegal, Swaziland, Tunisia and Zambia.                                  somme des exportations nettes des biens et services, du
                                                                                    revenu net et des transferts courants nets.
           External Debt
           External Debt (total outstanding debt) is the amount, at


     African Statistical Yearbook 2011 / Annuaire Statistique pour l'Afrique 2011
General notes
                                                                 Notes générales


any given time, of disbursed and outstanding contractual       Dette extérieure et flux financiers
liabilities of residents of a country to non-residents to      Les données de cette section proviennent essentielle-
repay principal, with or without interest, or to pay inter-    ment des sources internationales suivantes: la base de
est with or without principal. It is the sum of public and     données sur les «Perspectives de l’économie mondiale
publicly-guaranteed short and long-term debt, private          » du FMI, les bases de données en ligne de l’OCDE et de
non-guaranteed short and long-term debt and the use            la CNUCED. Cependant, quelques pays ont fourni leurs
of IMF credit.                                                 données pour cette édition de l’annuaire. L’objectif de
                                                               l’annuaire est d’inclure les données fournies par les
External debt service
                                                               pays eux-mêmes dans la mesure du possible pourvu
Total External Debt service is the sum of principal re-        que la qualité des données le permette. Les données
payments and interest actually made. It is debt service        nationales proviennent des pays suivants : Burkina Faso,
payments on short and long-term debt (public and               Kenya, Lesotho, Madagascar, Mali, Maurice, Mozambique,
publicly-guaranteed and private non-guaranteed) and            Sénégal, Swaziland, Tunisie et Zambie.
the use of IMF credit.
                                                               Dette extérieure totale
Foreign direct investment
                                                                La dette extérieure totale est le montant dû mais non
Foreign direct investment refers to investment made to         remboursé, à un moment donné, par les résidents d’un
acquire or add to a lasting management interest (usually       pays à des non résidents, et qui se sont engagés à rem-
10 percent of voting stock) enterprise operating in a coun-    bourser le principal, avec ou sans intérêt, ou à payer les
try other than that of the investor. It is the sum of equity   intérêts avec ou sans le principal. Elle est la somme de la
capital, reinvestment of earnings and other short and          dette publique, de la dette garantie publique, de la dette
long-term capital as shown in the balance of payments.         privée non garantie à long terme, du recours au crédit du
                                                               FMI et de la dette à court terme.
Official development assistance
ODA relates to grants or concessional loans (i.e. with a       Service de la dette extérieure
grant element of at least 25 percent), undertaken by the       Le service total de la dette (extérieure) est la somme                         25
official sector, whose main objective is the promotion of      des remboursements du principal et des paiements des
economic development and welfare. Data in this section         intérêts. Il s’agit du service de la dette à court terme et
are net disbursements of ODA.                                  de la dette à long terme (dette publique, dette privée
                                                               à garantie publique et dette non garantie privée) et du
                                                               recours au crédit du FMI.

                                                                Investissements directs étrangers
                                                               L’investissement direct étranger représente l’investisse-
                                                               ment effectué pour acquérir ou accroître une participa-
                                                               tion durable au capital d’une entreprise (généralement
                                                               10 pour cent du pouvoir de vote) opérant dans un pays
                                                               autre que celui de l’investisseur. C’est la somme du capi-
                                                               tal social, du réinvestissement des bénéfices et d’autres
                                                               capitaux à court et à long termes comme il est indiqué
                                                               dans la section traitant de la balance des paiements.

                                                               Aide publique au développement
                                                               L’APD représente les dons et les prêts accordés à des
                                                               conditions financières privilégiées (c’est-à-dire avec un
                                                               élément de libéralité d’au moins 25 pour cent) au secteur
                                                               public dans le but principal de promouvoir le dévelop-
                                                               pement économique et le bien-être social. Il s’agit des
                                                               décaissements nets d’APD.


                                                               African Statistical Yearbook 2011 / Annuaire Statistique pour l'Afrique 2011
General notes
                                                                                      Notes générales


           IX.      EXTERNAL TRADE                                                  IX.      COMMERCE EXTERIEUR

           D     ata for this section are mainly obtained from national
                 sources.This is the case for the following countries:
           Angola, Botswana, Burkina Faso, Burundi, Cameroon,
                                                                                    L   es données pour cette section proviennent majori-
                                                                                        tairement des sources nationales. C’est le cas des
                                                                                    pays suivants : Angola, Botswana, Burkina Faso, Burundi,
           Central African Republic, Comoros, Congo, Côte d'Ivoire,                 Cameroun, République centrafricaine, Comores, Congo,
           Democratic Republic of Congo, Egypt, Gabon, The Gam-                     République démocratique du Congo, Côte d'Ivoire,
           bia, Guinea, Guinea-Bissau, Kenya, Lesotho, Libyan Arab                  Egypte, Gabon, Gambie, Guinée, Guinée-Bissau, Kenya,
           Jamahiriya, Madagascar, Malawi, Mali, Mauritania, Mau-                   Lesotho, Jamahiriya arabe libyenne, Madagascar, Ma-
           ritius, Morocco, Mozambique, Namibia, Nigeria, Rwanda,                   lawi, Mali, Mauritanie, Maurice, Maroc, Mozambique,
           Senegal, Seychelles, Sierra Leone, Sudan, Tanzania,                      Namibie, Nigeria, Rwanda, Sénégal, Seychelles, Sierra
           United Republic of, Tunisia, and Zambia. Where national                  Leone, Soudan, Tanzanie, Tunisie et Zambie. Dans le
           data were not available, we have used the United Nations                 cas où des données nationales n’ont pu être trouvées,
           COMTRADE online database. The names of major Export                      nous avons eu recours à la base de données en ligne
           and Import commodities have been selected by the re-                     des Nations Unies COMTRADE. Les noms des principaux
           porting countries themselves. For the data obtained from                 produits d'exportation et d'importation ont été choisis
           COMTRADE the harmonized system (rev1) classification                     par les pays eux-mêmes. Pour les données obtenues
           is used to determine the list of main exports and imports                de COMTRADE la nomenclature du système harmonisé
           commodities. Unless otherwise indicated the import sta-                  (rev1) a été employée pour déterminer la liste des pro-
           tistics are reported on CIF valuation base while exports                 duits principaux d'exportations et d'importation. Sauf
           are reported on FOB.                                                     indication contraire, les statistiques d'importation sont
                                                                                    valorisées sur la base CAF tandis que les exportations
                                                                                    sont valorisées FOB.


26         X.       MILLENIUM DEVELOPMENT                                           X.       OBJECTIFS DU MILLENAIRE POUR
                    GOALS                                                                    LE DEVELOPPEMENT

           I   ndicators presented in this publication come from the
               MDGs websites.                                                       L     es indicateurs publiés proviennent du site web des
                                                                                          OMDs.

                                                                                    Environnement
           Environment                                                              Le Burkina Faso, le Burundi, le Cameroun, les Comores, le
           Burkina Faso, Burundi, Cameroon, Comoros, Congo,                         Congo, le Gabon, la Guinée, le Kenya, la Jamahiriya arabe
           Gabon, Guinea, Kenya, Libyan Arab Jamahiriya, Malawi,                    libyenne, le Malawi, la Mauritanie, l’île Maurice, le Maroc,
           Mauritania, Mauritius, Morocco, Mozambique, Nigeria,                     le Mozambique, le Nigeria, le Sénégal, et le Zimbabwe ont
           Senegal, and Zimbabwe are the countries that provided                    fourni des données sur l’environnement ; pour les autres
           data on environment for the remaining countries is ob-                   pays, les données ont été tirées du CD-ROM des indica-
           tained from the African Development Indicators CD-ROM                    teurs africains de développement de la Banque mondiale.
           of the World Bank.
                                                                                    Technologies de l’information et de
           Information and Communication Technology                                 communication (TIC)
           (ICT)                                                                    Le Cameroun, les Comores, le Congo, Djibouti, la Guinée,
           Cameroon, Comoros, Congo, Djibouti, Guinea, Kenya,                       le Kenya, la Jamahiriya arabe libyenne, le Malawi, le Mali,
           Libyan Arab Jamahiriya, Malawi, Mali, Mauritania, Mau-                   la Mauritanie, l’île Maurice, le Mozambique, le Nigeria,
           ritius, Mozambique, Nigeria, Senegal, Sudan, Swaziland,                  le Sénégal, le Soudan, le Swaziland et la Zambie ont
           and Zambia are the countries that provided data on ICT                   fourni des données sur les TIC  ; pour les autres pays,
           the data for the remaining countries is obtained from the                les données ont été obtenues de l’Union internationale
           International Telecommunication Union (ITU) and African                  des Télécommunication (UIT) ou à partir du CD-ROM des
           Development Indicators CD-ROM of the World Bank.                         indicateurs de développement de l’Afrique de la Banque
                                                                                    mondiale.


     African Statistical Yearbook 2011 / Annuaire Statistique pour l'Afrique 2011
1
Part


                                                                                      27


        Partie
        Summary Tables
       Tableaux résumés


       African Statistical Yearbook 2011 / Annuaire Statistique pour l'Afrique 2011
1
28


     Section

             Social and Demographic Indicators
         Indicateurs démographiques et sociaux


       African Statistical Yearbook 2011 / Annuaire Statistique pour l'Afrique 2011
2011
Pupil/Teacher Ratio in Primary                                                        Le ratio élèves par enseignant
Education                                                                             dans l’éducation primaire


Women participation in the workforce in                                               La participation des femmes dans la
Africa: Good but insufficient progress?                                               population active en Afrique: Des progrès
The economically active population in Africa has in-                                  prometteurs mais insuffisants?
creased by about 32.6% between 2000 and 2010. For                                     La population économiquement active en Afrique s’est
the 52 countries included in the table, the number of                                 accrue d’environ 32.6% entre 2000 et 2010. Pour les 52
economically active persons has reached 413.5 million in                              pays pris en compte dans le graphique, le nombre de
2010 as compared to 311.8 million in 2000. This increase                              personnes économiquement actives a atteint 413.5
mirrors roughly the increment in the African population                               millions en 2010 comparativement à 311.8 millions en
during the past ten years.                                                            2000. Cet accroissement reflète approximativement
                                                                                      l’augmentation de la population africaine au cours de dix
The share of women in the economically active population                              dernières années.
in Africa has shown some promising progress between
2000 and 2010. This share went up from 40.3% to 41.0%                                 L’évolution de la part des femmes dans la population
over the ten years under consideration. Although this is                              économiquement active en Afrique dénote en partie
a positive movement, at the current trends, Africa is still                           un progrès encourageant entre 2000 et 2010. Cette
not likely to meet the MDG target on parity of women and                              part a grimpé de 40.3% à 41.0% au cours des dix années
men in the economically active population.                                            sous revue. Bien que cette évolution soit positive, aux
                                                                                      tendances actuelles, il est probable que l’Afrique ne soit
However, these figures should be interpreted with cau-                                pas encore en mesure de réaliser l’objectif du millénaire
tion. While there seems to be some progress, the figures                              pour le développement relatif à la parité entre les femmes
do not tell us anything about the internal structure of the                           et les hommes s’agissant de la population économique-
workforce. It is important to know whether the share of                               ment active.
women’s activity in the economy has been increasing at
all levels of responsibilities or whether women are still                             Cependant, ces chiffres doivent être interprétés avec
mainly concentrated in low level jobs.                                                prudence. Quoiqu’il semble y avoir du progrès, les chiffres
                                                                                                                                                                     29


                   Econom ically Active Population and Share of Wom en in the Econom ically Active Population
                                                   (Africa excepted Seychelles)
                        Population économ iquem ent active et la part des fem m es dans la population
                                       économ iquem ent active (Afrique excepté Seychelles)

      450                                                                                                                                             42

      400
                                                                                                                                                      41
      350
                                                                                                                                                      40
      300

      250                                                                                                                                             39

      200                                                                                                                                             38

      150
                                                                                                                                                      37
      100
                                                                                                                                                      36
       50

         0                                                                                                                                            35
               2000         2001         2002         2003        2004         2005         2006         2007         2008         2009    2010
             Economically Active Population, in millions (left scale) / Population économiquement active en millions (échelle de gauche)

             % of Women in the Economically Active Population (right scale) / % des femmes dans la population économiquement active (échelle de droite)


                                                                                      African Statistical Yearbook 2011 / Annuaire Statistique pour l'Afrique 2011
2011
           Pupil/Teacher Ratio in Primary                                           Le ratio élèves par enseignant
           Education                                                                dans l’éducation primaire


           The concept of economically active persons is usually                    ne nous disent rien au sujet de la structure interne de la
           based on the definition from the System of National Ac-                  main d’œuvre. Il est important de savoir si la part des
           count (SNA), which minimizes activities in the informal                  activités de femmes dans l’économie s’est accrue à tous
           sector where women are a majority. This definition                       les niveaux des responsabilités ou si les femmes sont
           excludes those engaged in domestic activities that con-                  encore principalement concentrées dans les travaux de
           tribute to the general well being, but are not considered                niveau inférieur.
           productive according to the SNA. It is therefore possible
           that the participation of women in activities that generate              Le concept des personnes économiquement actives
           goods and services which increase the well-being of the                  est communément basé sur la définition du Système de
           populations and contribute to the development of the                     comptabilité national (SCN), qui minimise les activités du
           continent is probably higher than what these numbers                     secteur informel où exercent en majorité les femmes.
           suggest.                                                                 Il est par conséquent possible que la participation des
                                                                                    femmes aux activités qui génèrent des biens et services
                                                                                    qui concourent à l’amélioration du bien-être des popula-
                                                                                    tions et contribuent au développement du continent soit
                                                                                    probablement plus importante que ce que ces chiffres
                                                                                    suggèrent.


30


     African Statistical Yearbook 2011 / Annuaire Statistique pour l'Afrique 2011
POPULATION

                                       1-1. Total mid-year population - Population totale au milieu de l'année
THOUSANDS                                                                                                                                         MILLIERS

                                                                                                                                                       Pays
Country                      1980      1990      2000      2004      2005      2006      2007      2008     2009        2010
Algeria                     18 811    25 283    30 506    32 366    32 855    33 351    33 858    34 373    34 895     35 423                         Algérie

Angola                       7 854    10 661    14 280    16 135    16 618    17 089    17 555    18 021    18 498     18 993                         Angola

Benin                        3 560     4 795     6 659     7 611     7 868     8 128     8 393     8 662     8 935      9 212                          Bénin

Botswana                       985     1 352     1 723     1 815     1 839     1 865     1 892     1 921     1 950      1 978                      Botswana

Burkina Faso                 6 862     8 814    11 676    13 290    13 747    14 225    14 721    15 234    15 757     16 287                   Burkina Faso

Burundi                      4 130     5 681     6 473     7 162     7 378     7 603     7 838     8 074     8 303      8 519                        Burundi

Cameroon                     9 080    12 233    15 865    17 417    17 823    18 238    18 660    19 088    19 522     19 958                     Cameroun

Cape Verde                     289       354       439       470       477       485       492       499      506         513                       Cap-Vert

Central African Republic     2 269     2 928     3 746     4 029     4 101     4 178     4 257     4 339     4 422      4 506       République Centrafricaine

Chad                         4 608     6 105     8 402     9 697    10 019    10 326    10 623    10 914    11 206     11 506                          Tchad

Comoros                        329       438       552       603       616       631       646       661      676         691                       Comores

Congo                        1 815     2 446     3 036     3 341     3 417     3 486     3 551     3 615     3 683      3 759                         Congo

Congo, Dem. Republic        27 170    37 016    50 829    57 337    59 077    60 800    62 523    64 257    66 020     67 827   Rép. Démocratique du Congo

Côte d'Ivoire                8 419    12 610    17 281    18 839    19 245    19 673    20 123    20 591    21 075     21 571                   Côte d'Ivoire

Djibouti                       340       560       730       791       805       820       834       849      864         879                        Djibouti

Egypt                       44 433    57 785    70 174    75 718    77 154    78 602    80 061    81 527    82 999     84 474                         Egypte

Equatorial Guinea              220       379       529       592       609       625       642       659      676         693             Guinée Equatoriale

Eritrea                      2 469     3 158     3 657     4 307     4 473     4 631     4 781     4 927     5 073      5 224                       Erythrée

Ethiopia                    35 409    48 292    65 515    72 746    74 661    76 628    78 646    80 713    82 825     84 976                        Ethiopie

Gabon                          682       926     1 233     1 343     1 369     1 396     1 422     1 448     1 475      1 501                         Gabon

Gambia                         616       896     1 302     1 481     1 526     1 571     1 616     1 660     1 705      1 751                        Gambie

Ghana                       11 026    14 968    19 529    21 435    21 915    22 393    22 871    23 351    23 837     24 333                         Ghana

Guinea                       4 628     6 147     8 384     9 041     9 221     9 412     9 615     9 833    10 069     10 324                         Guinée

Guinea-Bissau                  836     1 022     1 304     1 438     1 473     1 507     1 541     1 575     1 611      1 647                 Guinée-Bissau

Kenya                       16 261    23 433    31 441    34 890    35 817    36 772    37 755    38 765    39 802     40 863                         Kenya

Lesotho                      1 296     1 602     1 889     1 977     1 995     2 014     2 032     2 049     2 067      2 084                        Lesotho

Liberia                      1 910     2 167     2 824     3 225     3 334     3 471     3 627     3 793     3 955      4 102                         Libéria

Libyan Arab Jamahiriya       3 063     4 365     5 346     5 803     5 923     6 045     6 169     6 294     6 420      6 546      Jamahiriya Arabe Libyenne

Madagascar                   8 604    11 273    15 275    17 131    17 614    18 105    18 604    19 111    19 625     20 146                    Madagascar

Malawi                       6 215     9 451    11 831    13 277    13 654    14 043    14 439    14 846    15 263     15 692                         Malawi

Mali                         7 183     8 655    10 523    11 552    11 833    12 118    12 409    12 706    13 010     13 323                            Mali   31
Mauritania                   1 525     1 988     2 604     2 908     2 985     3 062     3 139     3 215     3 291      3 366                      Mauritanie

Mauritius                      966     1 056     1 195     1 242     1 252     1 262     1 271     1 280     1 288      1 297                        Maurice

Morocco                     19 567    24 808    28 827    30 152    30 495    30 853    31 224    31 606    31 993     32 381                          Maroc

Mozambique                  12 138    13 543    18 249    20 311    20 834    21 353    21 869    22 383    22 894     23 406                   Mozambique

Namibia                      1 013     1 417     1 824     1 971     2 009     2 048     2 089     2 130     2 171      2 212                        Namibie

Niger                        5 922     7 904    11 031    12 636    13 102    13 604    14 140    14 704    15 290     15 891                          Niger

Nigeria                     74 523    97 338   124 842   137 544   140 879   144 273   147 722   151 212   154 729    158 259                         Nigéria

Rwanda                       5 197     7 150     7 958     8 820     8 992     9 210     9 455     9 721     9 998     10 277                        Rwanda

Sao Tome and Principe           95       116       140       150       153       155       158       160      163         165           Sao Tomé-et-Principe

Senegal                      5 636     7 538     9 902    10 989    11 281    11 583    11 893    12 211    12 534     12 861                        Sénégal

Seychelles                      66        72        81        82        83        83        83        84       84          85                     Seychelles

Sierra Leone                 3 261     4 084     4 228     4 926     5 107     5 271     5 420     5 560     5 696      5 836                   Sierra Leone

Somalia                      6 434     6 596     7 394     8 164     8 354     8 544     8 733     8 926     9 133      9 359                        Somalie

South Africa                29 075    36 745    44 872    47 477    48 073    48 639    49 173    49 668    50 110     50 492                 Afrique du Sud

Sudan                       20 509    27 091    34 904    37 900    38 698    39 545    40 432    41 348    42 272     43 192                        Soudan

Swaziland                      603       864     1 080     1 115     1 124     1 137     1 151     1 168     1 185      1 202                      Swaziland

Tanzania                    18 661    25 455    34 131    37 945    39 007    40 117    41 276    42 484    43 739     45 040                       Tanzanie

Togo                         2 785     3 926     5 247     5 843     5 992     6 145     6 300     6 459     6 619      6 780                           Togo

Tunisia                      6 457     8 215     9 452     9 790     9 878     9 971    10 069    10 169    10 272     10 374                         Tunisie

Uganda                      12 655    17 731    24 433    27 779    28 699    29 652    30 638    31 657    32 710     33 796                       Ouganda

Zambia                       5 774     7 910    10 467    11 472    11 738    12 019    12 314    12 620    12 935     13 257                        Zambie

Zimbabwe                     7 282    10 461    12 455    12 492    12 475    12 459    12 449    12 463    12 523     12 644                      Zimbabwe


Africa                     481 519   637 806   818 270   898 569   919 669   941 216   963 195   985 585 1008 354    1031 472                        Afrique


                                                                                African Statistical Yearbook 2011 / Annuaire Statistique pour l'Afrique 2011
POPULATION

                                            1-2. Female (as % of Total) - Population féminine (% de la population totale)
     PERCENTAGE                                                                                                                                  POURCENTAGE


                                                                                                                                                         Pays
     Country                           1980 1990          2000      2004      2005     2006    2007      2008     2009      2010
     Algeria                             49.8      49.6     49.5      49.5      49.5    49.5     49.5     49.5      49.5     49.5                        Algérie

     Angola                              50.8      50.7     50.7      50.7      50.7    50.7     50.7     50.7      50.7     50.7                        Angola

     Benin                               51.6      50.9     50.1      49.8      49.7    49.7     49.6     49.6      49.5     49.5                         Bénin

     Botswana                            51.2      50.8     50.5      50.3      50.2    50.2     50.1     50.1      50.0     50.0                     Botswana

     Burkina Faso                        50.5      50.7     50.5      50.2      50.2    50.1     50.1     50.1      50.1     50.0                  Burkina Faso

     Burundi                             51.9      51.3     51.5      51.2      51.2    51.1     51.1     51.0      51.0     50.9                       Burundi

     Cameroon                            50.4      50.3     50.2      50.1      50.1    50.1     50.1     50.0      50.0     50.0                    Cameroun

     Cape Verde                          54.1      53.1     52.5      52.4      52.3    52.3     52.3     52.2      52.2     52.2                      Cap-Vert

     Central African Republic            50.9      50.9     50.9      50.9      50.9    50.9     50.9     50.9      50.9     50.9      République Centrafricaine

     Chad                                50.8      50.6     50.4      50.4      50.4    50.3     50.3     50.3      50.3     50.3                        Tchad

     Comoros                             50.0      50.0     49.9      49.8      49.8    49.8     49.8     49.8      49.8     49.8                     Comores

     Congo                               50.3      50.2     50.2      50.2      50.1    50.1     50.1     50.1      50.1     50.1                        Congo

     Congo, Dem. Republic                51.1      50.7     50.6      50.5      50.5    50.5     50.5     50.5      50.4     50.4   Rép. Démocratique du Congo

     Côte d'Ivoire                       48.0      48.1     48.5      48.8      48.9    48.9     49.0     49.0      49.1     49.1                  Côte d'Ivoire

     Djibouti                            50.3      50.1     50.1      50.1      50.0    50.0     50.0     50.0      50.0     50.0                       Djibouti

     Egypt                               49.9      49.7     49.6      49.7      49.7    49.7     49.7     49.7      49.7     49.7                        Egypte

     Equatorial Guinea                   51.3      50.8     50.5      50.5      50.5    50.5     50.4     50.4      50.4     50.4            Guinée Equatoriale

     Eritrea                             50.8      51.0     51.1      51.0      51.0    50.9     50.9     50.9      50.8     50.8                      Erythrée

     Ethiopia                            50.4      50.4     50.3      50.3      50.3    50.3     50.3     50.3      50.3     50.2                       Ethiopie

     Gabon                               50.8      50.5     50.4      50.2      50.2    50.1     50.1     50.1      50.0     50.0                        Gabon

     Gambia                              50.7      50.6     50.5      50.4      50.4    50.4     50.4     50.4      50.4     50.4                       Gambie

     Ghana                               49.5      49.5     49.4      49.3      49.3    49.3     49.3     49.3      49.3     49.3                        Ghana

     Guinea                              49.8      49.6     49.5      49.5      49.5    49.5     49.5     49.5      49.5     49.5                       Guinée

     Guinea-Bissau                       50.6      50.6     50.5      50.5      50.5    50.5     50.5     50.5      50.5     50.5                Guinée-Bissau

     Kenya                               50.2      50.2     50.2      50.1      50.1    50.1     50.0     50.0      50.0     50.0                        Kenya

     Lesotho                             53.9      53.6     53.2      53.1      53.0    53.0     52.9     52.9      52.8     52.7                       Lesotho

     Liberia                             50.7      50.7     50.5      50.4      50.4    50.4     50.4     50.3      50.3     50.3                        Libéria

     Libyan Arab Jamahiriya              46.6      47.3     47.9      48.1      48.1    48.2     48.2     48.3      48.3     48.3     Jamahiriya Arabe Libyenne

     Madagascar                          49.7      49.9     50.1      50.2      50.2    50.2     50.2     50.2      50.2     50.2                  Madagascar

     Malawi                              51.6      50.9     50.5      50.4      50.4    50.4     50.4     50.3      50.3     50.3                        Malawi
32
     Mali                                49.9      50.3     50.6      50.6      50.6    50.6     50.6     50.6      50.6     50.6                          Mali

     Mauritania                          49.8      49.8     49.5      49.4      49.4    49.3     49.3     49.3      49.3     49.3                    Mauritanie

     Mauritius                           50.7      50.1     50.3      50.3      50.3    50.4     50.4     50.4      50.4     50.5                       Maurice

     Morocco                             50.0      50.1     50.5      50.7      50.8    50.8     50.8     50.9      50.9     50.9                        Maroc

     Mozambique                          51.1      52.2     52.0      51.7      51.6    51.6     51.5     51.4      51.4     51.3                  Mozambique

     Namibia                             51.3      51.2     51.0      50.9      50.8    50.8     50.8     50.7      50.7     50.7                      Namibie

     Niger                               50.1      50.7     50.0      50.0      50.0    50.0     50.0     49.9      49.9     49.9                         Niger

     Nigeria                             50.3      50.3     50.1      50.0      50.0    49.9     49.9     49.9      49.9     49.9                       Nigéria

     Rwanda                              52.0      51.6     52.0      51.8      51.7    51.7     51.6     51.6      51.6     51.5                      Rwanda

     Sao Tome and Principe               50.3      50.4     50.4      50.4      50.4    50.5     50.5     50.5      50.5     50.5          Sao Tomé-et-Principe

     Senegal                             49.4      49.8     50.2      50.3      50.4    50.4     50.4     50.4      50.4     50.4                      Sénégal

     Seychelles                          49.8      50.1     49.6      49.6      49.7    49.7     49.7     49.7      49.7     49.7                    Seychelles

     Sierra Leone                        51.4      51.4     51.6      51.5      51.4    51.4     51.4     51.3      51.3     51.3                  Sierra Leone

     Somalia                             50.6      50.5     50.5      50.5      50.5    50.4     50.4     50.4      50.4     50.4                       Somalie

     South Africa                        50.3      50.5     50.8      50.8      50.8    50.8     50.7     50.7      50.7     50.7                Afrique du Sud

     Sudan                               49.9      49.8     49.7      49.7      49.7    49.7     49.7     49.7      49.6     49.6                       Soudan

     Swaziland                           52.5      52.9     51.8      51.5      51.4    51.3     51.3     51.2      51.1     51.0                     Swaziland

     Tanzania                            50.6      50.5     50.4      50.3      50.2    50.2     50.2     50.2      50.1     50.1                     Tanzanie

     Togo                                50.7      50.6     50.6      50.5      50.5    50.5     50.5     50.5      50.5     50.5                         Togo

     Tunisia                             49.3      49.5     49.5      49.6      49.7    49.7     49.7     49.7      49.7     49.7                       Tunisie

     Uganda                              50.2      50.2     50.1      50.0      50.0    50.0     50.0     49.9      49.9     49.9                     Ouganda

     Zambia                              50.3      50.3     50.3      50.2      50.2    50.2     50.2     50.1      50.1     50.1                       Zambie

     Zimbabwe                            50.3      50.3     51.1      51.4      51.5    51.6     51.6     51.7      51.7     51.6                    Zimbabwe


     Africa                             50.3      50.2      50.2      50.2     50.2     50.2    50.2      50.1     50.1      50.1                      Afrique


     African Statistical Yearbook 2011 / Annuaire Statistique pour l'Afrique 2011
POPULATION

                                     1-3. Economically active population- Population active


                                  Total (000)                          Female / Femmes (%)

Country                    2000      2005       2009      2010         2000     2005      2009      2010                               Pays

Algeria                     11 107     13 197    14 842    15 196        28.3      30.2      31.6     31.9                            Algérie

Angola                       6 238      7 326     8 275     8 533        46.6      46.7      46.8     46.9                            Angola

Benin                        2 670      3 212     3 698     3 825        44.9      45.8      46.3     46.4                             Bénin

Botswana                       799       903        996     1 019        47.1      47.4      47.4     47.4                         Botswana

Burkina Faso                 5 214      6 275     7 137     7 366        47.8      47.3      47.1     47.1                      Burkina Faso

Burundi                      3 139      3 865     4 572     4 733        53.0      52.8      52.6     52.6                           Burundi

Cameroon                     5 991      6 918     7 731     7 945        39.2      39.7      40.1     40.2                        Cameroun

Cape Verde                     156       187        214       221        39.7      41.8      43.2     43.4                          Cap-Vert

Central African Republic     1 704      1 887     2 073     2 125        46.2      46.5      46.5     46.6          République Centrafricaine

Chad                         3 276      3 810     4 280     4 400        45.6      45.2      45.2     45.2                            Tchad

Comoros                        256       298        333       342        45.8      46.2      46.5     46.6                         Comores

Congo                        1 256      1 451     1 593     1 637        43.0      43.3      43.7     43.8                            Congo

Congo, Dem. Republic        18 599     21 788    24 917    25 774        40.3      40.4      40.7     40.7       Rép. Démocratique du Congo

Côte d'Ivoire                6 724      7 522     8 367     8 606        35.2      36.1      36.9     37.1                      Côte d'Ivoire

Djibouti                       295       345        387       398        41.5      43.0      44.2     44.4                           Djibouti

Egypt                       21 653     24 702    27 411    28 006        24.4      23.8      23.0     22.9                            Egypte

Equatorial Guinea              186       226        261       270        27.5      29.4      30.9     31.1                Guinée Equatoriale

Eritrea                      1 382      1 835     2 155     2 230        42.1      43.5      44.5     44.7                          Erythrée

Ethiopia                    28 996     34 871    39 962    41 310        45.2      47.0      47.9     48.0                           Ethiopie

Gabon                          537       628        711       732        44.6      45.6      46.7     46.9                            Gabon

Gambia                         581       681        765       788        46.1      46.1      46.2     46.3                           Gambie

Ghana                        8 552      9 851    10 944    11 232        48.4      48.9      49.2     49.2                            Ghana

Guinea                       3 952      4 397     4 850     4 988        46.7      46.8      46.9     46.9                           Guinée

Guinea-Bissau                  541       605        660       676        42.7      42.5      42.4     42.4                    Guinée-Bissau

Kenya                       14 321     16 760    18 712    19 233        46.6      46.7      46.7     46.7                            Kenya

Lesotho                        809       883        935       949        52.0      52.4      52.5     52.4                           Lesotho

Liberia                      1 123      1 340     1 611     1 677        47.2      47.4      47.6     47.7                            Libéria

Libyan Arab Jamahiriya       1 831      2 157     2 369     2 418        21.3      22.3      22.5     22.5         Jamahiriya Arabe Libyenne

Madagascar                   7 270      8 505     9 683    10 007        48.7      49.0      49.2     49.2                      Madagascar
                                                                                                                                                       33
Malawi                       4 954      5 637     6 311     6 510        50.1      49.9      49.7     49.7                            Malawi

Mali                         2 959      3 388     3 767     3 869        35.9      36.6      37.4     37.6                              Mali

Mauritania                   1 030      1 232     1 395     1 435        40.8      41.4      41.9     42.1                        Mauritanie

Mauritius                      532       554        573       577        34.1      35.5      36.1     36.3                           Maurice

Morocco                     10 217     11 117    11 982    12 190        26.4      25.8      25.8     25.8                            Maroc

Mozambique                   8 909     10 041    11 003    11 261        53.1      52.5      52.0     51.8                      Mozambique

Namibia                        601       691        783       807        45.1      46.0      46.5     46.6                          Namibie

Niger                        3 548      4 198     4 803     4 973        31.2      31.6      31.6     31.6                             Niger

Nigeria                     39 222     44 906    49 998    51 349        34.6      34.8      35.1     35.2                           Nigéria

Rwanda                       3 708      4 399     4 961     5 105        53.1      53.1      52.9     52.9                          Rwanda

Sao Tome and Principe           46        53         58        59        37.1      37.4      38.0     38.1              Sao Tomé-et-Principe

Senegal                      4 089      4 769     5 408     5 580        42.1      42.8      43.4     43.5                          Sénégal

Seychelles                      36        38         39          ...     47.2      47.4      48.7          ...                    Seychelles

Sierra Leone                 1 663      1 952     2 141     2 188        52.1      51.7      51.4     51.3                      Sierra Leone

Somalia                      2 944      3 267     3 541     3 627        41.7      41.2      40.9     40.8                           Somalie

South Africa                15 595     17 587    19 153    19 419        43.5      44.0      43.7     43.6                    Afrique du Sud

Sudan                       10 485     11 997    13 472    13 885        27.9      28.8      29.4     29.6                           Soudan

Swaziland                      373       410        457       470        41.5      42.5      43.4     43.6                         Swaziland

Tanzania                    16 767     19 143    21 386    22 005        49.9      49.6      49.4     49.3                         Tanzanie

Togo                         2 182      2 594     2 962     3 059        42.0      42.8      43.5     43.6                             Togo

Tunisia                      3 179      3 503     3 786     3 850        24.7      26.1      26.7     26.9                           Tunisie

Uganda                      10 497     12 323    14 127    14 631        47.0      46.7      46.6     46.5                         Ouganda

Zambia                       4 024      4 400     4 816     4 942        44.9      44.1      43.3     43.2                           Zambie

Zimbabwe                     5 109      5 037     5 026     5 107        46.9      47.4      47.5     47.4                        Zimbabwe


Africa                     311 830   359 662    402 391   413 532        40.3      40.7     41.0      41.0                          Afrique


                                                                        African Statistical Yearbook 2011 / Annuaire Statistique pour l'Afrique 2011
EDUCATION

                                                1-4. Adult Illiteracy Rate ( % ) - Taux d'analphabetisme des adultes (% )
           PERCENTAGE                                                                                                                                      POURCENTAGE


                                                    2005                            2006                           2008                                             Pays
           Country
                                             MF            M        F        MF            M        F      MF         M                 F
           Algeria                           26.3       16.9      35.8       25.4      16.3       34.7       ...          ...           ...                        Algérie

           Angola                              …           …        …         …            …       …       30.4      17.2             43.0                         Angola

           Benin                             61.1       48.3      73.8       60.3      47.6       72.9     59.2      46.5             71.9                          Bénin

           Botswana                          18.6       18.6      18.6       17.9      17.9       17.8     16.7      16.9             16.5                      Botswana

           Burkina Faso                      76.4       68.6      83.4       74.0      65.7       82.1       ...          ...           ...                  Burkina Faso

           Burundi                             …           …        …         …            …       …       34.1      27.7             40.1                        Burundi

           Cameroon                            …           …        …         …            …       …       24.1      16.0             32.2                     Cameroun

           Cape Verde                        17.9       11.7      23.3       17.0      11.1       22.2     15.9      10.4             20.7                       Cap-Vert

           Central African Republic            …           …        …         …            …       …       45.4      31.2             58.9       République Centrafricaine

           Chad                                …           …        …         …            …       …       67.3      56.2             78.1                         Tchad

           Comoros                           26.7       21.1      32.2       25.8      20.4       31.2     26.4      20.7             32.2                       Comores

           Congo                             14.8        9.0      20.4       14.0       8.4       19.3       ...          ...           ...                        Congo

           Congo, Dem. Republic                …           …        …         …            …       …       33.4      22.5             43.9    Rép. Démocratique du Congo

           Côte d'Ivoire                       …           …        …         …            …       …       45.4      35.8             55.7                   Côte d'Ivoire

           Djibouti                            …           …        …         …            …       …         ...          ...           ...                       Djibouti

           Egypt                             28.6       17.0      40.6       28.6      16.7       40.3       ...          ...           ...                        Egypte

           Equatorial Guinea                   …           …        …         …            …       …        7.0       3.1             10.9             Guinée Equatoriale

           Eritrea                             …           …        …         …            …       …       34.7      23.0             45.5                       Erythrée

           Ethiopia                            …           …        …         …            …       …       64.1      50.0             77.2                        Ethiopie

           Gabon                             15.4       11.0      19.7       14.6      10.4       18.7     13.0       9.1             16.8                         Gabon

           Gambia                              …           …        …         …            …       …       54.7      43.3             65.7                        Gambie

           Ghana                             36.6       29.4      43.8       35.8      28.8       42.8     34.2      27.7             40.7                         Ghana

           Guinea                              …           …        …         …            …       …       62.0      50.4             73.6                        Guinée

           Guinea-Bissau                     39.0       27.6      49.8       37.2      26.2       47.6     49.0      33.9             63.5                 Guinée-Bissau

           Kenya                               …           …        …         …            …       …       13.5       9.7             17.2                         Kenya

           Lesotho                             …           …        …         …            …       …       10.5      17.4              4.9                        Lesotho

           Liberia                           46.8       41.0      52.5       45.6      40.4       50.8     41.9      36.7             47.0                         Libéria

           Libyan Arab Jamahiriya            14.4        6.2      23.2       13.8       5.9       22.4     11.6       5.1             18.7      Jamahiriya Arabe Libyenne

           Madagascar                          …           …        …         …            …       …       29.3      23.5             34.7                   Madagascar

           Malawi                            30.1       21.8      38.0       29.1      21.3       36.7     27.2      19.8             34.2                         Malawi

34         Mali                              77.5       69.3      84.8       77.1      68.9       84.4       ...          ...           ...                          Mali

           Mauritania                        45.4       37.5      53.3       44.8      37.1       52.5     43.2      35.9             50.5                     Mauritanie

           Mauritius                         13.4       10.3      16.4       13.0      10.1       15.9     12.5       9.6             15.2                        Maurice

           Morocco                           46.2       32.8      58.9       45.3      32.0       57.8     43.6      30.6             55.9                         Maroc

           Mozambique                        56.8       43.2      68.9       56.2      43.0       68.0     46.0      30.5             59.9                   Mozambique

           Namibia                           12.8       11.9      13.6       12.4      11.6       13.1     11.8      11.3             12.3                        Namibie

           Niger                             71.3       57.1      84.9       70.2      56.2       84.2       ...          ...           ...                         Niger

           Nigeria                           30.0       21.2      38.6       29.0      20.6       37.2     39.9      28.5             51.2                         Nigéria

           Rwanda                              …           …        …         …            …       …       29.7      25.2             33.9                        Rwanda

           Sao Tome and Principe             13.0        6.9      18.9       12.5       6.7       18.1     11.7       6.5             16.7           Sao Tomé-et-Principe

           Senegal                           58.6       47.7      69.2       58.0      47.3       68.5       ...          ...   ...                               Sénégal

           Seychelles                          …           …        …         …            …       …        8.2       8.6              7.7                     Seychelles

           Sierra Leone                      64.0       52.0      75.4       62.9      51.0       74.3     60.2      48.3             71.1                   Sierra Leone

           Somalia                             …           …        …         …            …       …         ...          ...           ...                       Somalie

           South Africa                      12.9       12.0      13.8       12.4      11.5       13.3     11.0      10.1             11.9                 Afrique du Sud

           Sudan                               …           …        …         …            …       …       30.7      21.0             40.4                        Soudan

           Swaziland                           …           …        …         …            …       …       13.5      12.6             14.4                      Swaziland

           Tanzania                          28.4       21.2      35.5       28.0      21.1       34.8     27.4      21.0             33.7                       Tanzanie

           Togo                                …           …        …         …            …       …       35.1      23.4             46.3                           Togo

           Tunisia                           24.0       14.9      33.1       23.1      14.2       32.0     22.4      13.6             29.0                        Tunisie

           Uganda                            28.4       19.4      37.3       27.4      18.8       35.9     25.4      17.6             33.2                      Ouganda

           Zambia                              …           …        …         …            …       …       29.3      19.4             39.0                        Zambie

           Zimbabwe                           9.9        6.6      13.1        9.3       6.3       12.4      8.6       5.6             11.2                      Zimbabwe


     African Statistical Yearbook 2011 / Annuaire Statistique pour l'Afrique 2011
EDUCATION

                           1-5. Gross Enrolment Ratio in primary - Taux brut de scolarisation au primaire
PERCENTAGE                                                                                                                            POURCENTAGE


                                     2000                           2005                           2006-10                                     Pays
Country

                             MF          M           F      MF          M           F       MF          M        F
Algeria                     107.8     112.3       103.1    111.7     115.8       107.3     107.7      111.0   104.2                           Algérie

Angola                         ...          ...      ...      ...          ...      ...    127.7      141.1   114.4                           Angola

Benin                        86.0     101.3        70.3    104.3     115.7        92.5     121.9      129.2   114.2                            Bénin

Botswana                    106.1     106.1       106.0    108.7     109.5       107.9     109.4      110.9   107.9                        Botswana

Burkina Faso                 44.6      51.9        37.0     57.8      64.0        51.4      79.2       82.9    75.4                     Burkina Faso

Burundi                      60.7      67.5        54.0     87.9      94.6        81.2     146.6      149.1   144.2                          Burundi

Cameroon                     86.0      92.8        79.2    108.1     117.6        98.4     113.8      122.0   105.5                       Cameroun

Cape Verde                  119.6     121.5       117.7    108.8     111.6       106.0      98.1      101.8    94.4                         Cap-Vert

Central African Republic       ...          ...      ...    64.7      76.8        52.8      88.6      103.8    73.6         République Centrafricaine

Chad                         66.4      82.4        50.3     76.9      91.7        61.9      89.7      105.2    74.2                           Tchad

Comoros                     111.5     120.3       102.4    121.5     129.1       113.7     119.4      124.6   114.1                        Comores

Congo                        85.0      88.1        81.8    113.8     117.7       109.9     119.5      123.5   115.5                           Congo

Congo, Dem. Republic           ...          ...      ...      ...          ...      ...     90.3       97.5    83.0      Rép. Démocratique du Congo

Côte d'Ivoire                72.6      83.1        62.1       ...          ...      ...     73.6       81.2    66.0                     Côte d'Ivoire

Djibouti                     32.5      37.5        27.5     41.5      45.7        37.3      54.5       57.6    51.3                          Djibouti

Egypt                        93.1      96.6        89.4     96.3      99.1        93.3      99.7      102.1    97.1                           Egypte

Equatorial Guinea           102.6     105.0       100.2     95.0      97.3        92.7      81.9       83.6    80.1               Guinée Equatoriale

Eritrea                      57.6      63.4        51.7     67.9      75.2        60.5      48.3       52.8    43.8                         Erythrée

Ethiopia                     55.1      66.9        43.3     81.6      89.4        73.8     102.5      107.1    97.8                          Ethiopie

Gabon                       135.2     135.2       135.2       ...          ...      ...       …         …        …                            Gabon

Gambia                       91.0      97.3        84.6     88.2      87.2        89.3      84.7       83.8    85.5                          Gambie

Ghana                        83.5      86.3        80.5     88.4      90.0        86.8     105.2      105.7   104.6                           Ghana

Guinea                       59.7      70.5        48.5     83.7      91.9        75.1      89.8       96.7    82.8                          Guinée

Guinea-Bissau                80.4      96.0        64.8    115.6           ...      ...    119.7        …        …                    Guinée-Bissau

Kenya                        95.0      95.6        94.3    106.6     108.7       104.4     112.7      113.9   111.4                           Kenya

Lesotho                     113.7     111.6       115.8    114.0     114.1       113.8     104.4      104.6   104.2                          Lesotho

Liberia                     113.4     131.6        95.1       ...          ...      ...     90.6       95.6    85.6                           Libéria

Libyan Arab Jamahiriya      118.7     119.7       117.6    106.3     107.2       105.2     110.3      113.0   107.5        Jamahiriya Arabe Libyenne

Madagascar                  103.8     105.8       101.7    144.9     148.0       141.7     160.4      162.3   158.5                     Madagascar         35
Malawi                      135.1     137.5       132.6    117.3     115.8       118.8     119.3      117.6   121.1                           Malawi

Mali                         58.7      67.5        49.8     79.6      89.2        69.7      94.7      102.9    86.3                             Mali

Mauritania                   86.5      86.7        86.2     97.5      94.8       100.4     104.4      100.6   108.4                       Mauritanie

Mauritius                   103.2     103.3       103.2     98.8      98.8        98.9     100.0      100.0   100.1                          Maurice

Morocco                      92.0      99.9        83.8    106.8     112.7       100.7     107.4      111.9   102.7                           Maroc

Mozambique                   74.9      85.4        64.4    101.4     110.0        92.7     115.7      121.7   109.6                     Mozambique

Namibia                     115.8     115.4       116.1    112.3     112.3       112.3     112.1      113.0   111.2                         Namibie

Niger                        32.2      38.0        26.0     49.3      57.0        41.3      66.6       73.1    59.8                            Niger

Nigeria                      95.5     105.9        84.8     99.4     108.1        90.4      93.1       99.2    86.8                          Nigéria

Rwanda                      105.4     107.2       103.6    137.3     135.9       138.6     150.7      149.8   151.4                         Rwanda

Sao Tome and Principe          ...          ...      ...   128.1     130.2       126.1     130.4      130.6   130.1             Sao Tomé-et-Principe

Senegal                      68.2      73.1        63.2     79.0      80.5        77.5      83.7       82.1    85.4                         Sénégal

Seychelles                  110.8     109.9       111.7    108.6     109.8       107.3     106.2      105.0   107.4                       Seychelles

Sierra Leone                 69.5           ...      ...      ...          ...      ...    157.7      167.8   148.0                     Sierra Leone

Somalia                        ...          ...      ...      ...          ...      ...     32.6       42.0    23.1                          Somalie

South Africa                106.1     108.7       103.4    104.9     107.1       102.8     101.2      103.2    99.1                   Afrique du Sud

Sudan                        46.7      50.3        42.9     54.0      57.7        50.2      74.0       77.8    70.0                          Soudan

Swaziland                    93.9      96.6        91.2    101.1     104.6        97.6     107.9      111.9   103.8                        Swaziland

Tanzania                     68.1      68.5        67.7    104.7     106.5       102.8     104.9      104.9   104.9                        Tanzanie

Togo                        108.6     122.2        95.0    106.4     115.1        97.6     115.2      118.8   111.5                            Togo

Tunisia                     115.3     118.1       112.4    112.1     113.6       110.4     107.1      108.3   105.8                          Tunisie

Uganda                      127.5     131.2       123.7    119.3     119.4       119.1     121.6      120.8   122.4                        Ouganda

Zambia                       81.7      84.5        78.9    115.3     117.9       112.7     112.9      113.5   112.4                          Zambie

Zimbabwe                    100.1           ...      ...      ...          ...      ...    103.6        …        …                        Zimbabwe
Africa                      85.8       92.0       79.2     96.9      101.9        91.7    102.7      106.3     99.0                         Afrique


                                                                            African Statistical Yearbook 2011 / Annuaire Statistique pour l'Afrique 2011
EDUCATION

                                          1-6. Gross Enrolment Ratio in secondary - Taux brut de scolarisation au secondaire
           PERCENTAGE                                                                                                                              POURCENTAGE

                                                      2000                           2005                          2006-10                                 Pays
           Country

                                              MF             M        F      MF          M           F      MF          M        F
           Algeria                              ...          ...      ...    83.2       80.3       86.3      …          …       …                          Algérie

           Angola                             14.3       15.7       12.9       ...          ...      ...    15.2        …       …                          Angola

           Benin                              22.6       30.7       14.3     36.3       46.1       26.1      …          …       …                           Bénin

           Botswana                           76.2       74.3       78.1     78.5       76.7       80.4     81.5       79.4    83.7                     Botswana

           Burkina Faso                       10.4       12.5        8.2     14.0       16.3       11.6     21.4       24.3    18.5                  Burkina Faso

           Burundi                              ...          ...      ...    13.2       15.2       11.3     21.2       24.6    17.8                       Burundi

           Cameroon                           27.2           ...      ...    27.2       30.3       23.9     41.5       45.2    37.7                    Cameroun

           Cape Verde                           ...          ...      ...    68.4       65.7       71.2     81.5       74.7    88.2                      Cap-Vert

           Central African Republic             ...          ...      ...      ...          ...      ...    13.6       17.5     9.8      République Centrafricaine

           Chad                               10.6       16.5        4.7     15.8       23.5        8.1     24.1       34.1    14.0                        Tchad

           Comoros                            29.0       31.9       26.1     45.8       52.1       39.3      …          …       …                       Comores

           Congo                              35.0       41.0       28.9       ...          ...      ...     …          …       …                          Congo

           Congo, Dem. Republic                 ...          ...      ...      ...          ...      ...    36.7       47.0    26.2   Rép. Démocratique du Congo

           Côte d'Ivoire                      23.1       29.9       16.2       ...          ...      ...     …          …       …                    Côte d'Ivoire

           Djibouti                           13.8       16.6       10.9     22.8       27.3       18.1     30.5       35.1    25.8                       Djibouti

           Egypt                              75.8       78.6       72.8       ...          ...      ...     …          …       …                          Egypte

           Equatorial Guinea                  29.8       41.4       18.2       ...          ...      ...     …          …       …              Guinée Equatoriale

           Eritrea                            24.6       29.1       20.2     30.3       38.2       22.5     31.8       37.1    26.4                      Erythrée

           Ethiopia                           14.4       17.3       11.6     24.9       31.2       18.6     34.4       38.8    30.0                       Ethiopie

           Gabon                              48.3       51.9       44.7       ...          ...      ...     …          …       …                          Gabon

           Gambia                             34.9       41.9       27.9     51.8       56.9       46.7     50.3       51.2    49.5                       Gambie

           Ghana                              39.7       43.7       35.6     46.1       50.1       42.0     57.2       60.5    53.6                        Ghana

           Guinea                             15.9       22.9        8.6     30.1       39.7       20.2     37.0       46.3    27.4                       Guinée

           Guinea-Bissau                      19.9       25.6       14.1     33.9           ...      ...    35.9        …       …                  Guinée-Bissau

           Kenya                              39.3       40.2       38.3     47.6       48.6       46.5     59.5       62.4    56.5                        Kenya

           Lesotho                            30.4       26.3       34.5     37.4       33.0       41.7     45.0       37.8    52.3                       Lesotho

           Liberia                            36.9       43.1       30.6       ...          ...      ...     …          …       …                          Libéria

           Libyan Arab Jamahiriya               ...          ...      ...   103.0       94.3      112.0     93.5       86.3   101.0     Jamahiriya Arabe Libyenne

36         Madagascar                           ...          ...      ...    22.0       22.4       21.5     31.5       32.5    30.6                  Madagascar

           Malawi                             31.0       35.5       26.6     27.3       30.1       24.5     29.5       31.5    27.6                        Malawi

           Mali                               17.6       22.7       12.5     25.9       32.2       19.6     38.3       46.4    30.1                          Mali

           Mauritania                         18.4       20.8       15.8     23.2       24.4       21.9     24.5       25.9    22.9                    Mauritanie

           Mauritius                          76.9       78.1       75.7     86.9       87.2       86.5     87.2       86.1    88.3                       Maurice

           Morocco                            38.1       42.4       33.7     49.2       53.4       44.8     55.8       60.1    51.4                        Maroc

           Mozambique                          6.1        7.5        4.7     13.2       15.7       10.8     25.5       28.0    22.9                  Mozambique

           Namibia                            60.7       57.2       64.1     63.3       59.3       67.3     65.8       60.7    70.9                      Namibie

           Niger                               6.6        8.3        5.0      9.6       11.9        7.4     13.3       16.0    10.5                         Niger

           Nigeria                            24.9       27.3       22.4     35.1       38.6       31.5     30.5       34.3    26.5                       Nigéria

           Rwanda                             10.7       11.0       10.3     15.8       16.8       14.8     26.7       27.5    26.0                      Rwanda

           Sao Tome and Principe                ...          ...      ...    45.3       43.7       46.9     51.0       50.3    51.8          Sao Tomé-et-Principe

           Senegal                            15.9       19.2       12.5     22.6       25.9       19.3     30.1       33.6    26.5                      Sénégal

           Seychelles                        104.3      101.1      107.7    105.8      103.7      108.0    105.0      102.6   107.5                    Seychelles

           Sierra Leone                         ...          ...      ...      ...          ...      ...    34.6       41.8    27.7                  Sierra Leone

           Somalia                              ...          ...      ...      ...          ...      ...     7.7       10.6     4.9                       Somalie

           South Africa                       85.5       81.3       89.7     92.6       89.8       95.3     93.9       91.6    96.1                Afrique du Sud

           Sudan                              24.8           ...      ...    31.2       32.2       30.1     38.0       40.3    35.5                       Soudan

           Swaziland                          41.8       41.7       41.9     46.1       45.9       46.3     53.3       56.0    50.5                    Swaziland

           Tanzania                            6.3        7.0        5.7     11.0       11.9       10.0     27.4       30.7    24.1                     Tanzanie

           Togo                               30.7       42.6       18.9     42.5       55.7       29.4     41.3       54.1    28.5                         Togo

           Tunisia                            75.9       73.9       78.0     85.3       81.4       89.3     91.8       88.3    95.6                       Tunisie

           Uganda                             16.1       18.1       14.0     18.7       20.6       16.7     27.4       29.8    24.9                     Ouganda

           Zambia                               ...          ...      ...      ...          ...      ...     …          …       …                         Zambie

           Zimbabwe                             ...          ...      ...      ...          ...      ...     …          …       …                      Zimbabwe

           Africa                             32.8      35.9       30.7     36.7       39.4       34.0     37.8       41.8    33.8                       Afrique


     African Statistical Yearbook 2011 / Annuaire Statistique pour l'Afrique 2011
EDUCATION

                                         1-7. Pupils teachers ratio - Ratios élèves enseignants
PERCENTAGE                                                                                                                         POURCENTAGE
                                    Primary - Primaire                          Secondary - Secondaire

                                                                                                                                            Pays
Country                    2000        2003       2005      2009          2000       2003         2005     2009
Algeria                     28.4         27.5      25.4       23.2            ...      31.5        21.0     20.8                           Algérie

Angola                        ...          ...       ...        ...         18.8       19.0          ...      ...                          Angola

Benin                       52.6         62.2      46.8       44.6          23.4       17.7        24.0     23.9                            Bénin

Botswana                    26.7         26.1      24.2       25.4          17.3       18.4        13.6     14.0                        Botswana

Burkina Faso                48.9         44.7      47.2       48.9            ...      24.7        31.0     30.3                     Burkina Faso

Burundi                     55.4         49.9      48.7       53.7            ...      18.8        22.8     29.6                          Burundi

Cameroon                    51.9         57.1      47.8       46.0            ...        ...       16.2     16.2                       Cameroun

Cape Verde                  28.7         27.9      26.0       24.4            ...      23.7        23.1     18.2                         Cap-Vert

Central African Republic      ...          ...     88.6      100.2            ...        ...         ...    76.1         République Centrafricaine

Chad                        68.6         72.1      63.2       62.4          32.2       32.2        33.5     32.9                           Tchad

Comoros                     36.8         35.9      35.0       30.2            ...      11.3        13.8     13.8                         Comores

Congo                       60.5         65.2      82.8       51.8            ...      28.1        34.0     34.3                           Congo

Congo, Dem. Republic          ...        34.0        ...      39.0          14.0       15.0          ...    16.6     Rép. Démocratique du Congo

Côte d'Ivoire               45.0         42.4        ...      41.9            ...        ...         ...    29.4                     Côte d'Ivoire

Djibouti                    32.0         34.5      34.6       34.0            ...        ...         ...    34.3                          Djibouti

Egypt                       23.0         22.2      25.6       27.1          16.9       17.3        17.0     16.6                           Egypte

Equatorial Guinea           43.4         32.0        ...      28.0          23.1         ...                  ...              Guinée Equatoriale

Eritrea                     47.5         46.7      47.5       47.4          54.1       53.5        51.3     49.3                         Erythrée

Ethiopia                    67.3           ...       ...      62.3            ...        ...                46.2                          Ethiopie

Gabon                       46.6         36.0      36.0         ...           ...        ...                  ...                          Gabon

Gambia                      37.4         39.4      36.5       34.4          22.8       21.2        23.2     24.1                          Gambie

Ghana                       33.8         31.3      32.8       32.2          19.1       18.2        18.8     17.1                           Ghana

Guinea                      45.6         45.0      44.9       44.1            ...      31.3        34.4     33.3                          Guinée

Guinea-Bissau               44.1           ...       ...        ...         14.4         ...                  ...                  Guinée-Bissau

Kenya                       34.4         38.0      44.8       46.5            ...      29.4        24.8     29.9                           Kenya

Lesotho                     47.9         46.2      41.6       37.0          22.1       23.8        26.6     16.9                          Lesotho

Liberia                     38.3           ...       ...      23.9          26.4         ...         ...    13.3                           Libéria

Libyan Arab Jamahiriya        ...          ...       ...        ...           ...        ...         ...     4.8        Jamahiriya Arabe Libyenne

Madagascar
M d                         48.0
                            48 0         51.6
                                         51 6      53.6
                                                   53 6       47.2
                                                              47 2            ...        ...       21.6
                                                                                                   21 6     26.7
                                                                                                            26 7                     Madagascar
                                                                                                                                     M d

Malawi                      75.1           ...     84.8       92.8            ...        ...       25.5     27.8                           Malawi
                                                                                                                                                      37
Mali                        65.3         57.3      54.4       51.4          29.0         ...                23.5                             Mali

Mauritania                  45.0         41.1      40.3       37.2          26.3       26.1        31.0     26.6                       Mauritanie

Mauritius                   26.1         23.1      22.3       21.7          19.4       18.6        17.2     16.4                          Maurice

Morocco                     28.8         28.2      27.1       26.5          17.0       18.1        19.0     18.7                           Maroc

Mozambique                  64.0           ...     66.3       64.1            ...        ...       32.2     36.7                     Mozambique

Namibia                     31.6         31.6      30.8       29.4          24.1       25.2        25.1     24.5                          Namibie

Niger                       40.7         41.7      43.7       40.7          23.4       28.6        27.4     27.9                            Niger

Nigeria                     42.9         35.8      36.9       46.3          30.4       38.6        38.2     28.4                           Nigéria

Rwanda                      54.0         59.9      65.9       67.7            ...      26.8        23.7     17.9                          Rwanda

Sao Tome and Principe         ...        32.1      30.8       30.8            ...        ...       21.7     21.7             Sao Tomé-et-Principe

Senegal                     50.9         46.0      41.7       36.4          27.3       25.6        26.4     26.4                          Sénégal

Seychelles                  14.7         14.0      13.7       13.1          14.5       13.7        12.8     13.8                       Seychelles

Sierra Leone                  ...          ...       ...      43.7            ...        ...         ...    23.9                     Sierra Leone

Somalia                       ...          ...       ...      30.8            ...        ...         ...      ...                         Somalie

South Africa                33.5         33.8      29.6       31.0          28.1       29.8        32.9     30.8                   Afrique du Sud

Sudan                         ...        28.1      29.0       36.7            ...      26.6        21.5     22.2                          Soudan

Swaziland                   31.3         31.2      32.9       32.4          17.3       16.9        16.8     19.1                        Swaziland

Tanzania                    41.4         56.9      55.9       52.4            ...        ...                  ...                        Tanzanie

Togo                        37.5         35.5      33.6       39.1          31.5       33.8        30.5     35.5                             Togo

Tunisia                     23.2         21.5      20.0       17.3          19.0         ...       17.2     15.2                          Tunisie

Uganda                      59.4         52.4      49.9       49.9          17.7       17.6        19.0     18.8                        Ouganda

Zambia                      57.8           ...     65.9       60.5          18.4         ...       22.7     23.2                          Zambie

Zimbabwe                    37.0         38.6        ...      38.2          24.7       22.3          ...      ...                       Zimbabwe


Africa                     39.3         36.3       38.1         ...        21.2       24.4        23.4        ...                        Afrique


                                                                       African Statistical Yearbook 2011 / Annuaire Statistique pour l'Afrique 2011
HEALTH - SANTE

                                                          1-8. Primary health care - Soins de santé primaire

                                                                                Immunization / Vaccination (%)
                                         Access to safe water                            Diphtheria
                                                                   Tuberculosis -                              Measles -
                                            - Accès à l'eau                               (DPT3) -
           PERCENTAGE                                               Tuberculose                                Rougeole                      POURCENTAGE
                                                potable                                   Diphtérie

                                                                                                                                                      Pays
           Country                            1990       2008        1990      2009      1990      2009        1990    2009
           Algeria                               94         83          99          99        89      93         83        88                        Algérie
           Angola                                36         50          48          83        24      73         38        77                        Angola
           Benin                                 56         75          92          99        74      83         79        72                         Bénin
           Botswana                              93         95          93          99        92      96         87        94                     Botswana
           Burkina Faso                          41         76          95          92        66      82         79        75                  Burkina Faso
           Burundi                               70         72          97          98        86      92         74        91                       Burundi
           Cameroon                              50         74          76          90        48      80         56        74                    Cameroun
           Cape Verde                             ...       84          97          99        88      99         79        96                      Cap-Vert
           Central African Republic              58         67          96          74        82      54         82        62      République Centrafricaine
           Chad                                  38         50          59          40        20      23         32        23                         Tchad
           Comoros                               87         95          99          80        94      83         87        79                      Comores
           Congo                                  ...       71          90          90        79      91         75        76                        Congo
           Congo, Dem. Republic                   ...       46          65          80        35      77         38        76   Rép. Démocratique du Congo
           Côte d'Ivoire                         76         80          62          95        54      81         56        67                  Côte d'Ivoire
           Djibouti                              77         92          81          90        85      89         85        73                       Djibouti
           Egypt                                 90         99          89          98        87      97         86        95                        Egypte
           Equatorial Guinea                      ...        …          94          73        77      33         88        51            Guinée Equatoriale
           Eritrea                               43         61                      99        …       99         …         95
           Ethiopia                              17         38          64          76        49      79         38        75                       Ethiopie
           Gabon                                  ...       87          96          89        78      45         76        55                        Gabon
           Gambia                                74         92          98          94        92      98         86        96                       Gambie
           Ghana                                 54         82          71          99        58      94         61        93                        Ghana
           Guinea                                52         71          50          81        17      57         35        51                        Guinée
           Guinea-Bissau                          ...       61          90          89        61      68         53        76                Guinée-Bissau
           Kenya                                 43         59          92          75        84      75         78        74                        Kenya
           Lesotho                               61         85          89          96        82      83         80        85                       Lesotho
           Liberia                               58         68                      80                64                   64                        Libéria
           Libyan Arab Jamahiriya                54          …          90          99        84      98         89        98     Jamahiriya Arabe Libyenne
38
           Madagascar                            31         41          67          73        46      78         47        64                   Madagascar
           Malawi                                40         80          97          95        87      93         81        92                        Malawi
           Mali                                  29         56          82          86        42      74         43        71                           Mali
           Mauritania                            30         49          79          81        33      64         38        59                     Mauritanie
           Mauritius                             99         99          87          95        85      99         76        99                       Maurice
           Morocco                               74         81          96          99        81      99         79        98                         Maroc
           Mozambique                            36         47          59          87        46      76         59        77                  Mozambique
           Namibia                               64         92                      85        …       83         …         76                       Namibie
           Niger                                 35         48          50          78        22      70         25        73                         Niger
           Nigeria                               47         58          80          53        56      42         54        41                        Nigéria
           Rwanda                                68         65          92          93        84      97         83        92                       Rwanda
           Sao Tome and Principe                  ...       89          99          99        92      98         71        90          Sao Tomé-et-Principe
           Senegal                               61         69          90          97        51      86         51        79                       Sénégal
           Seychelles                             ...        …          98          96        99      99         86        97                    Seychelles
           Sierra Leone                           ...       49          …           95        …       75         …         71                  Sierra Leone
           Somalia                                ...       30          31          29        19      31         30        24                       Somalie
           South Africa                          83         91          57          81        72      69         79        62                Afrique du Sud
           Sudan                                 65         57          77          82        62      84         57        82                       Soudan
           Swaziland                              ...       69          96          99        89      95         85        95                     Swaziland
           Tanzania                              55         54          85          93        78      85         80        91                      Tanzanie
           Togo                                  49         60          99          91        77      89         73        84                          Togo
           Tunisia                               81         94          96          98        93      99         93        98                        Tunisie
           Uganda                                43         67          75          90        45      64         52        68                      Ouganda
           Zambia                                49         60          97          92        91      81         90        85                       Zambie
           Zimbabwe                              78         82          91          91        88      73         87        76                     Zimbabwe


           Africa                                56         65          77          80      61        73         61        71                       Afrique


     African Statistical Yearbook 2011 / Annuaire Statistique pour l'Afrique 2011
39


African Statistical Yearbook 2011 / Annuaire Statistique pour l'Afrique 2011
2
40


     Section

                                                                Economic Statistics
                                                          Statistiques économiques


       African Statistical Yearbook 2011 / Annuaire Statistique pour l'Afrique 2011
2011
Africa: Macroeconomic                                                                                         Afrique : Tendances
Trends in 2010                                                                                                macroéconomiques en 2010


Following the world economic recovery, although timid                                                         Avec la reprise de l'économie mondiale, pourtant timide
in the advanced countries but particularly robust in the                                                      dans les pays avancés mais particulièrement robuste dans
emerging economies, Africa achieved average growth of                                                         les économies émergentes, l’Afrique a affiché un taux de
4.9% in 2010 compared with only 3.1% in 2009. The lower                                                       croissance moyen de 4.9% en 2010 comparé à seulement
growth in 2009 had been caused by the global recession                                                        3.1% de 2009. Cette croissance plus faible de 2009 avait
during which Africa has, however, shown a high degree of                                                      été influencée par la récession économique mondiale, une
resilience. Africa´s economic recovery, which got under-                                                      phase durant laquelle l’Afrique a néanmoins montré un
way around mid-2009, strengthened during the course of                                                        degré élevé de résilience. Le rétablissement économique
the year 2010, in line with the upturn of the international                                                   en Afrique, qui a commencé vers le milieu de 2009, s'est
trade and the rebound of commodity prices.                                                                    consolidé pendant l’année 2010, en lien avec la reprise
                                                                                                              du commerce international et le rebond des cours de
                                                                                                              matières premières.
                           Graph 1 : Countries growth in 2009/2010

                                       12.0                                                                                             Graphique 1 : Croissance par pays en 2009/2010

                                          9.0
                                                                                                                                                             12.0

                                          6.0
  Growth in 2010


                                                                                                                                                              9.0
                                                                                                                 Croissance en 2010


                                          3.0                                                                                                                 6.0

                                          0.0
                                                                                                                                                              3.0
                   -6.0         -3.0             0.0           3.0            6.0          9.0         12.0
                                          -3.0
                                                                                                                                                              0.0
                                                                                                                                      -6.0         -3.0             0.0          3.0           6.0          9.0         12.0
                                          -6.0
                                                                                                                                                             -3.0
                                                       Growth in 2009                                                                                                                                                          41
                                                                                                                                                             -6.0
                                                                                                                                                                          Croissance en 2009
In most countries growth was higher in 2010 than in 2009
and only in a few it was lower (points under the 45° line in
Graph 1). Furthermore, no country registered a contrac-                                                       Dans la plupart des pays, la croissance en 2010 a été
tion of its output 2010 compared to nine cases in 2009.                                                       plus élevée qu’en 2009 et n'a été plus faible que pour
In addition, the main regions of the continent achieved                                                       peu de pays (les points au dessous de la ligne à 45° dans
growth rates, close to their trend levels recorded dur-                                                       le graphique 1). En outre, aucun pays n’a enregistré une
ing the decade 2000. The only exception was Southern                                                          contraction de son activité en 2010 contre neuf cas en
Africa, where growth in 2010 remained below the earlier                                                       2009. En plus, les principales régions du continent ont
trend (see Graph 2). This region had been most affected                                                       réalisé des taux de croissance proches de leurs niveaux
by the global recession and had experienced slightly                                                          tendanciels enregistrés durant la décennie 2000. A l’ex-
negative growth in 2009. A major tendency was also                                                            ception de l’Afrique australe, où la croissance de 2010 est
confirmed in 2010, namely the increasingly homogeneous                                                        demeurée plutôt au-dessous de sa tendance de moyen

10.0                        Graph 2. Africa - Real GDP growth (in %)                                          10.0                     Graphique 2. Afrique - Croissance du PIB réel (en %)
                          in 2010                                                                                                            en 2010
                          average over 2000-2009                                                                                             moyenne sur 2000-2009
                                                       6.6                                       6.7                                                                      6.6                                     6.7
 7.5                                                                                                           7.5
                      5.2           4.9                                                                                                  5.2           5.0
                                                                     4.5            4.7                                                                                                4.6           4.7
 5.0                                                                                                           5.0


                                                       6.2                                       6.7                                                                      6.2                                     6.2
 2.5                  4.9           4.7                               4.6                                      2.5                       4.8           4.4                             4.7
                                                                                    3.3                                                                                                              3.4

 0.0                                                                                                           0.0
                    AFRICA         Central       East Africa         North      Southern    West Africa                               AFRIQUE        Afrique        Afrique de    Afrique du     Afrique      Afrique de
                                   Africa                            Africa      Africa                                                              Centrale          l'Est        Nord         Australe      l'Ouest


                                                                                                              African Statistical Yearbook 2011 / Annuaire Statistique pour l'Afrique 2011
Africa: Macroeconomic                                                                      Afrique : Tendances
           Trends in 2010                                                                             macroéconomiques en 2010


           character of growth between countries, as illustrated by                                   terme (voir graphique 2). Cette région avait été la plus
           the dispersion of countries real GDP growth rates, which                                   affectée par la récession mondiale et avait enregistré une
           has declined significantly during the second half of the                                   croissance légèrement négative en 2009. Une tendance
           decade. In contrast, the pace of the recovery in 2010                                      majeure a été également confirmée en 2010, à savoir le
           differed across countries and regions. The South African                                   caractère de plus en plus homogène de la croissance
           economy recovered in 2010 with growth of 2.8%, after                                       entre les pays, comme illustré par la dispersion de taux de
           negative growth of 1.7% in 2009 caused by the repercus-                                    croissance du PIB réel par pays, qui a diminué de manière
           sions of the global recession. South Africa´s recovery                                     significative pendant la deuxième moitié de la décennie.
           contributed to the rebound of the Southern Africa region,
           which grew by 3.3% in 2010 after having contracted 0.5%                                    En revanche, le rythme de la reprise en 2010 a été variable
           in 2009. Elsewhere, in particular in the West Africa and                                   selon les pays et les régions. L’économie sud-africaine
           East Africa regions, growth showed stable momentum,                                        s'est rétablie en 2010 avec une croissance à 2.8%, après
           thanks to the good economic performances in countries                                      un taux négatif de 1.7% en 2009 suite aux répercussions
           such as Ghana (5.9%), Burkina-Faso (5.7%) and Kenya (5.0%).                                de la récession mondiale. Le redressement de l'activité
                                                                                                      en Afrique du Sud a contribué au rebond de la région
           On the whole, Africa´s growth in 2010 was driven by a                                      d’Afrique australe, dont la production a crû de 3.3% en
           strengthening of domestic demand, due to higher con-                                       2010 après une contraction de 0.5% en 2009. Ailleurs,
           sumption and the recovery of investment, whose ratio                                       en particulier dans les régions d'Afrique de l’Ouest et
           to GDP remained stable around 25%. Exports volumes                                         d’Afrique de l’Est, la croissance s’est maintenue à un
           increased by 1.6% after a contraction of 5.6% in 2009,                                     rythme stable, grâce aux bonnes performances écono-
           with stronger growth, in particular towards the emerging                                   miques dans des pays tels que le Ghana (5.9%), le Burkina-
           economies of Asia.                                                                         Faso (5.7%) et le Kenya (5.0%).

           Overall, Africa´s economic performance has clearly im-                                     Dans l’ensemble, la croissance de 2010 en Afrique a été
           proved in 2010: a more balanced and stronger growth,                                       soutenue par la vigueur de la demande intérieure, repo-
42
                         Graph 4. Real GDP Growth Rate / Real Per Capita GDP Growth                                      Graphique 4. Taux de croissance réel du PIB et taux de
                                                   Rate                                                                           croissance du PIB réel par habitant
                                                    (%)                                                                                           (%)
                                                                                                      12.0
           15.0
                                                                                                       9.0
           12.0
                                                                                                       6.0
            9.0

            6.0                                                                                        3.0

            3.0                                                                                        0.0
                  2002     2003      2004         2005    2006   2007     2008         2009   2010           2002      2003      2004       2005       2006      2007    2008       2009       2010


                                                                                                                       Afrique: Taux de croissance réel du PIB            Afrique: Inflation
                           Africa: Real GDP Growth Rate            Africa: Inflation


                                Graph 5. Fiscal Balance / Current Account Balance                                      Graphique 5. Solde budgétaire et Solde du compte courant
                                                    (% of GDP)                                                                                (% du PIB)


            9.0                                                                                       9.0

            6.0                                                                                       6.0

            3.0                                                                                       3.0
            0.0                                                                                       0.0
           -3.0                                                                                       -3.0
           -6.0                                                                                       -6.0
                    2002      2003      2004       2005   2006   2007     2008         2009   2010              2002      2003      2004        2005    2006     2007    2008       2009       2010


                         Africa: Fiscal Balance                     Africa: Current Account Balance                 Afrique: Solde budgétaire                       Afrique: Solde du compte courant


     African Statistical Yearbook 2011 / Annuaire Statistique pour l'Afrique 2011
2011
Africa: Macroeconomic                                                                  Afrique : Tendances
Trends in 2010                                                                         macroéconomiques en 2010


          Graph 6. Africa - Inflation ( %)                                                    Graphique 4. Afrique - Inflation (en %)
                                                                                                        6.
15.0                                                                                   15.0


12.0                                                                                   12.0


 9.0                                                                                    9.0


 6.0                                                                                    6.0


 3.0                                                                                    3.0
   2000    2001    2002     2003     2004    2005   2006   2007   2008   2009   2010      2000     2001    2002    2003    2004    2005   2006   2007   2008   2009   2010


an improvement of the fiscal balance with the deficit de-                              sant sur une consommation finale robuste et une dyna-
clining from 5.2% of GDP in 2009 to 3.3%, an improvement                               mique favorable de l’investissement, dont le rapport au
in the current account balance which moves to positive                                 PIB est demeuré stable autour de 25%. Les exportations
territory at 0.4% of GDP after – 1.6% in 2009 and a more                               en volume ont augmenté de 1.6% après une contraction de
moderate inflation rate (see graph 3). Despite the rebound                             5.6% de 2009, moyennant, en particulier, une croissance
in food and fuel prices, inflation was more subdued dur-                               davantage plus forte des flux orientés vers les économies
ing 2010 in the majority of the African countries, with                                émergentes d’Asie.
only 19 countries recording a higher inflation than in the
previous year. Africa´s median inflation rate declined to                              De manière générale, la situation économique de l’Afrique
4.8% in 2010 from 7.2% in 2009 and the aggregate infla-                                s’est clairement améliorée en 2010 : une croissance plus
tion rate declined to 7.7% down from 10% in 2009 (Graph                                équilibrée et plus forte, une amélioration du solde budgé-
4). Inflation receded in all the regions, except for West                              taire avec un déficit diminuant de 5.2% du PIB en 2009 à                              43
Africa, where the aggregate inflation rate of the region                               3.3% en 2010, une amélioration du solde du compte cou-
increased marginally by 0.1 percentage points to 10.4%.                                rant qui passe en territoire positif à 0.4% du PIB en 2010
The moderation of inflation allowed the monetary policy                                après – 1.6% en 2009 et un taux d’inflation plus modéré
to remain on the whole accommodating, as in South Af-                                  (voir graphique 3). En dépit du rebond des prix des pro-
rica where authorities lowered its policy interest rate to                             duits alimentaires et de l'énergie, l’inflation a été plutôt
further support economic activity.                                                     maîtrisée pendant 2010 dans la plupart des pays africains,
                                                                                       avec seulement 19 pays enregistrant une inflation plus
                                                                                       élevée qu’une année auparavant. Le taux d’inflation
                                                                                       médian pour l’Afrique s'est replié à 4.8% en 2010 contre
                                                                                       7.2% en 2009, et le taux d’inflation global a diminué à 7.7%
                                                                                       contre 10% en 2009 (graphique 4). L’inflation a reculé dans
                                                                                       toutes régions, excepté en Afrique de l’Ouest, où le taux
                                                                                       d’inflation de la région a augmenté marginalement de 0.1
                                                                                       point de pourcentage à 10.4%. La modération de l’inflation
                                                                                       a permis à la politique monétaire d'être dans l'ensemble
                                                                                       plutôt accommodante, comme en Afrique du Sud où les
                                                                                       autorités ont abaissé le taux d’intérêt directeur pour
                                                                                       soutenir davantage l’activité économique.


                                                                                       African Statistical Yearbook 2011 / Annuaire Statistique pour l'Afrique 2011
NATIONAL ACCOUNTS - COMPTES NATIONAUX

                                                   2-1. GDP at Current market prices - PIB aux prix du marche (courant)
        Million US Dollars                                                                                                                            Millions de dollars EU

        Country                          2002       2003       2004         2005      2006        2007        2008        2009      2010                              Pays

        Algeria                          56 760     67 864     85 333      103 198   117 209     135 119     171 393     137 892        ...                           Algérie

        Angola                           11 432     13 956     19 775       30 629    45 163      59 263      84 945      69 696        ...                           Angola

        Benin                             2 808      3 557      4 051        4 358     4 705       5 511       6 643       6 907     7 349                             Bénin

        Botswana                          6 092      8 087     10 048       10 256    11 256      12 377      13 473      11 474    14 853                         Botswana

        Burkina Faso                      3 206      4 206      4 839        5 463     5 816       6 756       8 174       8 133        ...                     Burkina Faso

        Burundi                              ...        ...        ...       1 073     1 217       1 284       1 242       1 251        ...                          Burundi

        Cameroon                         10 880     13 622     15 775       16 588    17 953      20 432      23 322      23 381        ...                       Cameroun

        Cape Verde                         621         814        924         972      1 108       1 331       1 539       1 575     1 870                          Cap-Vert

        Central African Republic           991       1 139      1 270        1 350     1 473       1 697       1 986       2 012        ...         République Centrafricaine

        Chad                              1 988      2 722      3 279        5 879     6 557       7 215       8 504       6 895     8 188                            Tchad

        Comoros                            247         318        368         380        406        462         520         520       525                           Comores

        Congo                             3 020      3 496      4 649        6 087     7 731       7 436       9 905       7 960        ...                           Congo

        Côte d'Ivoire                    12 347     15 307     16 554       17 085    17 801      20 342      24 055      23 899        ...                     Côte d'Ivoire

        Democratic Republic of Congo      5 544      5 670      6 533       11 964    14 297      16 209      18 990      17 555        ... République Démocratique du Congo

        Djibouti                           577         596        628         666        709        769         848         983      1 049                           Djibouti

        Egypt                            84 828     71 357     78 322       93 185   107 741     132 164     164 841     187 986   215 162                            Egypte

        Equatorial Guinea                 2 087      2 754      4 774        7 206     8 553      10 841      15 949      10 127    12 419                Guinée équatoriale

        Eritrea                            729         870      1 109        1 098     1 211       1 318       1 380       1 873        ...                         Erythrée

        Ethiopia                          7 768      8 539     10 035       12 286    15 134      19 182      25 897      28 476    30 201                          Ethiopie

        Gabon                             4 932      6 055      7 178        8 666     9 546      11 430      14 413      10 866        ...                           Gabon

        Gambia                             578         509        579         628        666        826        1 035        931         ...                          Gambie

        Ghana                             6 166      7 633      8 881       10 732    20 410      24 758      28 528      26 169    31 438                            Ghana

        Guinea                            2 950      3 446      3 666        2 937     2 821       4 209       3 778       4 459     5 029                           Guinée

        Guinea-Bissau                      407         465        523         573        579        691         843         837       848                     Guinée-Bissau

        Kenya                            13 103     14 904     16 095       18 739    22 504      27 167      30 031      29 394        ...                           Kenya

        Lesotho                            657         969      1 235        1 355     1 415       1 581       1 601       1 720     2 100                           Lesotho

        Liberia                            519         404        467         511        671        653         830         856         ...                           Libéria

        Libyan Arab Jamahiriya           21 913     26 236     33 293       45 452    55 077      62 668      81 376      58 762        ...        Jamahiriya Arabe Libyenne

        Madagascar                        4 397      5 474      4 364        5 039     5 515       7 343       9 424       8 590        ...                     Madagascar

        Malawi                            2 665      2 425      2 625        2 545     2 330       3 552       4 074       4 728        ...                           Malawi
44      Mali                              3 189      4 222      4 982        5 486     6 123       7 145       8 738       8 964     9 228                              Mali

        Mauritania                        1 145      1 281      1 441        2 191     3 157       3 537       3 589       3 024        ...                       Mauritanie

        Mauritius                         4 756      5 641      6 386        6 284     6 507       7 521       9 296       8 586     9 445                           Maurice

        Morocco                          40 442     49 757     56 947       59 464    65 640      75 223      88 879      91 374    93 569                            Maroc

        Mozambique                        4 201      4 666      5 698        6 579     7 096       8 036       9 891       9 674        ...                     Mozambique

        Namibia                           3 361      4 931      6 607        7 261     7 979       8 815       8 958       9 183        ...                         Namibie

        Niger                             2 145      2 640      2 897        3 370     3 647       4 291       5 369       5 244        ...                            Niger

        Nigeria                          59 117     67 656     87 845      112 249   145 428     166 451     208 065     169 408        ...                           Nigéria

        Rwanda                            1 677      1 847      2 088        2 581     3 109       3 741       4 716       5 265     5 632                          Rwanda

        Sao Tome and Principe               85         102        111         124        136        147         181         209         ...             Sao Tomé-et-Principe

        Senegal                           5 334      6 860      8 031        8 708     9 359      11 285      13 287      12 756        ...                         Sénégal

        Seychelles                         736         740        864         928      1 015       1 018        921         788       890                         Seychelles

        Sierra Leone                      1 311      1 426      1 418        1 491     1 646       1 951       2 193       2 177        ...                     Sierra Leone

        Somalia                           1 219      1 517      1 984        2 316     2 390       2 483       2 600       2 012        ...                          Somalie

        South Africa                    111 101    168 219    219 093      247 051   261 007     286 169     275 279     282 755   363 111                    Afrique du Sud

        Sudan                            18 137     21 355     26 646       35 183    45 460      56 554      61 118      65 794        ...                          Soudan

        Swaziland                         1 224      1 854      2 421        2 584     2 948       3 054       3 020       3 161        ...                        Swaziland

        Tanzania, United Republic of     10 806     11 659     12 826       14 142    14 331      16 825      20 715      21 368        ...     Tanzanie, République Unie de

        Togo                              1 472      1 674      1 937        2 110     2 219       2 531       3 168       3 156     3 162                             Togo

        Tunisia                          23 142     27 454     31 184       32 272    34 377      38 910      44 815      43 529    44 561                           Tunisie

        Uganda                            6 670      7 050      8 436       10 040    11 011      13 549      16 378      16 828        ...                        Ouganda

        Zambia                            3 711      4 342      5 439        7 179    10 702      11 541      14 705      12 748        ...                          Zambie

        Zimbabwe                          6 203      6 199      6 206        6 073     6 101       5 660       5 218       5 837     6 384                        Zimbabwe


        Africa                         581 395     696 483    848 660    1 002 564 1 158 960   1 341 024   1 570 639   1 479 747        ...                         Afrique


     African Statistical Yearbook 2011 / Annuaire Statistique pour l'Afrique 2011
NATIONAL ACCOUNTS - COMPTES NATIONAUX

                                                 2-2. GDP growth rates - Taux de croissance du
PERCENTAGE                                                                                                                              POURCENTAGE

Country                        2002     2003        2004      2005     2006     2007     2008      2009      2010                                 Pays

Algeria                          4.7      6.9         5.1       5.1      2.0       3.0      2.4       2.4        ...                              Algérie

Angola                          14.5      3.3        11.2      20.6     18.6      20.3     13.2      -0.4        ...                              Angola

Benin                            4.4      3.9         3.1       2.9      3.8       4.6      5.3       6.7       9.2                                Bénin

Botswana                         9.0      6.3         6.0       1.6      5.1       4.8      2.9      -4.9       7.2                            Botswana

Burkina Faso                     4.4      7.8         4.5       8.7      6.3       4.1      2.6       3.1        ...                        Burkina Faso

Burundi                           ...      ...          ...      ...     5.4       3.8      7.5       3.2        ...                             Burundi

Cameroon                         4.0      4.0         3.7       2.3      3.2       3.3      2.9       1.9        ...                          Cameroun

Cape Verde                       5.3      4.7         4.3       6.5     10.1       8.6      6.2       3.6       5.3                             Cap-Vert

Central African Republic        -0.6     -7.1         2.7       2.4      3.8       3.7      2.2      -0.4        ...            République Centrafricaine

Chad                             8.5     14.3        33.7       8.6      0.8       2.6      -1.8     -1.1       6.1                               Tchad

Comoros                          2.3      2.1         1.9       2.8      2.6       5.2      0.6      -3.4       1.8                            Comores

Congo                            4.6      0.8         3.7       7.6      6.2      -1.6      6.4       6.8        ...                              Congo

Côte d'Ivoire                   -1.7     -1.4         1.2       1.7      1.5       1.8      2.5       3.5        ...                        Côte d'Ivoire

Democratic Republic of Congo     3.5      5.4         7.3       6.1      5.3       6.3      6.2       2.8        ...   République Démocratique du Congo

Djibouti                         2.6      3.2         3.0       3.2     12.7       5.0      5.0       5.5        ...                             Djibouti

Egypt                           18.3      3.2         4.1       4.5      6.8      63.9      7.3       4.9       4.8                               Egypte

Equatorial Guinea               20.4     14.4        32.6       8.9      5.6      24.0     15.5       4.6       1.3                   Guinée équatoriale

Eritrea                          3.0     -2.7         1.5       2.6     -1.0       1.4      -9.8      3.6        ...                            Erythrée

Ethiopia                         1.5     -2.2        13.6      11.8     10.8      11.5     10.8       8.8      12.4                              Ethiopie

Gabon                           -0.3      2.5         1.4       3.0      1.2       5.6      2.3      -1.4        ...                              Gabon

Gambia                           0.5      2.3         -0.6      0.3      3.4       6.0      6.3       5.0        ...                             Gambie

Ghana                            4.5      5.2         5.6       5.9      6.4       6.5      8.4       4.7       6.6                               Ghana

Guinea                           5.2      1.2         2.3       3.0      2.5       1.8      4.9      -0.3       1.9                              Guinée

Guinea-Bissau                   -1.3      0.4         2.8       4.3      2.1       3.2      3.2       3.0       3.5                       Guinée-Bissau

Kenya                            0.5      2.9         5.1       5.9      6.3       7.1      1.7       2.5       5.4                               Kenya

Lesotho                          0.5      4.7         2.3       2.4      4.7       4.5      4.7       3.0       2.0                              Lesotho

Liberia                          3.7    -31.3         2.6       5.3      7.8       9.4      7.1       4.6        ...                              Libéria

Libyan Arab Jamahiriya          -1.3     13.0         4.4      10.3      6.7       5.1      2.7      -0.7        ...          Jamahiriya Arabe Libyenne

Madagascar                     -12.7      9.8         5.3       4.6      5.0       6.2      7.1      -3.7        ...                        Madagascar

Malawi                           2.9      5.7         5.4       3.3     15.2       3.3      9.0        ...       ...                              Malawi

Mali                             4.3      7.6         2.3       6.1      5.3       4.3      5.0       4.5       4.5                                 Mali
                                                                                                                                                            45
Mauritania                       1.1      5.6         6.7       3.9     11.4       1.0      3.7      -1.1        ...                          Mauritanie

Mauritius                        1.9      4.3         5.8       1.2      3.9       5.5      4.6       2.1       3.9                              Maurice

Morocco                          3.3      6.3         4.8       3.0      7.8       2.7      5.6       4.9       3.1                               Maroc

Mozambique                       9.2      6.5         7.9       8.4      8.7       7.3      6.8       6.3       6.6                         Mozambique

Namibia                          4.8      4.2        12.3       2.5      7.1       5.4      4.3      -0.7        ...                            Namibie

Niger                            5.3      3.4         -0.8      7.4      5.8       3.4      9.3      -0.9        ...                               Niger

Nigeria                         21.2     10.3        10.6       5.4      6.2       7.0      6.0       6.7       7.5                              Nigéria

Rwanda                          13.3      2.1         7.4       9.4      8.8       7.8     11.7       6.0       7.4                             Rwanda

Sao Tome and Principe            3.6      5.8         4.3       3.5     11.4       5.0      6.5        ...       ...               Sao Tomé-et-Principe

Senegal                          0.7      6.7         5.9       5.6      2.5       4.9      3.2       2.2       4.2                             Sénégal

Seychelles                       1.2     -5.9         -2.8      6.7      9.5       9.6      -1.3      0.7        ...                          Seychelles

Sierra Leone                    18.2     10.9         9.6       7.5      7.4       6.4      4.4       4.5       5.2                         Sierra Leone

Somalia                          3.5      3.5         3.0       3.0      2.4       2.6      2.6       2.6        ...                             Somalie

South Africa                     3.7      2.9         4.6       5.3      5.6       5.6      3.6      -1.7       2.8                       Afrique du Sud

Sudan                            6.0      6.3         5.1       6.1      9.4       8.1      7.8       6.1        ...                             Soudan

Swaziland                        1.8      2.2         2.9       2.5      3.3       3.5      2.4       1.2        ...                           Swaziland

Tanzania, United Republic of     7.2      6.9         7.8       7.4      6.7       7.1      7.4       6.0        ...       Tanzanie, République Unie de

Togo                            -1.3      4.8         2.5       1.2      3.9       2.1      2.4       3.2       3.4                                Togo

Tunisia                          1.7      5.5         6.0       4.0      5.7       6.3      4.5       3.1       3.7                              Tunisie

Uganda                           7.1      6.2         5.8      10.0      7.0       8.1     10.4       5.3        ...                           Ouganda

Zambia                           3.3      5.1         5.4       5.3      6.2       6.2      5.7       6.3        ...                             Zambie

Zimbabwe                        -5.9     -7.4         -3.6     -4.0     -3.6      -3.3      -9.9       ...       ...                          Zimbabwe


Africa                                                                                                                                          Afrique


                                                                           African Statistical Yearbook 2011 / Annuaire Statistique pour l'Afrique 2011
NATIONAL ACCOUNTS - COMPTES NATIONAUX

                                                                 2-3. Per Capita GDP - PIB par habitant


              DOLLARS EU                                                                                                                       DOLLARS EU

              Country                         2002      2003     2004      2005     2006     2007     2008     2009     2010                            Pays

              Algeria                          1 807    2 128     2 636     3 141    3 514    3 991    4 986    3 952       ...                        Algérie

              Angola                            754       892     1 226     1 843    2 643    3 376    4 714    3 768       ...                        Angola

              Benin                             395       483      532       554      579      657      767      773      798                            Bénin

              Botswana                         3 438    4 509     5 535     5 577    6 036    6 540    7 013    5 885    7 511                      Botswana

              Burkina Faso                      258       327      364       397      409      459      537      516        ...                  Burkina Faso

              Burundi                             ...      ...       ...     145      160      164      154      151        ...                        Burundi

              Cameroon                          654       800      906       931      984     1 095    1 222    1 198       ...                     Cameroun

              Cape Verde                       1 366    1 760     1 967     2 036    2 286    2 707    3 087    3 115    3 647                       Cap-Vert

              Central African Republic          255       288      315       329      353      399      458      455        ...      République Centrafricaine

              Chad                              220       291      338       587      635      679      779      615      712                           Tchad

              Comoros                           428       539      611       617      644      716      788      769      759                        Comores

              Congo                             950     1 072     1 391     1 782    2 218    2 094    2 740    2 161       ...                         Congo

              Côte d'Ivoire                     683       829      879       888      905     1 011    1 168    1 134       ...   Rép. Démocratique du Congo

              Democratic Republic of Congo      103       102      114       203      235      259      296      266        ...                   Côte d'Ivoire

              Djibouti                          757       767      794       828      865      921      998     1 137    1 194                         Djibouti

              Egypt                            1 164      960     1 034     1 208    1 371    1 651    2 022    2 265    2 547                         Egypte

              Equatorial Guinea                3 723    4 778     8 059    11 835   13 675   16 881   24 195   14 975   17 911             Guinée Equatoriale

              Eritrea                           184       210      258       246      262      276      280      369        ...                       Erythrée

              Ethiopia                          112       120      138       165      197      244      321      344      355                         Ethiopie

              Gabon                            3 826    4 601     5 346     6 329    6 840    8 039    9 953    7 369       ...                         Gabon

              Gambia                            416       354      391       411      424      512      624      546        ...                       Gambie

              Ghana                              30        36       41        49       91      108      122      110      129                           Ghana

              Guinea                            339       389      406       319      300      438      384      443      487                          Guinée

              Guinea-Bissau                     297       332      363       389      384      448      535      519      515                  Guinée-Bissau

              Kenya                             396       438      461       523      612      720      775      739        ...                         Kenya

              Lesotho                           339       495      625       679      703      778      781      832     1 007                        Lesotho

              Liberia                           170       129      145       153      193      180      219      216        ...                         Libéria

              Libyan Arab Jamahiriya           3 934    4 615     5 737     7 674    9 111   10 159   12 929    9 153       ...     Jamahiriya Arabe Libyenne

              Madagascar                        272       329      255       286      305      395      493      438        ...                   Madagascar
46            Malawi                            212       188      198       186      166      246      274      310        ...                        Malawi

              Mali                              290       374      431       464      505      576      688      689      693                             Mali

              Mauritania                        416       452      495       734     1 031    1 127    1 116     919        ...                     Mauritanie

              Mauritius                        3 901    4 583     5 142     5 018    5 156    5 917    7 264    6 665    7 285                        Maurice

              Morocco                          1 371    1 669     1 889     1 950    2 128    2 409    2 812    2 856    2 890                          Maroc

              Mozambique                        218       236      281       316      332      367      442      423        ...                  Mozambique

              Namibia                          1 771    2 549     3 352     3 614    3 895    4 220    4 206    4 230       ...                       Namibie

              Niger                             182       216      229       257      268      303      365      343        ...                          Niger

              Nigeria                           451       504      639       797     1 008    1 127    1 376    1 095       ...                        Nigéria

              Rwanda                            196       213      237       287      338      396      485      527      548                         Rwanda

              Sao Tome and Principe             587       688      740       815      875      934     1 132    1 282       ...          Sao Tomé-et-Principe

              Senegal                           511       641      731       772      808      949     1 088    1 018       ...                       Sénégal

              Seychelles                       8 976    8 999    10 490    11 232   12 228   12 213   10 986    9 354   10 524                     Seychelles

              Sierra Leone                      289       301      288       292      312      360      394      382        ...                  Sierra Leone

              Somalia                           157       190      243       277      280      284      291      220        ...                       Somalie

              South Africa                     2 405    3 591     4 615     5 139    5 366    5 820    5 542    5 643    7 191                 Afrique du Sud

              Sudan                              50        57       70        91      115      140      148      156        ...                        Soudan

              Swaziland                        1 112    1 673     2 171     2 298    2 593    2 652    2 586    2 668       ...                     Swaziland

              Tanzania, United Republic of      301       316      338       363      357      408      488      489        ...                      Tanzanie

              Togo                              265       294      331       352      361      402      490      477      466                            Togo

              Tunisia                          2 405    2 829     3 185     3 267    3 448    3 864    4 407    4 238    4 295                         Tunisie

              Uganda                            256       262      304       350      371      442      517      514        ...                      Ouganda

              Zambia                            338       387      474       612      890      937     1 165     985        ...                        Zambie

              Zimbabwe                          496       496      497       487      490      455      419      466      505                       Zimbabwe


              Africa                          1 047     1 236    1 505     1 700    1 892    2 122    2 491    2 078        ...                       Afrique


     African Statistical Yearbook 2011 / Annuaire Statistique pour l'Afrique 2011
NATIONAL ACCOUNTS - COMPTES NATIONAUX

                           2-4. Structure of Output (at current market prices) - Structure du PIB (aux prix courants du marché)


Share of GDP (%)                        Agriculture           Industry           Manufacturing           Services                         Part du PIB (%)


Country                                 2002     2009        2002        2009     2002     2009        2002         2009                              Pays

Algeria                                  10.1         10.0    53.7        51.3      6.7          5.0     36.3        38.7                            Algérie

Angola                                    7.9          8.6    69.0        70.9      3.7          0.9     23.0        20.5                            Angola

Benin                                    37.4         35.9    15.0        14.5      9.4          8.3     47.6        49.6                             Bénin

Botswana                                  2.1          3.3    56.8        42.5      3.9          4.5     41.1        54.2                         Botswana

Burkina Faso                             38.6         35.2    17.5        23.8     11.1      12.2        43.9        41.0                      Burkina Faso

Burundi                                  47.2         47.0    17.0        15.0     11.3      10.1        35.8        38.0                           Burundi

Cameroon                                 22.1         23.5    32.0        29.9     20.6      16.2        45.8        46.6                        Cameroun

Cape Verde                               11.6          8.2    16.5        17.8      5.0          3.4     71.8        74.1                          Cap-Vert

Central African Republic                 53.6         53.5    14.0        13.9      6.2          6.3     32.4        32.6          République Centrafricaine

Chad                                     35.8         20.5    18.5        45.6      9.4          6.2     45.7        33.9                            Tchad

Comoros                                  41.1         43.9    11.8        10.8      4.2          3.8     47.1        45.3                         Comores

Congo                                     6.5          5.4    65.6        67.6      5.5          5.4     28.0        26.9                            Congo

Côte d'Ivoire                            30.1         26.0    23.3        25.6     16.8      17.8        46.6        48.4                      Côte d'Ivoire

Democratic Republic of Congo             51.0         16.6    21.5        30.0      5.4      21.8        27.5        53.4 République Démocratique du Congo

Djibouti                                  3.5          3.9    15.5        19.7      2.6          2.3     81.0        76.4                           Djibouti

Egypt                                    16.5         13.7    34.8        37.6     19.8      16.6        48.7        48.7                            Egypte

Equatorial Guinea                        88.0         66.1     7.7        30.0      0.1          0.2      4.3         3.8                Guinée équatoriale

Eritrea                                  11.7         24.2    24.8        18.9     11.7          5.8     63.5        56.9                          Erythrée

Ethiopia                                 43.5         50.8    13.9        10.4      5.7          3.7     42.6        38.8                           Ethiopie

Gabon                                     6.5          5.8    55.6        56.5      5.7          4.8     37.9        37.7                            Gabon

Gambia                                   24.0         28.8    15.7        12.9      7.0          5.7     62.6        58.3                           Gambie

Ghana                                    39.2         31.7    28.2        18.9     10.1          6.9     32.6        49.5                            Ghana

Guinea                                   23.4         25.9    33.9        40.3      4.1          7.4     42.7        33.8                           Guinée

Guinea-Bissau                            43.0         44.6    16.7        13.8     13.6      11.9        40.2        41.6                    Guinée-Bissau

Kenya                                    29.1         27.6    17.4        18.7     11.1      10.6        53.5        53.7                            Kenya

Lesotho                                  10.1          8.4    34.0        31.9     22.5      15.9        55.9        59.7                           Lesotho

Liberia                                  72.3         63.7     8.0        12.7      5.4          7.2     19.7        23.6                            Libéria

Libyan Arab Jamahiriya                    4.3          2.8    60.9        71.4      4.9          6.3     34.9        25.9         Jamahiriya Arabe Libyenne

Madagascar                               31.7         28.5    16.4        20.2     13.0      14.6        51.9        51.3                      Madagascar       47
Malawi                                   42.9         36.3    14.9        17.1      4.9          5.6     42.2        46.5                            Malawi

Mali                                     33.1         39.0    28.1        21.0      8.5          5.7     38.8        39.9                              Mali

Mauritania                               25.8         20.6    27.3        34.7      5.3          4.1     46.9        44.8                        Mauritanie

Mauritius                                 6.3          4.3    30.7        29.1     22.5      19.5        63.0        66.6                           Maurice

Morocco                                  16.5         16.4    27.3        28.5     16.7      16.1        56.2        55.1                            Maroc

Mozambique                               27.8         29.6    23.1        23.6     13.9      14.2        49.0        46.9                      Mozambique

Namibia                                  10.9          9.4    32.3        32.3     13.1      14.7        56.7        58.3                          Namibie

Niger                                    47.6         44.0    12.0        16.1      6.3          5.5     40.5        39.9                             Niger

Nigeria                                  48.6         37.1    30.5        34.3      3.2          2.3     20.9        28.7                           Nigéria

Rwanda                                   38.5         36.6    15.0        15.5      8.2          6.9     46.5        47.9                          Rwanda

Sao Tome and Principe                    23.0         19.4    18.0        20.3      8.6          8.7     59.0        60.3              Sao Tomé-et-Principe

Senegal                                  15.5         16.7    25.5        23.2     17.2      14.1        59.0        60.1                          Sénégal

Seychelles                                3.0          2.8    31.7        17.2     18.7          9.4     65.3        80.0                        Seychelles

Sierra Leone                             43.1         62.0    10.4         5.2      3.0          1.8     46.5        32.9                      Sierra Leone

Somalia                                  60.1         60.2     7.3         7.4      2.5          2.5     32.6        32.5                           Somalie

South Africa                              4.2          2.9    32.6        31.1     19.2      15.2        63.2        66.0                    Afrique du Sud

Sudan                                    39.1         31.0    20.5        29.4      8.4          7.9     40.4        39.7                           Soudan

Swaziland                                10.3          7.9    44.9        46.1     39.3      42.3        44.8        46.0                         Swaziland

Tanzania, United Republic of             32.5         28.8    21.1        24.3      8.9          9.5     46.5        46.9      Tanzanie, République Unie de

Togo                                     41.1         47.5    19.7        17.8      9.8          8.8     39.2        34.7                             Togo

Tunisia                                   9.3          9.1    29.9        31.4     18.3      16.7        60.8        59.5                           Tunisie

Uganda                                   24.3         24.8    24.4        25.2      7.8          8.2     51.3        50.0                         Ouganda

Zambia                                   22.1         22.0    26.0        34.5     11.5          9.8     51.9        43.5                           Zambie

Zimbabwe                                 32.1         18.0    16.3        29.0     11.7      17.0        51.6        53.0                        Zimbabwe
Africa                                     …           …        …          …         …           …        …           …                            Afrique


                                                                                 African Statistical Yearbook 2011 / Annuaire Statistique pour l'Afrique 2011
NATIONAL ACCOUNTS - COMPTES NATIONAUX

                                         2-5. Structure of Demand (at current market prices) - Structure de la demande (aux prix courants du marché)

                                                                      General                                Exports of Goods       less Imports of
                                             Household Final
                                                                  GovernmentFinal         Gross Capital       and Non Factor        Goods and Non
                                            Cons. Expenditure
                                                                 Cons. Expenditure        Formation /            Services /         Factor Services
          Share of GDP (%)                     / Dep. des                                                                                                              Part du PIB (%)
                                                                 / Dep. Generale du    Formation brute de     Exportations de           /moins
                                            menages en cons.
                                                                   gouv. en cons.            capital         biens et services     Importations de
                                                  finale
                                                                        finale                                  non facteurs       biens et services

          Country                             2002      2009        2002      2009        2002      2009       2002       2009       2002       2009                               Pays

          Algeria                               43.0      37.4        15.5      16.4        30.7      46.8       36.5      35.2        25.6       35.8                            Algérie

          Angola                                39.6      44.9        35.0      26.1        12.6      17.5       75.0      53.1        62.2       41.5                            Angola

          Benin                                 78.0      74.5        12.3      11.6        18.5      21.7       22.2      19.8        31.0       27.6                             Bénin

          Botswana                              41.2      62.7        20.7      24.2        27.0      24.1       46.6      33.6        35.4       44.6                         Botswana

          Burkina Faso                          73.8      72.0        21.2      20.3        17.5      22.7        9.2      11.3        21.7       26.3                      Burkina Faso

          Burundi                               93.2      88.5        13.3      10.6        17.1      14.8        6.5        4.6       30.1       18.5                           Burundi

          Cameroon                              70.8      75.2        10.2      11.3        19.8      18.5       19.9      16.0        20.7       21.0                        Cameroun

          Cape Verde                            84.4      78.4        18.4      20.1        35.8      47.0       25.1      20.7        63.7       66.2                          Cap-Vert

          Central African Republic              80.7      85.0        13.8       9.3         9.6      13.1       16.0      14.8        20.1       22.2          République Centrafricaine

          Chad                                  82.3      74.8         7.7       9.6       106.6      38.0       12.7      43.6       109.2       65.9                            Tchad

          Comoros                               82.3     101.7        15.9      11.6        12.2      13.8       15.7        3.0       26.2       30.2                          Comores

          Congo                                 36.2      26.8        15.8      12.5        22.2      51.6       74.0      81.2        48.2       72.0                            Congo

          Côte d'Ivoire                         66.1      66.9        13.2      13.5         5.7      10.4       47.5      46.6        32.4       37.4                      Côte d'Ivoire

          Democratic Republic of Congo          80.5      61.5         6.7       6.0         6.1      30.2       16.2      32.4        14.3       30.1 République Démocratique du Congo

          Djibouti                              79.2      83.9        25.3      20.8        11.2      18.9       47.2      36.9        62.9       60.5                           Djibouti

          Egypt                                 74.8      76.1        11.8      11.3        18.1      19.2       17.8      25.0        22.6       31.6                            Egypte

          Equatorial Guinea                     14.1       7.8         5.3       4.7        31.8      69.5      102.7      89.4        53.9       71.4                Guinée équatoriale

          Eritrea                               83.8      86.9        39.7      20.0        29.5       9.1       11.8        4.5       64.8       20.5                          Erythrée

          Ethiopia                              75.0      87.5        14.8       8.2        24.1      22.5       12.6      10.5        26.6       28.7                           Ethiopie

          Gabon                                 37.0      39.7        15.1      15.4        31.6      24.9       55.5      56.4        39.2       36.4                            Gabon

          Gambia                                71.1      82.6        10.8       7.6        41.1      28.6        6.8        6.4       29.8       26.5                           Gambie

          Ghana                                 78.7      76.9        17.6       9.6        19.2      19.6       42.4      30.5        58.5       41.3                            Ghana

          Guinea                                77.1      80.9         8.0       8.5        19.2      16.4       27.5      24.2        31.8       30.0                           Guinée

          Guinea-Bissau                         86.2      92.2        14.9      13.5         8.5       8.0       15.7      15.3        25.3       29.0                    Guinée-Bissau

          Kenya                                 74.5      75.5        17.1      16.3        15.2      20.9       23.7      25.3        30.5       37.9                            Kenya

          Lesotho                              110.6      97.2        36.8      40.7        30.2      29.0       66.2      46.2       143.7     113.1                            Lesotho

          Liberia                               89.7     184.4        13.7      15.1         4.7      20.0       19.9      29.3        27.9     148.9                             Libéria

          Libyan Arab Jamahiriya                57.0      36.6        16.6      12.6        14.4       9.7       48.3      68.1        36.3       27.0        Jamahiriya Arabe Libyenne

          Madagascar                            87.3      78.2         8.4      11.5        13.4      34.1       16.0      28.5        25.0       52.2                      Madagascar

          Malawi                                88.6      80.1         8.6      19.0        16.1      26.2       20.8      23.3        34.2       48.5                            Malawi
48
          Mali                                  67.9      62.2        16.6      17.3        16.4      21.2       29.7      21.6        30.6       22.4                              Mali

          Mauritania                            73.9      74.3        22.5      16.1        22.3      27.7       32.5      49.0        51.2       67.0                        Mauritanie

          Mauritius                             60.9      74.6        13.9      14.6        22.1      21.4       62.0      48.5        58.9       59.1                           Maurice

          Morocco                               57.9      57.0        18.3      18.0        25.9      36.0       30.1      28.6        32.2       39.5                            Maroc

          Mozambique                            88.2      80.5        12.3      12.9        29.6      14.9       24.9      27.7        55.1       36.1                      Mozambique

          Namibia                               61.5      58.8        21.5      24.4        18.5      27.3       46.0      44.4        48.1       53.3                           Namibie

          Niger                                 75.3      74.3        16.4      17.2        17.3      29.1       15.4      19.8        24.4       40.5                             Niger

          Nigeria                               77.7      74.8         6.7      12.7         7.0      12.1       36.0      30.8        27.4       30.4                            Nigéria

          Rwanda                                83.6      81.3        19.6      14.5        13.6      21.6        7.0      11.6        23.7       28.9                           Rwanda

          Sao Tome and Principe                 82.0      85.1        37.8      38.5        33.3      65.0       35.1      25.3        86.5     113.9               Sao Tomé-et-Principe

          Senegal                               80.0      78.6        13.3      14.2        17.2      27.1       28.5      23.2        39.0       43.1                           Sénégal

          Seychelles                            47.3      85.0        22.2      13.3        36.4      29.3       74.7     103.4        80.6     131.0                         Seychelles

          Sierra Leone                         140.6      79.9         9.6      15.0       -17.8      19.6       10.9      14.4        43.2       28.9                      Sierra Leone

          Somalia                               72.3      72.6         8.6       8.7        20.5      20.0        0.3        0.3        1.7        1.7                           Somalie

          South Africa                          61.5      60.2        18.8      21.1        15.6      19.0       32.9      27.4        29.1       28.3                    Afrique du Sud

          Sudan                                 78.5      70.9         6.1       8.7        21.8      17.4       11.2      20.9        17.6       17.9                           Soudan

          Swaziland                             70.0      88.2        16.0      13.7        19.3      10.3       95.7      55.5       101.0       67.7                         Swaziland

          Tanzania, United Republic of          71.9      65.5        13.1      17.5        17.2      29.0       17.6      23.2        19.8       35.2     Tanzanie, République Unie de

          Togo                                  85.6      82.6        11.9      14.2        16.7      18.7       34.9      35.5        49.2       51.0                              Togo

          Tunisia                               62.7      61.9        17.2      16.5        23.8      24.5       40.8      45.0        44.6       47.9                           Tunisie

          Uganda                                78.3      83.3        15.6      10.4        19.6      21.7       10.6      19.8        24.1       35.2                          Ouganda

          Zambia                                69.5      51.6        12.9      21.4        22.9      24.1       23.6      35.2        28.9       32.4                           Zambie

          Zimbabwe                              99.3     101.1        15.3      14.3        12.1      13.4       39.6      28.3        66.1       57.1                         Zimbabwe


          Africa                                  …         …           …        …            …        …           …         …           …             …                         Afrique


     African Statistical Yearbook 2011 / Annuaire Statistique pour l'Afrique 2011
PRICES - PRIX

                                        2-6. Consumer Price Index - Indice des prix à la consommation
2000 = 100                                                                                                                                   2000 = 100


Country                        2001    2002    2003     2004       2005     2006     2007     2008      2009     2010                              Pays

Algeria                        103.5   104.9    107.6    111.5      113.3    115.9    120.1    125.9     133.1    138.6                            Algérie

Angola                         216.1   451.3    895.2   1285.2     1580.2   1790.5   2009.8   2260.3    2570.5   2948.9                            Angola

Benin                          104.0   106.5    108.1    109.1      114.9    119.3    120.8    130.4     133.2    136.0                             Bénin

Botswana                       106.6   115.1    125.8    134.5      146.1    163.1    174.6    196.6     212.7    227.7                         Botswana

Burkina Faso                   104.7   107.1    109.3    108.9      115.9    118.6    118.3    130.9     134.4    135.5                      Burkina Faso

Burundi                        109.3   107.9    119.4    129.4      146.4    150.3    162.9    202.7     224.4    240.3                           Burundi

Cameroon                       102.8   105.7    106.4    106.6      108.7    114.1    115.4    121.6     125.2    127.0                        Cameroun

Cape Verde                     103.7   105.7    106.9    104.9      105.3    110.4    115.3    123.1     124.6    127.2                          Cap-Vert

Central African Republic       103.8   106.2    110.7    108.4      111.5    119.0    120.1    131.3     135.9    138.3          République Centrafricaine

Chad                           112.4   118.3    116.2    110.0      118.6    128.2    116.6    126.3     139.1    139.9                            Tchad

Comoros                        105.6   109.3    113.5    118.6      120.9    126.3    131.9    138.2     144.9    149.1                          Comores

Congo                          100.8   103.8    105.6    109.5      112.2    117.5    120.6    127.7     132.5    138.9                            Congo

Côte d'Ivoire                  104.4   107.6    111.1    112.7      117.1    120.0    122.3    130.0     136.1    139.7                      Côte d'Ivoire

Democratic Republic of Congo   457.3   573.0    646.5    672.4      816.2    924.0   1078.3   1272.4    1860.3   2293.1 République Démocratique du Congo

Djibouti                       101.8   102.4    104.4    107.7      111.0    114.9    120.6    135.0     137.3    143.1                           Djibouti

Egypt                          102.4   104.9    108.2    122.2      132.9    138.5    153.6    171.6     199.4    222.8                            Egypte

Equatorial Guinea              108.8   117.1    125.7    131.0      138.4    144.5    148.6    155.0     166.1    173.9                Guinée équatoriale

Eritrea                        114.6   134.0    164.3    205.6      231.3    266.2    290.9    349.0     464.1    523.0                          Erythrée

Ethiopia                        94.8    88.0    101.2    109.9      117.4    131.8    152.7    180.8     245.9    273.4                           Ethiopie

Gabon                          102.1   102.3    104.5    104.9      104.7    103.2    108.4    114.1     116.3    119.9                            Gabon

Gambia                         104.5   113.5    132.8    151.8      159.4    162.7    171.5    179.2     187.4    198.4                           Gambie

Ghana                          132.9   152.6    193.3    217.7      251.2    280.6    310.7    361.8     431.6    466.3                            Ghana

Guinea                         105.4   108.6    122.6    144.0      189.2    254.8    313.1    370.6     388.0    449.3                           Guinée

Guinea-Bissau                  103.3   106.8    103.0    103.8      107.3    108.0    113.0    124.8     122.8    126.0                    Guinée-Bissau

Kenya                          105.8   107.9    118.5    132.5      146.0    154.9    161.5    185.2     204.7    213.0                            Kenya

Lesotho                        108.1   120.0    128.7    135.2      139.9    148.4    160.3    177.2     190.1    203.9                           Lesotho

Liberia                        112.1   128.0    141.2    146.3      156.4    167.6    186.7    219.4     236.1    254.2                            Libéria

Libyan Arab Jamahiriya          90.8    81.9     80.2     78.4       80.7     81.8     86.9     95.9      98.2    102.9         Jamahiriya Arabe Libyenne

Madagascar                     106.9   124.3    122.9    140.5      166.2    185.3    203.1    221.8     240.6    263.6                      Madagascar

Malawi                         127.2   149.2    163.5    182.2      210.4    239.7    258.7    281.2     304.9    328.4                            Malawi

Mali                           105.2   110.5    109.0    105.6      112.4    114.1    115.7    126.2     129.0    130.8                              Mali    49
Mauritania                     107.7   113.4    119.4    131.9      147.9    157.1    168.5    180.8     184.8    196.1                        Mauritanie

Mauritius                      105.4   112.1    116.5    122.0      128.0    139.4    151.6    166.3     170.5    175.5                           Maurice

Morocco                        100.6   103.4    104.7    106.2      107.3    110.8    113.3    117.5     118.7    119.7                            Maroc

Mozambique                     109.1   127.3    144.5    162.7      173.2    196.1    212.2    234.1     242.3    273.1                      Mozambique

Namibia                        109.2   121.6    130.3    135.8      138.8    145.8    155.6    171.8     186.7    195.2                          Namibie

Niger                          104.0   106.7    105.0    105.3      113.5    114.0    114.4    127.4     133.6    138.1                             Niger

Nigeria                        118.9   134.2    153.0    176.0      207.5    224.6    236.7    264.1     297.2    337.8                            Nigéria

Rwanda                         103.4   105.4    113.3    126.8      138.4    150.7    164.4    189.8     209.4    216.0                          Rwanda

Sao Tome and Principe          109.2   119.2    130.7    147.4      172.8    212.7    252.0    317.8     370.9    413.0              Sao Tomé-et-Principe

Senegal                        103.0   105.4    105.4    105.9      107.7    109.7    116.2    122.9     121.6    123.0                          Sénégal

Seychelles                     106.0   106.2    110.1    114.6      115.3    113.2    119.2    163.3     215.1    209.9                        Seychelles

Sierra Leone                   102.6    98.8    106.3    121.4      133.7    144.2    161.0    184.9     202.0    238.0                      Sierra Leone

Somalia                        100.0   100.0    100.0    100.0      100.0    100.0    100.0    100.0     100.0    100.0                           Somalie

South Africa                   105.8   115.4    122.1    123.8      128.0    133.9    143.6    160.1     171.5    178.8                    Afrique du Sud

Sudan                          107.4   116.2    125.8    135.0      142.6    165.0    179.5    205.2     227.8    259.2                           Soudan

Swaziland                      106.9   119.4    128.2    132.6      138.9    146.3    158.1    178.1     191.5    200.2                         Swaziland

Tanzania, United Republic of   105.1   109.6    115.4    120.9      127.0    136.2    145.8    160.8     180.3    196.3      Tanzanie, République Unie de

Togo                           103.9   107.1    106.2    106.6      113.8    116.4    117.6    127.8     131.4    138.4                             Togo

Tunisia                        101.9   104.7    107.6    111.5      113.8    118.9    122.6    128.8     133.3    139.1                           Tunisie

Uganda                         101.9   101.6    110.5    114.5      124.4    133.3    141.5    158.5     179.7    192.8                         Ouganda

Zambia                         121.7   148.7    180.7    213.2      252.3    275.0    304.3    342.2     376.1    405.9                           Zambie

Zimbabwe                         172     162     175      182        185      193      185       199      211      222                         Zimbabwe


Africa                         108.3   116.1   124.8    133.9      143.5    152.0    162.4     179.2    197.1    212.4                           Afrique


                                                                            African Statistical Yearbook 2011 / Annuaire Statistique pour l'Afrique 2011
PRODUCTION

                                         2-7. Agricultural and Food Production Index - Indice de la production agricole et alimentaire
              1999-2001=100                                                                                                                      1999-2001=100
                                                 Agricultural Production / Production         Food Production / Production
                                                                agricole                              alimentaire

              Country                              2000      2005      2008       2009       2000     2005      2008         2009                            Pays

              Algeria                                 95       137        131       161         95      137       131         161                           Algérie

              Angola                                  99       147        163       197         99      148       165         199                           Angola

              Benin                                  102       115        113       113        101      120       117         117                            Bénin

              Botswana                                99       111        113       113         99      111       113         113                        Botswana

              Burkina Faso                            87       137        144       140         86      125       137         136                     Burkina Faso

              Burundi                                 95       110        109       109         95      112       110         110                          Burundi

              Cameroon                                99       116        112       115         99      118       119         120                       Cameroun

              Cape Verde                              96       101        123       123         96      101       123         123                         Cap-Vert

              Central African Republic               102       107        116       119        102      111       121         123         République Centrafricaine

              Chad                                    93       119        118       118         93      120       124         125                           Tchad

              Comoros                                100        99        112       112        100       99       112         112                        Comores

              Congo                                  100       117        124       124        100      117       124         124                           Congo

              Congo, Dem. Republic                    99        97         97           97      99       97        98          98   Rép. Démocratique du Congo

              Côte d'Ivoire                          104       106        113       113        102      109       125         122                     Côte d'Ivoire

              Djibouti                               102       115        147       147        102      115       147         147                          Djibouti

              Egypt                                  102       115        130       135        102      116       132         137                           Egypte

              Equatorial Guinea                      101        94         93           91     100       95        92          89               Guinée Equatoriale

              Eritrea                                 93       104        124       124         93      104       125         125                         Erythrée

              Ethiopia                                98       132        143       148         97      134       144         150                          Ethiopie

              Gabon                                  101       100        103       103        101      100       103         103                           Gabon

              Gambia                                 101        93        100       117        101       93       100         117                          Gambie

              Ghana                                   99       127        144       154         99      127       145         155                           Ghana

              Guinea                                 101       117        135       137        100      119       138         140                          Guinée

              Guinea-Bissau                          100       113        121       122        100      113       121         122                   Guinée-Bissau

              Kenya                                   94       116        124       124         93      116       125         126                           Kenya

              Lesotho                                 94        94         75           75      94       92        72          72                          Lesotho

              Liberia                                102       105        117       117        102      104       130         130                           Libéria

              Libyan Arab Jamahiriya                  98       104        108       108         98      103       108         108        Jamahiriya Arabe Libyenne

50            Madagascar                              99       116        114       114         99      118       115         115                     Madagascar

              Malawi                                 102        89        142       142        101       86       137         137                           Malawi

              Mali                                    87       124        142       159         94      128       165         184                             Mali

              Mauritania                             100       112        114       115        100      112       114         115                       Mauritanie

              Mauritius                              101       105        104       106        101      106       105         107                          Maurice

              Morocco                                 94       123        137       137         94      123       138         137                           Maroc

              Mozambique                              95       119        122       122         96      108       102         102                     Mozambique

              Namibia                                 98        96        100       100         98       96       100         100                         Namibie

              Niger                                   93       130        183       183         93      130       184         184                            Niger

              Nigeria                                100       123        132       133        100      123       133         133                          Nigéria

              Rwanda                                 103       124        133       134        103      125       134         134                         Rwanda

              Sao Tome and Principe                   99       102        109       111         99      102       109         111            Sao Tomé-et-Principe

              Senegal                                102       101        121       129        102      101       121         130                         Sénégal

              Seychelles                             100        69         49           49     100       68        49          49                       Seychelles

              Sierra Leone                            92       170        200       200         92      173       204         204                     Sierra Leone

              Somalia                                101       108        104       104        101      108       104         104                          Somalie

              South Africa                           105       111        121       119        105      112       123         120                   Afrique du Sud

              Sudan                                   97       116        116       118         97      116       117         119                          Soudan

              Swaziland                               98       113        109       109         99      117       114         114                        Swaziland

              Tanzania                                94       131        140       140         95      128       139         139                        Tanzanie

              Togo                                    94       102        112       112         95      112       129         129                            Togo

              Tunisia                                 97       118        126       116         97      118       126         116                          Tunisie

              Uganda                                  98       105        109       111         99      106       109         111                        Ouganda

              Zambia                                  98       127        130       144        100      113       119         135                          Zambie

              Zimbabwe                               106        71         70           70     105       83        81          81                       Zimbabwe


     African Statistical Yearbook 2011 / Annuaire Statistique pour l'Afrique 2011
PRODUCTION

            2-8. Industrial, Mining and manufacturing Production Index - Indice de la production industrielle, minière et manufacturière


                                                                                                           Manufacturing
                                            Industrial Production /        Mining Production /
                                                                                                       Production / Production
                                            Production Industrielle        Production minière
                                                                                                           manufacturière


Country                            Base      2007      2008     2009      2007      2008     2009       2007      2008     2009                          Pays

Algeria                          2005=100     96.9      98.7     98.8      125.9    138.3    143.0        87.2     88.9     89.4                         Algérie

Angola                           2005=100        ...      ...      ...        ...      ...       ...        ...      ...      ...                        Angola

Benin                            2005=100    112.8     120.4    128.7         ...      ...       ...        ...      ...      ...                         Bénin

Botswana                         2005=100        ...      ...      ...        ...      ...       ...        ...      ...      ...                     Botswana

Burkina Faso                     2005=100        ...      ...      ...        ...      ...       ...        ...      ...      ...                  Burkina Faso

Burundi                          2005=100        ...      ...      ...        ...      ...       ...     105.1    107.0    104.5                        Burundi

Cameroon                         2005=100    103.9     107.2    108.4         ...      ...       ...     104.4    107.4    108.8                     Cameroun

Cape Verde                       2005=100        ...      ...      ...        ...      ...       ...        ...      ...      ...                      Cap-Vert

Central African Republic         2005=100    182.7     210.7    143.0         ...      ...       ...        ...      ...      ...      République Centrafricaine

Chad                             2005=100     88.1      80.9     77.2         ...      ...       ...        ...      ...      ...                        Tchad

Comoros                          2005=100        ...      ...      ...        ...      ...       ...        ...      ...      ...                      Comores

Congo                            2005=100    105.6        ...      ...        ...      ...       ...        ...      ...      ...                        Congo

Congo, Dem. Republic             2005=100        ...      ...      ...        ...      ...       ...        ...      ...      ...   Rép. Démocratique du Congo

Côte d'Ivoire                    2005=100    107.9     107.9    113.2      134.4    125.7        ...      93.7     95.3       ...                  Côte d'Ivoire

Djibouti                         2005=100        ...      ...      ...        ...      ...       ...        ...      ...      ...                       Djibouti

Egypt                            2005=100        ...      ...      ...        ...      ...       ...     125.4    129.6    120.5                         Egypte

Equatorial Guinea                2005=100        ...      ...      ...        ...      ...       ...        ...      ...      ...            Guinée Equatoriale

Eritrea                          2005=100        ...      ...      ...        ...      ...       ...        ...      ...      ...                      Erythrée

Ethiopia                         2005=100        ...      ...      ...        ...      ...       ...        ...      ...      ...                       Ethiopie

Gabon                            2005=100    111.7     119.2    114.8         ...      ...       ...        ...      ...      ...                        Gabon

Gambia                           2005=100        ...      ...      ...        ...      ...       ...        ...      ...      ...                       Gambie

Ghana                            2005=100        ...      ...      ...        ...      ...       ...        ...      ...      ...                        Ghana

Guinea                           2006=100    100.1     110.4     98.9         ...      ...       ...        ...      ...      ...                       Guinée

Guinea-Bissau                    2007=100        ...   153.2    162.5         ...      ...       ...        ...      ...      ...                Guinée-Bissau

Kenya                            2005=100        ...      ...      ...        ...      ...       ...        ...      ...      ...                        Kenya

Lesotho                          2005=100        ...      ...      ...        ...      ...       ...        ...      ...      ...                       Lesotho

Liberia                          2005=100        ...      ...      ...        ...      ...       ...        ...      ...      ...                        Libéria

Libyan Arab Jamahiriya           2005=100        ...      ...      ...        ...      ...       ...        ...      ...      ...     Jamahiriya Arabe Libyenne
                                                                                                                                                                   51
Madagascar                       2005=100        ...      ...      ...        ...      ...       ...        ...      ...      ...                  Madagascar

Malawi                           2005=100        ...      ...      ...        ...      ...       ...        ...      ...      ...                        Malawi

Mali                             2005=100    105.9     102.8    127.3         ...      ...       ...        ...      ...      ...                          Mali

Mauritania                       2006=100     79.1      71.5     67.5         ...      ...       ...        ...      ...      ...                    Mauritanie

Mauritius                        2005=100    105.6     106.6    108.7       99.1     99.1     84.3       105.3    105.8    107.9                        Maurice

Morocco                          2005=100    108.0     110.0    109.3      112.8    110.7     96.3       110.0    112.3    112.6                         Maroc

Mozambique                       2005=100        ...      ...      ...        ...      ...       ...        ...      ...      ...                  Mozambique

Namibia                          2005=100        ...      ...      ...        ...      ...       ...        ...      ...      ...                      Namibie

Niger                            2005=100     99.3     105.2    125.6         ...      ...       ...        ...      ...      ...                         Niger

Nigeria                          2005=100        ...      ...      ...        ...      ...       ...        ...      ...      ...                        Nigéria

Rwanda                           2005=100        ...      ...      ...        ...      ...       ...        ...      ...      ...                      Rwanda

Sao Tome and Principe            2005=100        ...      ...      ...        ...      ...       ...        ...      ...      ...          Sao Tomé-et-Principe

Senegal                          2005=100    103.0      93.4    100.2       67.6     77.6     88.3       104.3     92.0     99.7                       Sénégal

Seychelles                       2005=100        ...      ...      ...        ...      ...       ...        ...      ...      ...                    Seychelles

Sierra Leone                     2005=100        ...      ...      ...        ...      ...       ...        ...      ...      ...                  Sierra Leone

Somalia                          2005=100        ...      ...      ...        ...      ...       ...        ...      ...      ...                       Somalie

South Africa                     2005=100    106.4     105.3     94.1       97.8     92.3     86.2       109.6    110.4     96.2                 Afrique du Sud

Sudan                            2005=100        ...      ...      ...        ...      ...       ...        ...      ...      ...                       Soudan

Swaziland                        2005=100        ...      ...      ...        ...      ...       ...        ...      ...      ...                     Swaziland

Tanzania                         2005=100        ...      ...      ...        ...      ...       ...     123.5    202.9    187.8                      Tanzanie

Togo                             2005=100        ...      ...      ...        ...      ...       ...        ...      ...      ...                         Togo

Tunisia                          2005=100    112.7     116.4    111.1      112.8    107.1    107.3       113.1    118.3    111.3                        Tunisie

Uganda                           2005=100        ...      ...      ...        ...      ...       ...     113.6    118.0    138.2                      Ouganda

Zambia                           2005=100    114.8     120.9    131.4      119.7    132.3    150.7       110.2    112.1    114.9                        Zambie

Zimbabwe                         2005=100        ...      ...      ...        ...      ...       ...        ...      ...      ...                    Zimbabwe


                                                                                    African Statistical Yearbook 2011 / Annuaire Statistique pour l'Afrique 2011
PRODUCTION

                                                    2-9. Electricity Production by Type - Production d'électricité par catégorie
           Millions Kilowatt hours                                                                                                              Millions de kilowatt heures


                                                                                                  of which
                                        Electricity - gross production,
                                                                              Total hydro production           Total thermal production
                                            public & self-producer


           Country                         2000         2006       2007       2000       2006       2007        2000       2006       2007                             Pays

           Algeria                         25 412       35 226    37 196         54        218         226     25 358     35 008     36 970                           Algérie

           Angola                           1 445        2 959     3 171        912      2 665       2 583        533        294        588                           Angola

           Benin                               84         128        132           2         1           1         82        127        131                            Bénin

           Botswana                         1 114        1 042     1 119          ...       ...         ...     1 114      1 042      1 119                        Botswana

           Burkina Faso                       390         548        612         98         80         111        292        468        501                     Burkina Faso

           Burundi                            101          95        119         99         93         117          2          2           2                         Burundi

           Cameroon                         3 480        5 106     5 753       3 442     3 892       3 847         38      1 214      1 906                       Cameroun

           Cape Verde                         146         252        269          ...       ...         ...       139        245        263                         Cap-Vert

           Central African Republic           107         139        160         84        110         130         23         29          30        République Centrafricaine

           Chad                                92         102        105          ...       ...         ...        92        102        105                           Tchad

           Comoros                             28          51         50           3         5           2         25         46          48                        Comores

           Congo                              298         453        407        297        372         335          1         81          72                          Congo

           Congo, Dem. Republic             6 018        7 886     8 302       5 999     7 862       8 276         19         24          26    Rép. Démocratique du Congo

           Côte d'Ivoire                    4 813        5 535     5 631       1 764     1 510       1 797      3 049      4 025      3 834                     Côte d'Ivoire

           Djibouti                           180         280        292          ...       ...         ...       180        280        292                          Djibouti

           Egypt                           70 337      118 407   128 129      14 266    12 925      15 510     55 990    104 866    111 788                           Egypte

           Equatorial Guinea                   50          95         95           7         7           2         43         88          93              Guinée Equatoriale

           Eritrea                            209         269        288          ...       ...         ...       209        267        286                         Erythrée

           Ethiopia                         1 696        3 270     3 503       1 646     3 259       3 369         23         10        133                         Ethiopie

           Gabon                            1 315        1 732     1 844        803        945         801        512        787      1 043                           Gabon

           Gambia                              90         216        229          ...       ...         ...        90        216        229                          Gambie

           Ghana                            7 224        8 435     6 984       6 606     5 619       3 727        618      2 816      3 257                           Ghana

           Guinea                             913         872        973        511        461         538        402        411        435                          Guinée

           Guinea-Bissau                       58          66         70          ...       ...         ...        58         66          70                  Guinée-Bissau

           Kenya                            4 323        7 323     6 773       1 325     3 025       3 592      2 569      3 252      2 192                           Kenya

           Lesotho                            290         200        200        290        200         200         ...        ...         ...                        Lesotho

           Liberia                            310         351        353          ...       ...         ...       310        351        353                           Libéria

           Libyan Arab Jamahiriya          15 496       23 992    25 694          ...       ...         ...    15 496     23 992     25 694        Jamahiriya Arabe Libyenne

52         Madagascar                         780         990        935        540        600         540        240        390        395                     Madagascar

           Malawi                           1 226        1 580     1 637       1 033     1 354       1 403        193        226        234                           Malawi

           Mali                               412         489        495        235        266         271        177        223        224                             Mali

           Mauritania                         234         569        587          ...       ...         ...       234        569        587                       Mauritanie

           Mauritius                        1 777        2 350     2 465         95         77         84       1 682      2 273      2 381                          Maurice

           Morocco                         13 715       23 192    22 858        718      1 601       1 331     12 933     21 408     21 248                           Maroc

           Mozambique                       8 849       14 737    16 076       8 836    14 717      16 063         13         20          13                    Mozambique

           Namibia                          1 414        1 491     1 694       1 380     1 385       1 564         34        106        130                         Namibie

           Niger                              190         179        197          ...       ...         ...       190        179        197                            Niger

           Nigeria                         14 727       23 110    22 978       5 743     7 714       6 406      8 984     15 396     16 572                          Nigéria

           Rwanda                             113         171        169        109         41         34           4        129        135                         Rwanda

           Sao Tome and Principe               26          42         43           7         8         10          19         34          33           Sao Tomé-et-Principe

           Senegal                          1 671        1 962     2 124          ...       ...         ...     1 669      1 958      2 124                         Sénégal

           Seychelles                         188         252        271          ...       ...         ...       188        252        271                       Seychelles

           Sierra Leone                        95          41         60         16          4         18          79         37          42                    Sierra Leone

           Somalia                            250         307        326          ...       12         15         250        295        311                          Somalie

           South Africa                   210 670      253 798   263 479       3 934     5 581       3 908    193 726    236 384    248 201                   Afrique du Sud

           Sudan                            2 450        4 209     4 541       1 183     1 370       1 451      1 267      2 839      3 090                          Soudan

           Swaziland                          470         436        454        192        156         173        277        280        281                        Swaziland

           Tanzania                         2 479        2 776     4 175       2 145     1 436       2 511        334      1 340      1 664                        Tanzanie

           Togo                               275         221        196        199         91         92          76        130        104                            Togo

           Tunisia                         10 095       14 122    14 060         64         92         49      10 008     13 992     13 968                          Tunisie

           Uganda                           1 582        1 615     1 952       1 576     1 239       1 412          6        376        540                        Ouganda

           Zambia                           7 798        9 385     9 853       7 750     9 329       9 796         48         56          57                         Zambie

           Zimbabwe                         6 995        9 776     9 180       3 260     5 552       5 213      3 735      4 224      3 967                       Zimbabwe


           Africa                        434 500      592 830    619 258     77 223     95 875     97 508     343 633    483 224    508 228                         Afrique


     African Statistical Yearbook 2011 / Annuaire Statistique pour l'Afrique 2011
53


African Statistical Yearbook 2011 / Annuaire Statistique pour l'Afrique 2011
3
54


     Section

                Monetary and Financial Statistics
            Statistiques monétaires et financières


       African Statistical Yearbook 2011 / Annuaire Statistique pour l'Afrique 2011
2011
                                                                                           Principaux faits sur le
                       Main facts about Africa’s                                           commerce extérieur africain de
                       external trade of goods in 2009                                     marchandises en 2009


                       Africa’s share in world trade is about 3.2%.                        La part de l’Afrique dans le commerce mondial était
                                                                                           d’environ 3,2%.
                       Energy products contribute to more than half of Africa’s
                       exports products (see figure 1), almost the same level              Les produits énergétiques contribuaient à plus de la
                       over the past years, showing the lack of diversification            moitié des exportations totales africaines (cf. Graphique
                       of Africa’s exports.                                                1), à l’instar des années précédentes, indiquant la faible
                                                                                           diversification des exportations.
                       Figure 1 - Africa: Main products exported
                       (As % of total exports)                                             Graphique 1 - Afrique: Principaux produits exportés,
                                                                                           2009 (En % des exportations totales)
      Petroleum oils and oils obtained from bituminous
                                                                                   44.8%
                      minerals, crude.
                                                                                                     Huiles de pétrole ou minéraux bitumineux, brut.                                 44.8%

                                   Natural gas, liquefied      3.9%

                                                                                                                               Gaz naturel, liquéfiés      3.9%
                           Natural gas, in gaseous state       3.7%


Petroleum oils & oils obtained from bituminous minerals                                                                  Gaz naturel à l'état gazeux       3.7%
                                                             1.9%
          (other than crude) & preparations

                                                                                                 Huiles de pétrole ou minéraux bitumineux, autre que
                    Light Petroleum oils and preparations    1.8%                                                                                         1.9%
                                                                                                                  brut& preparations


                                                                                                              Huiles de pétrole léger et préparations     1.8%


                       The share of Africa in crude petroleum and natural gas
                       world trade is around 18 %.
                                                                                           Le commerce africain de pétrole brut et de gaz naturel                                            55
                       China (see figure 2) is the top partner of Africa in terms          représentaient environ 18% du commerce mondial de ces
                       of total trade (12.5% of total trade), followed by the USA          mêmes produits.
                       (12.2%), France (8.5%), Italy (8.2%) and Germany (6%).
                                                                                           En termes de principaux partenaires au commerce total
                       Figure 2 - Africa: Main trade partners                              de marchandises, la Chine (cf. Graphique 2) venait en tête
                       (exports and imports) (As % of total trade)                         (12,5% du commerce total) suivi des Etats-Unis (12,2%), de
                                                                                           la France (8,5%), de l’Italie (8,2%) et de l’Allemagne (6%).
          China                                                                 12.5%

   United States                                                               12.2%
                                                                                           Graphique 2 - Afrique: Principaux partenaires commerciaux
                                                                                           (En% du total des échanges)
         France                                                         8.2%

                                                                                                          Chine                                                                    12.5%
            Italy                                                     7.7%

                                                                                                     Etats-Unis                                                                   12.2%
       Germany                                               6.0%

                                                                                                         France                                                     8.2%
          Spain                                       5.0%

           India                                                                                           Italie                                                 7.7%
                                                    4.7%

                                                                                                     Allemagne                                            6.0%
 United Kingdom                             3.6%

                                                                                                       Espagne                                     5.0%
    Netherlands                            3.4%

                                                                                                            Inde                                 4.7%

                                                                                                  Royaume-Uni                             3.6%

                                                                                                      Pays-Bas                          3.4%


                                                                                           African Statistical Yearbook 2011 / Annuaire Statistique pour l'Afrique 2011
Principaux faits sur le
                       Main facts about Africa’s                                                        commerce extérieur africain de
                       external trade of goods in 2009                                                  marchandises en 2009


                       However, the USA took the lead in term of exports des-                           S’agissant des partenaires à l’exportation, les Etats-Unis
                       tination of African countries (see Figure 3), while China                        venaient en tête (cf. Graphique 3), alors que la China était
                       was the main supplier to Africa, accounting for 13.3% of                         le principal pays d’importation de l’Afrique, comptant
                       Africa’s imports followed by the USA, 11.7%.                                     pour 13,3% des importations totales africaines, suivi des
                                                                                                        Etats-Unis avec 11,7%.
                       Figure 3 - Africa: Main destinations of exports, 2009
                       (As % of total exports)                                                          Graphique 3 - Afrique: Principales destinations des
                                                                                                        exportations, 2009 (En % des exportations totales)
      United States

             China                                                                      17.4%                   Etats-Unis                                                       17.4%
                                                                             11.7%

               Italy                                                9.2%                                            Chine                                              11.7%

            France                                          7.5%                                                     Italie                                    9.2%

             Spain                                   6.2%                                                          France                              7.5%

              India                             5.7%                                                             Espagne                        6.2%

          Germany                             5.3%                                                                   Inde                      5.7%

     United Kingdom                   3.7%                                                                      Allemagne                    5.3%

       Netherlands               3.2%                                                                         Royaume-Uni             3.7%

             Japan             2.5%                                                                             Pays-Bas         3.2%

                                                                                                                    Japon      2.5%


                       Figure 4 – Africa: Main origins of imports, 2009
                                                                                                        Graphique 4 - Afrique: Principales origines des
             China
                                                                                                        importations, 2009 (En % des importations totales)
                                                                                                13.3%
            France                                                               9.0%
                                                                                                                    Chine
56    United States                                                   6.8%
                                                                                                                                                                                  13.3%
          Germany                                                    6.7%                                          France                                                 9.0%

               Italy                                               6.2%                                         Etats-Unis                                      6.8%

              India                           3.7%                                                              Allemagne                                       6.7%

             Spain                            3.6%                                                                   Italie                                   6.2%

        Korea, Rep.                           3.6%                                                                   Inde                    3.7%

       Netherlands                            3.6%                                                               Espagne                     3.6%
     United Kingdom                          3.4%
                                                                                                               Corée, Rép                    3.6%

                                                                                                                Pays-Bas                     3.6%

                                                                                                              Royaume-Uni                3.4%


                       Analysis of Africa’s imports by categories of products
                       indicate that Machinery and transport equipment con-
                       stitute the largest share of imports (36.7%) followed by                         L’analyse des importations africaines par catégorie de
                       manufactured goods (17.9%), while Food and live animals                          produits indiquait la prédominance des machines et maté-
                       accounted for 10.7% (Figure 5).                                                  riel de transport (36,7% des importations totales) suivi des
                                                                                                        produits manufacturés (17,9%), alors que l’importation
                                                                                                        de produits alimentaires et d’animaux vivants venait en
                                                                                                        troisième position et comptait environ pour 10,7% (cf.
                                                                                                        Graphique 5).


           African Statistical Yearbook 2011 / Annuaire Statistique pour l'Afrique 2011
2011
                                                                                                  Principaux faits sur le
                           Main facts about Africa’s                                              commerce extérieur africain de
                           external trade of goods in 2009                                        marchandises en 2009


                  Figure 5 - Africa: Imports by Main Categories of                        Graphique 5 - Afrique: Principales catégories de produits
                  products, 2009                                                          importés, 2009 (En % des importations totales)

              Machinery and transport equipment                                                                 Machines et matériel de transport
                                                                                  36.7%                                                                                            36.7%
    Manufact goods classified chiefly by material                         17.9%                Produits manufacturés classés principalement par
                                                                                                                                                                        17.9%
                                                                                                                   matériel

                            Food and live animals                 10.7%
                                                                                                                  Alimentation et animaux vivants               10.7%

                                        Chemicals               9.6%
                                                                                                                              Produits chimiques              9.6%

    Mineral fuels, lubricants and related materials             9.6%
                                                                                          Combustibles minéraux, lubrifiants et produits connexes             9.6%
            Miscellaneous manufactured articles                7.8%
                                                                                                                   Divers produits manufacturés              7.8%
Commod. & transacts. Not class. Accord. To Kind        2.8%
                                                                                             Produits de base & transacts. Non classé. Selon leur
                                                                                                                                                     2.8%
                                                                                                                     type
           Crude materials, inedible, except fuels      2.6%
                                                                                            Matières brutes non comestibles, sauf les carburants      2.6%
               Animal and vegetable oils and fats     1.4%

                                                                                                      Huiles animales et végétales et de graisses   1.4%
                         Beverages and tobacco        1.0%

                                                                                                                               Boissons et tabac    1.0%


                                                                                                                                                                                           57


                                                                                          African Statistical Yearbook 2011 / Annuaire Statistique pour l'Afrique 2011
MONETARY STATISTICS - STATISTIQUES MONETAIRES

                                                                  3-1. Broad Money Supply (M2) / Masse monétaire (M2)


                                                                                                                       Income Velocity of Money
                                       Amount (billions nat. currency) /      Annual % Growth / Acr. Annuel
                                                                                                                    (GDP/M2) / Vitesse de circ. de la
                                       Montant (milliards de mon. nat.)                   en %
                                                                                                                          monnaie (PIB/M2)


        Country                           2005        2009          2010        2005      2009         2010            2005       2009          2010                               Pays

        Algeria                          3 794.4     6 600.2       7 323.2         8.8      1.6          11.0             2.0       1.5            1.5                            Algérie

        Angola                             391.2     2 303.8       2 411.0        60.5     62.6           4.7             6.8       2.6            3.3                            Angola

        Benin                              634.7     1 188.6       1 204.2        26.3      8.0           1.3             3.6       2.6            2.7                             Bénin

        Botswana                            14.7        38.7          42.9        10.6     - 1.3         10.7             3.6       2.1            2.3                         Botswana

        Burkina Faso                       555.6     1 048.1       1 219.4        - 4.8    22.3          16.3             5.2       3.8            3.7                      Burkina Faso

        Burundi                            277.4      638.4         713.8         24.4     14.5          11.8             3.1       2.4            2.4                           Burundi

        Cameroon                         1 517.6     2 323.8       2 491.7         4.9      6.3           7.2             5.8       4.8            4.6                        Cameroun

        Cape Verde                          72.4      105.3         109.2         15.8      3.5           3.7             1.2       1.2            1.4                          Cap-Vert

        Central African Republic           128.4      156.4         170.7         16.5     13.3           9.2             5.5       6.0            5.7          République Centrafricaine

        Chad                               247.8      475.9         599.7         31.3      1.1          26.0            12.5       7.1            6.6                             Tchad

        Comoros                             36.9        57.6          66.4         7.1     13.3          15.4             4.1       3.4            3.2                          Comores

        Congo                              458.2     1 028.6       1 227.3        37.1      5.0          19.3             7.0       4.0            4.4                            Congo

        Côte d'Ivoire                    2 081.1     3 511.8       3 983.9         7.7     17.2          13.4             1.7       2.6            3.8                      Côte d'Ivoire

        Democratic Republic of Congo       267.3     1 501.9       1 832.0        24.2     50.4          22.0            32.3       7.2            6.1 République Démocratique du Congo

        Djibouti                            97.7      167.2         182.7         11.3     17.5           9.3             1.3       1.1            1.1                           Djibouti

        Egypt                              522.9      866.4         963.3         11.5      9.5          11.2             1.0       1.2            1.3                            Egypte

        Equatorial Guinea                  279.1      695.4        1 019.0        34.7     18.8          46.5            13.6       6.9            5.4                Guinée équatoriale

        Eritrea                             21.8        34.7          37.8        10.7     15.7           9.0              ...       ...            ...                         Erythrée

        Ethiopia                            47.0          ...           ...       18.6       ...              ...         2.3        ...            ...                          Ethiopie

        Gabon                              840.4     1 165.2       1 221.9        27.5      2.1           4.9             5.4       4.4            5.2                            Gabon

        Gambia                               6.1        11.7            ...       13.1     19.4               ...         2.9       2.2             ...                          Gambie

        Ghana                                3.1        10.6          13.7        19.5     27.8          29.0             3.1       1.9            1.8                            Ghana

        Guinea                           2 000.5          ...           ...       33.4       ...              ...         5.4        ...            ...                           Guinée

        Guinea-Bissau                       52.8        95.3        121.9         21.3      6.9          27.9             5.7       4.1            3.4                    Guinée-Bissau

        Kenya                              550.6     1 044.1       1 249.2         9.9     16.5          19.6             2.6       2.2            2.2                            Kenya

        Lesotho                              2.6         5.7           6.6         9.1     17.7          14.5             3.1       2.5            2.2                           Lesotho

        Liberia                              6.4        25.0          29.0        34.1     43.4          16.1             4.8       2.4            3.2                            Libéria

        Libyan Arab Jamahiriya              16.5        45.4          43.6        29.0     17.4          - 4.0            3.6       1.6            2.2         Jamahiriya Arabe Libyenne
58
        Madagascar                       2 031.9     3 900.7       4 277.1         2.2     11.3           9.6             5.0       4.4            4.0                       Madagascar

        Malawi                              54.0      174.0             ...       16.2     24.6               ...         6.0       3.8             ...                           Malawi

        Mali                               841.9     1 144.8       1 204.4         9.8     14.6           5.2             3.4       3.7            3.5                               Mali

        Mauritania                         153.8      278.0         292.7         14.3     15.5           5.3             3.2       2.9            4.1                         Mauritanie

        Mauritius                          187.3      295.7         297.6          7.5      8.4           0.6             1.0       1.0            1.1                           Maurice

        Morocco                            468.9      779.3         809.5         15.7      4.9           3.9             1.1       0.9            1.0                             Maroc

        Mozambique                          42.4      107.1         128.8         24.3     33.0          20.3             3.6       2.5            3.1                      Mozambique

        Namibia                             17.4        31.0            ...        9.8      5.9               ...         2.7       2.5             ...                          Namibie

        Niger                              248.4      472.5         545.7          7.0     18.7          15.5             7.2       5.2            5.1                             Niger

        Nigeria                          2 612.9    10 210.7      10 844.3        22.6     14.4           6.2             5.6       2.5            2.8                            Nigéria

        Rwanda                             253.1          ...           ...       18.0       ...              ...         5.7        ...            ...                          Rwanda

        Sao Tome and Principe              433.5     1 133.3       1 315.7        45.4      8.2          16.1             2.8       2.7            3.0              Sao Tomé-et-Principe

        Senegal                          1 549.3     2 234.4       2 469.0         8.2     11.4          10.5             3.0       2.7            2.4                           Sénégal

        Seychelles                           4.9         6.4           7.3         1.7      7.8          13.7             1.0       1.7            1.7                        Seychelles

        Sierra Leone                       724.2     1 685.0       2 236.5        31.3     27.5          32.7             4.8       3.8            3.7                      Sierra Leone

        Somalia                               ...         ...           ...         ...      ...              ...          ...       ...            ...                          Somalie

        South Africa                       937.1     1 577.4       1 690.9        19.9      0.4           7.2             1.7       1.5            1.6                    Afrique du Sud

        Sudan                               13.5        28.3            ...       43.4     23.7               ...         5.0       4.2             ...                          Soudan

        Swaziland                            3.5         7.7           8.3         9.7     26.8           7.9             4.6       3.5            3.4                         Swaziland

        Tanzania, United Republic of     4 250.7     8 780.1      11 012.6        34.8     17.7          25.4             3.8       3.2            2.9     Tanzanie, République Unie de

        Togo                               314.0      616.7         690.6          2.2     16.0          12.0             3.5       2.4            2.4                              Togo

        Tunisia                             22.4        36.3          40.4        11.0     12.5          11.4             1.9       1.6            1.6                            Tunisie

        Uganda                           3 103.4     6 797.7       9 354.7        17.2     17.5          37.6             5.8       5.0            4.2                          Ouganda

        Zambia                           5 757.8    13 796.9      17 597.2         3.2      7.7          27.5             5.6       4.7            4.9                           Zambie

        Zimbabwe                            58.4          ...           ...      532.7       ...              ...         0.1        ...            ...                        Zimbabwe
                                              ...         ...           ...         ...      ...              ...          ...       ...            ...
        Africa                                ...         ...           ...         ...      ...              ...          ...       ...            ...                          Afrique


     African Statistical Yearbook 2011 / Annuaire Statistique pour l'Afrique 2011
MONETARY STATISTICS - STATISTIQUES MONETAIRES

                                                    3-2. Exchange Rate - Taux de change


                           Nominal Exchange Rate Index (2000 = 100) / Indice du taux de change nominal (2000 = 100)


Country                       2002      2003      2004     2005      2006      2007       2008      2009      2010                            Pays

Algeria                        105.9     102.8     95.7      97.4      96.5      92.1      85.8      96.5      98.8                          Algérie

Angola                         433.5     743.1    832.0     868.1     800.4     764.0     747.3     790.1     915.3                          Angola

Benin                           97.9      81.6     74.2      74.1      73.4      67.3      62.9      66.3      69.6                           Bénin

Botswana                       124.0      97.0     92.0     100.2     114.4     120.3     133.8     140.2     133.2                       Botswana

Burkina Faso                    97.9      81.6     74.2      74.1      73.4      67.3      62.9      66.3      69.6                    Burkina Faso

Burundi                        129.1     150.2    152.8     150.1     142.7     150.1     164.5     170.7     170.7                         Burundi

Cameroon                        97.9      81.6     74.2      74.1      73.4      67.3      62.9      66.3      69.6                      Cameroun

Cape Verde                      97.9      81.6     74.2      74.1      73.4      67.3      62.9      66.3      69.6                        Cap-Vert

Central African Republic        97.9      81.6     74.2      74.1      73.4      67.3      62.9      66.3      69.6        République Centrafricaine

Chad                            97.9      81.6     74.2      74.1      73.4      67.3      62.9      66.3      69.6                          Tchad

Comoros                         97.9      81.6     74.2      74.1      73.4      67.3      62.9      66.3      69.6                        Comores

Congo                           97.9      81.6     74.2      74.1      73.4      67.3      62.9      66.3      69.6                          Congo

Congo, Dem. Republic            97.9      81.6     74.2      74.1      73.4      67.3      62.9      66.3      69.6     Rép. Démocratique du Congo

Côte d'Ivoire                1 588.0   1 857.0   1 829.8   2 170.8   2 145.0   2 367.0   2 561.9   3 709.3   4 149.6                   Côte d'Ivoire

Djibouti                         …         …         …         …         …         …         …         …         …                          Djibouti

Egypt                          129.6     168.5    178.5     166.4     165.1     162.3     156.5     159.7     161.5                          Egypte

Equatorial Guinea               97.9      81.6     74.2      74.1      73.4      67.3      62.9      66.3      69.6              Guinée Equatoriale

Eritrea                        145.0     144.2    143.2     159.7     159.7     159.7     159.7     159.7     159.7                        Erythrée

Ethiopia                       104.3     104.7    105.1     105.5     105.9     109.1     116.8     143.3        …                          Ethiopie

Gabon                           97.9      81.6     74.2      74.1      73.4      67.3      62.9      66.3      69.6                          Gabon

Gambia                         155.8     213.5    234.8     223.5     219.5     194.5     173.5     208.4        0.0                        Gambie

Ghana                          145.4     159.1    165.1     166.3     168.2     171.6     194.1     258.5     262.6                          Ghana

Guinea                         113.1     113.6    127.4     208.6     306.3     236.0     314.8        …         …                          Guinée

Guinea-Bissau                   97.9      81.6     74.2      74.1      73.4      67.3      62.9      66.3      69.6                  Guinée-Bissau

Kenya                          103.4      99.7    103.9      99.2      94.7      88.4      90.8     101.5     104.0                          Kenya

Lesotho                        151.9     109.0     93.1      91.6      97.6     101.5     119.0     122.1     105.5                         Lesotho

Liberia                        150.8     145.0    134.1     139.4     141.7     149.6     154.3     166.7     174.7                          Libéria

Libyan Arab Jamahiriya         248.1     252.4    254.8     255.4     256.5     246.5     238.9     244.7     248.1       Jamahiriya Arabe Libyenne       59
Madagascar                     101.0      91.5    138.1     148.0     158.3     138.4     126.2     144.5     154.4                    Madagascar

Malawi                         128.8     163.6    182.9     198.9     228.4     235.0     236.0     237.1        …                           Malawi

Mali                            97.9      81.6     74.2      74.1      73.4      67.3      62.9      66.3      69.6                            Mali

Mauritania                     113.7     110.1       …      111.1     112.4     108.2      99.7     109.8     114.5                      Mauritanie

Mauritius                      114.1     106.3    104.8     112.4     120.8     119.3     108.4     121.8     117.3                         Maurice

Morocco                        103.7      90.1     83.5      83.4      82.8      77.1      72.9      75.8      79.2                          Maroc

Mozambique                     155.5     156.2    148.3     151.4     166.8     169.7     159.6     180.7     223.0                    Mozambique

Namibia                        151.9     109.0     93.1      91.6      97.6     101.5     119.0     122.1     105.5                        Namibie

Niger                           97.9      81.6     74.2      74.1      73.4      67.3      62.9      66.3      69.6                           Niger

Nigeria                        118.6     127.1    130.7     129.1     126.5     123.7     116.6     146.4     147.8                         Nigéria

Rwanda                         122.0     138.0    148.2     143.1     141.6     140.4     140.3     145.8     149.6                        Rwanda

Sao Tome and Principe          113.9     117.2    124.1     132.3     156.0     169.7     184.2     203.2     231.9            Sao Tomé-et-Principe

Senegal                         97.9      81.6     74.2      74.1      73.4      67.3      62.9      66.3      69.6                        Sénégal

Seychelles                      95.9      94.5     96.3      96.3      96.6     117.3     165.5     238.2     211.2                      Seychelles

Sierra Leone                   100.3     112.2    129.1     138.1     141.6     142.7     142.5     161.8        …                     Sierra Leone

Somalia                          …         …         …         …         …         …         …         …         …                          Somalie

South Africa                   151.9     109.0     93.1      91.6      97.6     101.5     119.0     122.1     105.5                  Afrique du Sud

Sudan                          102.4     101.5    100.3      94.7      84.5      78.4      81.3      89.5        …                          Soudan

Swaziland                      151.9     109.0     93.1      91.6      97.6     101.5     119.0     122.1     105.5                       Swaziland

Tanzania                       120.8     129.7    136.1     141.0     156.4     155.6     149.5     165.0     176.1                       Tanzanie

Togo                            97.9      81.6     74.2      74.1      73.4      67.3      62.9      66.3      69.6                           Togo

Tunisia                        103.7      94.0     90.9      94.7      97.1      93.5      89.9      98.5     104.4                         Tunisie

Uganda                         109.3     119.4    110.1     108.3     111.4     104.8     104.6     123.5     132.4                       Ouganda

Zambia                         141.4     152.2    153.6     143.5     115.8     128.7     120.4     162.2     154.2                         Zambie

Zimbabwe                         …         …         …         …         …         …         …         …         …                       Zimbabwe


                                                                           African Statistical Yearbook 2011 / Annuaire Statistique pour l'Afrique 2011
FINANCE

                                                             3-3. Government Finance - Finances Publiques
          % of GDP                                                                                                                                            % du PIB
                                            Revenue / Recette            Expenditure / Depense           Fiscal Balance / Solde
                                                                                                               budgetaire

         Country                          2005      2009        2010     2005        2009     2010       2005      2009       2010                                 Pays

         Algeria                            40.8     36.7        40.3      27.2       43.5     44.4       13.6       -6.8          -4.1                           Algérie

         Angola                             40.7     30.9        38.8      32.2       39.5       33.9      8.5       -8.6          5.0                            Angola

         Benin                              18.9     21.7        25.4      21.3       25.9       26.9      -2.4      -4.2          -1.5                            Bénin

         Botswana                           34.3     36.6        30.3      33.2       42.2       39.8      1.1       -5.6          -9.5                        Botswana

         Burkina Faso                       17.3     18.6        20.5      22.3       25.0       24.9      -5.0      -6.4          -4.5                     Burkina Faso

         Burundi                            32.5     27.1        30.5      34.7       34.9     33.7        -2.3      -7.8          -3.2                          Burundi

         Cameroon                           18.2     17.1        17.0      14.4       17.5       17.3      3.8       -0.4          -0.4                       Cameroun

         Cape Verde                         30.9     29.3        30.5      35.0       35.7     44.2        -4.1      -6.3         -13.7                         Cap-Vert

         Central African Republic           12.4     16.1        15.6      16.9       15.4     28.7        -4.5       0.7         -13.1         République Centrafricaine

         Chad                               12.7     19.7        20.0      13.0       30.6       32.5      -0.4     -10.9         -12.5                           Tchad

         Comoros                            20.0     22.7        26.8      19.9       22.0     22.7        0.1        0.7          4.1                          Comores

         Congo                              38.8     32.5        51.0      23.2       27.1     21.3       15.6        5.4         29.7                            Congo

         Côte d'Ivoire                      18.1     19.5        19.3      19.0       21.1       21.7      -3.1      -6.4          -2.0                     Côte d'Ivoire

         Democratic Republic of Congo       16.4     24.1        24.8      19.5       30.6     26.9        -0.8      -1.6          -2.5 République Démocratique du Congo

         Djibouti                           37.1     38.7        36.1      36.9       43.8       39.4      0.2       -5.1          -3.3                          Djibouti

         Egypt                              20.4     26.7        18.6      29.4       33.3       26.8      -9.0      -6.6          -8.2                           Egypte

         Equatorial Guinea                  37.1     49.5        51.2      16.0       59.1     49.7       21.1       -9.6          1.5                 Guinée équatoriale

         Eritrea                              ...      ...         ...       ...        ...        ...       ...       ...           ...                        Erythrée

         Ethiopia                           18.9     16.3        15.6      23.1       17.2     16.8        -4.2      -0.9          -1.2                          Ethiopie

         Gabon                              29.8     25.0        26.9      20.4       24.8       27.8      9.4        0.2          -0.9                           Gabon

         Gambia                             15.7     19.0        16.2      22.1       22.0       16.7      -6.3      -3.0          -0.5                          Gambie

         Ghana                              29.1     34.0        32.3      30.7       41.5       43.9      -1.6      -7.6         -11.6                           Ghana

         Guinea                             15.2     16.7        16.7      16.0       25.1       28.7      -0.9      -8.4         -12.0                          Guinée

         Guinea-Bissau                      14.2     16.9        18.0      17.2       19.8     28.1        -2.9      -2.9         -10.1                   Guinée-Bissau

         Kenya                              21.5     23.4        22.2      21.1       26.2       28.6      0.4       -2.8          -6.3                           Kenya

         Lesotho                            52.5     62.4        65.9      44.4       54.0       70.8      8.2        8.4          -4.9                          Lesotho

         Liberia                            14.8     26.7        22.7      14.1       28.3     21.8        0.8       -1.6          0.9                            Libéria

         Libyan Arab Jamahiriya             62.9     60.2        68.3      33.5       53.1     47.4       29.4        7.1         20.9         Jamahiriya Arabe Libyenne

         Madagascar                         12.3     12.1        14.8      21.0       14.6     16.9        -8.7      -2.5          -2.1                      Madagascar
60       Malawi                             26.0     31.3        31.9      29.8       34.8     33.0        -3.8      -3.5          -1.1                           Malawi

         Mali                               19.9     21.3        22.9      24.6       26.0       27.1      -4.7      -4.7          -4.2                             Mali

         Mauritania                         26.6     25.5        23.3      33.7       30.6     27.0        -7.1      -5.1          -3.7                       Mauritanie

         Mauritius                          21.2     19.3        19.1      23.6       26.1     23.6        -2.4      -6.8          -4.5                          Maurice

         Morocco                            25.1     25.9          ...     22.6       27.0         ...     2.5       -1.1            ...                          Maroc

         Mozambique                         20.0     20.0          ...     23.5       22.4         ...     -3.5      -2.3            ...                    Mozambique

         Namibia                            24.0     30.1        25.8      26.9       28.1       28.3      -2.8       2.0          -2.5                          Namibie

         Niger                              18.2     18.9        15.7      20.2       25.5       22.4      -2.0      -6.6          -6.7                            Niger

         Nigeria                            38.1     19.3        20.1      13.0       13.8     13.4       25.1        5.5          6.8                            Nigéria

         Rwanda                             24.0     24.6        25.2      23.7       26.8       25.7      0.3       -2.2          -0.5                          Rwanda

         Sao Tome and Principe              34.3     31.3        32.8      45.2       62.0     42.0       -10.9     -30.7          -9.2             Sao Tomé-et-Principe

         Senegal                            20.8     22.0        23.8      24.0       26.4     29.2        -3.2      -4.5          -5.3                          Sénégal

         Seychelles                         43.0     38.8        34.5      36.0       33.8     32.0        7.0        5.1          2.5                        Seychelles

         Sierra Leone                       23.1     19.8        16.4      23.6       22.9     20.4        -0.5      -3.2          -3.9                     Sierra Leone

         Somalia                              ...      ...         ...       ...        ...        ...       ...       ...           ...                         Somalie

         South Africa                       22.1     25.4        21.8      23.4       26.5       28.1      -1.2      -1.1          -6.3                   Afrique du Sud

         Sudan                              18.3     16.8          ...     10.2       15.5         ...     8.1        1.3            ...                         Soudan

         Swaziland                          35.4     37.9          ...     37.5       37.3         ...     -2.1       0.5            ...                       Swaziland

         Tanzania, United Republic of       17.3     19.7        22.6      19.8       24.1     27.3        -2.5      -4.5          -4.7     Tanzanie, République Unie de

         Togo                               16.9     16.4        21.1      19.7       19.8       20.6      -2.9      -3.5          0.6                              Togo

         Tunisia                            22.2     23.1        23.1      24.5       25.8     25.7        -2.3      -2.7          -2.6                          Tunisie

         Uganda                             17.3     13.6        13.2      18.0       13.5       14.8      -0.7       0.1          -1.6                         Ouganda

         Zambia                             23.3     20.3        16.4      26.0       22.4       19.5      -2.7      -2.1          -3.1                          Zambie

         Zimbabwe                             ...      ...         ...       ...        ...        ...       ...       ...           ...                       Zimbabwe

         Africa                            29.2      26.5       27.5       26.7       31.7    30.8         2.6       -5.2         -3.3                           Afrique


     African Statistical Yearbook 2011 / Annuaire Statistique pour l'Afrique 2011
EXTERNAL SECTOR

                                                               3-4. External Debt - Dette extérieure


                       Debt outstanding      /          Encours de la dette          Debt service         /           Service de la dette
                         (As % of GDP)                              (En % du PIB)    (As % of Exports)                (En % des exportations)

Country                  2000      2006     2007          2008     2009     2010       2000      2006     2007        2008     2009     2010                             Pays

Algeria                    46.1      5.0         4.2        3.5      3.8      3.1        20.3     23.8         2.4      1.8      1.1      2.6                            Algérie

Angola                     99.8     20.7     19.5          19.7     23.7     22.2        36.5      8.7         9.7      4.3     12.5     10.0                            Angola

Benin                      55.9     11.6     12.7          15.7     17.9     20.8        16.8    175.0         9.6      3.2      4.5      6.3                             Bénin

Botswana                   42.7     12.5     10.2           8.5     20.5     18.5        18.5     17.2        16.6      7.2     10.2      9.2                         Botswana

Burkina Faso               62.6     20.0     19.7          19.8     23.1     27.0        20.3      6.2         2.6      6.0      4.8      4.9                      Burkina Faso

Burundi                   155.1    162.0    149.9         129.6     29.3     31.1        70.1     11.5         6.7     10.4      1.9      2.6                           Burundi

Cameroon                   74.3      6.0         5.5        4.9      4.7      5.9        38.2     20.7         7.8      7.3      9.5      7.1                        Cameroun

Cape Verde                 63.9     71.5     67.3          61.1     65.3     65.0        27.8     19.7        16.7     15.5     18.8     21.7                          Cap-Vert

Central African Rep.       87.0     73.8     58.1          52.9     13.3     15.2        13.8     19.6        15.0     19.9     25.7     39.3          République Centrafricaine

Chad                       72.6     28.5     24.7          19.3     23.8     26.5        13.2      2.0         1.5      3.5      2.8      3.0                            Tchad

Comoros                   110.9     71.2     61.7          52.8     51.9     39.5         6.5      6.2        63.3     12.3     10.6      7.4                          Comores

Congo, Republic of        164.9     86.0     94.7          53.1     58.0     16.5         5.2      8.5         6.1      2.5      2.1      9.4                            Congo

Côte d'Ivoire             178.3    107.3     96.6          79.6     77.0     75.0         1.5      9.8        10.9     11.0     10.6     10.9                      Côte d'Ivoire

Congo, Dem. Rep. of       293.0    122.5    129.7         115.9    122.3     26.6        83.6     20.8        14.0     14.1     21.2      2.3 République Démocratique du Congo

Djibouti                   52.0     56.8     63.6          64.1     62.5     58.1         7.6      7.4         7.6      7.2      7.2      7.5                           Djibouti

Egypt                      28.0     27.5     22.9          20.8     16.7     14.1        22.9     15.2        10.5      8.4     12.0      9.7                            Egypte

Equatorial Guinea          34.4      1.8         1.3        0.8      6.3      9.8         0.8      1.2         0.4      0.1      0.2      0.3                Guinée équatoriale

Eritrea                    46.6     59.3     58.0          61.9     47.8     40.8         9.3     30.3        34.9     45.0     35.9     34.1                          Erythrée

Ethiopia                   67.3     41.8     12.1          11.6     14.1     15.5        53.0      4.5         3.6      2.9      2.4      3.8                           Ethiopie

Gabon                      58.3     32.7     35.3          15.7     18.7     14.9        15.5     10.8        10.4     25.4      7.4      6.7                            Gabon

Gambia, The                76.3    101.7     36.2          31.7     34.2     32.5        26.3     31.2        30.5     30.8     30.9     31.2                           Gambie

Ghana                     145.4     31.4     39.2          38.7     50.5     48.0        23.1     11.8         3.7      5.1      4.5      3.8                            Ghana

Guinea                    104.8    108.1     78.3          68.9     68.8     67.4        15.3     12.2        11.1     10.6      8.3     12.2                           Guinée

Guinea-Bissau             205.7     17.7     14.9          12.3     12.7      1.9         2.5      8.6         5.2      2.5      6.4    458.0                    Guinée-Bissau

Kenya                      41.0     27.3     23.2          24.0     26.6     25.0        27.3      8.3         5.0      4.5      5.0      5.4                            Kenya

Lesotho                    80.4     56.1     58.6          45.9     44.5     46.5        19.1      5.6        10.5      3.9      4.3      4.3                           Lesotho

Liberia                   781.0    783.7    427.1         231.6    188.9     11.6         0.0     29.5        26.6    204.4    335.7    126.0                            Libéria

Libya                      13.8     10.1         7.5        6.9      9.4      7.5         0.0      0.0         0.0      0.0      0.0      0.0         Jamahiriya Arabe Libyenne

Madagascar                116.0     31.5     25.9          24.2     26.9     29.3        13.4    133.2         4.4      5.2      6.7      7.1                      Madagascar

Malawi                    153.4     14.5     15.0          16.8     19.1     18.8        19.9     14.3         2.0      1.2      1.2      0.9                            Malawi
                                                                                                                                                                                   61
Mali                      132.5     32.0     30.4          32.8     36.4     43.1        12.0      5.4         3.9      2.6      3.3      2.5                              Mali

Mauritania                249.8     94.1     96.8          82.2    103.2     54.0        13.5      5.5         3.2      3.7      3.7      5.5                        Mauritanie

Mauritius                  24.9     13.1     10.9          12.1     15.1     12.8         7.8      5.7         3.9      3.1      4.5      4.2                           Maurice

Morocco                    48.6     23.9     23.7          20.6     23.2     23.0        32.4     10.8         9.9      7.8      7.5      7.2                            Maroc

Mozambique                143.0     63.2     60.4          48.9     53.0     46.5        74.2     70.7         8.5      8.5     20.0     17.1                      Mozambique

Namibia                    20.4     28.1     25.7          22.3     24.6     19.3        16.0     28.0        30.9     24.7     14.8     10.9                          Namibie

Niger                      88.8     15.8     15.9          14.0     15.8     17.2        73.4      4.4         1.9      1.8      2.0      1.7                             Niger

Nigeria                    65.2      2.4         2.4        2.2      2.6      2.4         6.9     29.5         1.9      0.7      1.0      0.7                            Nigéria

Rwanda                     82.5     15.6     15.3          14.4     14.2     20.2        15.8     26.0         2.4      1.3      1.8      3.0                          Rwanda

São Tomé & Príncipe       400.7    287.6    104.0          63.8     66.7     67.8        21.8     27.5        10.5      5.5      7.9     22.4              Sao Tomé-et-Principe

Senegal                    70.6     24.0     24.0          22.3     29.5     30.3        18.9     14.6         6.5      4.6      5.5      5.4                          Sénégal

Seychelles                 45.2     51.1     69.2          82.4     76.7     47.7         9.6     13.9        10.7      6.8     14.1      8.3                        Seychelles

Sierra Leone              199.5    109.9     31.8          31.1     34.1     29.3        45.9     76.3    144.2         3.2      4.7      4.0                      Sierra Leone

Somalia                      ...      ...         ...        ...      ...      ...         ...      ...         ...      ...      ...      ...                          Somalie

South Africa               27.8     21.9     26.3          26.1     28.0     24.8        52.8     32.6        29.7     38.9     46.6     39.4                    Afrique du Sud

Sudan                     153.7     78.1     68.5          57.7     68.9     58.4         4.5      5.1         1.9      2.5      3.7      5.9                           Soudan

Swaziland                  20.8     15.0     16.6          14.9     16.8     14.6         3.9      1.9         2.0      2.8      2.5      2.8                         Swaziland

Tanzania                   70.2     57.4     27.7          28.2     33.4     30.9        18.5     15.8    131.9         4.3      5.0      3.6      Tanzanie, République Unie de

Togo                        9.6     84.8     83.8          56.3     55.0     12.6         3.3      0.6         0.7      4.1      5.9      6.1                             Togo

Tunisia                    52.9     53.9     51.8          45.9     49.3     44.3        55.7     57.5        45.1     40.1     55.3     58.4                           Tunisie

Uganda                     57.7     40.5     10.8          11.5     14.4     15.0        27.5     17.0    174.7         2.5      1.8      2.8                         Ouganda

Zambia                    224.8      5.0         9.6        8.6     12.3      9.7        15.7      1.6         1.4      1.9      1.9      1.3                           Zambie

Zimbabwe                     ...    80.3     93.3         111.0    121.8    116.7        22.7     24.5        24.9     32.4     26.5     23.5                        Zimbabwe


Africa                    54.4      25.6     23.8          21.1     23.6     20.2        25.8     20.6        12.8     11.0     14.7     12.6                          Afrique


                                                                                       African Statistical Yearbook 2011 / Annuaire Statistique pour l'Afrique 2011
EXTERNAL SECTOR

                                                                    3-5. Balance of payments - Balance des paiements
     As % of GDP                                                                                                                                                                      En % du PIB

                                                                                                      Current account          /
                                 Trade balance            /                    Solde commercial                                           Solde du compte courant
                                                                                                      balance

     Country                       2000      2006        2007        2008        2009       2010         2000      2006       2007        2008      2009     2010                             Pays

     Algeria                         22.5        29.1     25.2         23.4        5.6         6.8         16.7     24.7       22.5        19.8       0.3      5.5                            Algérie

     Angola                          53.4        51.1     50.8         51.0       24.1        33.3          8.7     25.2       15.6         8.5     -10.0      1.0                            Angola

     Benin                           -8.7    -10.5       -14.4        -13.7       -12.5      -11.2         -4.4     -5.7      -10.2         -8.1     -7.7     -7.1                             Bénin

     Botswana                        16.0        16.9     13.9          3.3        -5.9       -1.9          9.7     17.2       15.4         6.9      -5.7      1.5                         Botswana

     Burkina Faso                   -11.9        -8.0     -8.8        -10.9        -5.8       -2.8        -12.2     -9.1       -8.3        -11.7     -4.6     -2.7                      Burkina Faso

     Burundi                         -8.3    -20.5       -24.7        -24.2       -15.6      -19.3         -8.6    -14.7      -15.7        -12.3    -15.5     -9.4                           Burundi

     Cameroon                         5.8         3.7      3.6          2.0        -1.1       -2.7         -1.4      1.2           1.4      -1.9     -3.3     -3.6                        Cameroun

     Cape Verde                     -34.8    -41.7       -49.6        -46.5       -40.0      -43.8        -10.9     -5.4      -14.7        -12.9     -9.9    -18.4                          Cap-Vert

     Central African Rep.             4.6        -3.0     -4.2         -7.6        -7.4       -8.3         -1.4     -3.2       -6.4         -9.9     -9.2     -9.9          République Centrafricaine

     Chad                            -4.1        31.6     26.2         28.8        5.1        12.3        -15.4      5.9       -3.6         3.2     -16.9    -11.3                            Tchad

     Comoros                        -14.7    -21.7       -24.7        -33.4       -25.8      -27.3          1.7     -6.1       -7.6        -11.6     -7.6    -10.2                          Comores

     Congo, Republic of              63.2        52.6     39.7         49.7       36.5        43.8        13.5       1.6      -18.2         -1.1    -20.8     -2.6                            Congo

     Côte d'Ivoire                   13.8        17.9     13.0         14.2       18.2        19.6         -2.8      2.8       -0.7         2.1       7.2      5.9                      Côte d'Ivoire

     Congo, Dem. Rep. of              5.6         0.4      8.9         -1.1        -5.2       -4.4         -4.0     -2.1       -1.5        -15.9    -10.1    -14.3 République Démocratique du Congo

     Djibouti                       -31.5    -43.8       -50.1        -66.9       -50.6      -51.4         -9.0    -14.7      -25.7        -41.8    -17.5     -9.1                           Djibouti

     Egypt                          -11.6    -11.2       -12.5        -14.4       -13.3      -11.5         -1.2      1.6           1.7      0.5      -2.3     -2.0                            Egypte

     Equatorial Guinea               57.5        72.6     68.7         76.6       37.5        43.3        -15.8      9.1           1.1     10.4      -7.6      1.3                Guinée équatoriale

     Eritrea                        -41.3    -29.2       -24.2        -22.0       -17.0      -15.5         -0.6     -3.6       -6.1         -5.5     -5.0     -1.4                          Erythrée

     Ethiopia                       -13.8    -23.7       -20.1        -19.9       -19.5      -22.5         -4.1     -9.1       -4.5         -5.6     -5.0     -6.6                          Ethiopie

     Gabon                           49.8        47.1     47.0         51.8       38.4        46.3         19.7     17.4       17.9        23.5      13.6     14.3                            Gabon

     Gambia, The                     -5.9    -20.8       -20.8        -21.4       -21.0      -22.3         -5.7     -8.8       -9.7        -12.6    -10.1    -12.2                           Gambie

     Ghana                          -16.5    -24.1       -26.5        -31.0       -15.1       -9.2         -7.8     -8.3      -14.6        -22.0     -8.1     -7.6                            Ghana

     Guinea                           2.7         2.6     -0.3         -0.5        -0.2        3.3         -6.4     -7.5      -11.0         -9.4     -9.2     -8.3                           Guinée

     Guinea-Bissau                    1.0        -9.1     -4.1         -8.4        -9.5       -8.2          2.2     -5.6       -5.3         -4.1     -4.1     -5.6                    Guinée-Bissau

     Kenya                          -10.2    -14.5       -15.7        -18.8       -19.5      -20.9         -2.3     -2.1       -3.8         -6.6     -5.3     -7.8                            Kenya

     Lesotho                        -69.2    -48.4       -50.6        -50.9       -54.6      -48.0        -20.6      4.8       13.4         9.4      -0.2    -14.9                           Lesotho

     Liberia                         -6.0    -46.3       -39.3        -53.5       -46.6      -50.2        -24.9    -13.9      -31.4        -57.4    -33.2    -40.9                            Libéria

     Libya                           34.3        49.6     39.2         50.6       25.6        32.9        29.8      46.7       37.5        47.0      18.5     28.4         Jamahiriya Arabe Libyenne

     Madagascar                      -2.7    -10.2       -13.6        -20.2       -19.3      -17.4         -5.8    -10.1      -11.9        -18.7    -20.9    -17.0                      Madagascar
62   Malawi                          -8.0    -24.0       -24.7        -18.6       -17.1      -15.7         -5.3     -7.2       -9.6         -0.3     -2.1      1.1                            Malawi

     Mali                            -1.9         1.2     -4.1         -7.8        -3.0       -1.4         -9.6     -6.3       -9.8        -12.7     -7.5     -8.8                              Mali

     Mauritania                      -9.2         7.4      0.8         -4.3        -2.7       12.0         -9.0     -1.3      -10.5        -15.6    -12.6     -8.8                        Mauritanie

     Mauritius                       -8.5    -16.7       -18.0        -20.6       -17.4      -17.6         -0.7     -9.4       -5.4        -10.1     -7.4     -7.9                           Maurice

     Morocco                         -8.7    -15.0       -22.0        -21.9       -18.1      -21.1         -1.3      2.0       -3.4         -2.5      2.2      4.9                            Maroc

     Mozambique                     -16.6        -7.8     -8.3        -11.6       -13.3      -10.3        -16.7    -16.2      -15.9        -16.4    -11.1    -12.1                      Mozambique

     Namibia                          0.2         2.7     -2.3          0.3        -8.4       -8.9          7.9     15.9           9.4     11.0       1.5     -2.9                          Namibie

     Niger                           -2.9        -6.6     -5.9         -8.1       -11.8      -15.3         -6.7     -8.6       -8.2        -13.0    -23.4    -18.1                             Niger

     Nigeria                         30.4        23.9     23.0         22.7       17.5        22.4         12.5     26.5       18.7        15.4      13.1     13.3                            Nigéria

     Rwanda                          -9.2    -10.0       -10.8        -14.6       -15.8      -18.6         -3.3     -7.1       -2.2         -6.0     -8.4     -6.6                          Rwanda

     São Tomé & Príncipe            -29.3    -41.0       -41.8        -47.6       -37.5      -41.2        -15.1    -28.6      -38.6        -38.4    -26.2    -28.1              Sao Tomé-et-Principe

     Senegal                         -8.8    -17.1       -22.0        -25.6       -19.3      -20.5         -7.0     -9.2      -11.6        -14.2     -7.7     -9.2                          Sénégal

     Seychelles                     -14.8    -28.5       -41.6        -55.1       -33.8      -32.6         -6.1    -13.1      -28.9        -48.8    -30.3    -33.2                        Seychelles

     Sierra Leone                   -10.0        -6.6     -5.7        -10.0        -9.3      -10.0         -8.6     -3.5       -3.4        -11.4     -8.7     -9.0                      Sierra Leone

     Somalia                           ...         ...        ...        ...         ...        ...          ...        ...         ...       ...      ...      ...                          Somalie

     South Africa                     3.5        -1.7     -2.0         -1.6        0.1         0.8         -0.1     -5.3       -7.2         -7.1     -4.1      2.8                    Afrique du Sud

     Sudan                            1.9        -3.5      2.5          5.6        2.1         3.3         -8.4    -15.2      -12.5         -9.1    -10.1     -8.3                           Soudan

     Swaziland                       -9.0        -8.5     -3.3         -0.3        -4.2       -4.1         -4.5     -6.7       -4.6         -2.8    -12.0    -16.6                         Swaziland

     Tanzania                        -6.9    -13.6       -15.7        -16.4       -12.5      -13.2         -4.3     -8.0       -9.4        -11.3     -8.2    -10.3      Tanzanie, République Unie de

     Togo                           -13.6    -15.0       -16.2        -14.7       -12.7      -13.2         -9.0     -8.6       -9.1         -7.4     -6.6     -6.8                             Togo

     Tunisia                        -10.5        -7.3     -7.4         -8.9        -8.5      -10.9         -3.8     -1.8       -2.4         -3.8     -2.8     -4.7                           Tunisie

     Uganda                          -7.5        -8.4     -7.3         -5.6        -7.4       -9.1         -6.5     -2.9       -2.3         -2.2     -3.7     -9.0                         Ouganda

     Zambia                          -6.8        12.2      7.8          2.8        7.1        13.7        -18.3     -0.4       -6.5         -7.1     -3.2     -1.5                           Zambie

     Zimbabwe                          ...       -7.8     -5.2        -18.6       -28.8      -25.9           ...    -6.0       -4.3        -14.9    -16.5    -19.9                        Zimbabwe


     Africa                           5.5        7.9      6.5          7.4         0.3        2.8          3.2      7.3            4.4      4.1      -1.2     0.9                           Afrique


     African Statistical Yearbook 2011 / Annuaire Statistique pour l'Afrique 2011
EXTERNAL SECTOR

                                                                        3-6. Financial Flows - Flux financiers
US $ per Capita                                                                                                                                                           $ EU par habitant

                               Official development    /             Aide publique au      Foreign direct investment/             Investissement direct
                               assistance (ODA)                  développement (APD)       (FDI) inflows                          étranger (IDE) entrant

Country                          2000     2005        2006      2007      2008     2009       2000       2005      2006        2007       2008      2009                              Pays

Algeria                             6.5     11.4        6.8      12.8      10.5     10.5        14.4       35.4         58.9     54.5       86.7      93.3                            Algérie

Angola                             21.2     29.0       11.5      17.3      25.8     16.8        61.5     475.8      634.7       686.0    1,161.2     917.4                            Angola

Benin                              36.6     52.1       56.8      71.2      96.3    102.5         9.0        8.0          8.2     39.2       26.1      13.9                             Bénin

Botswana                           17.8     27.9       39.9      62.5     418.1    162.3        33.2     161.7      282.4       287.1      302.4     136.1                         Botswana

Burkina Faso                       15.4     59.4       74.9      81.5      85.7     92.8         2.0        2.9          2.9     29.4       11.7      14.7                      Burkina Faso

Burundi                            14.4     56.2       66.6      73.4      78.6     84.8         1.8        0.1          0.0       0.1       2.1        1.5                          Burundi

Cameroon                           23.7     26.0      107.4     121.4      34.6     40.9        10.0       14.2         19.5     17.9       17.0      21.3                        Cameroun

Cape Verde                        213.5    369.5      315.4     376.3     505.2    446.4        99.0     185.8      297.6       432.9      482.2     272.4                          Cap-Vert

Central African Republic           20.1     23.6       35.7      47.2      68.5     63.2         0.2        8.7          9.2     15.1       31.3      11.3          République Centrafricaine

Chad                               15.5     45.2       34.3      42.6      49.8     66.8        13.7      -11.8     -33.2         -8.3      27.8      55.0                            Tchad

Comoros                            33.9     41.3       55.5      80.6      67.5     91.7         0.2        1.0          1.0     13.6       13.6      16.5                          Comores

Congo                              10.6    469.6       85.1      39.1     159.8     93.2        53.4     485.8      634.1       749.6      818.1     686.4                            Congo

Côte d'Ivoire                      20.3      5.3       14.3       9.9      36.1    136.9        13.6       18.0         18.5     24.7       27.9      23.7                      Côte d'Ivoire

Democratic Republic of Congo        3.5     37.0       43.2      26.7      34.8     46.3         1.4                     5.0     35.6       34.0      18.7 République Démocratique du Congo

Djibouti                           97.8    101.4      157.6     154.1     165.7    222.3         4.5       80.9     224.2       267.8      320.7     137.1                           Djibouti

Egypt                              18.9     14.2       12.4      15.8      19.2     13.2        17.6       76.6     143.1       165.0      135.3      95.6                            Egypte

Equatorial Guinea                  40.2     72.1       49.6      59.3      60.7     59.7       292.1    1,454.3     887.7      2,349.7   -1,501.0   3,093.7               Guinée équatoriale

Eritrea                            48.1     95.5       34.4      43.3      39.3     39.6         7.6       -0.3          0.1       0.0       -0.1       0.0                         Erythrée

Ethiopia                           10.5     29.4       30.2      39.3      50.8     58.3         2.1        4.0          8.3       3.4       1.7        1.4                          Ethiopie

Gabon                               9.5     49.0       23.6      41.5      50.3     62.9        -34.6    196.5      217.1       218.4      169.5      26.6                            Gabon

Gambia                             38.1     46.4       56.2      56.2      72.1     98.3        33.4       34.3         54.7     58.7       53.9      36.4                           Gambie

Ghana                              30.6     58.8       62.1      59.6      66.8     81.0         8.5        7.4         32.6     43.8       62.5      86.3                            Ghana

Guinea                             18.2     23.6       20.2      27.2      39.1     25.6         1.2       12.5         14.9     46.0       45.6      16.8                           Guinée

Guinea-Bissau                      62.2     50.6       66.7      93.8     101.0    111.6         0.5        6.1         13.3     14.3        4.6      10.7                    Guinée-Bissau

Kenya                              16.2     23.9       30.0      42.1      43.3     56.6         3.5        0.7          1.6     23.2        3.0        4.5                           Kenya

Lesotho                            19.4     35.7       37.4      68.2      76.1     65.2        16.7       30.3         46.9     51.2       29.4      25.4                           Lesotho

Liberia                            23.9     78.8       92.2     248.1     442.4    178.8         7.4       29.3         38.2     46.6       70.8     133.8                            Libéria

Libyan Arab Jamahiriya                       4.4        7.0       3.6      11.3      7.4        26.4     194.2      376.5       877.0      768.9     500.2         Jamahiriya Arabe Libyenne

Madagascar                         21.0     59.8       49.6      58.5      55.2     29.2         5.4        5.6         19.3     50.9       77.2      35.5                      Madagascar

Malawi                             37.7     48.5       59.0      62.9      78.1     65.3         3.3        4.4          6.1       7.8      14.4        5.1                           Malawi
                                                                                                                                                                                                63
Mali                               27.4     66.9       79.0      96.9      91.6     93.6         7.8       21.4          7.8       6.2      17.1      10.4                              Mali

Mauritania                         84.8     71.9       79.7     133.0     122.8    110.1        15.4     312.7          40.5     53.1      130.0      -14.7                       Mauritanie

Mauritius                          16.9     28.4       16.1      57.6      91.8    130.2       231.6       34.8         88.1    283.7      320.4     215.4                           Maurice

Morocco                            14.5     24.0       36.2      37.2      36.9     31.6        14.6       57.4         85.0     97.3       86.3      46.2                            Maroc

Mozambique                         49.7     71.1       88.0      97.4     109.4    110.3         7.6        5.9          8.4     23.4       32.4      48.3                      Mozambique

Namibia                            83.5     68.6       83.2     119.2     115.2    178.8       102.2     190.8      211.9       401.9      394.9     283.1                          Namibie

Niger                              18.9     47.1       47.7      49.1      55.0     42.6         0.8        2.7          4.6     11.7       51.3      67.0                             Niger

Nigeria                             1.4     51.3       91.5      15.7      10.3     13.3        10.5       39.9     111.8        48.8       54.6      46.9                            Nigéria

Rwanda                             40.4     72.5       74.0      90.8     117.3    117.4         1.0        1.8          3.8     10.3       13.0      14.9                          Rwanda

Sao Tome and Principe             249.0    231.5      163.6     256.8     337.8    219.2        27.1     111.8      267.7       251.9      231.9     255.5              Sao Tomé-et-Principe

Senegal                            43.4     70.5       84.7      88.1     107.5    102.8         6.4        5.3         21.3     27.5       27.5      21.0                          Sénégal

Seychelles                        223.1    181.6      168.1     107.6     154.3    286.0       299.9    1,058.6   1,794.5      2,941.1   3,105.9    2,993.8                       Seychelles

Sierra Leone                       42.7     80.3       82.2     129.0      86.8    103.4         9.2       19.7         13.9     22.8       12.5        7.9                     Sierra Leone

Somalia                            13.7     32.0       52.9      52.0     102.5     89.5         0.0        3.2         13.0     19.1       11.8      14.6                           Somalie

South Africa                       10.8     15.4       15.9      18.0      25.1     24.0        19.8     148.1      -11.7       126.9      200.7     126.9                    Afrique du Sud

Sudan                               6.3     52.2       58.6      60.5      68.3     65.6        11.2       66.0     101.5        69.8       74.5      86.9                           Soudan

Swaziland                          12.2     43.2       32.2      46.9      64.7     53.7        98.0      -42.5     112.1        34.7       97.9      60.8                         Swaziland

Tanzania, United Republic of       31.1     43.9       53.9      82.6      68.3     86.0         8.3       14.5         17.5     19.0       19.9      18.9      Tanzanie, République Unie de

Togo                               13.3     15.7       15.1      23.1      62.8     95.1         7.9       14.7         14.7       9.4       4.6        9.6                            Togo

Tunisia                            23.4     38.3       45.6      34.0      35.1     50.1        82.5       82.8     350.0       171.0      291.8     178.5                           Tunisie

Uganda                             34.9     48.8       63.6      71.1      67.2     73.1         7.4       15.5         26.4     30.0       32.2      32.7                         Ouganda

Zambia                             75.9    112.0      138.4      96.3     106.6    121.2        11.6       34.1         58.8    126.5       89.7      91.7                           Zambie

Zimbabwe                           14.1     29.9       22.3      38.4      49.2     59.2         1.9        8.3          3.2       5.5       4.1        4.8                       Zimbabwe


Africa                              19        43           53     47         53      57         12.0      46.7      67.7         77.1       88.2      71.6                          Afrique


                                                                                               African Statistical Yearbook 2011 / Annuaire Statistique pour l'Afrique 2011
EXTERNAL SECTOR

                              3-7. Intra-African Trade by Economic Grouping in 2009 - Commerce intra-africain par zone économique en 2009


                             AMU          CAEMC                   ECCAS   ECOWAS              FRANC ZONE                 WAEMU         AFRICA     WORLD
     Economic Grouping                               COMESA                                                      SADC                                            Zone économique
                                   UMA      CEMAC                   CEEAC     CEDEAO           ZONE FRANC                 UEMOA         AFRIQUE    MONDE

                                                                                                                                                             <===== Exportations
     Exports to =====>                                         (Millions of US $)         /        (Millions de $ EU)
                                                                                                                                                                              vers

     AMU                           3422       187       1854            227             761           735          92            546       5277     109422                    UMA

     CAEMC                          101       300         64            364             279           400         175            100        864      25630                  CEMAC

     COMESA                        2825        87       6091           1386             356           231        3681            129      10393      85890                COMESA

     ECCAS                          118       313        745            440             292           415        2134            101       3020      64560                  CEEAC

     ECOWAS                         288      1196        138           1374          7312            5243        2377           4047      11219      73577                 CEDEAO

     FRANC ZONE                     346       663        180            849          4244            2690         359           2027       5649      40281             ZONE FRANC

     SADC                           381       196       8068           2130          1552             564       15390            354      19253     111066                   SADC

     WAEMU                          245       363        116            486          3964            2290         185           1927       4785      14623                  UEMOA

     AFRICA                        6183      1952      14269           4930         10216            7100       19180           5123      43141     358585                AFRIQUE

     WORLD                     103537       11982     115046         32397          82367           36622      108388          24479     386218   12360200                 MONDE
                                                                                                                                                             <===== Exportations
     Exports to =====>                                (% of Total Exports)          /           (% des exportations totales)
                                                                                                                                                                              vers

     AMU                            3.1       0.2        1.7            0.2             0.7           0.7          0.1           0.5        4.8      100.0                    UMA

     CAEMC                          0.4       1.2        0.3            1.4             1.1           1.6          0.7           0.4        3.4      100.0                  CEMAC

     COMESA                         3.3       0.1        7.1            1.6             0.4           0.3          4.3           0.2       12.1      100.0                COMESA

     ECCAS                          0.2       0.5        1.2            0.7             0.5           0.6          3.3           0.2        4.7      100.0                  CEEAC

     ECOWAS                         0.4       1.6        0.2            1.9             9.9           7.1          3.2           5.5       15.2      100.0                 CEDEAO

     FRANC ZONE                     0.9       1.6        0.4            2.1          10.5             6.7          0.9           5.0       14.0      100.0             ZONE FRANC

     SADC                           0.3       0.2        7.3            1.9             1.4           0.5         13.9           0.3       17.3      100.0                   SADC

     WAEMU                          1.7       2.5        0.8            3.3          27.1            15.7          1.3          13.2       32.7      100.0                  UEMOA

     AFRICA                         1.7       0.5        4.0            1.4             2.8           2.0          5.3           1.4       12.0      100.0                AFRIQUE

     WORLD                          0.8       0.1        0.9            0.3             0.7           0.3          0.9           0.2        3.1      100.0                 MONDE


                             AMU          CAEMC                   ECCAS   ECOWAS              FRANC ZONE                 WAEMU         AFRICA     WORLD
     Economic Grouping                               COMESA                                                      SADC                                            Zone économique
                                   UMA      CEMAC                   CEEAC     CEDEAO           ZONE FRANC                 UEMOA         AFRIQUE    MONDE

                                                                                                                                                             =====> Importations
     Imports <===== from                                       (Millions of US $)         /        (Millions de $ EU)
                                                                                                                                                                               de

     AMU                           3765       111       3207            130             308           373         392            261       6868     115616                    UMA

     CAEMC                          206       331         91            345             879           730         228            399       1719      12977                  CEMAC

64   COMESA                        1897        73       6679            816             152           201        9136            127      15786     119652                COMESA

     ECCAS                          251       402       1517            485          1072             935        2354            532       4992      35478                  CEEAC

     ECOWAS                         836       252        391            267          7950            4515        1759           4263      11139      97775                 CEDEAO

     FRANC ZONE                     807       441        249            457          5232            2862         658           2421       7305      38439             ZONE FRANC

     SADC                            83       164       3750           2312          2602             353       13029            190      17107     124135                   SADC

     WAEMU                          600       110        141            112          4353            2132         414           2022       5561      25280                  UEMOA

     AFRICA                        5642       867      11268           3226         11789            6011       17542           5143      43043     430618                AFRIQUE

     WORLD                     119139       27133      92863         69904          77282           41436      129541          14272     395637   12743400                 MONDE
                                                                                                                                                             =====> Importations
     Imports <===== from                              (% of Total Imports)          /           (% des importations totales)
                                                                                                                                                                               de

     AMU                            3.3       0.1        2.8            0.1             0.3           0.3          0.3           0.2        5.9      100.0                    UMA

     CAEMC                          1.6       2.5        0.7            2.7             6.8           5.6          1.8           3.1       13.2      100.0                  CEMAC

     COMESA                         1.6       0.1        5.6            0.7             0.1           0.2          7.6           0.1       13.2      100.0                COMESA

     ECCAS                          0.7       1.1        4.3            1.4             3.0           2.6          6.6           1.5       14.1      100.0                  CEEAC

     ECOWAS                         0.9       0.3        0.4            0.3             8.1           4.6          1.8           4.4       11.4      100.0                 CEDEAO

     FRANC ZONE                     2.1       1.1        0.6            1.2          13.6             7.4          1.7           6.3       19.0      100.0             ZONE FRANC

     SADC                           0.1       0.1        3.0            1.9             2.1           0.3         10.5           0.2       13.8      100.0                   SADC

     WAEMU                          2.4       0.4        0.6            0.4          17.2             8.4          1.6           8.0       22.0      100.0                  UEMOA

     AFRICA                         1.3       0.2        2.6            0.7             2.7           1.4          4.1           1.2       10.0      100.0                AFRIQUE

     WORLD                          0.9       0.2        0.7            0.5             0.6           0.3          1.0           0.1        3.1      100.0                 MONDE


      African Statistical Yearbook 2011 / Annuaire Statistique pour l'Afrique 2011
65


African Statistical Yearbook 2011 / Annuaire Statistique pour l'Afrique 2011
4
66


     Section

 Economic Infrastructure and Investment Climate
Infrastructures économiques et climat des affaires


       African Statistical Yearbook 2011 / Annuaire Statistique pour l'Afrique 2011
ECONOMIC INFRASTRUCTURE / INFRASTRUCTURE ECONOMIQUE

                                             4-1. Tourism and Infrastructure / Tourisme et Infrastructure

                           Arrival of tourists       Paved (% of          Main Telephone Lines per     Mobile Cellular Subscribers
                             (Thousands) /          total) Routes         1,000 inhabitants/ Lignes      per 1,000 inhabitants/
                              Arrivée des           asphaltées (%         téléphoniques fixes pour      Abonnés aux téléphones
                           touristes (Milliers)        du total)               1000 habitants          mobiles pour 1000 habitants

                                                    Year/
Country                       2003        2009                    %         2003              2009         2003             2009                          Pays
                                                    A    é
Algeria                       1 166       1 912         2008     73.5         65.2              73.8         45.4            937.9                        Algérie

Angola                          107         366         2001     10.4          5.4              16.4         22.4            438.4                        Angola

Benin                           175         190         2004      9.5          9.0              14.2         32.1            563.3                         Bénin

Botswana                       1 406       1 553        2005     32.6         73.3              70.5        248.1            961.2                     Botswana

Burkina Faso                    163         269         2004      4.2          5.2               9.7         18.5            242.7                  Burkina Faso

Burundi                           74          ...       2008     31.7          3.4               3.8          9.2            101.0                       Burundi

Cameroon                          ...         ...       2004      8.4          5.7              22.3         63.3            410.0                    Cameroun

Cape Verde                      150         287         2000     69.0        155.1             142.2        115.3            574.8                      Cap-Vert

Central African Republic           6         52         2009      3.4          2.4               2.7         10.1            135.7      République Centrafricaine

Chad                              21          ...       2006      0.8          1.3               5.2          6.9            203.6                        Tchad

Comoros                           21          ...       2009      0.8         22.5              31.8          3.4            184.9                      Comores

Congo                             35         53         2009      6.0          2.1               6.6        101.2            589.4                        Congo

Congo, Dem. Republic              23         85         2006      7.1          0.2               0.6         22.4            143.3   Rép. Démocratique du Congo

Côte d'Ivoire                     ...         ...       2009      7.9         12.9              13.4         69.4            625.6                  Côte d'Ivoire

Djibouti                          23          ...       2009     16.0         13.1              19.5         29.6            149.0                       Djibouti

Egypt                          5 746      11 914        2008     86.9        117.6             124.2         78.0            666.9                        Egypte

Equatorial Guinea                 ...         ...       2000        ...       16.7              14.8         72.0            295.7            Guinée Equatoriale

Eritrea                           80         79         2000     21.8          9.2               9.6          0.0             27.8                      Erythrée

Ethiopia                        180           ...       2007     13.7          5.7              11.0          0.7             48.9                       Ethiopie

Gabon                           222           ...       2004     10.2         29.2              18.0        228.0            931.1                        Gabon

Gambia                            89        142         2007     20.7         29.2              28.7        103.9            840.4                       Gambie

Ghana                           531         803         2005     14.9         13.9              11.2         38.0            633.8                        Ghana

Guinea                            44          ...       2003      9.8          2.9               2.2         12.6            346.5                       Guinée

Guinea-Bissau                     ...         ...       2009     37.8          7.5               3.0          0.9            347.9                Guinée-Bissau

Kenya                           927        1 392        2009     14.0          9.7              16.7         46.8            486.5                        Kenya

Lesotho                           ...       320         2009     19.8         17.9              19.4         64.3            319.8                       Lesotho

Liberia                           ...         ...       2000      6.2           …                0.5         15.1            212.9                        Libéria

Libyan Arab Jamahiriya            ...         ...       2009     44.0        131.9             171.5         22.3            779.4     Jamahiriya Arabe Libyenne

Madagascar                      139         163         2004     20.3          3.6               9.5         17.0            320.2                  Madagascar
                                                                                                                                                                    67
Malawi                          424         755         2009     26.0          6.6              11.5         10.5            157.2                        Malawi

Mali                            110         160         2009     31.7          5.4               6.5         21.9            341.7                          Mali

Mauritania                        ...         ...       2007     58.5         13.5              22.6        124.0            663.2                    Mauritanie

Mauritius                       702         871         2009    100.0        282.9             296.3        375.7            843.6                       Maurice

Morocco                        4 761       8 341        2009     61.6         40.9             109.9        246.8            791.1                        Maroc

Mozambique                      441        2 224        2008     20.8          3.9               3.2         22.0            260.8                  Mozambique

Namibia                         695           ...       2002     12.8         65.8              65.4        115.6            560.5                      Namibie

Niger                             55          ...       2007     20.7          1.9               4.3          6.7            170.0                         Niger

Nigeria                         924           ...       2005     30.8          6.6               9.2         23.5            481.6                        Nigéria

Rwanda                            ...       699         2004     19.0          2.9               3.3         15.1            243.0                      Rwanda

Sao Tome and Principe             10         15         2000     68.1         47.2              47.9         32.6            393.2          Sao Tomé-et-Principe

Senegal                         495           ...       2006     29.3         21.4              22.2         73.1            550.6                      Sénégal

Seychelles                      122         158         2007     96.5        257.7             309.5        598.6           1313.6                    Seychelles

Sierra Leone                      38          ...       2002      8.0          5.3               5.8         23.9            203.6                  Sierra Leone

Somalia                           ...         ...       2000     11.8         12.5              10.9         25.1             70.2                       Somalie

South Africa                   6 505       9 934        2001     17.3        102.9              86.2        359.9            926.7                Afrique du Sud

Sudan                             52        420         2009     32.0         25.2               8.8         14.2            362.9                       Soudan

Swaziland                       461         908         2009     37.6         41.7              37.1         76.7            553.6                     Swaziland

Tanzania                        552         714         2008      7.4          4.0               4.0         52.6            399.4                     Tanzanie

Togo                              61        150         2007     21.0         10.7              27.0         42.8            330.5                         Togo

Tunisia                        5 114       6 901        2008     75.2        119.9             124.5        197.6            953.8                       Tunisie

Uganda                          305         817         2003     23.0          2.3               7.1         28.9            286.9                     Ouganda

Zambia                          413         710         2009     11.2          7.9               7.0         21.5            340.7                       Zambie

Zimbabwe                       2 256          ...       2002     19.0         24.1              30.8         29.1            238.8                    Zimbabwe

Africa                            ...         ...         ...      ...        28.0              31.2         60.4           438.6                       Afrique


                                                                                     African Statistical Yearbook 2011 / Annuaire Statistique pour l'Afrique 2011
DOING BUSINESS IN 2010 / CLIMAT DES AFFAIRES EN 2010

                                          5-1. Doing Business in 2010 (Rank over 183countries )/ Climat des affaires en 2010 (Rang sur 183 pays)


                                     Ease of Doing       Dealing with    Enforcing    Registering          Getting        Protecting         Paying        Trading Across    Closing a
                                       Business            Licenses      Contracts     Property             Credit         Investors          Taxes           Borders        Business


                                      Facilité de                        Exécution                                        Protection        Paiement                         Fermeture
                                                                                     Enregistrement       Obtention                                          Commerce
                                       faire des          Agréments         des                                              des               des                             d'une
                                                                                        de biens          de crédits                                       transfrontalier
                                        affaires                          contrats                                       investisseurs       impôts                          entreprise


          Country                                                                                                                                                                                               Pays

          Algeria                               136                113         127                  165          138                   74         168                  124           51                        Algérie

          Angola                                163                128         181                  174          116                   59         142                  166          147                        Angola

          Benin                                 170                125         177                  129          152               154            167                  127          118                          Bénin

          Botswana                                  52             127          70                   44           46                   44             21               151           27                     Botswana

          Burkina Faso                          151                 77         108                  118          152               147            148                  175          100                  Burkina Faso

          Burundi                               181                175         171                  115          168               154            141                  176          183                        Burundi

          Cameroon                              168                118         173                  149          138               120            169                  155          141                     Cameroun

          Cape Verde                            132                 89          38                  104          152               132            100                   55          183                      Cap-Vert

          Central African Republic              182                148         173                  141          138               132            182                  182          183      République Centrafricaine

          Chad                                  183                101         164                  137          152               154            179                  171          183                         Tchad

          Comoros                               159                 68         152                   99          168               132                96               135          183                      Comores

          Congo                                 177                 83         158                  133          138               154            180                  180          128                         Congo

          Congo, Dem. Republic                  175                 81         172                  118          168               154            163                  172          155   Rép. Démocratique du Congo

          Côte d'Ivoire                         169                165         126                  151          152               154            153                  160           76                   Côte d'Ivoire

          Djibouti                              158                125         160                  140          176               179                60                38          137                        Djibouti

          Egypt                                     94             154         143                   93           72                   74         136                   21          131                        Egypte

          Equatorial Guinea                     164                109          72                   79          138               147            170                  137          183            Guinée Equatoriale

          Eritrea                               180                183          48                  178          176               109            113                  165          183                       Erythrée

          Ethiopia                              104                 53          57                  109          128               120                47               157           82                       Ethiopie

          Gabon                                 156                 67         148                  132          138               154            140                  134          139                         Gabon

          Gambia                                146                 80          67                  121          138               173            176                   87          121                       Gambie

          Ghana                                     67             151          45                   36           46                   44             78                89          109                         Ghana

          Guinea                                179                171         130                  166          168               173            173                  129          123                        Guinée

          Guinea-Bissau                         176                103         139                  175          152               132            133                  117          183                Guinée-Bissau

          Kenya                                     98              35         125                  129              6                 93         162                  144           85                         Kenya

          Lesotho                               138                163         116                  146          128               147                64               140           69                       Lesotho

          Liberia                               155                135         166                  176          138               147                84               116          148                         Libéria

          Libyan Arab Jamahiriya                                                                                                                                                            Jamahiriya Arabe Libyenne

          Madagascar                            140                110         153                  162          176                   59             72               106          183                   Madagascar
68        Malawi                                133                174         121                   81          116                   74             25               173          126                        Malawi

          Mali                                  153                 87         133                   88          152               147            159                  154          106                           Mali

          Mauritania                            165                153          83                   73          152               147            172                  163          144                     Mauritanie

          Mauritius                                 20              39          61                   69           89                   12             12                22           71                       Maurice

          Morocco                               114                 98         106                  124           89               154            124                   80           59                         Maroc

          Mozambique                            126                155         132                  144          128                   44         101                  133          129                  Mozambique

          Namibia                                   69              36          41                  136           15                   74             99               153           53                       Namibie

          Niger                                 173                162         138                   84          152               154            144                  174          136                          Niger

          Nigeria                               137                167          97                  179           89                   59         134                  146           99                        Nigéria

          Rwanda                                    58              82          39                   41           32                   28             43               159          183                       Rwanda

          Sao Tome and Principe                 178                113         179                  161          176               154            135                   92          183          Sao Tomé-et-Principe

          Senegal                               152                117         148                  167          152               167            170                   67           79                       Sénégal

          Seychelles                                95              61          69                   62          152                   59             38                36          183                    Seychelles

          Sierra Leone                          143                166         144                  169          128                   28         159                  136          149                  Sierra Leone

          Somalia                                                                                                                                                                                             Somalie

          South Africa                              34              52          85                   91              2                 10             24               149           74                Afrique du Sud

          Sudan                                 154                139         146                   40          138               154                94               143          183                        Soudan

          Swaziland                             118                 40         170                  156           46               120                52               147           63                     Swaziland

          Tanzania                              128                179          32                  151           89                   93         120                  109          113                      Tanzanie

          Togo                                  160                152         151                  158          152               147            157                   93           84                          Togo

          Tunisia                                   55             106          78                   64           89                   74             58                30           37                        Tunisie

          Uganda                                122                133         113                  150           46               132                62               148           56                      Ouganda

          Zambia                                    76             158          86                   83              6                 74             37               150           97                        Zambie

          Zimbabwe                              157                172         110                   82          128               120            131                  168          156                     Zimbabwe


     African Statistical Yearbook 2011 / Annuaire Statistique pour l'Afrique 2011
69


African Statistical Yearbook 2011 / Annuaire Statistique pour l'Afrique 2011
5
70


     Section

                     Millennium Development Goals
      Objectifs du millénaire pour le développement


       African Statistical Yearbook 2011 / Annuaire Statistique pour l'Afrique 2011
MILLENIUM DEVELOPMENT GOALS - OBJECTIFS DU MILLENAIRE POUR LE DEVELOPPEMENT


                                       Goal 1. Eradicate Extreme Poverty and Hunger/ Eradiquer la pauvreté extrême et la faim


                                                                                         Share of Income or                                    Prevalence of
                       People Living below $ 1 a
                                                         Poverty Gap at $1 a day        Consumption Held by          GINI Index            undernourishment in
                                  day
                                                                                            Poorest 20%                                       total population


                                                                                                                                             Prévalence de la
                         Population vivant en             Ecart de pauvreté au          % du revenu/consom.
                                                                                                                    Indice de GINI          malnutrition dans la
                         dessous d'1$ par jour             seuil de 1$ par jour         des 20% les + pauvres
                                                                                                                                           population totale (%)


                                                                                                                                                                                             Pays
Country                       year                %            year           %               year           %        year        %        2000-02 2005-2007

Algeria                        2000               0.9           2000          1.4              2000          6.9      2007      35.3             5.0             ...                        Algérie

Angola                         2000              54.3           2000         29.9              2000          2.0      2007        …             52.0         41.0                           Angola

Benin                          2003              47.3           2003         15.7              2003          6.9      2007      36.5            15.0         12.0                            Bénin

Botswana                       1994              31.2           1994         11.0              1994          3.1      2007      60.5            27.0         25.0                        Botswana

Burkina Faso                   2003              56.5           2003         20.3              2003          7.0      2007      39.5            12.0          9.0                     Burkina Faso

Burundi                        2006              81.3           2006         36.4              2006          9.0      2007      42.4            59.0         62.0                          Burundi

Cameroon                       2001              32.8           2001         10.2              2001          5.6      2007      44.6            26.0         21.0                       Cameroun

Cape Verde                     2001              20.6           2001          5.9              2001          4.4      2007        …             15.0         10.0                         Cap-Vert

Cent. Afr. Rep.                2003              62.4           2003         28.3              2003          5.2      2007      61.3            43.0         40.0         République Centrafricaine

Chad                           2003              61.9           2003         25.6              2003          6.3      2007        …             43.0         37.0                            Tchad

Comoros                        2004              46.1           2004         20.8              2004          2.6      2007        …             54.0         46.0                         Comores

Congo                          2005              54.1           2005         22.8              2005          5.0      2007        …             20.0         15.0                           Congo

Congo, Dem. Republic           2006              59.2           2006         25.3              2006          5.5      2007        …             70.0         69.0      Rép. Démocratique du Congo

Côte d'Ivoire                  2002              23.3           2002          6.8              2002          5.0      2007      44.6            17.0         14.0                      Côte d'Ivoire

Djibouti                       2002              18.8           2002          5.3              2002          6.0      2007        0.0           40.0         28.0                           Djibouti

Egypt                          2000               2.0           2005          0.5              2005          9.0      2007      34.4              ...            ...                        Egypte

Equat. Guinea                    …                …               …               …              ...          ...     2007        …               ...            ...            Guinée Equatoriale

Eritrea                          …                …               …               …              ...          ...     2007        …             70.0         64.0                          Erythrée

Ethiopia                       2005              39.0           2005          9.6              2005          9.3      2007      30.0            48.0         41.0                          Ethiopie

Gabon                          2005               4.8           2005          0.9              2005          6.1      2007        …               ...            ...                        Gabon

Gambia                         2003              34.3           2003         12.1              2003          4.8      2007      50.2            21.0         19.0                          Gambie

Ghana                          2006              30.0           2006         10.5              2006          5.2      2007      40.8             9.0          5.0                           Ghana

Guinea                         2003              70.1           2003         32.2              2003          5.8      2007      38.6            20.0         17.0                           Guinée

Guinea Bissau                  2002              48.8           2002         16.5              2002          7.2      2007      47.0            25.0         22.0                    Guinée-Bissau

Kenya                          2005              19.7           2005          6.1              2005          4.7      2007      42.5            32.0         31.0                            Kenya

Lesotho                        2003              43.4           2003         20.8              2003          3.0      2007      63.2            14.0         14.0                          Lesotho

Liberia                        2007              83.7           2007         40.8              2007          6.4      2007        …             36.0         33.0                           Libéria

Libya                            …                …               …               …              ...          ...     2007        …               ...            ...     Jamahiriya Arabe Libyenne     71
Madagascar                     2005              67.8           2005         26.5              2005          6.2      2007      47.5            28.0         25.0                      Madagascar

Malawi                         2004              73.9           2004         32.3              2004          7.0      2007      39.0            30.0         28.0                           Malawi

Mali                           2006              51.4           2006         18.8              2006          6.5      2007      40.1            18.0         12.0                              Mali

Mauritania                     2000              21.2           2000          5.7              2000          6.2      2007      39.0             8.0          7.0                        Mauritanie

Mauritius                        …                …               …               …              ...          ...     2007        …              5.0          5.0                          Maurice

Morocco                        2007               2.5           2007          0.5              2007          6.5      2007      39.5             6.0             ...                         Maroc

Mozambique                     2003              74.7           2003         35.4              2003          5.4      2007      47.3            46.0         38.0                     Mozambique

Namibia                        1993              49.1           2004         24.6              2004          1.5      2007      74.3            21.0         19.0                          Namibie

Niger                          2005              65.9           2005         28.1              2005          5.9      2007      50.5            27.0         20.0                             Niger

Nigeria                        2004              64.4           2004         29.6              2004          5.1      2007      43.7             9.0          6.0                           Nigéria

Rwanda                         2000              76.6           2006         38.2              2006          5.4      2007      46.8            38.0         34.0                          Rwanda

São T. & Principe              1987              36.0             …               …              ...          ...     2007        …              8.0             ...          Sao Tomé-et-Principe

Senegal                        2005              33.5           2005         10.8              2005          6.2      2007      41.3            26.0         17.0                          Sénégal

Seychelles                       …                …               …               …              ...          ...     2007        …              8.0          7.0                       Seychelles

Sierra Leone                   2003              53.4           2003         20.3              2003          6.1      2007      62.9            43.0         35.0                     Sierra Leone

Somalia                          …                …               …               …              ...          ...     2007        …               ...            ...                       Somalie

South Africa                   2000              26.2           2000          8.2              2000          3.1      2007      57.8              ...            ...                Afrique du Sud

Sudan                            …                …               …               …              ...          ...     2007        …             28.0         22.0                          Soudan

Swaziland                      2001              62.9           2001         29.4              2001          4.5      2007      50.4            18.0         18.0                        Swaziland

Tanzania                       2000              88.5           2000         46.8              2000          7.3      2007      34.6            39.0         34.0                         Tanzanie

Togo                           2006              38.7           2006         11.4              2006          7.6      2007        …             36.0         30.0                             Togo

Tunisia                        2000               2.6           2000          0.5              2000          5.9      2007      39.8              ...            ...                        Tunisie

Uganda                         2005              51.5           2005         19.1              2005          6.1      2007      45.7            19.0         21.0                         Ouganda

Zambia                         2004              64.3           2004         32.8              2004          3.6      2007      50.8            43.0         43.0                          Zambie

Zimbabwe                       2004              61.9           2004         24.2              1995          4.6      2007      50.1            41.0         30.0                        Zimbabwe


Africa                           ...               ...            ...             ...            ...          ...        ...         ...       28.9          27.2                          Afrique


                                                                                                       African Statistical Yearbook 2011 / Annuaire Statistique pour l'Afrique 2011
MILLENIUM DEVELOPMENT GOALS - OBJECTIFS DU MILLENAIRE POUR LE DEVELOPPEMENT

                                             Goal 2. Achieve universal primary education/ Assurer l'éducation primaire pour tous


                                         Net Primary Enrolment Ratios                 % of Cohort Reaching Grade 5              Youth Literacy Rates (% 15-24)


                                                                                    % de la cohorte atteignant la 5ème
                                     Taux net de scolarisation au primaire                                                      Taux d'alphabétisation des jeunes
                                                                                              année d'études

                                          (percentage/pourcentage)                                                              (% of ages 15-24/% des 15-24
                                                                                                                                             ans)
                                                                    Target/Cible                                Target/Cible                              Target/Cible


                                                                                                                                                                                                Pays
        Country                            1990        2006-10           2015             1990 2007-09               2015           1990 2006-08               2015
        Algeria                              87.5            93.8         100.0             79.5       94.5           100.0           77.6        91.8          100.0                          Algérie

        Angola                                 ...             …              ...           34.7          ...         100.0             ...       72.9          100.0                          Angola

        Benin                                41.2            94.7         100.0             20.7          ...         100.0           44.2        53.3          100.0                           Bénin

        Botswana                             86.9            86.9         100.0             89.5          ...         100.0           83.3        95.1          100.0                       Botswana

        Burkina Faso                           ...           63.3         100.0             19.5       75.1           100.0           24.9        39.3          100.0                    Burkina Faso

        Burundi                                ...           98.9         100.0             45.9       72.6           100.0           51.8        75.9          100.0                         Burundi

        Cameroon                             71.1            91.6         100.0             53.0       77.7           100.0           87.4        85.8          100.0                      Cameroun

        Cape Verde                           92.7            82.6         100.0               ...      89.7           100.0           82.2        98.0          100.0                        Cap-Vert

        Cent. Afr. Rep.                      57.9            66.7         100.0             26.7       53.6           100.0           52.0        64.2          100.0        République Centrafricaine

        Chad                                   ...             …          100.0             17.9          ...         100.0           48.0        45.4          100.0                          Tchad

        Comoros                                ...           87.3         100.0               ...         ...         100.0           61.9        84.9          100.0                        Comores

        Congo                                  ...           58.9         100.0             54.3       76.9           100.0           92.5          ...         100.0                          Congo

        Congo, Dem. Republic                   ...             …          100.0             45.9       77.6           100.0           68.9        65.3          100.0     Rép. Démocratique du Congo

        Côte d'Ivoire                          ...           57.2         100.0             43.4       66.1           100.0           50.2        66.1          100.0                    Côte d'Ivoire

        Djibouti                             29.3            44.4         100.0             26.9       64.3           100.0           73.2          ...         100.0                         Djibouti

        Egypt                                  ...           93.6         100.0               ...         ...         100.0           61.4        84.9          100.0                          Egypte

        Equat. Guinea                          ...           53.5         100.0               ...      60.9           100.0           92.7        97.8          100.0              Guinée Equatoriale

        Eritrea                                ...           35.7         100.0               ...      73.1           100.0           60.9        87.8          100.0                        Erythrée

        Ethiopia                               ...           82.7         100.0               ...      45.9           100.0           42.2        49.9          100.0                         Ethiopie

        Gabon                                  ...             …          100.0               ...         ...             ...           ...       97.4              ...                        Gabon

        Gambia                               51.4            67.2         100.0               ...      71.5               ...         42.2        64.1          100.0                         Gambie

        Ghana                                  ...           75.9         100.0             61.2       79.0           100.0           81.6        79.3          100.0                          Ghana

        Guinea                               24.9            72.9         100.0             17.4       68.6           100.0             ...       58.7          100.0                         Guinée

        Guinea Bissau                          ...             …              ...             ...         ...             ...         45.4        69.6          100.0                  Guinée-Bissau

        Kenya                                  ...           82.6         100.0               ...         ...         100.0           89.8        92.3          100.0                          Kenya

        Lesotho                              70.7            73.1         100.0             58.9          ...         100.0           87.0        91.9          100.0                         Lesotho

        Liberia                                ...             …          100.0               ...      59.8               ...         57.7        74.8          100.0                          Libéria
72
        Libya                                  ...             …              ...             ...         ...             ...         91.1        99.8          100.0       Jamahiriya Arabe Libyenne

        Madagascar                           70.3            98.5         100.0             33.3       49.4           100.0           72.2        70.2          100.0                    Madagascar

        Malawi                                 ...           90.8         100.0             28.7       50.7           100.0           63.2        85.7          100.0                          Malawi

        Mali                                   ...           72.9         100.0             12.6       86.9           100.0           45.3        38.8          100.0                            Mali

        Mauritania                             ...           76.3         100.0             34.1       49.4           100.0           45.8        67.0          100.0                      Mauritanie

        Mauritius                            97.2            94.0         100.0            106.6       97.2           100.0           91.2        96.4          100.0                         Maurice

        Morocco                              56.2            89.7         100.0             48.1       84.2           100.0           55.3        76.6          100.0                          Maroc

        Mozambique                           44.0            92.3         100.0             26.4       53.7           100.0           48.8        69.9          100.0                    Mozambique

        Namibia                              79.1            89.1         100.0               ...      91.5           100.0           87.4        92.9          100.0                         Namibie

        Niger                                22.8            57.4         100.0             17.6       64.3           100.0           17.0          ...         100.0                           Niger

        Nigeria                                ...           61.4         100.0               ...         ...         100.0           73.5        71.5          100.0                          Nigéria

        Rwanda                                 ...           95.9         100.0             35.4       48.5           100.0           72.6        77.1          100.0                         Rwanda

        São T. & Principe                    96.0            98.4         100.0               ...      79.2           100.0             ...       95.2          100.0            Sao Tomé-et-Principe

        Senegal                              45.1            73.1         100.0               ...      69.8           100.0           40.1        50.9          100.0                         Sénégal

        Seychelles                             ...           94.4         100.0               ...      94.9           100.0             ...       99.1          100.0                      Seychelles

        Sierra Leone                           ...             …              ...             ...         ...             ...           ...       55.7          100.0                    Sierra Leone

        Somalia                                ...             …              ...             ...         ...             ...           ...         ...             ...                       Somalie

        South Africa                           ...           84.7         100.0             75.8          ...         100.0           88.5        96.8          100.0                  Afrique du Sud

        Sudan                                  ...             …              ...           42.0       86.0           100.0           65.1        85.2          100.0                         Soudan

        Swaziland                            74.3            82.8         100.0             59.9          ...         100.0           85.1        93.2          100.0                       Swaziland

        Tanzania                             51.4            96.4         100.0             62.4       80.9           100.0           62.8        77.5          100.0                        Tanzanie

        Togo                                 62.3            93.5         100.0             34.9       75.7           100.0           84.1        83.5          100.0                            Togo

        Tunisia                              92.6            97.9         100.0             74.2       96.1           100.0           70.2        96.8          100.0                         Tunisie

        Uganda                                 ...           92.2         100.0               ...      57.7           100.0           83.7        87.3          100.0                        Ouganda

        Zambia                                 ...           90.7         100.0               ...      71.0           100.0           81.0        74.8          100.0                         Zambie

        Zimbabwe                               ...             …          100.0             97.2          ...         100.0           94.0        98.9          100.0                       Zimbabwe

        Africa                               60.6           83.5         100.0              49.7       67.9          100.0            66.5       74.9          100.0                          Afrique


     African Statistical Yearbook 2011 / Annuaire Statistique pour l'Afrique 2011
MILLENIUM DEVELOPMENT GOALS - OBJECTIFS DU MILLENAIRE POUR LE DEVELOPPEMENT

                       Goal 3. Promote gender equality and empower women/Promouvoir l'égalité des sexes et l'autonomisation des femmes


                                   Primary /Primaire                      Secondary /Secondary                     15-24 Year Olds Literacy Female to


                                   Girls to Boys Ratio                      Girls to Boys Ratio                    Male Ratio/ Ratio d'alphabétisation


                               Rapport Filles-garcons (%)                 Rapport Filles-garcons                  des jeunes de 15-24 ans : fille/garçon

                                                         Target/Cible                             Target/Cible                                Target/Cible


                                                                                                                                                                                       Pays
Country                        1990        2004-10            2015      1990      2004-10              2015            1990       2000-07          2015

Algeria                          84.5            89.7          100.0     80.2         103.0             100.0             0.8         96.2          100.0                              Algérie

Angola                           92.1            82.0          100.0     65.8            …              100.0               ...       75.4                 ...                        Angola

Benin                            50.0            85.3          100.0     41.2          54.9             100.0             0.4         64.9          100.0                               Bénin

Botswana                        107.1            95.9          100.0    111.7         104.2             100.0             1.1        102.6          100.0                           Botswana

Burkina Faso                     63.1            87.9          100.0     53.2          73.9             100.0             0.4         70.9          100.0                       Burkina Faso

Burundi                          83.4            96.7          100.0     57.1          72.4             100.0             0.8         91.6          100.0                             Burundi

Cameroon                         85.8            85.4          100.0     70.1          82.5             100.0             0.9           ...         100.0                          Cameroun

Cape Verde                       95.9            91.9          100.0     94.9         118.0             100.0             0.9        101.4          100.0                            Cap-Vert

Cent. Afr. Rep.                  63.8            71.8          100.0     41.4          56.6             100.0             0.6         66.6          100.0            République Centrafricaine

Chad                             44.6            70.0          100.0     23.3          40.9             100.0             0.6         66.4          100.0                              Tchad

Comoros                          72.6            89.1          100.0     67.6          73.9             100.0             0.8         94.2          100.0                           Comores

Congo                            88.2            92.2          100.0     69.5          85.3             100.0             1.0           ...         100.0                              Congo

Congo, Dem. Republic             61.9            85.0          100.0     48.0          55.7             100.0             0.7         80.9          100.0        Rép. Démocratique du Congo

Côte d'Ivoire                    70.8            80.8          100.0     47.3            …              100.0             0.7         73.6          100.0                        Côte d'Ivoire

Djibouti                         70.9            87.7          100.0     65.3          72.4             100.0             0.8           ...         100.0                             Djibouti

Egypt                            84.6            90.8          100.0     81.0          90.1             100.0             0.7         93.1          100.0                              Egypte

Equat. Guinea                      ...           95.3          100.0       ...         57.3             100.0             0.9        100.2          100.0                  Guinée Equatoriale

Eritrea                          95.7            81.8          100.0     93.3          70.8             100.0             0.7         80.6          100.0                            Erythrée

Ethiopia                         67.2            90.6          100.0     76.9          76.9             100.0             0.8         61.9          100.0                            Ethiopie

Gabon                              ...           97.8          100.0       ...           …                  ...             ...       97.9                 ...                         Gabon

Gambia                           67.6           101.1          100.0     43.3          96.2             100.0             0.7           ...         100.0                             Gambie

Ghana                            83.4            94.4          100.0     64.3          84.6             100.0             0.9         95.1          100.0                              Ghana

Guinea                           47.3            82.7          100.0     33.6          56.9             100.0               ...       57.4                 ...                        Guinée

Guinea Bissau                    58.1              …           100.0     45.3            …              100.0             0.3           ...         100.0                      Guinée-Bissau

Kenya                            96.3            96.7          100.0     73.3          89.6             100.0             0.9        101.1          100.0                              Kenya

Lesotho                         123.0            98.4          100.0    147.8         138.0             100.0             1.3           ...         100.0                            Lesotho

Liberia                          68.6            88.4          100.0     39.8          71.4             100.0             0.5        111.6          100.0                              Libéria

Libya                            94.4            91.0          100.0    103.0         112.3             100.0             0.8         98.3          100.0           Jamahiriya Arabe Libyenne
                                                                                                                                                                                                 73
Madagascar                      100.1            97.5          100.0     97.0          94.2             100.0             0.9         93.9          100.0                        Madagascar

Malawi                           83.7           101.0          100.0     28.8          86.5             100.0             0.7         98.3          100.0                              Malawi

Mali                             57.1            82.3          100.0     47.7          64.0             100.0             0.7         65.0          100.0                                Mali

Mauritania                       73.9           101.7          100.0     48.1          83.8             100.0             0.6         89.3          100.0                          Mauritanie

Mauritius                       100.4            96.7          100.0    100.4          99.3             100.0             1.0        102.0          100.0                             Maurice

Morocco                          68.7            88.8          100.0     73.9          83.5             100.0             0.6         79.3          100.0                              Maroc

Mozambique                       74.9            89.6          100.0     61.9          81.8             100.0             0.5         81.2          100.0                        Mozambique

Namibia                         109.9            97.5          100.0    127.3         116.4             100.0             1.0        103.8          100.0                            Namibie

Niger                            56.4            77.9          100.0     42.6          66.2             100.0             0.4         44.2          100.0                               Niger

Nigeria                          76.0            85.2          100.0     72.8          75.4             100.0             0.8         95.7          100.0                              Nigéria

Rwanda                           97.9           103.2          100.0     77.8          96.4             100.0             0.9           ...         100.0                            Rwanda

São T. & Principe                  ...           97.5          100.0       ...        100.6             100.0               ...      100.5                 ...          Sao Tomé-et-Principe

Senegal                          73.5           102.5          100.0     51.9          78.2             100.0             0.6         76.6          100.0                            Sénégal

Seychelles                         ...           97.9          100.0       ...        100.3             100.0               ...      100.6                 ...                     Seychelles

Sierra Leone                     69.0            90.6          100.0     56.8          69.4             100.0               ...       68.1                 ...                   Sierra Leone

Somalia                          52.0            54.9          100.0     53.3          45.9             100.0               ...         ...                ...                        Somalie

South Africa                     98.0            95.1          100.0    115.5         104.2             100.0             1.0        101.8          100.0                      Afrique du Sud

Sudan                            75.0            86.8          100.0     79.7          85.1             100.0             0.7         84.4          100.0                             Soudan

Swaziland                        95.5            92.0          100.0     99.3          89.0             100.0             1.0        103.2          100.0                          Swaziland

Tanzania                         98.3            98.7          100.0     70.7          78.0             100.0             0.9         96.5          100.0                           Tanzanie

Togo                             65.2            93.8          100.0     34.3          52.9             100.0             0.6         76.0          100.0                               Togo

Tunisia                          88.9            91.6          100.0     80.3         102.4             100.0             0.8         97.2          100.0                             Tunisie

Uganda                           79.7            99.9          100.0     53.9          82.7             100.0             0.8         95.4          100.0                           Ouganda

Zambia                           92.9            98.1          100.0     60.7            …              100.0             0.9         82.3          100.0                             Zambie

Zimbabwe                         98.5              …           100.0     87.3            …              100.0             0.9         93.9          100.0                          Zimbabwe

Africa                          81.3             89.4         100.0     77.2           84.6            100.0              0.8         0.9          100.0                             Afrique


                                                                                        African Statistical Yearbook 2011 / Annuaire Statistique pour l'Afrique 2011
MILLENIUM DEVELOPMENT GOALS - OBJECTIFS DU MILLENAIRE POUR LE DEVELOPPEMENT

                                                                   Goal 4. Reduce child mortality/Réduire la mortalité infantile


                                              Infant Mortality / Mortalité infantile                          Under 5 Mortality / Mortalité des < 5 ans


                                                  Current Status/statut actuel                                      Current Status/statut actuel


                                                        (per/pour 1000)                                                   (per/pour 1000)

                                                                                       Target/Cible                                                       Target/Cible

            Country                           1990                    2010                  2015                1990                    2010                   2015                            Pays

            Algeria                             58.8                    28.2                  19.6                67.5                   30.1                    22.5                         Algérie

            Angola                             147.6                   110.9                  49.2               257.2                  192.5                    85.7                         Angola

            Benin                              116.3                    80.8                  38.8               183.8                  113.0                    61.3                           Bénin

            Botswana                            51.4                    32.2                  17.1                70.5                   44.3                    23.5                      Botswana

            Burkina Faso                       106.9                    77.8                  35.6               207.3                  150.4                    69.1                   Burkina Faso

            Burundi                            122.5                    94.6                  40.8               208.8                  159.0                    69.6                        Burundi

            Cameroon                            84.1                    83.7                  28.0               139.6                  138.3                    46.5                      Cameroun

            Cape Verde                          45.8                    23.4                  15.3                58.7                   27.6                    19.6                       Cap-Vert

            Cent. Afr. Rep.                    109.5                   101.4                  36.5               185.8                  172.2                    61.9       République Centrafricaine

            Chad                               126.3                   127.0                  42.1               205.0                  205.2                    68.3                          Tchad

            Comoros                             87.9                    44.1                  29.3               124.7                   56.0                    41.6                       Comores

            Congo                               64.5                    79.1                  21.5               102.7                  128.2                    34.2                          Congo

            Congo, Dem. Republic               114.4                   113.9                  38.1               199.3                  193.7                    66.4    Rép. Démocratique du Congo

            Côte d'Ivoire                      101.3                    83.3                  33.8               151.2                  116.9                    50.4                    Côte d'Ivoire

            Djibouti                           115.8                    80.1                  38.6               174.6                  117.4                    58.2                         Djibouti

            Egypt                               70.8                    32.5                  23.6                89.6                   37.7                    29.9                         Egypte

            Equat. Guinea                      122.3                    95.4                  40.8               213.3                  161.0                    71.1             Guinée Equatoriale

            Eritrea                             97.7                    51.0                  32.6               147.2                   69.6                    49.1                        Erythrée

            Ethiopia                           120.7                    74.9                  40.2               211.2                  123.1                    70.4                        Ethiopie

            Gabon                               59.4                    47.2                  19.8                96.0                   73.3                    32.0                          Gabon

            Gambia                             111.6                    74.0                  37.2               166.5                  111.6                    55.5                        Gambie

            Ghana                               74.4                    70.9                  24.8               121.5                  113.7                    40.5                          Ghana

            Guinea                             138.1                    93.0                  46.0               231.5                  136.4                    77.2                         Guinée

            Guinea Bissau                      136.4                   109.4                  45.5               240.0                  187.8                    80.0                  Guinée-Bissau

            Kenya                               65.8                    60.4                  21.9               104.8                   96.9                    34.9                          Kenya

            Lesotho                             73.9                    65.0                  24.6               108.5                   96.2                    36.2                        Lesotho

            Liberia                            138.4                    91.3                  46.1               229.7                  132.1                    76.6                         Libéria

            Libya                               34.0                    16.9                  11.3                39.5                   18.3                    13.2      Jamahiriya Arabe Libyenne
74          Madagascar                         103.5                    61.0                  34.5               169.1                   92.8                    56.4                    Madagascar

            Malawi                             135.6                    78.4                  45.2               224.4                  110.8                    74.8                         Malawi

            Mali                               132.1                   102.9                  44.0               251.0                  181.7                    83.7                            Mali

            Mauritania                          74.4                    71.0                  24.8               129.8                  116.5                    43.3                      Mauritanie

            Mauritius                           21.5                    14.0                   7.2                28.9                   17.0                     9.6                        Maurice

            Morocco                             64.6                    27.7                  21.5                88.6                   32.5                    29.5                          Maroc

            Mozambique                         140.4                    83.3                  46.8               242.2                  140.2                    80.7                   Mozambique

            Namibia                             61.1                    30.4                  20.4                86.1                   43.1                    28.7                        Namibie

            Niger                              154.1                    83.7                  51.4               291.0                  161.5                    97.0                           Niger

            Nigeria                            133.4                   106.6                  44.5               230.5                  181.4                    76.8                         Nigéria

            Rwanda                             124.8                    95.9                  41.6               205.7                  148.2                    68.6                        Rwanda

            São T. & Principe                   81.7                    70.1                  27.2               110.5                   91.1                    36.8           Sao Tomé-et-Principe

            Senegal                             75.5                    57.0                  25.2               156.5                  115.5                    52.2                        Sénégal

            Seychelles                            …                       …                     …                   …                       …                      …                      Seychelles

            Sierra Leone                       154.5                   101.5                  51.5               259.8                  142.6                    86.6                   Sierra Leone

            Somalia                            134.9                   105.9                  45.0               225.3                  173.4                    75.1                        Somalie

            South Africa                        50.2                    42.8                  16.7                67.9                   60.5                    22.6                 Afrique du Sud

            Sudan                               95.4                    65.7                  31.8               161.1                  105.1                    53.7                        Soudan

            Swaziland                           68.0                    58.9                  22.7                98.7                   88.1                    32.9                      Swaziland

            Tanzania                           100.5                    59.8                  33.5               168.7                   96.5                    56.2                       Tanzanie

            Togo                               100.8                    68.3                  33.6               150.1                   92.0                    50.0                           Togo

            Tunisia                             41.0                    18.5                  13.7                48.4                   20.7                    16.1                         Tunisie

            Uganda                              99.5                    70.3                  33.2               170.1                  115.2                    56.7                       Ouganda

            Zambia                             102.1                    86.5                  34.0               170.6                  146.5                    56.9                         Zambie

            Zimbabwe                            53.4                    51.4                  17.8                83.3                   82.9                    27.8                      Zimbabwe

            Africa                            102.3                     78.6                  34.1              168.3                   127.2                    56.1                        Afrique


     African Statistical Yearbook 2011 / Annuaire Statistique pour l'Afrique 2011
MILLENIUM DEVELOPMENT GOALS - OBJECTIFS DU MILLENAIRE POUR LE DEVELOPPEMENT

                                            Goal 5. Improve maternal health/Améliorer la santé maternelle


                        Births Attended by Skilled Health Staff         Contraceptive Prevalence Rate          Maternal Mortality


                       Naissances assistées par un personnel de              Taux de prévalence
                                                                                                              Mortalité maternelle
                                  santé qualifié (%)                            contraceptive

                                                                        (% of women ages 15-49/ %
                                                                        des femmes agées de 15 à 49            (per/pour 100000)
                                                                                   ans)
                                                                                                                                 Target/Cible

                                                                                                                                                                       Pays
Country                     1990-99         2005-08      2005-08 Year/année Value/Valeur                 1990-99        2008          2015
Algeria                           77.0           95.2         95.2               2006             61.4      117.4        120.0          29.4                          Algérie

Angola                            22.5           47.3         47.3               2001              6.2     1 300.0       610.0         325.0                          Angola

Benin                             59.8           74.0         74.0               2006             17.0      498.0        410.0         124.5                            Bénin

Botswana                          96.0             …              …              2000             48.0          ...      190.0             ...                     Botswana

Burkina Faso                      31.0           53.5         53.5               2006             17.4      484.0        560.0         121.0                    Burkina Faso

Burundi                           19.0           33.6         33.6               2005              9.1      499.0        970.0         124.8                          Burundi

Cameroon                          59.3           63.0         63.0               2006             29.2          ...      600.0             ...                     Cameroun

Cape Verde                        88.5           77.5         77.5               2005             61.0       42.0         94.0          10.5                        Cap-Vert

Cent. Afr. Rep.                   45.9           53.4         53.4               2006             19.0      649.0        850.0         162.3        République Centrafricaine

Chad                              24.0             …              …              2004              2.8      900.0      1 200.0         225.0                           Tchad

Comoros                           51.6             …              …              2000             25.7      460.0        340.0         115.0                        Comores

Congo                             50.0           83.4         83.4               2007             20.6      890.0        580.0         222.5                           Congo

Congo, Dem. Republic                ...          74.0         74.0               2007             20.6          ...      670.0             ...   Rép. Démocratique du Congo

Côte d'Ivoire                     46.9           56.8         56.8               2006             12.9      597.0        470.0         149.3                     Côte d'Ivoire

Djibouti                            ...          92.9         92.9               2006             17.8      570.0        300.0         142.5                          Djibouti

Egypt                             58.1           78.9         78.9               2008             60.3       96.0         82.0          24.0                          Egypte

Equat. Guinea                      5.0             …              …                …               …        820.0        280.0         205.0              Guinée Equatoriale

Eritrea                           20.6             …              …              1995              8.0     1 400.0       280.0         350.0                         Erythrée

Ethiopia                           7.9             5.7            5.7            2005             14.7     1 400.0       470.0         350.0                         Ethiopie

Gabon                             80.0             …              …              2000             32.7      500.0        260.0         125.0                           Gabon

Gambia                            44.1           56.8         56.8               2001             17.5     1 000.0       400.0         250.0                         Gambie

Ghana                             44.3           58.7         58.7               2006             16.7      740.0        350.0         185.0                           Ghana

Guinea                            54.8           38.0         38.0               2005              9.1      528.0        680.0         132.0                          Guinée

Guinea Bissau                     18.0           38.8         38.8               2006             10.3      822.0      1 000.0         205.5                  Guinée-Bissau

Kenya                             42.7             …              …              2003             39.3      570.0        530.0         142.5                           Kenya

Lesotho                           49.6             …              …              2004             37.3      610.0        530.0         152.5                         Lesotho

Liberia                           70.0           46.3         46.3               2007             11.4      560.0        990.0         140.0                           Libéria

Libya                             94.0             …              …              1995             45.2      220.0         64.0          55.0       Jamahiriya Arabe Libyenne
                                                                                                                                                                                 75
Madagascar                        47.3             …              …              2004             27.1      488.0        440.0         122.0                     Madagascar

Malawi                            55.0           53.6         53.6               2006             41.7      620.0        510.0         155.0                          Malawi

Mali                              23.7           45.1         45.1               2006              8.2      580.0        830.0         145.0                             Mali

Mauritania                        58.0             …              …              2001              8.0      800.0        550.0         200.0                       Mauritanie

Mauritius                         99.7           99.2         99.2               2002             75.9       34.0         36.0           8.5                         Maurice

Morocco                           43.0             …              …              2004             63.0      228.0        110.0          57.0                           Maroc

Mozambique                        43.7             …              …              2003             16.5     1 500.0       550.0         375.0                    Mozambique

Namibia                           59.8           81.4         81.4               2006             55.1      220.0        180.0          55.0                         Namibie

Niger                             16.7           32.9         32.9               2006             11.2      593.0        820.0         148.3                            Niger

Nigeria                           41.6             …              …              2003             12.6      704.0        840.0         176.0                          Nigéria

Rwanda                            31.2           38.6         38.6               2005             17.4     2 300.0       540.0         575.0                         Rwanda

São T. & Principe                 52.0           80.7         80.7               2006             30.3      106.4                       26.6            Sao Tomé-et-Principe

Senegal                           46.6           51.9         51.9               2005             11.8      510.0        410.0         127.5                         Sénégal

Seychelles                        47.0             …              …                …               …            ...         …              ...                    Seychelles

Sierra Leone                      33.4           43.2         43.2               2005              5.3     1 800.0       970.0         450.0                    Sierra Leone

Somalia                           34.2           33.0         33.0               2006             14.6     1 600.0     1 200.0         400.0                         Somalie

South Africa                      84.4             …              …              2003             60.3      150.0        410.0          37.5                  Afrique du Sud

Sudan                             82.0           49.2         49.2               2006              7.6      370.0        750.0          92.5                          Soudan

Swaziland                         70.5           69.0         69.0               2007             50.6      560.0        420.0         140.0                       Swaziland

Tanzania                          35.8           43.4             …              2005             26.4      530.0        790.0         132.5                        Tanzanie

Togo                              49.6           62.4         62.4               2006             16.8      640.0        350.0         160.0                            Togo

Tunisia                           83.4             …              …              2001             62.6       68.9         60.0          17.2                          Tunisie

Uganda                            37.8           41.9         41.9               2006             23.7      550.0        430.0         137.5                        Ouganda

Zambia                            47.1           46.5         46.5               2007             40.8      649.0        470.0         162.3                          Zambie

Zimbabwe                          72.5           68.5         68.5               2006             60.2      280.0        790.0          70.0                       Zimbabwe

Africa                           45.0            50.5        50.2                n.a.             n.a.      717.0       530.2         179.2                          Afrique


                                                                                         African Statistical Yearbook 2011 / Annuaire Statistique pour l'Afrique 2011
MILLENIUM DEVELOPMENT GOALS - OBJECTIFS DU MILLENAIRE POUR LE DEVELOPPEMENT


                                                                     Goal 6. Combat HIV/AIDS /Combattre le VIH/Sida

                                       Number of women (15+)          Prevalence of tuberculosis
                                                                                                           adult HIV prevalence rate (aged 15-49)
                                            living with HIV            (per 100 000 population)
                                        Nbre de femmes (+15)
                                          vivant avec le VIH   Incidence de la tuberculose pour 100 000)       Prévalence du VIH parmi 15-49
                                               (thousand)


                Country                        2009                2000                      2009             1990                      2009                              Pays

                Algeria                         5.2                 64.0                      67.0              ...                      0.1                              Algérie

                Angola                         110.0                423.0                     389.0            0.5                       2.0                             Angola

                Benin                           32.0                131.0                     146.0            0.2                       1.2                               Bénin

                Botswana                       170.0                457.0                     531.0            3.5                       24.8                          Botswana

                Burkina Faso                    56.0                298.0                     51.0             3.9                       1.2                       Burkina Faso

                Burundi                         90.0                447.0                     397.0            3.9                       3.3                             Burundi

                Cameroon                       320.0                224.0                     549.0            0.6                       5.3                          Cameroun

                Cape Verde                       …                  307.0                     191.0             ...                       ...                           Cap-Vert

                Cent. Afr. Rep.                 67.0                341.0                     227.0            3.1                       4.7            République Centrafricaine

                Chad                           110.0                435.0                     395.0            1.1                       3.4                              Tchad

                Comoros                         <0.1                105.0                     456.0             ...                      0.1                           Comores

                Congo                           40.0                397.0                     68.0             5.2                       3.4                              Congo

                Congo, Dem. Republic             …                  492.0                     461.0             ...                       ...       Rép. Démocratique du Congo

                Côte d'Ivoire                  220.0                636.0                     606.0            2.4                       3.4                        Côte d'Ivoire

                Djibouti                        7.4                 702.0                     645.0            0.9                       2.5                             Djibouti

                Egypt                           2.4                 42.0                      869.0             ...                      <0.1                             Egypte

                Equat. Guinea                   11.0                119.0                     30.0             0.1                       5.0                  Guinée Equatoriale

                Eritrea                         13.0                138.0                     129.0            0.3                       0.8                            Erythrée

                Ethiopia                         …                  528.0                     142.0             ...                       ...                           Ethiopie

                Gabon                           25.0                293.0                     572.0            0.9                       5.2                              Gabon

                Gambia                          9.7                 375.0                     603.0            0.1                       2.0                             Gambie

                Ghana                          140.0                368.0                     425.0            0.3                       1.8                              Ghana

                Guinea                          41.0                337.0                     329.0            1.1                       1.3                             Guinée

                Guinea Bissau                   12.0                296.0                     562.0            0.3                       2.5                      Guinée-Bissau

                Kenya                          760.0                390.0                     305.0            3.9                       6.3                              Kenya

                Lesotho                        160.0                364.0                     282.0            0.8                       23.6                           Lesotho

                Liberia                         19.0                510.0                     405.0            0.3                       1.5                              Libéria

                Libya                            …                  61.0                      518.0             ...                       ...          Jamahiriya Arabe Libyenne


76              Madagascar                      7.3                 377.0                     55.0             0.2                       0.2                        Madagascar

                Malawi                         470.0                300.0                     478.0            7.2                       11.0                             Malawi

                Mali                            40.0                549.0                     243.0            0.4                       1.0                                Mali

                Mauritania                      4.0                 499.0                     628.0            0.2                       0.7                          Mauritanie

                Mauritius                       2.5                 43.0                      676.0            0.0                       1.0                             Maurice

                Morocco                         8.1                 132.0                     40.0              ...                      0.1                              Maroc

                Mozambique                     760.0                425.0                     109.0            1.2                       11.5                       Mozambique

                Namibia                         95.0                525.0                     323.0            1.6                       13.1                           Namibie

                Niger                           28.0                285.0                     588.0            0.1                       0.8                               Niger

                Nigeria                        1700.0               477.0                     328.0            1.3                       3.6                              Nigéria

                Rwanda                          88.0                436.0                     497.0            5.2                       2.9                            Rwanda

                São T. & Principe                …                  189.0                     565.0             ...                       ...              Sao Tomé-et-Principe

                Senegal                         32.0                450.0                     162.0            0.2                       0.9                            Sénégal

                Seychelles                       …                  57.0                      545.0             ...                       ...                         Seychelles

                Sierra Leone                    28.0                753.0                     61.0              ...                      1.6                        Sierra Leone

                Somalia                         15.0                586.0                    1193.0            0.1                       0.7                             Somalie

                South Africa                   3300.0               535.0                     494.0            0.7                       17.8                     Afrique du Sud

                Sudan                          140.0                186.0                     808.0            0.1                       1.1                             Soudan

                Swaziland                      100.0                506.0                     206.0            2.3                       25.9                         Swaziland

                Tanzania                       730.0                647.0                     673.0            4.8                       5.6                           Tanzanie

                Togo                            67.0                30.0                      796.0            0.6                       3.2                               Togo

                Tunisia                         <1                  285.0                     30.0              ...                      <0.1                            Tunisie

                Uganda                         610.0                217.0                     278.0            10.2                      6.5                           Ouganda

                Zambia                         490.0                425.0                     170.0            12.7                      13.5                            Zambie

                Zimbabwe                       620.0                329.0                     309.0            10.1                      14.3                         Zimbabwe


                Africa                        11755.6              371.5                     410.8             2.4                       4.9                            Afrique


     African Statistical Yearbook 2011 / Annuaire Statistique pour l'Afrique 2011
MILLENIUM DEVELOPMENT GOALS - OBJECTIFS DU MILLENAIRE POUR LE DEVELOPPEMENT

                                                            Goal 7. Ensure environmental sustainability/ Assurer un environnement durable


                       Status of National            % Population with                                          Nationally Protected
                                                                                 Forest Area (% of land
                       Environmental Action          Access to an Improved                                      Areas (% of total land          CO2 Emissions per Capita (Metric tons)
                                                                                 area)
                       Plans                         Water Source                                               area)


                       Statut national des plans     % de la population ayant                                   Surfaces nationales
                                                                              Superficie forêstière( %
                       d'action sur                  accès aux sources d'eau                                    protégées (% du total           Emissions de CO2 par habt (T. métrique)
                                                                              des terres)
                       l'environnement               potable                                                    des terres)


                                                                                                                                                                                                                       Pays
Country                                                                 2008                        2010                     1999-2005                       2005                         2009

Algeria                                   No data                         83.0                            0.6                             2.5                   2.7                         3.3                       Algérie

Angola                                    No data                         50.0                        46.9                                6.6                   1.2                         1.3                       Angola

Benin                                   Completed                         75.0                        41.2                                7.0                   0.3                         0.4                        Bénin

Botswana                                Completed                         95.0                        20.0                               18.5                   2.3                         2.3                     Botswana

Burkina Faso                            Completed                         76.0                        20.6                               10.4                   0.1                         0.1                 Burkina Faso

Burundi                                 Completed                         72.0                            6.7                             5.7                   0.1                         0.0                      Burundi

Cameroon                                Completed                         74.0                        42.1                                4.5                   0.4                         0.4                    Cameroun

Cape Verde                              Completed                         84.0                        21.1                                0.0                   0.5                         0.7                     Cap-Vert

Cent. Afr. Rep.                     Being prepared                        67.0                        36.3                                8.2                   0.1                         0.1      République Centrafricaine

Chad                                      No data                         50.0                            9.2                             9.1                   0.0                         0.0                        Tchad

Comoros                                 Completed                         95.0                            1.6                             0.0                   0.2                         0.2                     Comores

Congo                                   Completed                         71.0                        65.6                                4.5                   1.6                         1.7                        Congo

Congo, Dem. Republic                    Completed                         46.0                        68.0                                4.5                   0.0                         0.0   Rép. Démocratique du Congo

Côte d'Ivoire                           Completed                         80.0                        32.7                                6.2                   0.3                         0.3                  Côte d'Ivoire

Djibouti                                  No data                         92.0                            0.3                             0.4                   2.4                         2.0                       Djibouti

Egypt                                   Completed                         99.0                            0.1                             0.8                   2.1                         2.3                       Egypte

Equat. Guinea                           Completed                            …                        58.0                                0.0                   8.0                         6.8            Guinée Equatoriale

Eritrea                                 Completed                         61.0                        15.2                                5.0                   0.2                         0.2                      Erythrée

Ethiopia                                Completed                         38.0                        11.2                                5.5                   0.1                         0.1                      Ethiopie

Gabon                                   Completed                         87.0                        85.4                                2.8                   3.6                         3.1                       Gabon

Gambia                                  Completed                         92.0                        48.0                                2.3                   0.2                         0.3                      Gambie

Ghana                                   Completed                         82.0                        21.7                                4.9                   0.3                         0.3                       Ghana

Guinea                                  Completed                         71.0                        26.6                                0.7                   0.1                         0.1                       Guinée

Guinea Bissau                           Completed                         61.0                        71.9                                0.0                   0.3                         0.3                Guinée-Bissau

Kenya                                   Completed                         59.0                            6.1                             6.2                   0.3                         0.3                        Kenya

Lesotho                                 Completed                         85.0                            1.4                             0.2                   0.1                         0.1                      Lesotho

Liberia                                   No data                         68.0                        44.9                                1.3                   0.2                         0.2                       Libéria

Libya                                     No data                            …                            0.1                             0.1                   9.1                         8.6     Jamahiriya Arabe Libyenne

Madagascar                              Completed                         41.0                        21.6                                1.9                   0.1                         0.2                  Madagascar
                                                                                                                                                                                                                                 77
Malawi                                  Completed                         80.0                        34.4                               11.3                   0.1                         0.1                       Malawi

Mali                                    Completed                         56.0                        10.2                                3.7                   0.1                         0.1                          Mali

Mauritania                              Completed                         49.0                            0.2                             1.7                   1.1                         0.9                    Mauritanie

Mauritius                               Completed                         99.0                        17.2                                7.7                   3.3                         3.5                      Maurice

Morocco                                   No data                         81.0                        11.5                                0.7                   1.1                         1.1                        Maroc

Mozambique                              Completed                         47.0                        49.6                                6.1                   0.1                         0.1                  Mozambique

Namibia                                 Completed                         92.0                            8.9                            12.9                   1.3                         1.9                      Namibie

Niger                                   Completed                         48.0                            1.0                             7.7                   0.1                         0.1                         Niger

Nigeria                                 Completed                         58.0                            9.9                             3.3                   0.8                         0.5                       Nigéria

Rwanda                                  Completed                         65.0                        17.6                               14.7                   0.1                         0.1                      Rwanda

São T. & Principe                       Completed                         89.0                        28.1                                0.0                   0.6                         0.9          Sao Tomé-et-Principe

Senegal                                 Completed                         69.0                        44.0                               11.3                   0.5                         0.5                      Sénégal

Seychelles                              Completed                            …                        89.1                               99.8                  10.7                        12.9                    Seychelles

Sierra Leone                            Completed                         49.0                        38.1                                1.1                   0.2                         0.2                  Sierra Leone

Somalia                                   No data                         30.0                        10.8                                0.3                   0.1                         0.1                      Somalie

South Africa                            Completed                         91.0                            7.6                             5.4                   9.1                         9.0                Afrique du Sud

Sudan                                     No data                         57.0                        29.4                                3.6                   0.3                         0.3                       Soudan

Swaziland                               Completed                         69.0                        32.7                                2.0                   0.9                         1.2                    Swaziland

Tanzania                                Completed                         54.0                        37.7                               15.6                   0.1                         0.2                     Tanzanie

Togo                                    Completed                         60.0                            5.3                             7.9                   0.4                         0.4                         Togo

Tunisia                                 Completed                         94.0                            6.5                             0.3                   2.3                         2.2                       Tunisie

Uganda                                  Completed                         67.0                        15.2                                9.6                   0.1                         0.1                     Ouganda

Zambia                                  Completed                         60.0                        66.5                                8.6                   0.2                         0.2                       Zambie

Zimbabwe                            Being prepared                        82.0                        40.4                                7.9                   0.9                         0.8                    Zimbabwe


Africa                                                                   64.9                         22.9                               5.2                    1.1                        1.1                       Afrique


                                                                                                                    African Statistical Yearbook 2011 / Annuaire Statistique pour l'Afrique 2011
78


     African Statistical Yearbook 2011 / Annuaire Statistique pour l'Afrique 2011
2
Part


                                                                                      79


        Partie
         Country Tables
       Tableaux par pays


       African Statistical Yearbook 2011 / Annuaire Statistique pour l'Afrique 2011
Algeria                                                                                                                                                                                  Algérie

       AREA (KM 2)                                                                                        2 381 741                                                                    SUPERFICIE (KM 2)
       CAPITAL CITY                             Algiers                                                                                                  Alger                                     CAPITALE
       CURRENCY                                 Algerian Dinar                                                                                  Dinar algérien                                     MONNAIE


                                               I SOCIAL AND DEMOGRAPHIC INDICATORS — INDICATEURS DEMOGRAPHIQUES ET SOCIAUX

                                                     2002          2003         2004         2005         2006         2007         2008         2009         2010
       Population                                                                                                                                                                               Population
                                                                                                                                                                            Population au milieu de l'année -
       Mid-year population - Total (Million)            31.4          31.9         32.4         32.9         33.4         33.9         34.4         34.9         35.4
                                                                                                                                                                                               Total (million)
                                                                                                                                                                            Population au milieu de l'année -
       Mid-year population - Urban (%)                  61.2          61.9         63.0         63.3         63.9         64.6         65.2         65.8         66.5
                                                                                                                                                                                                Urbaine (%)

       Female (%)                                       49.5          49.5         49.5         49.5         49.5         49.5         49.5         49.5         49.5                             Femme (%)


       Population by Age Group                                                                                                                                                   Population par groupe d'âge


          0-14                                     10084 779      9955 721     9841 441     9740 664     9653 164     9583 156     9538 392     9528 693     9559 767                                     0-14


          15-64                                    19958 223     20514 293    21068 104    21620 091    22171 533    22718 490    23250 035    23751 851    24214 222                                    15-64


          65+                                       1371 112      1415 421     1456 580     1493 780     1526 781     1556 522     1584 999     1614 926     1648 600                                      65+


       Active Population (000)                      11 986.0      12 377.3     12 789.7     13 197.2     13 649.9     14 076.5     14 486.3     14 841.6     15 196.2                 Population active (000)

          Female (%)                                    29.3          29.6         29.9         30.2         30.7         31.0         31.2         31.6         31.9                             Femme (%)

                                                                                                                                                                            Taux brut de natalité - Total (par
       Crude birth rate - Total (per 1000)              21.0          21.0         21.0         20.7         21.0         21.0         21.0         21.0         20.8
                                                                                                                                                                                                        1000)
                                                                                                                                                                          Taux brut de mortalité - Total (par
       Crude death rate - Total (per 1000)               5.0           5.0          5.0          5.0          5.0          5.0          5.0          5.0          4.9
                                                                                                                                                                                                       1000)
       Life expectancy at birth - Total                                                                                                                                     Espérance de vie à la naissance -
                                                        71.0          71.0         71.0         71.7         72.0         72.0         72.0         73.0         72.3
       (years)                                                                                                                                                                                Total (années)
       Net reproduction rate - (per                                                                                                                                         Taux net de reproduction - (par
                                                          ...           ...          ...         1.1           ...          ...          ...          ...         1.1
       woman)                                                                                                                                                                                       femme)
                                                                                                                                                                            Indice synthétique de fécondité -
       Total fertility rate - (per woman)                3.0           2.0          2.0          2.4          2.0          2.0          2.0          2.0          2.4
                                                                                                                                                                                                (par femme)

       Education                                                                                                                                                                           Enseignement

       Teaching staff at first level - Total                                                                                                                              Personnel enseignant - 1er degré -
                                                      170.04         167.5        170.0        171.5        171.4        170.8        169.7        141.4           ...
       (thousands)                                                                                                                                                                           Total (milliers)
       Teaching staff at second level -                                                                                                                                  Personnel enseignant - 2ème degré -
                                                          ...        170.3        176.4           ...          ...          ...          ...          ...          ...
       Total (thousands)
       T t l (th      d )                                                                                                                                                                     Total (milliers)
                                                                                                                                                                                              T t l ( illi )
       Teaching staff at third level - Total                                                                                                                             Personnel enseignant - 3ème degré -
                                                        20.3          21.7         26.1         28.4         30.0         31.7           ...        37.2           ...
       (thousands)                                                                                                                                                                            Total (milliers)
       First level student enrollment - Total                                                                                                                               Elèves inscrits - 1er degré - Total
                                                       4 692         4 613        4 508        4 362        4 197        4 087        3 942        3 253           ...
       (thousands)                                                                                                                                                                                    (milliers)
       First level student enrollment -                                                                                                                                           Elèves inscrits - 1er degré -
80     Female (thousands)
                                                       2 204         2 166        2 119        2 050        1 974        1 931        1 865        1 538           ...
                                                                                                                                                                                            Femmes (milliers)
       Second level student enrollment -                                                                                                                                 Elèves inscrits - 2ème degré - Total
                                                       3 424         3 548        3 677        3 756           ...          ...          ...          ...          ...
       Total (thousands)                                                                                                                                                                            (milliers)
       Second level student enrollment -                                                                                                                                       Elèves inscrits - 2ème degré -
                                                       1 716         1 793        1 863        1 906           ...          ...          ...          ...          ...
       Female (thousands)                                                                                                                                                                  Femmes (milliers)
       Third level student enrollment -                                                                                                                                  Elèves inscrits - 3ème degré - Total
                                                       624.8         682.8        716.5        792.1        818.0        901.6           ...     1 149.7           ...
       Total (thousands)                                                                                                                                                                            (milliers)
       Third level student enrollment -                                                                                                                                        Elèves inscrits - 3ème degré -
                                                          ...           ...       365.4        437.4        448.1        517.4           ...       667.7           ...
       Female (thousands)                                                                                                                                                                  Femmes (milliers)
       Public expenditure on education (%                                                                                                                                  Dépenses publiques consacrées à
                                                          ...           ...          ...          ...          ...          ...          ...          ...          ...
       of budget)                                                                                                                                                            l'enseignement (% du budget)

       Health                                                                                                                                                                                          Santé
       Hospital beds - Total (per 10 000                                                                                                                                    Nombre de lits d'hôpitaux - Total
                                                          ...         170          170            ...          ...          ...          ...        170            ...
       population)                                                                                                                                                                             (pour 10 000)
       Nurses - Total (per 10 000                                                                                                                                          Nombre d'infirmières - Total (pour
                                                        247           245          242          238            ...        283            ...        190            ...
       population)                                                                                                                                                                                   10 000)
       Physicians - Total (per 10 000                                                                                                                                     Nombre de médecins - Total (pour
                                                         11            11           12            9            ...          ...          ...         12            ...
       population)                                                                                                                                                                                10 000)
       Public expenditure on Health (% of                                                                                                                                Dépenses publiques consacrées à la
                                                          8             9            9           10           12            ...          ...          ...          ...
       budget)                                                                                                                                                                         santé (% du budget)


     African Statistical Yearbook 2011 / Annuaire Statistique pour l'Afrique 2011
Algeria                                                                                                                                                                                          Algérie
                                                                    II NATIONAL ACCOUNTS — COMPTES NATIONAUX

                                              2002            2003         2004         2005         2006            2007             2008          2009        2010

Gross domestic product by kind of economic activity at current prices
                                                                                                                Produit intérieur brut par branche d'activité économique aux prix courants


Algerian Dinar (Millions)                                                                                                                                                     Dinar algérien (Millions)

Agriculture                                   417 225        515 282      580 506      581 616      641 285         704 201          711 754       926 372           ...                            Agriculture

Mining and quarrying                        1 482 514       1 874 508    2 325 456    3 359 015    3 890 723       4 099 814        5 014 471     3 125 108          ...                 Industries extractives

Manufacturing                                 276 614        287 978      314 772      337 349      358 336         381 614          408 879       465 826           ...            Industries manufacturières

Electricity, gas & water                       55 461         61 775       67 789       74 809       82 658          87 691           93 706        91 211           ...                 Electricité, gaz et eau

Construction                                  409 938        445 214      507 968      564 416      674 337         825 090          956 708      1 094 822          ...          Bâtiments et travaux publics

Wholesale & retail trade,                                                                                                                                                      Commerce de gros et de détail,
                                              562 776        610 700      669 749      737 758      803 569         943 955         1 094 375     1 257 075          ...
restaurants, hotels                                                                                                                                                                    restaurants et hôtels
                                                                                                                                                                                 Banques, assurances, affaires
Finance, insurance, real estate, etc.         195 214        231 849      246 421      288 648      316 565         328 895          372 759       416 677           ...
                                                                                                                                                                                                 immobilières
Transport and communications                  340 983        390 551      512 570      645 029      743 534         822 407          863 566       914 362           ...      Transport(s) et communications
                                                                                                                                                                                  Administrations publiques et
Public administration and defense             479 619        532 145      584 384      612 256      652 257         777 113         1 057 430     1 193 930          ...
                                                                                                                                                                                                      défense
Other services                                        ...          ...          ...          ...          ...             ...              ...           ...         ...                        Autres services
                                                                                                                                                                             Moins Services d’intermédiation
Less Imputed Service Charges                  - 75 074      - 100 752    - 106 677    - 132 929    - 139 959       - 140 544        - 158 551     - 178 986          ...
                                                                                                                                                                                                     financière
Gross domestic product at factor                                                                                                                                         Produit intérieur brut aux couts des
                                            4 145 271       4 849 251    5 702 938    7 067 966    8 023 304       8 830 236       10 415 096     9 306 397          ...
cost / basic prices                                                                                                                                                                    facteurs / prix de base

Plus: Indirect Taxes / taxes on                                                                                                                                            Plus taxes indirectes/impôts sur les
                                              377 502        403 071      446 179      494 018      491 535         532 454          653 929       711 118           ...
products, less subsidies                                                                                                                                                       produits, moins les subventions


Expenditure on Gross domestic product at current purchaser's values
                                                                                                                                Emploi du produit intérieur brut aux prix courants d'acquisition

Algerian Dinar (Millions)                                                                                                                                                     Dinar algérien (Millions)
                                                                                                                                                                                     Consommation finale des
Government final consumption                  700 447        777 522      846 896      865 879      954 867        1 089 003        1 458 770     1 642 959          ...
                                                                                                                                                                                     administrations publiques

Private final consumption                   1 944 325       2 126 300    2 371 025    2 526 030    2 695 581       2 963 820        3 338 767     3 748 081          ...           Consommation finale privée

Gross fixed capital formation               1 111 309       1 265 165    1 476 903    1 691 640    1 969 458       2 462 124        3 228 343     3 811 419          ...        Formation brute de capital fixe

Increase in inventories                       275 073        328 425      568 511      702 213      608 728         771 571          915 889       874 427           ...                   Variation des stocks

Exports of goods and services               1 650 790       2 008 951    2 462 920    3 596 649    4 149 707       4 402 232        5 298 034     3 524 401          ...     Exportations de biens et services
                                                                                                                                                                               Moins importations de biens et
Less imports of goods and services          1 159 170       1 254 041    1 577 138    1 820 427    1 863 501       2 326 059        3 170 777     3 583 772          ...
                                                                                                                                                                                                     services
GDP at purchasers' values                   4 522 773       5 252 321    6 149 117    7 561 984    8 514 839       9 362 690       11 069 025    10 017 515          ...             PIB aux prix d'acquisition


Gross domestic product by kind of economic activity at constant prices                                          Produit intérieur brut par branche d'activité economique aux prix constants                        81
Annual Growth Rates (%)                                                                                                                                            Taux de croissance annuel (%)
Agriculture                                         -1.3        19.7           3.1          1.9          4.9             5.0              3.5          20.0          ...                            Agriculture

Mining and quarrying                                 3.7          8.8          3.3          5.8         -2.5            -0.9              3.0          -6.0          ...                 Industries extractives

Manufacturing                                        1.3          3.3         -0.2         -2.6         -0.9            -3.6              2.0           0.7          ...            Industries manufacturières

Electricity, gas & water                             6.1        11.4           9.7          9.5          3.4             6.0              7.9           7.2          ...                 Electricité, gaz et eau

Construction                                         8.2          5.5          8.0          7.1        11.6              9.5             10.0           8.7          ...          Bâtiments et travaux publics
Wholesale & retail trade,                                                                                                                                                            Commerce de gros et de
                                                     5.1          6.7          5.3          5.1          2.0             3.1              2.4           2.6          ...
restaurants, hotels                                                                                                                                                                détail,restaurants et hôtels
                                                                                                                                                                                 Banques, assurances, affaires
Finance, insurance, real estate, etc.                5.1        10.0           7.9        14.0           8.7             1.0              5.8          11.2          ...
                                                                                                                                                                                                  immobilières
Transport and communications                         4.7          6.9          5.1          5.1          2.0             3.0              2.4           2.4          ...      Transport(s) et communications
                                                                                                                                                                                  Administrations publiques et
Public administartion and defense                    3.0          4.5          4.0          3.0          3.1             6.5              5.0           0.0          ...
                                                                                                                                                                                                      défense
Other services                                        ...          ...          ...          ...          ...             ...              ...           ...         ...                        Autres services
                                                                                                                                                                               Moins Services d’intérmediation
Less Imputed Service Charges                        -2.1        58.2          -9.5          8.4         -4.8           -13.0             72.8           5.5          ...
                                                                                                                                                                                                     financière
Gross domestic product at factor                                                                                                                                           Produit intérieur brut aux couts des
                                                     3.9          7.2          4.8          5.0          1.9             2.8              2.3           2.0          ...
cost / basic prices                                                                                                                                                                      facteurs / prix de base

Plus: Indirect Taxes / taxes on                                                                                                                                            Plus taxes indirectes/impôts sur les
                                                    16.7          2.3        10.2           5.9          2.7             5.5              3.0           6.8          ...
products, less subsidies                                                                                                                                                       produits, moins les subventions

Gross domestic product at market                                                                                                                                             Produit intérieur brut aux prix du
                                                     4.7          6.9          5.1          5.1          2.0             3.0              2.4           2.4          ...
prices                                                                                                                                                                                                  marché


2008: semi-final                2009: Provisional                                                                                                          2008: semi-définitif            2009: provisoire


                                                                                                      African Statistical Yearbook 2011 / Annuaire Statistique pour l'Afrique 2011
Algeria                                                                                                                                                                 Algérie

       Expenditure on Gross domestic product at constant purchasers' values                                     Emplois du produit intérieur brut aux prix constants d'acquisition


       Annual Growth Rates (%)                                                                                                                   Taux de croissance annuel (%)
                                                                                                                                                                   Consommation finale des
       Government final consumption                  5.5         4.2        4.5         2.1        4.8        7.1          8.7          6.0        ...             administrations publiques

       Private final consumption                     3.8         4.0        5.8         4.8        2.9        2.5          4.9          5.8        ...           Consommation finale privée

       Gross fixed capital formation                 7.6         5.1        8.1         9.0        2.4      12.4          14.2         14.4        ...        Formation brute de capital fixe

       Exports of goods and services                 5.6         7.2        4.2         6.1       -2.5       -0.6         -2.9         -10.7       ...     Exportations de biens et services

                                                                                                                                                              Moins importations de biens et
       Less imports of goods and services           19.5         2.4      13.1          9.5       -1.8      11.1          17.7          9.1        ...                              services


                                                                                     III INFLATION

                                                  2002       2003       2004        2005       2006       2007         2008          2009       2010
       Annual Growth Rates (%)                                                                                                                    Taux de croissance annuel (%)
       All Item                                      1.4         2.6        3.6         1.6        2.3        3.6          4.9          5.7       4.1                               Ensemble

       Food                                          0.3         3.9        3.7        -0.7        4.3        6.5          7.3            ...     4.2                            Alimentation

       Health                                        2.6         1.0        0.0         1.1        1.0        3.0          2.1            ...     3.3                                    Santé

       Energy                                        0.0         1.7        1.7       13.4         3.2        1.0          1.3            ...      ...                                 Energie

       Transport                                     2.9         5.6      10.6          9.8        1.5       -0.5          0.7            ...     3.3                               Transport


                                                            IV AGRICULTURAL PRODUCTION - PRODUCTION AGRICOLE

                                                  2002       2003       2004        2005       2006       2007         2008          2009       2010
       Tons (Thousand)                                                                                                                                                 Tonnes (milliers)
       Wheat, Tons (thousands)                     1 502      2 965      2 731       2 415      2 688      2 319         1 111        2 953        ...                   Blé, tonnes (milliers)

       Potato, Tons (thousands)                    1 333      1 880      1 896       2 157      2 181      1 507         2 171        2 636        ...     Pomme de terre, tonnes (milliers)

       Barely, Tons (thousands)                      416      1 222      1 212       1 033      1 236      1 187          396         2 203        ...                 Orge, tonnes (milliers)

       Tomato, Tons (thousands)                      815        887      1 092       1 023        796        567          559           641        ...             Tomates, tonnes (milliers)

       Dates, Tones (thousands)                      418        492        443         516        491        527          553           601        ...               Dattes, tonnes (milliers)


                                                                   V MINING PRODUCTION - PRODUCTION MINIERE

                                                  2002       2003       2004        2005       2006       2007         2008          2009       2010

       Crude Petroleum, metric tons                                                                                                                           Pétrole brut, tonnes métriques
                                                 45 601.0   54 869.0   59 340.0    62 545.0   63 865.0   64 085.0           ...           ...      ...
       (thousands)                                                                                                                                                                  (milliers)
82     Natural gas, terajoules (thousands)        3 213.7    3 248.4    3 216.3     3 586.3    3 844.9    3 424.7           ...           ...      ...      Gaz naturel, térajoules (milliers)

       Iron ores and concentrates, metric                                                                                                              Minerai de fer et concentrés, tonnes
                                                  1 200.0    1 378.0    1 415.0     1 950.0    2 000.0    1 982.1           ...           ...      ...
       tons (thousands)                                                                                                                                                  métriques (milliers)


                                                                                  VI ENERGY - ENERGIE

                                                  2002       2003       2004        2005       2006       2007         2008          2009       2010

       Electricity - total hydro production,                                                                                                             Électricité - production hydraulique
                                                    57.0      265.0      251.0       555.0      218.0      226.0            ...           ...      ...
       kilowatt hours (millions)                                                                                                                            totale, kilowatt-heures (millions)

       Electricity - total thermal production,                                                                                                             Électricité - production thermique
                                                 27 590.0   29 306.0   30 999.0    32 320.0   35 008.0   36 970.0           ...           ...      ...
       kilowatt hours (millions)                                                                                                                            totale, kilowatt-heures (millions)

       Electricity - total production, self-                                                                                                             Electricité - Production totale privée
                                                     245        379        365         390        452        477            ...           ...      ...
       producer (Million Kilowatt Hours)                                                                                                                           (million de kilowatt heures)

                                                                                                                                                                Electricité - Production totale
       Electricity - total production, public
                                                  27 402     29 192     30 885      32 485     34 774     36 719            ...           ...      ...           publique (million de kilowatt
       (Million Kilowatt Hours)
                                                                                                                                                                                       heures)


     African Statistical Yearbook 2011 / Annuaire Statistique pour l'Afrique 2011
Algeria                                                                                                                                                             Algérie
                                                    VII TOURISM AND INFRASTRUCTURE - TOURISME ET INFRASTUCTURE

                                         2002            2003      2004      2005       2006       2007       2008        2009       2010

Arrivals - Tourists (thousands)               ...            ...       ...        ...        ...        ...        ...         ...        ...        Arrivées - touristes (milliers)

Rooms in hotels and similar                                                                                                                                 Chambres d'hotels et
establishments (thousands)                                                                                                                      établissements assimilés (milliers)
                                              ...            ...       ...        ...        ...        ...        ...         ...        ...
Paved Road (% of total)                       ...            ...      70          ...        ...        ...        ...         ...        ...     Routes asphaltées (% du total)
Total Network (Railways-km)                   ...            ...    3 572     3 572      3 572       3 572         ...         ...        ...       Réseau total voies ferrées-Km
Main Telephone Lines (per 1,000                                                                                                                  Lignes téléphoniques fixes (pour
                                             60             70        80         80         90         90         90          70          ...
inhabitants)                                                                                                                                                     1000 habitants)
Mobile Cellular Subscribers (per                                                                                                                 Abonnés aux téléphones mobiles
                                             10             50       150        420        630        810        790         940          ...
1,000 inhabitants)                                                                                                                                        (pour 1000 habitants)


                                      VII FINANCIAL AND MONETARY STATISTICS - FINANCES ET STATISTIQUES MONETAIRES

                                         2002            2003      2004      2005       2006       2007       2008        2009       2010

VII-1 Monetary Statistics                                                                                                                 VII-1 Statistiques monétaires
Algerian Dinar (Billions)                                                                                                                       Dinar algérien (Milliards)
Money supply (M1)                          1 240          1 414     1 851     2 032      2 725       3 689      4 335       4 371      4 868               Masse monétaire (M1)
Quasi-money                                1 487          1 755     1 635     1 762      1 809       1 927      2 161       2 229      2 456                       Quasi-monnaie
  of which Demand Deposit                     ...            ...       ...        ...        ...        ...        ...         ...        ...            dont Monnaie scripturale
Net foreign assets                         1 725          2 309     3 073     4 157      5 502       7 402     10 247      10 758     11 756                Avoirs extérieurs nets
Domestic credit                            1 710          1 641     1 331       555        310      - 340     - 1 402      - 892      - 913                        Crédit intérieur

of which claims on private sector           552            589       676        902      1 030       1 215      1 413       1 621      1 818    dont créances sur le secteur privé

of which Claims on government                                                                                                                         dont créances nettes sur le
                                            426            233     - 233     - 1 255    - 1 674    - 2 602    - 4 092     - 4 079    - 4 376
sector, net                                                                                                                                                       gouvernement
International reserves (millions of                                                                                                             Réserves internationales (millions
                                          23 238         33 125    43 246    56 303     77 914     110 318    143 243     149 041    162 614
US $)                                                                                                                                                                    de $ EU)
Average Exchange Rate (National                                                                                                              Taux de change (moyen) (monnaie
                                           79.68          77.40     72.06     73.28      72.65       69.29      64.58       72.65      74.39
Currency per us $)                                                                                                                                        nationale par dollars)


VII-2 Public Finance                                                                                                                            VII-2 Finances publiques
Algerian Dinar (Billions)                                                                                                                       Dinar algérien (Milliards)
Total Revenues and Grants                  1 603          1 974     2 230     3 083      3 640       3 689      5 191       3 675      4 503              Recettes totales et dons
  Tax Revenue                              1 491          1 875     2 151     2 993      3 520       3 564      5 054       3 559      4 337                     Recettes fiscales
  Non Tax Revenue                           112             99        72         84        120        117        137         116        166                  Recettes non fiscales
  Grants                                       0              0         7          6          0          8          0           0          0                                  Dons

Total Expenditures and Net Lending
        p                        g         1 582          1 723     1 904     2 057      2 485       3 250      4 315       4 360      4 956       Dépenses totales et prêts nets
                                                                                                                                                     p                 p

  Current expenditure                       976           1 123     1 251     1 241      1 434       1 661      2 218       2 299      3 013                  Dépenses courantes
  Of which Wages and Salaries               301            330       391        492        531        629        827         880       1 330       Dont rémunérations et salaires
  Capital expenditure                       575            567       641        811      1 019       1 442      1 973       1 926      1 943              Dépenses d'équipement
  Net Lending                                31             33        12           5        32        147        124         135           0                            Prêts nets     83
Fiscal Balance                               22            252       326      1 025      1 155        438        876       - 685      - 453       Solde global y compris les dons


VII-3 Balance of Payments                                                                                                                  VII-3 Balance des paiements
Algerian Dinar (Billions)                                                                                                                       Dinar algérien (Milliards)
Trade balance                               534            860      1 029     1 942      2 474       2 363      2 487        565        760                  Balance commerciale
Services Balance                           - 94          - 104     - 144      - 167      - 160      - 284      - 536       - 631      - 328                  Balance des services
Net Income                                - 178          - 208     - 260      - 373      - 329      - 128      - 187         - 95       - 68                         Revenus nets
Current transfers, net total                 86            134       176        151        117        153        142         191        253                   Transferts courants
Current account balance                     348            683       801      1 554      2 102       2 105      1 906         30        617              Solde du compte courant


VII-4 External Debt and Financial Flows                                                                                        VII-4 Dette extérieure et flux financiers
US $ (Millions)                                                                                                                                               $ E.U (Millions)
Total external debt                       22 642         23 353    21 821    17 437      5 911       5 667      5 976       5 268      4 627               Dette extérieure totale
  Private                                  3 400          2 300     1 900     1 600      1 300       1 300      1 300       1 300      1 300                                 Privée
  Public                                  19 242         21 053    19 921    15 837      4 611       4 367      4 676       3 968      3 327                              Publique
Total external debt service                4 530          4 650     6 010     6 120     13 630       1 510      1 460        520       1 596        Service de la dette extérieure
Net Foreign Direct Investment                                                                                                                     Investissements étranger direct
                                           1 065           634       882      1 081      1 795       1 662      2 646       2 847         ...
Inflows                                                                                                                                                      (flux nets entrants)
Net Total Official Development                                                                                                                   Aide publique au développement
                                            190            238       315        346        209        390        319         319          ...
assistance                                                                                                                                                          (nette totale)


                                                                                         African Statistical Yearbook 2011 / Annuaire Statistique pour l'Afrique 2011
Algeria                                                                                                                                                     Algérie

                                              2002      2003      2004       2005       2006       2007       2008       2009      2010

       US $ (Millions)                                                                                                                                        Dinar algérien
       Exports, fob                                                                                                                                       Exportations, fàb


       Exports - Total                        18 296    24 256    31 582     45 422     53 709     59 348     78 120     44 575       ...                    Exportations - Total


       Main Products                                                                                                                                      Principaux produits


       Petroleum oils, oils from bituminous                                                                                                   Les huiles de pétrole, les huiles de
                                               8 022    11 577    18 349     24 915     31 344     33 623     43 028     21 525       ...
       minerals, crude                                                                                                                                minéraux bitumineux, brut


       Oils petroleum, bituminous,                                                                                                                Huiles de pétrole, bitumineux,
                                               2 577     3 381     3 262      4 003      4 438      5 581      7 000      5 172       ...
       distillates, except crude                                                                                                                              distilles, sauf brut


       Natural gas, liquefied                  2 542     3 410     3 391      4 635      5 274      5 145      6 656      4 967       ...                   Gaz naturel, liquéfiés


       Natural gas in gaseous state            1 151       862     1 025      1 959      2 853      3 278      4 954      9 638       ...            Gaz naturel en état gazeux


       Propane, liquefied                      1 019     1 169     1 298      1 611      1 721      2 361      2 854      1 569       ...                       Propane, liquéfié

       Main Destinations                                                                                                                             Principales destinations

       United States                          2 560.0   5 126.4   7 926.5   10 834.9   16 088.9   18 432.0   20 032.3   11 150.5      ...                              États-Unis


       Spain                                  2 804.3   3 082.8   3 599.7    5 072.0    5 766.6    6 145.3    9 503.1    5 288.8      ...                                Espagne


       France                                 1 099.0   1 716.6   2 391.0    3 446.8    4 373.3    4 739.4    7 251.6    3 310.4      ...                                  France


       Canada                                 2 555.4   3 474.2   3 574.4    4 582.2    5 190.5    4 627.2    7 082.5    3 817.9      ...                                 Canada


       Netherlands                            1 039.0    874.0    1 284.9    1 829.3    2 018.0    3 081.4    3 746.3    2 479.1      ...                               Pays-Bas


                                              2002      2003      2004       2005       2006       2007       2008       2009      2010
       Imports, cif                                                                                                                                       Importations, cif

       Imports - Total                        11 809    15 356    18 170     19 848     21 360     27 295     39 335     40 703       ...         Importations - Total (millions)


                                                                                                                                                          Principaux produits
       Main Products


       Bars & rods,i/nas,hr,hd or he,cntg                                                                                                     Barres, i / nas, hr, hd ou he, ,cntg
                                                 153       306       426        492        639        632      1 734      1 186       ...
84     indent,ribs,etc,prod dur rp/tar,nes                                                                                                  indent,ribs, etc, prod dur rp/tar, nda


       Wheat nes and meslin                      352       262       517        464        462        825      1 503        832       ...                       Blé nda et méteil


       Durum wheat                               426       421       299        374        340        405      1 224        614       ...                                 Blé dur


       Medicaments nes, in dosage                391       511       598        647        683        992      1 168      1 015       ...          Médicaments nda, en dosage


       Automobiles w reciprocatg piston
                                                                                                                                            Automobiles w reciprocatg moteur à
       engine displacg > 1000 cc to 1500         257       363       529        591        596        887      1 367      1 015       ...
                                                                                                                                             piston displacg> 1500 cc à 3000 cc
       cc

       Main Origin                                                                                                                                   Principales provenances

       France                                 3 543.0   4 183.4   5 258.2    5 809.6    5 057.7    5 695.7    8 108.2    6 959.6      ...                                  France

       Italy                                  1 170.7   1 320.4   1 533.5    1 662.2    1 948.0    2 518.7    4 402.7    3 598.0      ...                                   Italie

       China                                   351.9     645.9     980.5     1 404.4    1 947.5    2 742.0    3 751.9    4 180.2      ...                                   Chine

       Spain                                   710.7     864.9    1 030.0    1 541.0    1 351.5    1 851.2    3 191.8    2 922.3      ...                                 Canada

       Germany                                 835.0     777.8    1 215.2    1 345.8    1 351.1    1 647.1    2 169.6    2 040.0      ...                              Allemagne


     African Statistical Yearbook 2011 / Annuaire Statistique pour l'Afrique 2011
Angola                                                                                                                                                                            Angola

AREA (KM 2)                                                                                  1 246 700                                                                   SUPERFICIE (KM 2)
CAPITAL CITY                             Luanda                                                                                        Luanda                                        CAPITALE
CURRENCY                                 Angola Kwanza                                                                         Kwanza Angolais                                       MONNAIE


                        I SOCIAL AND DEMOGRAPHIC INDICATORS — INDICATEURS DEMOGRAPHIQUES ET SOCIAUX

                                           2002        2003        2004        2005        2006         2007        2008          2009         2010
Population                                                                                                                                                                        Population
                                                                                                                                                              Population au milieu de l'année -
Mid-year population - Total (Million)         15.2        15.6        16.1        16.6        17.1        17.6         18.0          18.5         19.0
                                                                                                                                                                                 Total (million)
                                                                                                                                                              Population au milieu de l'année -
Mid-year population - Urban (%)               51.0        52.0        53.0        54.0        54.9        55.8         56.7          57.6         58.5
                                                                                                                                                                                 Urbaine (%)

Female (%)                                    50.7        50.7        50.7        50.7        50.7        50.7         50.7          50.7         50.7                              Femme (%)


Population by Age Group                                                                                                                                           Population par groupe d'âge


   0-14                                   7095 591    7299 014    7497 923    7683 863    7853 334    8009 879     8160 554      8315 777     8482 773                                      0-14


   15-64                                  7695 644    7964 229    8242 679    8527 227    8817 222    9113 605     9416 062      9724 566    10039 155                                     15-64


   65+                                     372 791     383 589     394 863     406 499     418 555     431 101      444 052       457 289      470 779                                      65+


Active Population (000)                    6 646.4     6 879.6     7 108.4     7 325.8     7 549.4      7 773.2     8 010.9       8 275.4      8 532.5                  Population active (000)

   Female (%)                                 46.6        46.7        46.7        46.7        46.7        46.7         46.8          46.8         46.9                              Femme (%)

                                                                                                                                                             Taux brut de natalité - Total (par
Crude birth rate - Total (per 1000)           48.0        47.0        46.0        45.0        44.0        44.0         43.0          42.0         43.0
                                                                                                                                                                                         1000)
                                                                                                                                                           Taux brut de mortalité - Total (par
Crude death rate - Total (per 1000)           20.0        19.0        19.0        18.0        18.0        17.0         17.0          16.0         17.0
                                                                                                                                                                                        1000)
Life expectancy at birth - Total                                                                                                                             Espérance de vie à la naissance -
                                              44.0        45.0        45.0        46.0        46.0        47.0         47.0          48.0         47.0
(years)                                                                                                                                                                        Total (années)
Net reproduction rate - (per                                                                                                                                  Taux net de reproduction - (par
                                                ...         ...         ...        2.0          ...          ...         ...           ...         2.0
woman)                                                                                                                                                                                femme)
                                                                                                                                                             Indice synthétique de fécondité -
Total fertility rate - (p woman)
              y        (per    )               7.0         7.0         6.0         6.0         6.0          6.0         6.0           6.0          6.0
                                                                                                                                                                                 (par femme)

Education                                                                                                                                                                    Enseignement

Teaching staff at first level - Total                                                                                                                      Personnel enseignant - 1er degré -
                                                ...         ...         ...         ...         ...          ...         ...           ...          ...
(thousands)                                                                                                                                                                   Total (milliers)
Teaching staff at second level - Total                                                                                                                    Personnel enseignant - 2ème degré -
                                                ...         ...         ...         ...         ...          ...         ...           ...          ...                                              85
(thousands)                                                                                                                                                                    Total (milliers)
Teaching staff at third level - Total                                                                                                                   Personnel enseignant - 3ème degré -
                                               1.3          ...         ...         ...        1.3           ...         ...           ...          ...
(thousands)                                                                                                                                                                  Total (milliers)
First level student enrollment - Total                                                                                                                       Elèves inscrits - 1er degré - Total
                                                ...         ...         ...         ...      3 370       3 559        3 932            ...          ...
(thousands)                                                                                                                                                                            (milliers)
First level student enrollment -                                                                                                                          Elèves inscrits - 1er degré - Femmes
                                                ...         ...         ...         ...      1 630       1 721        1 771            ...          ...
Female (thousands)                                                                                                                                                                      (milliers)
Second level student enrollment -                                                                                                                          Elèves inscrits - 2ème degré - Total
                                              462           ...         ...         ...       458            ...         ...           ...          ...
Total (thousands)                                                                                                                                                                     (milliers)
Second level student enrollment -                                                                                                                                Elèves inscrits - 2ème degré -
                                              211           ...         ...         ...         ...          ...         ...           ...          ...
Female (thousands)                                                                                                                                                           Femmes (milliers)
Third level student enrollment - Total                                                                                                                     Elèves inscrits - 3ème degré - Total
                                              12.6        48.2        37.5        48.2        48.7           ...         ...           ...          ...
(thousands)                                                                                                                                                                           (milliers)
Third level student enrollment -                                                                                                                                 Elèves inscrits - 3ème degré -
                                               5.0          ...         ...         ...         ...          ...         ...           ...          ...
Female (thousands)                                                                                                                                                           Femmes (milliers)
Public expenditure on education (%                                                                                                                           Dépenses publiques consacrées à
                                                ...         ...         ...         ...         ...          ...         ...           ...          ...
of budget)                                                                                                                                                     l'enseignement (% du budget)

Health                                                                                                                                                                                   Santé

Hospital beds - Total (per 10 000                                                                                                                            Nombre de lits d'hôpitaux - Total
                                               14          15          16          16           ...          ...         ...           ...          ...
population)                                                                                                                                                                     (pour 10 000)
Nurses - Total (per 10 000                                                                                                                                  Nombre d'infirmières - Total (pour
                                              213         223         234         245           ...          ...         ...           ...          ...
population)                                                                                                                                                                           10 000)
Physicians - Total (per 10 000                                                                                                                              Nombre de médecins - Total (pour
                                               14          15          16          16           ...          ...        10             ...          ...
population)                                                                                                                                                                         10 000)
Public expenditure on Health (% of                                                                                                                        Dépenses publiques consacrées à la
                                                 4           5          4           5            5           ...         ...           ...          ...
budget)                                                                                                                                                                santé (% du budget)


                                                                                                  African Statistical Yearbook 2011 / Annuaire Statistique pour l'Afrique 2011
Angola                                                                                                                                                                                    Angola
                                                                      II NATIONAL ACCOUNTS — COMPTES NATIONAUX

                                                     2002            2003         2004         2005         2006         2007         2008         2009           2010

         Gross domestic product by kind of economic activity at current prices
                                                                                                                Produit intérieur brut par branche d'activité économique aux prix courants


         Angola Kwanza (Millions)                                                                                                                                             Kwanza Angolais(Millions)

         Agriculture                                 39 079          86 700      142 500      204 300      322 900      424 070      488 112      477 014              ...                            Agriculture

         Mining and quarrying                       304 093         605 100      999 300     1 792 500    2 475 240    3 185 046    4 435 571    3 830 608             ...                 Industries extractives

         Manufacturing                               18 227          40 400       66 100       94 200       32 437       41 313       51 907       48 228              ...            Industries manufacturières

         Electricity, gas & water                            ...          ...          ...          ...          ...          ...          ...          ...            ...                 Electricité, gaz et eau

         Construction                                16 994          37 900       62 100       89 400       20 924       26 707       97 001       49 499              ...          Bâtiments et travaux publics
         Wholesale & retail trade,                                                                                                                                               Commerce de gros et de détail,
                                                     58 409         127 118      202 084      277 891      357 690      476 741      720 507      583 229              ...
         restaurants, hotels                                                                                                                                                              restaurants et hôtels
                                                                                                                                                                                  Banques, assurances, affaires
         Finance, insurance, real estate, etc.               ...          ...          ...          ...          ...          ...          ...          ...            ...
                                                                                                                                                                                                  immobilières
         Transport and communications                17 638          38 382       61 016       83 909      108 002      143 948      217 554      176 102              ...      Transport(s) et communications
                                                                                                                                                                                    Administrations publiques et
         Public administration and defense           37 260          86 700      128 000      164 300      235 066      313 304      457 302      378 602              ...
                                                                                                                                                                                                        défense
         Other services                                      ...          ...          ...          ...          ...          ...          ...          ...            ...                        Autres services
                                                                                                                                                                                 Moins Services d’intermédiation
         Less Imputed Service Charges                        ...          ...          ...          ...          ...          ...          ...          ...            ...
                                                                                                                                                                                                       financière
         Gross domestic product at factor                                                                                                                                    Produit intérieur brut aux couts des
                                                    491 700        1 022 300    1 661 100    2 706 500    3 552 258    4 611 130    6 467 955    5 543 281             ...
         cost / basic prices                                                                                                                                                               facteurs / prix de base

         Plus: Indirect Taxes / taxes on                                                                                                                                     Plus taxes indirectes/impôts sur les
                                                             ...          ...          ...          ...          ...          ...          ...          ...            ...
         products, less subsidies                                                                                                                                                produits, moins les subventions


         Expenditure on Gross domestic product at current purchaser's values
                                                                                                                            Emploi du produit intérieur brut aux prix courants d'acquisition

         Angola Kwanza (Millions)                                                                                                                                             Kwanza Angolais(Millions)
                                                                                                                                                                                       Consommation finale des
         Government final consumption               174 338         350 462      501 068      686 219      770 156     1 017 251    1 667 255    1 442 455             ...
                                                                                                                                                                                       administrations publiques

         Private final consumption                  197 260         491 140      736 485      971 052     1 077 991    1 480 719    2 111 973    2 481 784             ...           Consommation finale privée

         Gross fixed capital formation               59 442         125 307      143 067      204 829      390 403      604 638      959 465      918 327              ...        Formation brute de capital fixe

         Increase in inventories                      3 106           6 552        7 481       10 708       20 412       31 613       50 163       48 014              ...                   Variation des stocks

         Exports of goods and services              372 997         724 394     1 151 280    2 116 781    2 679 690    3 429 315    4 820 382    2 933 215             ...     Exportations de biens et services
86                                                                                                                                                                                Moins importations de biens et
         Less imports of goods and services         309 517         656 629      887 331     1 319 969    1 308 984    2 017 677    3 235 538    2 294 924             ...
                                                                                                                                                                                                        services
         GDP at purchasers' values                  497 626        1 041 226    1 652 049    2 669 619    3 629 668    4 545 860    6 373 700    5 528 871             ...             PIB aux prix d'acquisition


         Gross domestic product by kind of economic activity at constant
                                                                                                              Produit intérieur brut par branche d'activité economique aux prix constants
         prices
         Annual Growth Rates (%)                                                                                                                                      Taux de croissance annuel (%)
         Agriculture                                     8.1             2.5         10.7         15.8         23.5         16.6         14.0          0.1             ...                            Agriculture

         Mining and quarrying                           16.7            11.5         13.4         18.6          0.2         36.8         10.2         -2.7             ...                 Industries extractives

         Manufacturing                                   8.7             2.4         10.6         15.7         23.0         17.1         13.8          0.1             ...            Industries manufacturières

         Electricity, gas & water                            ...          ...          ...          ...          ...          ...          ...          ...            ...                 Electricité, gaz et eau

         Construction                                    9.0             3.3         10.9         16.0         21.1         18.5         13.5         -0.1             ...          Bâtiments et travaux publics
         Wholesale & retail trade,                                                                                                                                                      Commerce de gros et de
                                                         9.5             2.3         10.6         16.2         21.8         17.8         13.7          0.0             ...
         restaurants, hotels                                                                                                                                                          détail,restaurants et hôtels
                                                                                                                                                                                   Banques, assurances, affaires
         Finance, insurance, real estate, etc.               ...          ...          ...          ...          ...          ...          ...          ...            ...
                                                                                                                                                                                                   immobilières
         Transport and communications                   11.1             4.0         13.1         12.5         19.1         21.6         12.2         -0.2             ...      Transport(s) et communications
                                                                                                                                                                                    Administrations publiques et
         Public administartion and defense              10.5             4.4          8.9         12.6         23.8         21.4         10.9          0.6             ...
                                                                                                                                                                                                        défense
         Other services                                      ...          ...          ...          ...          ...          ...          ...          ...            ...                        Autres services
                                                                                                                                                                                 Moins Services d’intérmediation
         Less Imputed Service Charges                        ...          ...          ...          ...          ...          ...          ...          ...            ...
                                                                                                                                                                                                       financière
         Gross domestic product at factor                                                                                                                                    Produit intérieur brut aux couts des
                                                        13.9             8.3         12.4         17.4          7.7         29.8         11.2         -1.7             ...
         cost / basic prices                                                                                                                                                               facteurs / prix de base

         Plus: Indirect Taxes / taxes on                                                                                                                                     Plus taxes indirectes/impôts sur les
                                                             ...          ...          ...          ...          ...          ...          ...          ...            ...
         products, less subsidies                                                                                                                                                produits, moins les subventions

         Gross domestic product at market                                                                                                                                      Produit intérieur brut aux prix du
                                                        14.5             3.3         11.2         20.6         18.6         20.3         13.2         -0.4             ...
         prices                                                                                                                                                                                           marché


         2008: semi-final                2009: Provisional                                                                                                    2008: semi-définitif            2009: provisoire


     African Statistical Yearbook 2011 / Annuaire Statistique pour l'Afrique 2011
Angola                                                                                                                                                                   Angola

Expenditure on Gross domestic product at constant purchasers'
                                                                                                         Emplois du produit intérieur brut aux prix constants d'acquisition
values

Annual Growth Rates (%)                                                                                                                    Taux de croissance annuel (%)
                                                                                                                                                             Consommation finale des
Government final consumption                  16.1        -0.7         0.2         2.2        -2.2         26.9      32.3       -0.7        ...
                                                                                                                                                             administrations publiques

Private final consumption                    -12.0        22.9         5.1        -1.6        -3.2         31.9      15.1      34.9         ...            Consommation finale privée

Gross fixed capital formation                  7.4         4.1       -20.0         6.8        66.2         48.7      28.1       9.9         ...        Formation brute de capital fixe

Exports of goods and services                 13.9        -4.1        11.4        37.2        10.4         22.9      13.5      -30.1        ...      Exportations de biens et services

                                                                                                                                                       Moins importations de biens et
Less imports of goods and services            -4.9         4.7        -5.3        11.0       -13.5         48.0      29.4      -18.6        ...
                                                                                                                                                                             services


                                                                                  III INFLATION

                                           2002        2003        2004        2005        2006         2007       2008      2009       2010
Annual Growth Rates (%)                                                                                                                    Taux de croissance annuel (%)
All Item                                    108.9        98.3        43.6        23.0        13.3         12.2       12.5      13.7       14.7                               Ensemble

Food                                            ...         ...         ...         ...         ...          ...       ...        ...       ...                           Alimentation

Health                                          ...         ...         ...         ...         ...          ...       ...        ...       ...                                  Santé

Energy                                          ...         ...         ...         ...         ...          ...       ...        ...       ...                                 Energie

Transport                                       ...         ...         ...         ...         ...          ...       ...        ...       ...                              Transport


                                                 IV AGRICULTURAL PRODUCTION - PRODUCTION AGRICOLE

                                           2002        2003        2004        2005        2006         2007       2008      2009       2010
Tons (Thousand)                                                                                                                                                 Tonnes (milliers)
Cassava, Tons (thousands)                   6 523       6 892       8 587       8 606       8 810        9 730     10 057    12 828         ...               Manioc, tonnes (milliers)

Maize, Tons (thousands)                       547         619         531         720         566          616       702        970         ...                  Maïs, tonnes (milliers)

Sweet Potato, Tons (thousands)                423         543         630         659         685          949       820        983         ...       Patates douces, tonnes (milliers)

Banana, Tons (thousands)                      300         300         300         300         300          300       300          ...       ...               Banane, tonnes (milliers)

Potato, Tons (thousands)                      179         269         242         307         593          491       402        823         ...     Pomme de terre, tonnes (milliers)


                                                        V MINING PRODUCTION - PRODUCTION MINIERE
                                                                                                                                                                                           87
                                           2002        2003        2004        2005        2006         2007       2008      2009       2010

Crude Petroleum, metric tons                                                                                                                            Pétrole brut, tonnes métriques
                                          44 758.0    43 733.0    49 443.0    62 314.0    70 494.0     84 908.0        ...        ...       ...
(thousands)                                                                                                                                                                   (milliers)
Natural gas (terajoules)                  23 560.0    24 700.0    29 266.0    25 364.0    26 534.0     32 387.0        ...        ...       ...                Gaz naturel (térajoules)

Diamonds and other precious stones,                                                                                                                        Diamants et autres pierres
                                           5 400.0     6 300.0     6 146.0     7 079.0     9 175.0           ...       ...        ...       ...
unworked, carat (thousands)                                                                                                                           précieuses, brut, carat (milliers)


                                                                              VI ENERGY - ENERGIE

                                           2002        2003        2004        2005        2006         2007       2008      2009       2010

Electricity - total hydro production,                                                                                                              Électricité - production hydraulique
                                           1 143.0     1 241.0     1 750.0     2 219.0     2 665.0      2 583.0        ...        ...       ...
kilowatt hours (millions)                                                                                                                             totale, kilowatt-heures (millions)

Electricity - total thermal production,                                                                                                              Électricité - production thermique
                                            622.0       754.0       490.0       413.0       294.0        588.0         ...        ...       ...
kilowatt hours (millions)                                                                                                                             totale, kilowatt-heures (millions)

Electricity - total production, self-                                                                                                             Electricité - Production totale privée
                                              101         149          97          82          58          116         ...        ...       ...
producer (Million Kilowatt Hours)                                                                                                                           (million de kilowatt heures)

Electricity - total production, public                                                                                                                   Electricité - Production totale
                                            1 664       1 846       2 143       2 550       2 901        3 055         ...        ...       ...
(Million Kilowatt Hours)                                                                                                                          publique (million de kilowatt heures)


                                                                                                  African Statistical Yearbook 2011 / Annuaire Statistique pour l'Afrique 2011
Angola                                                                                                                                                                                  Angola
                                                 VII TOURISM AND INFRASTRUCTURE - TOURISME ET INFRASTUCTURE

                                                   2002         2003         2004         2005         2006         2007          2008          2009          2010

        Arrivals - Tourists (thousands)                91          107          194          210          121          195           294             ...           ...           Arrivées - touristes (milliers)

        Rooms in hotels and similar                                                                                                                                    Chambres d'hotels et établissements
        establishments (thousands)                      8            9            9           10            ...          ...           ...           ...           ...                  assimilés (milliers)

        Paved Road (% of total)                         ...          ...          ...          ...          ...          ...           ...           ...           ...        Routes asphaltées (% du total)
        Total Network (Railways-km)                     ...          ...          ...          ...          ...          ...           ...           ...           ...         Réseau total voies ferrées-Km
        Main Telephone Lines (per 1,000                                                                                                                                      Lignes téléphoniques fixes (pour
                                                         5           5            6            6             6            5             6            ...           ...
        inhabitants)                                                                                                                                                                         1000 habitants)
        Mobile Cellular Subscribers (per                                                                                                                                     Abonnés aux téléphones mobiles
                                                       10           20           50          100          180          280           380           440             ...
        1,000 inhabitants)                                                                                                                                                            (pour 1000 habitants)


                                  VII FINANCIAL AND MONETARY STATISTICS - FINANCES ET STATISTIQUES MONETAIRES

                                                   2002         2003         2004         2005         2006         2007          2008          2009          2010

        VII-1 Monetary Statistics                                                                                                                                   VII-1 Statistiques monétaires
        Angola Kwanza (Millions)                                                                                                                                           Kwanza Angolais(Millions)
        Money supply (M1)                          31 856       69 075       96 059      152 910      195 448      311 539       634 872       776 770       771 800                   Masse monétaire (M1)
        Quasi-money                                75 128      108 847      147 646      238 335      420 133      541 363       782 273     1 527 070     1 639 230                           Quasi-monnaie
          of which Demand Deposit                       ...          ...          ...          ...          ...          ...           ...           ...           ...              dont Monnaie scripturale
        Net foreign assets                         93 550      142 167      223 703      386 670      923 042     1 019 500    1 508 240     1 179 830     1 395 520                    Avoirs extérieurs nets
        Domestic credit                            26 770       65 002       74 481       61 588     - 132 264      88 290       594 999     1 750 340     1 742 520                           Crédit intérieur

        of which claims on private sector          23 241       53 064       88 471      137 329      272 149      479 431       794 282     1 266 890     1 492 040       dont créances sur le secteur privé

        of which Claims on government                                                                                                                                             dont créances nettes sur le
                                                    2 092        6 076      - 23 577     - 88 385    - 421 847    - 416 041     - 263 902      417 325       120 040
        sector, net                                                                                                                                                                           gouvernement
        International reserves (millions of US                                                                                                                           Réserves internationales (millions de
                                                      376          634        1 374        3 197        8 599       11 197        17 869        13 664        19 667
        $)                                                                                                                                                                                               $ EU)
        Average Exchange Rate (National                                                                                                                                   Taux de change (moyen) (monnaie
                                                    43.53        74.61        83.54        87.16        80.37        76.71         75.03         79.33         91.91
        Currency per us $)                                                                                                                                                            nationale par dollars)


        VII-2 Public Finance                                                                                                                                                 VII-2 Finances publiques
        Angola Kwanza (Millions)                                                                                                                                           Kwanza Angolais(Millions)
        Total Revenues and Grants                 190 770      394 967      609 670     1 085 790    1 685 000    2 124 800    3 217 400     1 847 900     3 071 200                 Recettes totales et dons
          Tax Revenue                             188 800      382 041      596 600     1 050 260    1 589 500    2 052 900    3 070 200     1 703 700     3 009 300                         Recettes fiscales
          Non Tax Revenue                           1 970        4 900        5 570       29 170       95 500       69 600       145 300       142 900        60 000                    Recettes non fiscales
88        Grants                                        0        8 026        7 500        6 360             0       2 300         1 900         1 300         1 900                                     Dons

        Total Expenditures and Net Lending        225 930      467 484      591 890      859 670     1 288 300    1 599 500    2 653 800     2 363 400     2 679 000           Dépenses totales et prêts nets

          Current expenditure                     191 780      390 794      506 350      724 950      852 300     1 068 200    1 761 200     1 620 100     1 733 200                     Dépenses courantes
          Of which Wages and Salaries              53 100      129 000      170 400      246 700      311 300      364 500       543 000       660 200       866 600           Dont rémunérations et salaires
          Capital expenditure                      34 150       76 690       73 300      134 720      436 000      531 300       892 600       743 300       945 800                 Dépenses d'équipement
          Net Lending                                   0            0       12 240            0             0            0             0             0            ...                              Prêts nets
        Fiscal Balance                            - 35 160     - 72 517      17 780      226 120      396 700      525 300       563 600      - 515 500      392 200          Solde global y compris les dons


        VII-3 Balance of Payments                                                                                                                                        VII-3 Balance des paiements
        Angola Kwanza (Millions)                                                                                                                                           Kwanza Angolais(Millions)
        Trade balance                             199 627      300 517      637 751     1 373 304    1 855 051    2 357 577    3 221 306     1 441 235     2 636 206                    Balance commerciale
        Services Balance                         - 136 147    - 232 752    - 373 803    - 576 493    - 484 346    - 945 938    -1 636 463    -1 471 221    -1 702 461                    Balance des services
        Net Income                                - 71 441    - 128 806    - 207 231    - 351 328    - 440 751    - 673 327    -1 088 263     - 541 256     - 814 836                            Revenus nets
        Current transfers, net total                1 399        7 379          542        2 327      - 15 268     - 17 029      - 15 757      - 29 351      - 37 957                     Transferts courants
        Current account balance                    - 6 563     - 53 663      57 260      447 810      914 686      721 283       480 824      - 600 594       80 952                Solde du compte courant


        VII-4 External Debt and Financial Flows                                                                                                       VII-4 Dette extérieure et flux financiers
        US $ (Millions)                                                                                                                                                                   $ E.U (Millions)
        Total external debt                         8 574        8 565       10 161       12 091        9 364       11 781        16 604        17 902        19 116                   Dette extérieure totale
          Private                                   2 508        2 377        3 562        4 813        3 896        5 920         8 993         9 601        11 038                                    Privée
          Public                                    6 066        6 188        6 599        7 277        5 468        5 860         7 610         8 301         8 078                                 Publique
        Total external debt service                 2 167        2 324        2 285        2 646        2 909        4 323         2 750         4 881         4 862            Service de la dette extérieure
        Net Foreign Direct Investment                                                                                                                                    Investissements étranger direct (flux
                                                    3 133        5 685        5 606        6 794        9 064        9 796        16 581        13 101             ...
        Inflows                                                                                                                                                                                nets entrants)
        Net Total Official Development                                                                                                                                      Aide publique au développement
                                                      414          494        1 144          415          164          248           369           239             ...
        assistance                                                                                                                                                                             (nette totale)


     African Statistical Yearbook 2011 / Annuaire Statistique pour l'Afrique 2011
Angola                                                                                                                                                          Angola

                                        2002       2003      2004      2005       2006        2007        2008        2009       2010

US $ (Millions)                                                                                                                                        Kwanza Angolais
Exports, fob                                                                                                                                           Exportations, fàb


Exports - Total                          8 328      9 508    13 475    24 109     32 982      43 489           ...         ...      ...                  Exportations - Total


Main Products                                                                                                                                          Principaux produits


Crude oil                                7 539      8 530    12 442    22 583     29 929      42 352           ...         ...      ...                           Pétrole brut


Diamond                                    638        788       790     1 092      1 155       1 182           ...         ...      ...                              Diamond


Refined oil                                 96        139       148       242        295         324           ...         ...      ...                        Pétrole raffiné


Gas                                         10         16        30        30        260         328           ...         ...      ...                                    Gaz


Coffee                                       1          0         0         0          0           0           ...         ...      ...                                   Café

Main Destinations                                                                                                                                 Principales destinations

United States                           3 275.3    4 506.2   4 796.8   8 846.5   12 174.6    12 926.0    19 497.7     9 703.1       ...                             États-Unis


China                                   1 087.0    2 205.9   4 717.3   6 581.8   10 933.3    12 888.7    22 382.5    14 675.8       ...                                 Chine


France                                   635.7      694.0     815.4    1 749.1    1 553.2     2 370.5     4 010.3     3 270.5       ...                                France


Taiwan, China                            598.5      754.8     859.1     983.5     1 866.9     2 121.5     1 926.2     1 058.6       ...                        Taiwan, Chine


Chile                                       0.0      64.5     430.8    1 197.1    1 317.2      962.5      1 671.2        42.5       ...                                   Chili


                                        2002       2003      2004      2005       2006        2007        2008        2009       2010
Imports, cif                                                                                                                                           Importations, cif

Imports - Total                          3 066      4 467     7 055     8 221     11 307      13 085      21 806      17 447        ...        Importations - Total (millions)    89

                                                                                                                                                       Principaux produits
Main Products


                                                                                                                                              Flottantes ou submersibles de
Floating or submersible drilling or
                                             ...      338       989       708        171           ...       940            2       ... forage ou de production des plates-
production platforms
                                                                                                                                                                    formes

Parts of boring or sinking machinery,                                                                                                       Pièces du forage ou de fonçage,
                                           225        267       384       442        479         538         593         442        ...
whether or not self-propelled                                                                                                              qu'ils soient ou non autopropulsés

Petroleum oils&oils obtained from                                                                                                              Huiles de pétrole, bitumineux,
bituminous minerals,o/than crude            27         68        39        44        151         279         539         755        ...
                                                                                                                                                           distilles, sauf brut
etc
Aircraft nes of an unladen weight                                                                                                           Aéronefs nda d'un poids à vide >
                                             3          1         3        71        702         339         485          58        ...
exceeding 15,000 kg                                                                                                                         2.000 kg mais pas sup 15.000 kg


Diesel powered trucks with a GVW                                                                                                          Diesel chariots de manutention d'un
                                            14         27        26        31         89         180         379         204        ...
exceeding twenty tonnes                                                                                                                      PTAC n'excédant pas cinq tonnes


Main Origin                                                                                                                                       Principales provenances

Portugal                                 536.9      738.6     833.5     996.0     1 518.5     2 302.1     3 339.1     3 126.7       ...                               Portugal

United States                            372.5      491.7     594.2     927.9     1 550.2     1 280.2     2 117.0     1 422.9       ...                             États-Unis

Korea, Rep.                               18.5       24.8    1 814.1   1 517.4    1 037.1      173.7      1 266.3      325.3        ...                            Corée, Rép

China                                     61.3      145.8     193.5     372.8      894.2      1 234.5     2 942.5     2 386.0       ...                        Taiwan, Chine

Brazil                                   199.6      235.5     357.2     520.8      836.7      1 218.1     1 974.6     1 333.0       ...                                  Brésil


                                                                                        African Statistical Yearbook 2011 / Annuaire Statistique pour l'Afrique 2011
Benin                                                                                                                                                                             Bénin

        AREA (KM 2)                                                                                   114 763                                                                 SUPERFICIE (KM 2)
        CAPITAL CITY                             Porto Novo                                                                                Porto-Novo                                     CAPITALE
        CURRENCY                                 CFA Franc                                                                                  Franc CFA                                     MONNAIE


                                I SOCIAL AND DEMOGRAPHIC INDICATORS — INDICATEURS DEMOGRAPHIQUES ET SOCIAUX

                                                   2002        2003        2004        2005        2006         2007        2008        2009        2010
        Population                                                                                                                                                                     Population
                                                                                                                                                                   Population au milieu de l'année -
        Mid-year population - Total (Million)          7.1         7.4         7.6         7.9         8.1          8.4         8.7         8.9         9.2
                                                                                                                                                                                      Total (million)
                                                                                                                                                                   Population au milieu de l'année -
        Mid-year population - Urban (%)               39.0        39.3        39.6        40.0        40.4        40.8         41.2        41.6        42.0
                                                                                                                                                                                      Urbaine (%)

        Female (%)                                    51.5        51.5        51.5        51.5        51.5        51.5         51.6        51.6        51.6                              Femme (%)


        Population by Age Group                                                                                                                                        Population par groupe d'âge


           0-14                                   3156 140    3248 808    3343 659    3440 667    3539 711    3640 591     3743 072    3846 864    3951 633                                      0-14


           15-64                                  3733 456    3878 814    4028 587    4179 656    4331 431    4484 859     4640 189    4798 063    4959 038                                     15-64


           65+                                     223 330     230 520     238 484     247 303     257 066     267 682      278 825     290 058     301 070                                      65+


        Active Population (000)                    2 853.6     2 969.4     3 090.1     3 212.4     3 334.2      3 456.5     3 579.5     3 698.2     3 825.2                  Population active (000)

           Female (%)                                 45.9        45.9        45.9        45.8        45.8        45.8         45.8        46.3        46.4                              Femme (%)

                                                                                                                                                                  Taux brut de natalité - Total (par
        Crude birth rate - Total (per 1000)           41.0        41.0        41.0        40.0        40.0        40.0         39.0        39.0        40.0
                                                                                                                                                                                              1000)
                                                                                                                                                                Taux brut de mortalité - Total (par
        Crude death rate - Total (per 1000)           11.0        10.0        10.0        10.0        10.0          9.0         9.0         9.0         9.0
                                                                                                                                                                                             1000)
        Life expectancy at birth - Total                                                                                                                          Espérance de vie à la naissance -
                                                      59.0        59.0        60.0        60.0        61.0        61.0         61.0        62.0        61.0
        (years)                                                                                                                                                                     Total (années)
        Net reproduction rate - (per                                                                                                                               Taux net de reproduction - (par
                                                        ...         ...         ...        2.0          ...          ...         ...         ...        2.0
        woman)                                                                                                                                                                             femme)
                                                                                                                                                                  Indice synthétique de fécondité -
        Total fertility rate - (p woman)
                      y        (per    )               6.0         6.0         6.0         6.0         6.0          6.0         5.0         5.0         5.0
                                                                                                                                                                                      (par femme)

        Education                                                                                                                                                                 Enseignement

        Teaching staff at first level - Total                                                                                                                   Personnel enseignant - 1er degré -
                                                        ...         ...         ...         ...         ...          ...         ...         ...         ...
        (thousands)                                                                                                                                                                Total (milliers)
        Teaching staff at second level - Total                                                                                                                 Personnel enseignant - 2ème degré -
90                                                      ...         ...         ...         ...         ...          ...         ...         ...         ...
        (thousands)                                                                                                                                                                 Total (milliers)
        Teaching staff at third level - Total                                                                                                                  Personnel enseignant - 3ème degré -
                                                        ...         ...         ...         ...         ...          ...         ...         ...         ...
        (thousands)                                                                                                                                                                 Total (milliers)
        First level student enrollment - Total                                                                                                                    Elèves inscrits - 1er degré - Total
                                                        ...         ...         ...         ...         ...          ...         ...         ...         ...
        (thousands)                                                                                                                                                                         (milliers)
        First level student enrollment -                                                                                                                       Elèves inscrits - 1er degré - Femmes
                                                      476         516         565         574         603            ...       729           ...         ...
        Female (thousands)                                                                                                                                                                   (milliers)
        Second level student enrollment -                                                                                                                       Elèves inscrits - 2ème degré - Total
                                                      287         312         345         435           ...          ...         ...         ...         ...
        Total (thousands)                                                                                                                                                                  (milliers)
        Second level student enrollment -                                                                                                                             Elèves inscrits - 2ème degré -
                                                       91          98         109         154           ...          ...         ...         ...         ...
        Female (thousands)                                                                                                                                                        Femmes (milliers)
        Third level student enrollment - Total                                                                                                                  Elèves inscrits - 3ème degré - Total
                                                      34.3        39.4        41.3        42.2        42.6           ...         ...         ...         ...
        (thousands)                                                                                                                                                                        (milliers)
        Third level student enrollment -                                                                                                                              Elèves inscrits - 3ème degré -
                                                        ...         ...         ...         ...         ...          ...         ...         ...         ...
        Female (thousands)                                                                                                                                                        Femmes (milliers)
        Public expenditure on education (%                                                                                                                        Dépenses publiques consacrées à
                                                        ...         ...       17.1          ...       18.0           ...         ...         ...         ...
        of budget)                                                                                                                                                  l'enseignement (% du budget)

        Health                                                                                                                                                                                Santé

        Hospital beds - Total (per 10 000                                                                                                                         Nombre de lits d'hôpitaux - Total
                                                       12          12          10          11          32            ...         ...         ...         ...
        population)                                                                                                                                                                  (pour 10 000)
        Nurses - Total (per 10 000                                                                                                                               Nombre d'infirmières - Total (pour
                                                       36          37          38          39            5           ...         ...         ...         ...
        population)                                                                                                                                                                        10 000)
        Physicians - Total (per 10 000                                                                                                                           Nombre de médecins - Total (pour
                                                       12          12          10          11            1           ...         ...         ...         ...
        population)                                                                                                                                                                      10 000)
        Public expenditure on Health (% of                                                                                                                     Dépenses publiques consacrées à la
                                                       11          11          13          12          11            ...         ...         ...         ...
        budget)                                                                                                                                                             santé (% du budget)


     African Statistical Yearbook 2011 / Annuaire Statistique pour l'Afrique 2011
Benin                                                                                                                                                                                       Bénin
                                                             II NATIONAL ACCOUNTS — COMPTES NATIONAUX

                                            2002            2003         2004         2005         2006         2007         2008         2009           2010

Gross domestic product by kind of economic activity at current prices
                                                                                                       Produit intérieur brut par branche d'activité économique aux prix courants


CFA Franc (Millions)                                                                                                                                                         Franc CFA (Millions)

Agriculture                                660 564         663 523      690 255      742 225      798 012      830 521      956 250     1 056 337      1 171 602                             Agriculture

Mining and quarrying                         4 339           4 691        4 976        5 329        5 762        6 289        7 132        7 783           8 495                  Industries extractives

Manufacturing                              166 056         171 165      167 603      180 289      185 427      198 962      218 412      244 404        281 262              Industries manufacturières

Electricity, gas & water                    20 648          25 510       25 859       27 658       28 391       29 004       29 149       34 127          40 311                  Electricité, gaz et eau

Construction                                74 296          82 225       86 771       92 900      100 448      109 848      124 806      139 041        151 809            Bâtiments et travaux publics
Wholesale & retail trade,                                                                                                                                               Commerce de gros et de détail,
                                           256 942         277 179      283 364      306 900      326 632      353 516      398 280      433 311        490 517
restaurants, hotels                                                                                                                                                              restaurants et hôtels
                                                                                                                                                                         Banques, assurances, affaires
Finance, insurance, real estate, etc.      233 903         250 671      264 015      282 758      305 273      331 544      360 885      388 122        420 931
                                                                                                                                                                                         immobilières
Transport and communications               137 494         160 997      163 704      175 328      195 076      222 201      254 257      278 123        309 482        Transport(s) et communications
                                                                                                                                                                           Administrations publiques et
Public administration and defense          245 276         264 595      270 500      292 967      311 802      337 466      380 198      413 639        468 248
                                                                                                                                                                                               défense
Other services                                      ...          ...          ...          ...          ...          ...          ...          ...            ...                        Autres services
                                                                                                                                                                        Moins Services d’intermédiation
Less Imputed Service Charges               - 32 373        - 35 001     - 36 059     - 39 207     - 41 991     - 45 529     - 50 333     - 55 447       - 64 248
                                                                                                                                                                                              financière
Gross domestic product at factor                                                                                                                                    Produit intérieur brut aux couts des
                                          1 767 146       1 865 555    1 920 989    2 067 146    2 214 834    2 373 822    2 679 035    2 939 442      3 278 409
cost / basic prices                                                                                                                                                               facteurs / prix de base

Plus: Indirect Taxes / taxes on                                                                                                                                     Plus taxes indirectes/impôts sur les
                                           189 758         201 908      219 024      231 569      245 410      267 482      295 621      321 953        351 866
products, less subsidies                                                                                                                                                produits, moins les subventions


Expenditure on Gross domestic product at current purchaser's values
                                                                                                                   Emploi du produit intérieur brut aux prix courants d'acquisition

CFA Franc (Millions)                                                                                                                                                         Franc CFA (Millions)
                                                                                                                                                                              Consommation finale des
Government final consumption               241 069         261 009      258 736      275 834      297 902      323 720      351 936      376 865        403 561
                                                                                                                                                                              administrations publiques

Private final consumption                 1 525 769       1 595 144    1 622 894    1 765 750    1 884 542    2 002 340    2 262 436    2 431 175      2 647 962            Consommation finale privée

Gross fixed capital formation              370 223         404 061      415 452      444 949      481 079      526 031      596 519      663 807        724 479          Formation brute de capital fixe

Increase in inventories                     - 9 164         15 732       26 951      - 27 582      24 613       21 909       13 385       44 343          28 470                    Variation des stocks

Exports of goods and services              434 811         433 669      428 657      495 939      454 530      515 832      583 342      644 803        797 371       Exportations de biens et services
                                                                                                                                                                         Moins importations de biens et
                                                                                                                                                                                                            91
Less imports of goods and services         605 803         642 151      612 676      656 176      682 423      748 529      832 963      899 600        971 567
                                                                                                                                                                                               services
GDP at purchasers' values                 1 956 904       2 067 463    2 140 013    2 298 715    2 460 244    2 641 304    2 974 656    3 261 395      3 630 275              PIB aux prix d'acquisition


Gross domestic product by kind of economic activity at constant
                                                                                                     Produit intérieur brut par branche d'activité economique aux prix constants
prices
Annual Growth Rates (%)                                                                                                                                      Taux de croissance annuel (%)
Agriculture                                     2.5             2.2          6.3         -0.8          5.6          4.2          4.3          7.5            8.9                             Agriculture

Mining and quarrying                            6.0             6.0          4.0          5.0          6.0          7.0          8.0          7.0            7.0                  Industries extractives

Manufacturing                                   6.3             0.7         -2.1          5.3         -3.6          3.0          4.2          9.4           14.9             Industries manufacturières

Electricity, gas & water                       16.9             8.7          0.4          6.7          2.4          1.9         -0.4         14.8           15.8                  Electricité, gaz et eau

Construction                                    5.3             7.4          3.5          5.0          6.0          7.2          8.2          7.1            7.0           Bâtiments et travaux publics
Wholesale & retail trade,                                                                                                                                                      Commerce de gros et de
                                                4.4             6.0         -0.1          6.0          3.2          5.3          6.8          5.2           10.2
restaurants, hotels                                                                                                                                                          détail,restaurants et hôtels
                                                                                                                                                                          Banques, assurances, affaires
Finance, insurance, real estate, etc.           4.8             6.3          0.0          6.1          3.5          5.5          6.7          5.7           10.7
                                                                                                                                                                                          immobilières
Transport and communications                    4.8             7.4         -0.8          5.7          4.0          5.9          8.2          6.2            8.0       Transport(s) et communications
                                                                                                                                                                           Administrations publiques et
Public administartion and defense               4.1             4.7          3.7          4.0          4.8          4.6          5.0          4.7            5.2
                                                                                                                                                                                               défense
Other services                                      ...          ...          ...          ...          ...          ...          ...          ...            ...                        Autres services
                                                                                                                                                                        Moins Services d’intérmediation
Less Imputed Service Charges                    6.0             6.0          1.0          6.6          5.0          6.3          6.3          8.0           13.6
                                                                                                                                                                                              financière
Gross domestic product at factor                                                                                                                                    Produit intérieur brut aux couts des
                                                4.0             3.9          2.8          2.8          3.8          4.6          5.3          6.8            9.4
cost / basic prices                                                                                                                                                               facteurs / prix de base

Plus: Indirect Taxes / taxes on                                                                                                                                     Plus taxes indirectes/impôts sur les
                                                9.8             3.2          6.7          3.8          3.3          4.9          5.0          5.7            6.7
products, less subsidies                                                                                                                                                produits, moins les subventions

Gross domestic product at market                                                                                                                                      Produit intérieur brut aux prix du
                                                4.4             3.9          3.1          2.9          3.8          4.6          5.3          6.7            9.2
prices                                                                                                                                                                                           marché


2008: semi-final                2009: Provisional                                                                                                    2008: semi-définitif            2009: provisoire


                                                                                                         African Statistical Yearbook 2011 / Annuaire Statistique pour l'Afrique 2011
Benin                                                                                                                                                      Bénin

        Expenditure on Gross domestic product at constant purchasers'
                                                                                                 Emplois du produit intérieur brut aux prix constants d'acquisition
        values

        Annual Growth Rates (%)                                                                                                    Taux de croissance annuel (%)
                                                                                                                                                     Consommation finale des
        Government final consumption                4.3      7.1     -3.1        3.5      3.5      4.1        4.9       4.6        5.0
                                                                                                                                                     administrations publiques

        Private final consumption                   5.6      4.9      0.4        2.4      2.6      2.6        3.5       3.8       10.5             Consommation finale privée

        Gross fixed capital formation               7.5      9.0      1.6        4.0      5.0      6.0        8.3       7.0        7.0         Formation brute de capital fixe

        Exports of goods and services               4.0      1.9     -1.5       13.4     -5.0     13.3       11.0       6.7       11.7       Exportations de biens et services

                                                                                                                                               Moins importations de biens et
        Less imports of goods and services          3.0     10.0     -6.0        2.4      2.0      8.0        6.7       4.7        9.7
                                                                                                                                                                     services


                                                                                III INFLATION

                                                  2002     2003     2004      2005      2006     2007      2008      2009      2010
        Annual Growth Rates (%)                                                                                                    Taux de croissance annuel (%)
        All Item                                    2.5      1.5      0.9        5.4      3.8      1.3        7.9       2.2        2.1                               Ensemble

        Food                                        2.4      1.5      0.9        5.4      3.8      1.3        7.9       2.2        1.2                            Alimentation

        Health                                      2.5      1.0      0.6       -0.5     -1.6      1.1        2.4       0.4        0.0                                   Santé

        Energy                                      3.3      5.3      1.4        7.7      7.0      -0.4       4.9       2.7        0.4                                  Energie

        Transport                                   2.5      1.0      0.6       -0.5     -1.6      1.1        2.4       0.4        0.0                               Transport


                                                      IV AGRICULTURAL PRODUCTION - PRODUCTION AGRICOLE

                                                  2002     2003     2004      2005      2006     2007      2008      2009      2010
        Tons (Thousand)                                                                                                                                 Tonnes (milliers)
        Cassava, Tons (thousands)                 2 452    3 055    2 955      2 861    2 524    2 284      2 629        ...        ...               Manioc, tonnes (milliers)

        Yams, Tons (thousands)                    1 875    2 011    2 257      2 084    2 240    1 682      1 803        ...        ...              Igname, tonnes (milliers)

        Maize, Tons (thousands)                     622      788      843       865       672      932      1 030        ...        ...                  Maïs, tonnes (milliers)

        Seed cotton, Tons (thousands)               486      420      425       341       250      269       245        229         ...     Graines de coton, tonnes (millers)

        Sorghum, Tons (thousands)                   195      163      164       169       156      117       132         ...        ...               Sorgho, tonnes (milliers)


                                                           V MINING PRODUCTION - PRODUCTION MINIERE
92
                                                  2002     2003     2004      2005      2006     2007      2008      2009      2010

        Gold ores and concentrantes                                                                                                                 Minerais d'or et concentrés
                                                   20.0     20.0     20.0         ...      ...       ...       ...       ...        ...
        (Kilograms)                                                                                                                                              (kilogrammes)
        Salt and pure sodium chloride,             15.0     15.0     15.0       15.0     15.0     15.0         ...       ...        ...         Sel et chlorure de sodium pur,
        metric tons (thousands)                                                                                                                     tonnes métriques (milliers)

                                                     ...      ...      ...        ...      ...       ...       ...       ...        ...


                                                                             VI ENERGY - ENERGIE

                                                  2002     2003     2004      2005      2006     2007      2008      2009      2010

        Electricity - total hydro production,                                                                                              Électricité - production hydraulique
                                                    2.0      2.0      1.0        1.0      1.0      1.0         ...       ...        ...
        kilowatt hours (millions)                                                                                                             totale, kilowatt-heures (millions)

        Electricity - total thermal production,                                                                                              Électricité - production thermique
                                                   61.0     78.0     80.0      106.0    127.0    131.0         ...       ...        ...
        kilowatt hours (millions)                                                                                                             totale, kilowatt-heures (millions)

        Electricity - total production, self-                                                                                             Electricité - Production totale privée
                                                     10       11       10        25        27       27         ...       ...        ...
        producer (Million Kilowatt Hours)                                                                                                           (million de kilowatt heures)

        Electricity - total production, public                                                                                                   Electricité - Production totale
                                                     53       69       71        82       101      105         ...       ...        ...
        (Million Kilowatt Hours)                                                                                                          publique (million de kilowatt heures)


     African Statistical Yearbook 2011 / Annuaire Statistique pour l'Afrique 2011
Benin                                                                                                                                                                                   Bénin
                                         VII TOURISM AND INFRASTRUCTURE - TOURISME ET INFRASTUCTURE

                                           2002         2003         2004         2005         2006         2007         2008         2009         2010

Arrivals - Tourists (thousands)                72          175          174          176          180          186            ...          ...          ...           Arrivées - touristes (milliers)

Rooms in hotels and similar                                                                                                                                 Chambres d'hotels et établissements
establishments (thousands)                  6.956        6.682       13.364        20.32        20.32            ...          ...          ...          ...                  assimilés (milliers)

Paved Road (% of total)                         ...          ...         10            ...          ...          ...          ...          ...          ...        Routes asphaltées (% du total)
Total Network (Railways-km)                     ...          ...          ...          ...          ...          ...          ...          ...          ...         Réseau total voies ferrées-Km
Main Telephone Lines (per 1,000                                                                                                                                   Lignes téléphoniques fixes (pour
                                               10           10           10           10           10           10           10           10            ...
inhabitants)                                                                                                                                                                      1000 habitants)
Mobile Cellular Subscribers (per                                                                                                                                  Abonnés aux téléphones mobiles
                                               30           30           60           80          130          240          420          560            ...
1,000 inhabitants)                                                                                                                                                         (pour 1000 habitants)


                          VII FINANCIAL AND MONETARY STATISTICS - FINANCES ET STATISTIQUES MONETAIRES

                                           2002         2003         2004         2005         2006         2007         2008         2009         2010

VII-1 Monetary Statistics                                                                                                                                VII-1 Statistiques monétaires
CFA Franc (Millions)                                                                                                                                                    Franc CFA (Millions)
Money supply (M1)                         367 349      407 517      337 230      449 393      503 066      589 865      750 172      764 252      756 385                   Masse monétaire (M1)
Quasi-money                               133 270      146 924      165 414      185 262      223 606      279 472      350 100      424 330      447 856                           Quasi-monnaie
  of which Demand Deposit                       ...          ...          ...          ...          ...          ...          ...          ...          ...              dont Monnaie scripturale
Net foreign assets                        438 177      395 519      335 907      378 844      525 485      671 945      700 332      657 785      642 243                    Avoirs extérieurs nets
Domestic credit                           109 070      197 363      213 225      299 242      255 787      231 973      442 261      599 334      606 034                           Crédit intérieur

of which claims on private sector         222 228      293 849      312 052      375 102      415 821      519 922      624 350      698 548      724 485       dont créances sur le secteur privé

of which Claims on government                                                                                                                                          dont créances nettes sur le
                                         - 113 158     - 96 486     - 98 827     - 75 860    - 160 034    - 287 949    - 182 089     - 99 214    - 118 451
sector, net                                                                                                                                                                        gouvernement
International reserves (millions of US                                                                                                                        Réserves internationales (millions de
                                              616          718          640          657          912        1 209        1 263        1 230        1 021
$)                                                                                                                                                                                            $ EU)
Average Exchange Rate (National                                                                                                                                Taux de change (moyen) (monnaie
                                           696.99       581.20       528.29       527.47       522.89       479.27       447.81       472.19       495.28
Currency per us $)                                                                                                                                                         nationale par dollars)


VII-2 Public Finance                                                                                                                                              VII-2 Finances publiques
CFA Franc (Millions)                                                                                                                                                    Franc CFA (Millions)
Total Revenues and Grants                 337 047      385 389      407 100      435 103      472 600      626 900      633 300      675 900      827 500                 Recettes totales et dons
  Tax Revenue                             282 425      311 527      311 409      334 020      378 797      446 740      512 200      500 400      575 600                         Recettes fiscales
  Non Tax Revenue                          35 680       37 090       39 980       49 420       38 103      101 260       69 100       75 400      106 300                    Recettes non fiscales
  Grants                                   18 942       36 772       55 711       51 663       55 700       78 900       52 000      100 100      145 600                                     Dons      93
Total Expenditures and Net Lending        382 115      426 336      429 499      489 247      483 800      585 300      684 500      805 400      876 000           Dépenses totales et prêts nets

  Current expenditure                     259 264      287 209      297 751      345 881      369 189      386 656      465 000      490 400      555 100                     Dépenses courantes
  Of which Wages and Salaries              90 050      107 960      118 300      130 280      134 996      143 100      182 400      225 900      243 200           Dont rémunérations et salaires
  Capital expenditure                     119 617      141 127      131 048      144 167      113 400      198 444      174 700      302 300      320 900                 Dépenses d'équipement
  Net Lending                               3 234       - 2 000         700        - 800        1 211          200       44 800       12 700             0                               Prêts nets
Fiscal Balance                            - 45 068     - 40 946     - 22 399     - 54 144     - 11 200      41 600      - 51 200    - 129 500     - 48 500         Solde global y compris les dons


VII-3 Balance of Payments                                                                                                                                     VII-3 Balance des paiements
CFA Franc (Millions)                                                                                                                                                    Franc CFA (Millions)
Trade balance                            - 161 226    - 161 759    - 235 547    - 214 567    - 257 201    - 378 900    - 406 400    - 376 476    - 367 186                   Balance commerciale
Services Balance                          - 28 740     - 33 032     - 26 316     - 24 785     - 23 491     - 33 900       9 300      - 29 249      - 8 299                    Balance des services
Net Income                                - 18 125     - 15 015     - 20 513     - 20 287     - 15 394      - 4 300      - 5 100      - 4 537      - 5 900                            Revenus nets
Current transfers, net total               96 335       99 998      128 080      111 031      154 840      148 700      162 000      177 716      147 887                      Transferts courants
Current account balance                  - 111 756    - 109 808    - 154 296    - 148 608    - 141 246    - 268 400    - 240 200    - 232 546    - 233 497               Solde du compte courant


VII-4 External Debt and Financial Flows                                                                                                     VII-4 Dette extérieure et flux financiers
US $ (Millions)                                                                                                                                                                $ E.U (Millions)
Total external debt                         1 344        1 301        1 370        1 626          544          698        1 040        1 141        1 373                   Dette extérieure totale
  Private                                       0            0            0            0            0             0            0          71           67                                    Privée
  Public                                    1 344        1 301        1 370        1 626          544          698        1 040        1 070        1 306                                 Publique
Total external debt service                    62           66           58           38        1 112           90           37           45           60            Service de la dette extérieure
Net Foreign Direct Investment                                                                                                                                 Investissements étranger direct (flux
                                               14           45           65           53           55          261          174           93            ...
Inflows                                                                                                                                                                             nets entrants)
Net Total Official Development                                                                                                                                   Aide publique au développement
                                              219          300          394          347          378          474          641          683            ...
assistance                                                                                                                                                                          (nette totale)


                                                                                                      African Statistical Yearbook 2011 / Annuaire Statistique pour l'Afrique 2011
Benin                                                                                                                                        Bénin

                                                 2002    2003    2004    2005       2006    2007    2008    2009     2010

        US $ (Millions)                                                                                                                             Franc CFA
        Exports, fob                                                                                                                      Exportations, fàb


        Exports - Total                            312     314     300      305       385     502     530     478       ...                  Exportations - Total


        Main Products                                                                                                                     Principaux produits


        Cotton                                     127     184     203      167        91      61      70      ...      ...            Coton, non card‚ ni peign‚


        Coconuts, cashew nuts                       12       8       9       11         9       8      12      ...      ...          Noix de coco, noix de cajou


        Tobacco                                      4       9      19       19        35      15       6      ...      ...                               Tabacs


                                                                                                                                 Or (y compris l'or platine), sous
        Gold (incl. Gold platine), crude,
                                                     9       3       0        4         4       4       0      ...      ...    formes brutes ou mi-ouvré ou en
        worked or in powder
                                                                                                                                                           poudre

        Fruits oilseeds                              3       5       3        3         3       3       1      ...      ...   Autres graines et fruits oléagineux

        Main Destinations                                                                                                            Principales destinations

        China                                     11.3    36.2    49.5      55.4     28.0    31.4    31.3      ...      ...                                 Chine


        India                                     29.4    16.0    11.7      10.6     10.1    16.4    17.2      ...      ...                                  Inde


        Brasil                                     0.6     0.5     0.3       0.1      2.5     2.0     0.0      ...      ...                                 Brésil


        Nigeria                                   24.9     7.4     7.2       8.8     10.2    19.0    39.5      ...      ...                               Nigeria


        Indonesia                                 16.7    14.7    12.9       5.6      2.0     4.3    11.0      ...      ...                            Indonésie


                                                 2002    2003    2004    2005       2006    2007    2008    2009     2010
        Imports, cif                                                                                                                       Importations, cif

94      Imports - Total                          1 427   1 635   1 713     2 423    3 234   4 623   6 298   5 311       ...        Importations - Total (millions)


                                                                                                                                          Principaux produits
        Main Products


        Plain weave cotton fabric,>/=85%,
                                                    61     115     103      148       242     428     702     575       ...       Tissus de coton à armure toile
        >100 g/m2 to 200 g/m2, printed

        Petroleum oils&oils obtained from
                                                                                                                                  Huiles de pétrole, bitumineux,
        bituminous minerals,o/than crude            12      38      89      165       141     271     650     479       ...
                                                                                                                                              distilles, sauf brut
        etc
        Rice, semi-milled or wholly milled,                                                                                   Riz semi-blanchi ou blanchi, même
                                                    14      62     105      179       205     297     505     462       ...
        whether or not polished or glazed                                                                                                           poli ou glacé
        Automobiles w reciprocatg piston                                                                                      Automobiles w recipro catg moteur
        engine displacg > 1500 cc to 3000           66      80      83      103       145     273     495     265       ...    à piston displacg> 1500 cc à 3000
        cc                                                                                                                                                    cc
                                                                                                                                  Huile de palme et ses fractions,
        Palm oil and its fractions refined but
                                                     9      24      20       30       105     222     424     308       ...    raffinées, mais non chimiquement
        not chemically modified
                                                                                                                                                        modifiées

        Main Origin                                                                                                                  Principales provenances

        France                                   120.5   124.8   102.5      87.3     91.5   148.8   128.9      ...      ...                                France

        China                                     32.3    36.4    31.4      41.7     44.8    73.4   101.8      ...      ...                                 Chine

        Cote d'Ivoire                             28.2    27.6    32.9      32.9     36.1    36.7    21.3      ...      ...                         Côte d'Ivoire

        United Kingdom                            24.9    24.0    24.6      27.1     33.1    44.6    22.5      ...      ...                         Royaume-Uni

        Ghana                                     27.9    31.6    33.7      33.9     35.8     3.7    11.5      ...      ...                                Ghana


     African Statistical Yearbook 2011 / Annuaire Statistique pour l'Afrique 2011
Botswana                                                                                                                                                                Botswana

AREA (KM 2)                                                                                   581 730                                                                SUPERFICIE (KM 2)
CAPITAL CITY                             Gaborone                                                                                 Gaberone                                       CAPITALE
CURRENCY                                 Botswana Pula                                                                        Botswana Pula                                      MONNAIE


                        I SOCIAL AND DEMOGRAPHIC INDICATORS — INDICATEURS DEMOGRAPHIQUES ET SOCIAUX

                                           2002        2003        2004        2005        2006         2007       2008        2009        2010
Population                                                                                                                                                                    Population
                                                                                                                                                          Population au milieu de l'année -
Mid-year population - Total (Million)          1.8         1.8         1.8         1.8         1.9         1.9         1.9         1.9         2.0
                                                                                                                                                                             Total (million)
                                                                                                                                                          Population au milieu de l'année -
Mid-year population - Urban (%)               54.9        55.7        56.5        57.3        58.1        58.9        59.7        60.4        61.1
                                                                                                                                                                             Urbaine (%)

Female (%)                                    50.4        50.3        50.3        50.2        50.2        50.1        50.1        50.0          ...                             Femme (%)


Population by Age Group                                                                                                                                       Population par groupe d'âge


   0-14                                    652 804     650 446     648 310     646 845     646 241     646 468     647 454     649 029     651 065                                      0-14


   15-64                                  1062 575    1084 132    1105 720    1128 299    1152 198    1177 031    1202 196    1226 758    1250 035                                     15-64


   65+                                      56 664      59 042      61 462      63 906      66 392      68 927      71 472      73 993      76 469                                      65+


Active Population (000)                      841.9       861.6       881.5       902.9       924.5       947.0       971.4       996.3     1 018.9                  Population active (000)

   Female (%)                                 47.3        47.3        47.3        47.4        47.4        47.5        47.5        47.4        47.4                              Femme (%)

                                                                                                                                                         Taux brut de natalité - Total (par
Crude birth rate - Total (per 1000)           26.0        26.0        25.0        25.0        25.0        25.0        25.0        24.0        25.0
                                                                                                                                                                                     1000)
                                                                                                                                                       Taux brut de mortalité - Total (par
Crude death rate - Total (per 1000)           14.0        15.0        14.0        14.0        13.0        13.0        12.0        12.0        12.0
                                                                                                                                                                                    1000)
Life expectancy at birth - Total                                                                                                                         Espérance de vie à la naissance -
                                              49.0        49.0        50.0        51.0        52.0        53.0        54.0        55.0        55.0
(years)                                                                                                                                                                    Total (années)
Net reproduction rate - (per                                                                                                                              Taux net de reproduction - (par
                                                ...         ...         ...        1.0          ...         ...         ...         ...        1.0
woman)                                                                                                                                                                            femme)
                                                                                                                                                         Indice synthétique de fécondité -
Total fertility rate - (p woman)
              y        (per    )               3.0         3.0         3.0         3.0         3.0         3.0         3.0         3.0         3.0
                                                                                                                                                                             (par femme)

Education                                                                                                                                                                Enseignement

Teaching staff at first level - Total                                                                                                                  Personnel enseignant - 1er degré -
                                             12.53        12.7        12.7        13.5        13.0        13.0          ...         ...         ...
(thousands)                                                                                                                                                               Total (milliers)
Teaching staff at second level - Total                                                                                                                Personnel enseignant - 2ème degré -
                                             10.82        11.6        11.8        12.4        12.5        12.8          ...         ...         ...                                              95
(thousands)                                                                                                                                                                Total (milliers)
Teaching staff at third level - Total                                                                                                               Personnel enseignant - 3ème degré -
                                                ...         ...         ...        0.5          ...         ...         ...         ...         ...
(thousands)                                                                                                                                                              Total (milliers)
First level student enrollment - Total                                                                                                                   Elèves inscrits - 1er degré - Total
                                              331         330         329         329         330          328          ...         ...         ...
(thousands)                                                                                                                                                                        (milliers)
First level student enrollment -                                                                                                                      Elèves inscrits - 1er degré - Femmes
                                              164         163         162         162         162          160          ...         ...         ...
Female (thousands)                                                                                                                                                                  (milliers)
Second level student enrollment -                                                                                                                      Elèves inscrits - 2ème degré - Total
                                              166         168         170         171         175          178          ...         ...         ...
Total (thousands)                                                                                                                                                                 (milliers)
Second level student enrollment -                                                                                                                            Elèves inscrits - 2ème degré -
                                               85          86          87          87          89           91          ...         ...         ...
Female (thousands)                                                                                                                                                       Femmes (milliers)
Third level student enrollment - Total                                                                                                                 Elèves inscrits - 3ème degré - Total
                                              13.2        15.6        15.7        15.7        16.2          ...         ...         ...         ...
(thousands)                                                                                                                                                                       (milliers)
Third level student enrollment -                                                                                                                             Elèves inscrits - 3ème degré -
                                               6.6         7.9         8.2         8.3         8.6          ...         ...         ...         ...
Female (thousands)                                                                                                                                                       Femmes (milliers)
Public expenditure on education (%                                                                                                                       Dépenses publiques consacrées à
                                                ...         ...         ...       21.5          ...       21.0          ...         ...         ...
of budget)                                                                                                                                                 l'enseignement (% du budget)

Health                                                                                                                                                                               Santé

Hospital beds - Total (per 10 000                                                                                                                        Nombre de lits d'hôpitaux - Total
                                              210         213         214           ...         ...        240          ...         ...         ...
population)                                                                                                                                                                 (pour 10 000)
Nurses - Total (per 10 000                                                                                                                              Nombre d'infirmières - Total (pour
                                              234         248         262         242         239           ...         ...         ...         ...
population)                                                                                                                                                                       10 000)
Physicians - Total (per 10 000                                                                                                                          Nombre de médecins - Total (pour
                                               30          29          39          29          28           28          ...         ...         ...
population)                                                                                                                                                                     10 000)
Public expenditure on Health (% of                                                                                                                    Dépenses publiques consacrées à la
                                               11          11          16          18          18           ...         ...         ...         ...
budget)                                                                                                                                                            santé (% du budget)


                                                                                                  African Statistical Yearbook 2011 / Annuaire Statistique pour l'Afrique 2011
Botswana                                                                                                                                                        Botswana
                                                                  II NATIONAL ACCOUNTS — COMPTES NATIONAUX

                                                    2002          2003      2004      2005      2006       2007         2008        2009       2010

         Gross domestic product by kind of economic activity at current prices
                                                                                                   Produit intérieur brut par branche d'activité économique aux prix courants


         Botswana Pula(Millions)                                                                                                                             Botswana Pula(Millions)

         Agriculture                                      751        945       904       918     1 162       1 492        2 025       1 947      2 348                            Agriculture

         Mining and quarrying                           16 170    14 526    17 492    19 896    27 915      30 552       37 515      21 464     31 561                 Industries extractives

         Manufacturing                                   1 420     1 580     1 728     1 839     2 109       2 716        3 111       3 343      3 857            Industries manufacturières

         Electricity, gas & water                         869        943     1 200     1 276     1 641       2 065        2 341       2 409      2 824                 Electricité, gaz et eau

         Construction                                    2 064     2 004     2 252     2 297     2 622       3 199        3 571       4 313      5 169          Bâtiments et travaux publics
         Wholesale & retail trade,                                                                                                                           Commerce de gros et de détail,
                                                         3 932     4 720     5 037     5 412     6 752       8 185       10 102      11 327     13 110
         restaurants, hotels                                                                                                                                          restaurants et hôtels
                                                                                                                                                              Banques, assurances, affaires
         Finance, insurance, real estate, etc.           3 880     4 295     4 811     5 517     6 295       7 523        9 462      10 302     11 586
                                                                                                                                                                              immobilières
         Transport and communications                    1 221     1 318     1 544     1 895     2 388       2 766        3 401       4 050      4 443      Transport(s) et communications
                                                                                                                                                                Administrations publiques et
         Public administration and defense               5 827     6 695     7 773     8 926     9 913      11 353       13 676      15 364     16 782
                                                                                                                                                                                    défense
         Other services                                  1 279     1 454     1 753     2 088     2 369       2 657        3 156       3 766      4 194                        Autres services
                                                                                                                                                             Moins Services d’intermédiation
         Less Imputed Service Charges               - 1 274       - 1 604   - 1 575   - 1 994   - 2 550    - 3 181       - 4 160     - 4 563   - 4 835
                                                                                                                                                                                   financière
         Gross domestic product at factor                                                                                                                Produit intérieur brut aux couts des
                                                        36 138    36 875    42 918    48 068    60 615      69 326       84 199      73 722     91 039
         cost / basic prices                                                                                                                                           facteurs / prix de base

         Plus: Indirect Taxes / taxes on                                                                                                                 Plus taxes indirectes/impôts sur les
                                                         2 408     3 154     4 237     4 341     5 079       6 652        7 781       8 374      9 896
         products, less subsidies                                                                                                                            produits, moins les subventions


         Expenditure on Gross domestic product at current purchaser's values
                                                                                                              Emploi du produit intérieur brut aux prix courants d'acquisition

         Botswana Pula(Millions)                                                                                                                             Botswana Pula(Millions)
                                                                                                                                                                   Consommation finale des
         Government final consumption                    7 971     8 938     9 971    11 763    12 467      14 726       17 339      20 077     21 141
                                                                                                                                                                   administrations publiques

         Private final consumption                      15 888    14 689    18 094    18 066    26 948      31 316       42 813      46 277     58 836           Consommation finale privée

         Gross fixed capital formation                   9 455    10 417    11 704    12 861    14 187      18 161       21 252      23 372     26 052        Formation brute de capital fixe

         Increase in inventories                          937      1 591     3 929       919     1 351       2 317        7 050       1 726      2 068                   Variation des stocks

         Exports of goods and services                  17 950    18 155    20 856    26 860    30 886      36 612       38 657      26 273     32 949     Exportations de biens et services
96                                                                                                                                                            Moins importations de biens et
         Less imports of goods and services             13 656    13 760    17 396    18 059    20 144      27 155       35 131      35 629     40 111
                                                                                                                                                                                    services
         GDP at purchasers' values                      38 546    40 029    47 155    52 410    65 695      75 978       91 981      82 096    100 935             PIB aux prix d'acquisition


         Gross domestic product by kind of economic activity at constant
                                                                                                  Produit intérieur brut par branche d'activité economique aux prix constants
         prices
         Annual Growth Rates (%)                                                                                                                   Taux de croissance annuel (%)
         Agriculture                                      -6.8      15.1       -8.9      -4.6      -0.9        8.9          4.9         6.0       15.8                            Agriculture

         Mining and quarrying                             11.5       6.7       1.8       1.9       7.9        -2.0          -3.8       -21.0       7.0                 Industries extractives

         Manufacturing                                    -3.3       4.4       6.1       6.1       3.3        17.5          2.0         -4.8       6.6            Industries manufacturières

         Electricity, gas & water                          8.4       5.9       7.5       0.4       6.0         4.8          5.4         0.8        5.5                 Electricité, gaz et eau

         Construction                                     33.4      -12.4      8.6       -6.1      2.3        14.5          -2.8        8.6       15.4          Bâtiments et travaux publics
         Wholesale & retail trade,                                                                                                                                  Commerce de gros et de
                                                           7.2      11.1       3.7       -4.8      9.4        10.8          6.2         3.3        9.0
         restaurants, hotels                                                                                                                                      détail,restaurants et hôtels
                                                                                                                                                               Banques, assurances, affaires
         Finance, insurance, real estate, etc.             5.7       0.9       3.2       9.1       7.4         8.4         15.0         3.9        4.4
                                                                                                                                                                               immobilières
         Transport and communications                      6.1       -2.9      4.4      12.8      10.5        11.1         14.7        12.0        3.6      Transport(s) et communications
                                                                                                                                                                Administrations publiques et
         Public administartion and defense                11.9       8.0       7.8       5.1       -1.2        4.2          7.8         3.7        0.4
                                                                                                                                                                                    défense
         Other services                                   -1.4       5.4      12.1      10.0       2.0         5.4          5.5        10.2        3.6                        Autres services
                                                                                                                                                             Moins Services d’intérmediation
         Less Imputed Service Charges                      9.5      15.0     -10.3      15.1      14.9        22.4         24.9         4.6       -2.5
                                                                                                                                                                                   financière
         Gross domestic product at factor                                                                                                                Produit intérieur brut aux couts des
                                                           9.8       5.0       4.5       2.3       5.3         3.2          1.9         -5.8       6.4
         cost / basic prices                                                                                                                                           facteurs / prix de base

         Plus: Indirect Taxes / taxes on                                                                                                                 Plus taxes indirectes/impôts sur les
                                                          -1.2      26.9      25.5       -5.6      3.5        23.9         12.3         3.3       13.6
         products, less subsidies                                                                                                                            produits, moins les subventions

         Gross domestic product at market                                                                                                                  Produit intérieur brut aux prix du
                                                           9.1       6.3       6.0       1.6       5.1         4.8          2.9         -4.9       7.2
         prices                                                                                                                                                                       marché


         2008: semi-final           2009: Provisional      2010:Estimates                                            2008: semi-définitif      2009: provisoire              2010:Estimée


     African Statistical Yearbook 2011 / Annuaire Statistique pour l'Afrique 2011
Botswana                                                                                                                                                           Botswana

Expenditure on Gross domestic product at constant purchasers'
                                                                                                         Emplois du produit intérieur brut aux prix constants d'acquisition
values

Annual Growth Rates (%)                                                                                                                    Taux de croissance annuel (%)
                                                                                                                                                             Consommation finale des
Government final consumption                   6.3         5.2         5.7        13.7        -2.6          6.0       9.6       1.0       -0.5
                                                                                                                                                             administrations publiques

Private final consumption                      7.5         9.6         5.7        -1.1         5.2        13.0       -2.7      34.0       22.9             Consommation finale privée

Gross fixed capital formation                  5.4         2.5         4.3        -4.8        -2.8        18.8        8.1       4.9        8.8         Formation brute de capital fixe

Exports of goods and services                  7.6        -6.7         7.2        17.9         2.9        10.0       -5.5      -33.6      23.2       Exportations de biens et services

                                                                                                                                                       Moins importations de biens et
Less imports of goods and services             1.4        -6.9        17.8        -4.9        -0.1        26.3       17.8       -7.9       5.6
                                                                                                                                                                             services


                                                                                  III INFLATION

                                           2002        2003        2004        2005        2006         2007       2008      2009       2010
Annual Growth Rates (%)                                                                                                                    Taux de croissance annuel (%)
All Item                                       8.0         9.2         7.0         8.6       11.6           7.1      12.6       8.2        7.0                               Ensemble

Food                                            ...         ...        4.7         5.4       12.5         11.3       20.3      14.3        3.1                            Alimentation

Health                                          ...         ...        4.1         4.0         8.0          5.1      11.0       5.5        2.3                                   Santé

Energy                                          ...         ...        6.1       17.5        24.7           4.8       8.0         ...       ...                                 Energie

Transport                                       ...         ...      11.4        14.9        14.0           3.3      21.1       -8.9      11.3                               Transport


                                                 IV AGRICULTURAL PRODUCTION - PRODUCTION AGRICOLE

                                           2002        2003        2004        2005        2006         2007       2008      2009       2010
Tons (Thousand)                                                                                                                                                 Tonnes (milliers)
Sorghum, tons (thousands)                      16          32          17          18          26           25        25          ...       ...               Sorgho, tonnes (milliers)

Maize, tons (thousands)                        16            2          2           2          11           12        12          ...       ...                  Maïs, tonnes (milliers)

Sunflower, tons (thousands)                      7           7          7           7           7             7         7         ...       ...           Tournesols, tonnes (milliers)

Seed cotton, tons (thousands)                    3           3          3           3           3             3         3         ...       ...     Graines de coton, tonnes (milliers)

Cereals, nec, tons (thousands)                   2           2          2           2           2             2         2         ...       ...        Céréales, nda, tonnes (milliers)


                                                        V MINING PRODUCTION - PRODUCTION MINIERE
                                                                                                                                                                                           97
                                           2002        2003        2004        2005        2006         2007       2008      2009       2010


Hard Coal, metric tons (thousands)          953.0       823.0       911.0       967.0      1 000.0      1 038.0        ...        ...       ...    Houille, tonnes métriques (milliers)

Gold ores and concentrates                     8.0         9.0      162.0      2 709.0     2 547.0      2 722.0        ...        ...       ...            Minerais d'or et concentrés
(Kilograms)                                                                                                                                                             (Kilogrammes)
Diamonds and other precious stones,                                                                                                                        Diamants et autres pierres
                                          21 702.0    22 800.0    31 125.0    31 890.0    34 293.0           ...       ...        ...       ...
unworked, carat (thousands)                                                                                                                          précieuses, bruts, carat (milliers)


                                                                              VI ENERGY - ENERGIE

                                           2002        2003        2004        2005        2006         2007       2008      2009       2010

Electricity - total hydro production,                                                                                                              Électricité - production hydraulique
                                                ...         ...         ...         ...         ...          ...       ...        ...       ...
kilowatt hours (millions)                                                                                                                             totale, kilowatt-heures (millions)

Electricity - total thermal production,                                                                                                              Électricité - production thermique
                                           1 060.0     1 133.0      991.0       971.0      1 042.0      1 119.0        ...        ...       ...
kilowatt hours (millions)                                                                                                                             totale, kilowatt-heures (millions)

Electricity - total production, self-                                                                                                             Electricité - Production totale privée
                                               73          97         100         104         112          120         ...        ...       ...
producer (Million Kilowatt Hours)                                                                                                                           (million de kilowatt heures)

Electricity - total production, public                                                                                                                   Electricité - Production totale
                                              987       1 036         891         867         930          999       583          ...       ...
(Million Kilowatt Hours)                                                                                                                          publique (million de kilowatt heures)


                                                                                                  African Statistical Yearbook 2011 / Annuaire Statistique pour l'Afrique 2011
Botswana                                                                                                                                                             Botswana
                                                 VII TOURISM AND INFRASTRUCTURE - TOURISME ET INFRASTUCTURE

                                                  2002       2003        2004       2005        2006        2007        2008        2009        2010

        Arrivals - Tourists (thousands)             1274        1406      1523         1675        1843        1990        2131           ...         ...           Arrivées - touristes (milliers)

        Rooms in hotels and similar                                                                                                                       Chambres d'hotels et établissements
        establishments (thousands)                     3           4          ...         ...         ...         ...         ...         ...         ...                  assimilés (milliers)

        Paved Road (% of total)                        ...         ...        ...        33           ...         ...         ...         ...         ...        Routes asphaltées (% du total)
        Total Network (Railways-km)                    ...         ...        ...         ...         ...         ...         ...         ...         ...         Réseau total voies ferrées-Km
        Main Telephone Lines (per 1,000                                                                                                                         Lignes téléphoniques fixes (pour
                                                      70          70         70          70          70          70          74           ...         ...
        inhabitants)                                                                                                                                                            1000 habitants)
        Mobile Cellular Subscribers (per                                                                                                                        Abonnés aux téléphones mobiles
                                                     190         250        290         310         440         610         770         960           ...
        1,000 inhabitants)                                                                                                                                               (pour 1000 habitants)


                                  VII FINANCIAL AND MONETARY STATISTICS - FINANCES ET STATISTIQUES MONETAIRES

                                                  2002       2003        2004       2005        2006        2007        2008        2009        2010

        VII-1 Monetary Statistics                                                                                                                      VII-1 Statistiques monétaires
        Botswana Pula(Millions)                                                                                                                                  Botswana Pula(Millions)
        Money supply (M1)                          2 581       2 882      4 225       3 998       5 157       6 238       7 768       7 108       9 264                   Masse monétaire (M1)
        Quasi-money                                7 318       8 763      9 037      10 676      19 411      26 058      31 459      31 609      33 596                           Quasi-monnaie
          of which Demand Deposit                      ...         ...        ...         ...         ...         ...         ...         ...         ...              dont Monnaie scripturale
        Net foreign assets                        31 025      24 925     25 240      35 869      48 773      60 545      72 780      59 270      52 550                    Avoirs extérieurs nets
        Domestic credit                           - 9 889     - 2 516       152      - 2 777     - 8 817    - 12 383    - 10 233      - 818       9 440                           Crédit intérieur

        of which claims on private sector          6 635       7 428      9 221      10 030      12 108      15 220      19 268      21 254      23 622       dont créances sur le secteur privé

        of which Claims on government                                                                                                                                dont créances nettes sur le
                                                 - 17 016    - 10 338    - 9 510    - 13 161    - 21 224    - 27 833    - 29 730    - 22 404    - 14 580
        sector, net                                                                                                                                                              gouvernement
        International reserves (millions of US                                                                                                              Réserves internationales (millions de
                                                   5 474       5 340      5 661       6 309       7 992       9 790       9 119       8 704       8 126
        $)                                                                                                                                                                                  $ EU)
        Average Exchange Rate (National                                                                                                                      Taux de change (moyen) (monnaie
                                                    6.33        4.95       4.69        5.11        5.84        6.14        6.83        7.16        6.79
        Currency per us $)                                                                                                                                               nationale par dollars)


        VII-2 Public Finance                                                                                                                                    VII-2 Finances publiques
        Botswana Pula(Millions)                                                                                                                                  Botswana Pula(Millions)
        Total Revenues and Grants                 12 709      14 318     16 197      17 957      22 267      27 398      28 629      30 455      30 023                 Recettes totales et dons
          Tax Revenue                             10 583      12 259     14 146      16 245      20 130      25 231      25 831      27 185      26 774                         Recettes fiscales
          Non Tax Revenue                          2 067       1 974      1 990       1 364       2 024       1 719       2 221       2 647       2 480                    Recettes non fiscales
98        Grants                                      59          84         61         348         113         448         577         623         769                                     Dons

        Total Expenditures and Net Lending        13 671      15 710     16 276      17 383      17 632      19 737      24 822      35 151      39 489           Dépenses totales et prêts nets

          Current expenditure                      9 935      11 581     12 935      13 765      14 155      15 954      18 579      23 889      25 732                     Dépenses courantes
          Of which Wages and Salaries              3 446       3 947      4 142       5 129       5 216       5 801       6 850       8 701       9 547           Dont rémunérations et salaires
          Capital expenditure                      3 698       4 200      4 256       3 910       3 783       4 055       6 548      11 458      13 006                 Dépenses d'équipement
          Net Lending                                 38        - 71      - 916       - 293       - 306       - 272       - 305       - 197         752                                Prêts nets
        Fiscal Balance                             - 962      - 1 392      - 78         574       4 635       7 660       3 808      - 4 696     - 9 466         Solde global y compris les dons


        VII-3 Balance of Payments                                                                                                                           VII-3 Balance des paiements
        Botswana Pula(Millions)                                                                                                                                  Botswana Pula(Millions)
        Trade balance                              4 477       4 441      3 904       8 982      11 115      10 561       2 982      - 4 870     - 1 836                   Balance commerciale
        Services Balance                           - 182        - 46      - 236       - 154       - 372      - 1 104        544      - 4 500       - 29                     Balance des services
        Net Income                                - 4 418     - 3 543    - 4 503     - 4 270     - 4 512     - 4 531     - 4 315        287       - 591                             Revenus nets
        Current transfers, net total               1 368       1 436      2 469       3 437       5 086       6 785       7 103       4 319       3 895                      Transferts courants
        Current account balance                    1 244       2 288      1 633       7 994      11 317      11 710       6 314      - 4 764      1 439                Solde du compte courant


        VII-4 External Debt and Financial Flows                                                                                            VII-4 Dette extérieure et flux financiers
        US $(Millions)                                                                                                                                                       $ E.U(Millions)
        Total external debt                        1 223       1 276      1 192       1 413       1 411       1 257       1 146       2 381       2 708                   Dette extérieure totale
          Private                                    876         742        698         949       1 014         901         829       2 102         944                                    Privée
          Public                                     347         534        494         465         397         355         317         278       1 763                                 Publique
        Total external debt service                  550         482        671         649         911         982         413         449         467            Service de la dette extérieure
        Net Foreign Direct Investment                                                                                                                       Investissements étranger direct (flux
                                                     403         418        391         279         486         495         521         234           ...
        Inflows                                                                                                                                                                   nets entrants)
        Net Total Official Development                                                                                                                         Aide publique au développement
                                                      37          28         50          48          69         108         720         280           ...
        assistance                                                                                                                                                                (nette totale)


     African Statistical Yearbook 2011 / Annuaire Statistique pour l'Afrique 2011
Botswana                                                                                                                                                 Botswana

                                    2002       2003       2004      2005       2006             2007       2008      2009      2010

US $(Millions)                                                                                                                                           Botswana Pula
Exports, fob                                                                                                                                          Exportations, fàb


Exports - Total                      2 346      3 024      3 696     4 444      4 521            5 025      4 707        ...       ...                   Exportations - Total


Main Products                                                                                                                                         Principaux produits


Diamonds                             2 090      2 158      2 650     3 300      3 329            3 265      3 045        ...       ...                              Diamants


Copper Nickel Matte                    112        270        336       454        678            1 103       868         ...       ...                  Nickel de Cuivre Mat


Textiles                                45         50        120       219        157              356       266         ...       ...                                Textiles


Meat & Meat Products                    44         58         51        74         82              113        89         ...       ...          Viande et Produits de Viande


Vehicle & Parts                         84        100        121       112         31               23        34         ...       ...                    Véhicule et Parties

Main Destinations                                                                                                                                Principales destinations

United Kingdom                      1 419.2    1 665.4    2 293.2   2 899.0    2 186.6          1 069.8     448.0     355.0        ...                          Royaume-Uni


Norway                                76.3      161.5      182.5     329.6      391.2            541.0      607.7     284.6        ...                               Norvège


Zimbabwe                              47.2          ...     88.9     104.6      212.1            409.0      214.8     198.6        ...                             Zimbabwe


United States                         30.2       14.2       74.2     179.7      253.6            188.8      219.7     132.7        ...                             États-Unis


South Africa                            0.0        4.0        0.3    302.6      265.3            218.6      182.7     104.1        ...                        Afrique du Sud


                                    2002       2003       2004      2005       2006             2007       2008      2009      2010
Imports, cif                                                                                                                                           Importations, cif

Imports - Total                        299        291        446       464        648              803       897       956        691          Importations - Total (millions)   99

                                                                                                                                                      Principaux produits
Main Products


Diamonds non-industrial unworked                                                                                                            Diamants non-industriels bruts ou
                                         2          5          1        19         55              108       143        90         ...
or simply sawn, cleaved or bruted                                                                                                        simplement sciés, clivés ou débrutés


Diesel powered trucks with a GVW                                                                                                         Diesel chariots de manutention d'un
                                         1          0          1         1          1               13        58          1        ...
not exceeding five tonnes                                                                                                                   PTAC n'excédant pas cinq tonnes

Cotton yarn >85% multiple combed                                                                                                            Fils de coton> 85% coton peigné
                                         1          ...        1         0          1                1        47          0        ...
<83.33 dtex,not ret.                                                                                                                           multiples <83,33 dtex, non ret

                                                                                                                                              Cuirs et peaux de chèvre ou de
Goat or kid skin leather, nes            ...        ...        0         ...        ...              ...      31        31         ...
                                                                                                                                                               chevreau, nda


Medicaments nes, in dosage               4          5         17        14         11               21        19        14         ...          Médicaments nda, en dosage


Main Origin                                                                                                                                      Principales provenances

Zimbabwe                              68.0          ...     48.3      29.6      290.4            201.0      157.0      36.9        ...                             Zimbabwe

China                                 19.0       22.8       49.5      58.5       61.8            119.9      169.2     165.4        ...                                  Chine

United States                         31.7       25.9       54.0      67.3       26.9             53.9       62.2      93.3        ...                             États-Unis

Sweden                                37.1       59.6       76.3      73.4         8.2            16.6       13.9      15.7        ...                             États-Unis

United Kingdom                        25.3       21.6       28.8      28.4       25.7             40.9       28.3      18.1        ...                          Royaume-Uni


                                                                                          African Statistical Yearbook 2011 / Annuaire Statistique pour l'Afrique 2011
Burkina Faso                                                                                                                                                      Burkina Faso

         AREA (KM 2)                                                                                   274 000                                                                 SUPERFICIE (KM 2)
         CAPITAL CITY                             Ouagadougou                                                                           Ouagadougou                                        CAPITALE
         CURRENCY                                 CFA Franc                                                                                Franc CFA                                       MONNAIE


                                 I SOCIAL AND DEMOGRAPHIC INDICATORS — INDICATEURS DEMOGRAPHIQUES ET SOCIAUX

                                                    2002        2003        2004        2005        2006         2007        2008        2009        2010
         Population                                                                                                                                                                     Population
                                                                                                                                                                    Population au milieu de l'année -
         Mid-year population - Total (Million)         12.2        12.6        13.0        13.4        14.0        14.3         14.7        15.2        15.7
                                                                                                                                                                                       Total (million)
                                                                                                                                                                    Population au milieu de l'année -
         Mid-year population - Urban (%)               15.5        15.5        15.5        15.5        22.7        22.7         22.7        22.7          ...
                                                                                                                                                                                       Urbaine (%)

         Female (%)                                    51.7        51.7        51.7        51.7        51.7        51.7         51.7        51.7          ...                             Femme (%)


         Population by Age Group                                                                                                                                        Population par groupe d'âge


            0-14                                   5852 860    6018 863    6189 918    6366 188    6499 211    6799 311     7051 619    7304 574    7556 226                                      0-14


            15-64                                  5610 729    5769 652    5933 432    6102 218    6969 953    6990 825     7216 477    7451 832    7695 681                                     15-64


            65+                                     721 271     778 165     839 400     905 264     473 611     461 876      463 071     468 374     479 070                                      65+


         Active Population (000)                    5 508.0     5 716.0     5 935.0     6 162.0     6 396.0      6 645.0     6 897.0     7 157.0          ...                 Population active (000)

            Female (%)                                 47.2        47.2        47.1        47.0        47.0        47.0         47.0        47.1          ...                             Femme (%)

                                                                                                                                                                   Taux brut de natalité - Total (par
         Crude birth rate - Total (per 1000)           46.1        46.1        46.1        46.1        46.1        46.0         46.0        46.0          ...
                                                                                                                                                                                               1000)
                                                                                                                                                                 Taux brut de mortalité - Total (par
         Crude death rate - Total (per 1000)           14.8        14.8        14.8        14.8        11.8        11.8         11.8        11.8          ...
                                                                                                                                                                                              1000)
         Life expectancy at birth - Total                                                                                                                          Espérance de vie à la naissance -
                                                       53.8        53.8        53.8        53.8        56.7        56.7         56.7        56.7          ...
         (years)                                                                                                                                                                     Total (années)
         Net reproduction rate - (per                                                                                                                               Taux net de reproduction - (par
                                                         ...         ...         ...        2.2          ...          ...         ...         ...         ...
         woman)                                                                                                                                                                             femme)
                                                                                                                                                                   Indice synthétique de fécondité -
         Total fertility rate - (p woman)
                       y        (per    )               6.8         6.2         6.2         6.2         6.2          6.2         5.9         5.8          ...
                                                                                                                                                                                       (par femme)

         Education                                                                                                                                                                 Enseignement

         Teaching staff at first level - Total                                                                                                                   Personnel enseignant - 1er degré -
                                                      20.68        22.7        23.9        26.9        30.3        32.8         35.6        39.0        42.8
         (thousands)                                                                                                                                                                Total (milliers)
         Teaching staff at second level - Total                                                                                                                 Personnel enseignant - 2ème degré -
100                                                    7.07         7.6         5.2         4.6         5.2          5.9         6.7         7.3         8.3
         (thousands)                                                                                                                                                                 Total (milliers)
         Teaching staff at third level - Total                                                                                                                  Personnel enseignant - 3ème degré -
                                                         ...         ...         ...        0.6         0.5          0.6         0.7         0.7          ...
         (thousands)                                                                                                                                                                 Total (milliers)
         First level student enrollment - Total                                                                                                                    Elèves inscrits - 1er degré - Total
                                                       938        1 012       1 139       1 270       1 390       1 561        1 742       1 906       2 047
         (thousands)                                                                                                                                                                         (milliers)
         First level student enrollment -                                                                                                                       Elèves inscrits - 1er degré - Femmes
                                                       392         426         492         555         614          699         794         879         957
         Female (thousands)                                                                                                                                                                   (milliers)
         Second level student enrollment -                                                                                                                       Elèves inscrits - 2ème degré - Total
                                                       213         238         266         295         320          352         424         468           ...
         Total (thousands)                                                                                                                                                                  (milliers)
         Second level student enrollment -                                                                                                                             Elèves inscrits - 2ème degré -
                                                        84          96         107         120         132          146         177         196           ...
         Female (thousands)                                                                                                                                                        Femmes (milliers)
         Third level student enrollment - Total                                                                                                                  Elèves inscrits - 3ème degré - Total
                                                       15.5        18.2        18.9        27.9        30.5        33.5         41.8          ...         ...
         (thousands)                                                                                                                                                                        (milliers)
         Third level student enrollment -                                                                                                                              Elèves inscrits - 3ème degré -
                                                        3.9         4.1         4.2         8.6         9.4        10.3         13.6          ...         ...
         Female (thousands)                                                                                                                                                        Femmes (milliers)
         Public expenditure on education (%                                                                                                                        Dépenses publiques consacrées à
                                                       14.5        15.2        15.9        16.6        17.4        18.2         19.1        20.0          ...
         of budget)                                                                                                                                                  l'enseignement (% du budget)

         Health                                                                                                                                                                                Santé

         Hospital beds - Total (per 10 000                                                                                                                         Nombre de lits d'hôpitaux - Total
                                                        31          31          31          29           ...          ...         ...         ...         ...
         population)                                                                                                                                                                  (pour 10 000)
         Nurses - Total (per 10 000                                                                                                                               Nombre d'infirmières - Total (pour
                                                         ...         ...         ...         ...         ...          ...         ...         ...         ...
         population)                                                                                                                                                                        10 000)
         Physicians - Total (per 10 000                                                                                                                           Nombre de médecins - Total (pour
                                                          4          3           3           3            2           ...         ...         ...         ...
         population)                                                                                                                                                                      10 000)
         Public expenditure on Health (% of                                                                                                                     Dépenses publiques consacrées à la
                                                          7          7           7          12            8           ...          8          ...         ...
         budget)                                                                                                                                                             santé (% du budget)


      African Statistical Yearbook 2011 / Annuaire Statistique pour l'Afrique 2011
Burkina Faso                                                                                                                                      Burkina Faso
                                                        II NATIONAL ACCOUNTS — COMPTES NATIONAUX

                                            2002        2003    2004    2005    2006       2007      2008       2009         2010

Gross domestic product by kind of economic activity at current prices
                                                                                  Produit intérieur brut par branche d'activité économique aux prix courants


CFA Franc(Billions)                                                                                                                             Franc CFA (Milliards)

Agriculture                                    799        840     808   1 017   1 033        971      1 170      1 230            ...                            Agriculture

Mining and quarrying                                8      12      13      14      11         15         66       100             ...                 Industries extractives

Manufacturing                                  230        323     337     305     322        328        417       425             ...            Industries manufacturières

Electricity, gas & water                        28         32      32      32      25         35         46        48             ...                 Electricité, gaz et eau

Construction                                    97        113     113     118     140        179        238       260             ...          Bâtiments et travaux publics
Wholesale & retail trade,                                                                                                                   Commerce de gros et de détail,
                                               313        349     399     434     325        359        405       405             ...
restaurants, hotels                                                                                                                                  restaurants et hôtels
                                                                                                                                             Banques, assurances, affaires
Finance, insurance, real estate, etc.           40         39      39      54      44         46         50        53             ...
                                                                                                                                                             immobilières
Transport and communications                   105         98     111     118     133        172        158       188             ...      Transport(s) et communications
                                                                                                                                               Administrations publiques et
Public administration and defense              421        426     452     486     631        723        582       601             ...
                                                                                                                                                                   défense
Other services                                  58         61      64      67     164        172        230       225             ...                        Autres services
                                                                                                                                            Moins Services d’intermédiation
Less Imputed Service Charges                  - 27       - 27    - 27    - 38    - 44        - 48      - 38       - 40            ...
                                                                                                                                                                  financière
Gross domestic product at factor                                                                                                        Produit intérieur brut aux couts des
                                             2 074      2 266   2 341   2 606   2 784       2 953     3 325      3 495            ...
cost / basic prices                                                                                                                                   facteurs / prix de base

Plus: Indirect Taxes / taxes on                                                                                                         Plus taxes indirectes/impôts sur les
                                               161        179     215     276     257        285        335       346             ...
products, less subsidies                                                                                                                    produits, moins les subventions


Expenditure on Gross domestic product at current purchaser's values
                                                                                             Emploi du produit intérieur brut aux prix courants d'acquisition

CFA Franc(Billions)                                                                                                                             Franc CFA (Milliards)
                                                                                                                                                  Consommation finale des
Government final consumption                   473        486     531     570     659        774        748       778             ...
                                                                                                                                                  administrations publiques

Private final consumption                    1 649      1 763   1 841   2 080   2 172       2 214     2 687      2 764            ...           Consommation finale privée

Gross fixed capital formation                  378        444     497     567     584        688        728       824             ...        Formation brute de capital fixe

Increase in inventories                         13         76      57     127      50         27        114        50             ...                   Variation des stocks

Exports of goods and services                  205        213     290     281     347        342        336       434             ...     Exportations de biens et services
                                                                                                                                             Moins importations de biens et
                                                                                                                                                                                101
Less imports of goods and services             485        538     660     743     772        807        953      1 010            ...
                                                                                                                                                                   services
GDP at purchasers' values                    2 234      2 444   2 556   2 881   3 041       3 238     3 660      3 840            ...             PIB aux prix d'acquisition


Gross domestic product by kind of economic activity at constant
                                                                                 Produit intérieur brut par branche d'activité economique aux prix constants
prices
Annual Growth Rates (%)                                                                                                          Taux de croissance annuel (%)
Agriculture                                     0.3       6.9    -3.5    10.2     3.5        -3.7       -2.1       1.9            ...                            Agriculture

Mining and quarrying                           16.2      40.5     8.1     5.8    -15.7       30.2     393.7       40.0            ...                 Industries extractives

Manufacturing                                   5.2      26.6     1.9     2.2     2.5         8.7      10.6        0.4            ...            Industries manufacturières

Electricity, gas & water                       -1.4      34.5     4.5     0.3     3.7         1.3      20.6        3.1            ...                 Electricité, gaz et eau

Construction                                   -2.2      -2.6     1.2     3.9    17.2         7.3       -9.6       4.8            ...          Bâtiments et travaux publics
Wholesale & retail trade,                                                                                                                          Commerce de gros et de
                                                5.2      11.5    11.1     7.8    -31.1       10.5      -17.1       1.4            ...
restaurants, hotels                                                                                                                              détail,restaurants et hôtels
                                                                                                                                              Banques, assurances, affaires
Finance, insurance, real estate, etc.          30.2       1.0     1.5    40.5     6.7         3.4      -35.0      -1.2            ...
                                                                                                                                                              immobilières
Transport and communications                   25.4      -3.4    24.3     3.7    12.1        26.9      -12.0      14.1            ...      Transport(s) et communications
                                                                                                                                               Administrations publiques et
Public administartion and defense               5.7      -0.3     6.3     8.5    27.1         4.0      13.0        1.1            ...
                                                                                                                                                                   défense
Other services                                                                                                                    ...                        Autres services
                                                                                                                                            Moins Services d’intérmediation
Less Imputed Service Charges                   14.9       0.8     0.8    39.8    12.4        10.0      -27.8      -1.2            ...
                                                                                                                                                                  financière
Gross domestic product at factor                                                                                                        Produit intérieur brut aux couts des
                                                3.9       7.8     3.5     7.5     8.2         3.7       2.8        3.3            ...
cost / basic prices                                                                                                                                   facteurs / prix de base

Plus: Indirect Taxes / taxes on                                                                                                         Plus taxes indirectes/impôts sur les
                                               10.8       8.5    17.7    22.7    -13.2        9.1       0.1        0.3            ...
products, less subsidies                                                                                                                    produits, moins les subventions

Gross domestic product at market                                                                                                          Produit intérieur brut aux prix du
                                                4.4       7.8     4.5     8.7     6.3         4.1       2.6        3.1            ...
prices                                                                                                                                                               marché


2008: semi-final                2009: Provisional                                                                        2008: semi-définitif            2009: provisoire


                                                                                    African Statistical Yearbook 2011 / Annuaire Statistique pour l'Afrique 2011
Burkina Faso                                                                                                                             Burkina Faso

         Expenditure on Gross domestic product at constant purchasers'
                                                                                              Emplois du produit intérieur brut aux prix constants d'acquisition
         values

         Annual Growth Rates (%)                                                                                                Taux de croissance annuel (%)
                                                                                                                                                  Consommation finale des
         Government final consumption                6.1     2.6     8.4       8.6    13.2      6.2        -0.5        2.1       ...
                                                                                                                                                  administrations publiques

         Private final consumption                   4.3     8.1     4.3       6.9     2.6      1.8         4.5        0.8       ...            Consommation finale privée

         Gross fixed capital formation               1.8    14.9    11.2      16.0     2.1      9.0         6.7       -4.8       ...        Formation brute de capital fixe

         Exports of goods and services              -2.7    -0.5    26.3       2.5    25.0      5.3       15.7       27.2        ...      Exportations de biens et services

                                                                                                                                            Moins importations de biens et
         Less imports of goods and services         -0.3    10.0    20.2       9.8     1.5      3.4         4.0        2.8       ...
                                                                                                                                                                  services


                                                                              III INFLATION

                                                   2002    2003    2004     2005     2006     2007      2008       2009       2010
         Annual Growth Rates (%)                                                                                                Taux de croissance annuel (%)
         All Item                                    2.3     2.0    -0.4       6.4     2.3      -0.2      10.7         2.6      1.2                                Ensemble

         Food                                        3.1    -2.0    -4.9      15.5    -0.3      -1.3      23.4         2.5      6.7                             Alimentation

         Health                                      1.2     9.0     0.8       1.0     2.3      0.1         1.7        0.6      0.0                                    Santé

         Energy                                      6.4     5.2     4.5       9.2     9.8      -4.7        9.2       -1.0     -0.3                                  Energie

         Transport                                   2.9     2.4     3.8       9.7     6.0      -1.9        5.7       -1.7      2.8                                Transport


                                                       IV AGRICULTURAL PRODUCTION - PRODUCTION AGRICOLE

                                                   2002    2003    2004     2005     2006     2007      2008       2009       2010
         Tons (Thousand)                                                                                                                             Tonnes (milliers)
         Sorghum, Tons (thousands)                 1 373   1 610   1 134     1 553   1 516    1 507      1 875      1 521        ...               Sorgho, tonnes (milliers)

         Millet, Tons (thousands)                    995   1 184     938     1 196   1 175      966      1 255        971        ...                 Millet, tonnes (milliers)

         Maize, Tons (thousands)                     653     666     481      799      867      534      1 014        895        ...                  Maïs, tonnes (milliers)

         Cotton lint, Tons (thousands)               439     472     535      713      760      377        721        484        ...      Fibres de coton, tonnes (milliers)

         Cow pea, Tons (thousands)                   330     457     276      445      436      253        538        454        ...                Niébé, tonnes (milliers)


                                                           V MINING PRODUCTION - PRODUCTION MINIERE
102
                                                   2002    2003    2004     2005     2006     2007      2008       2009       2010

         Gold ores and concentrates                                                                                                            Minerais d'or et concentrés
                                                   189.0   246.0   230.0     190.0   225.0    753.0     5 500.0    6 293.0       ...
         (Kilograms)                                                                                                                                        (Kilogrammes)
         Natural phosphates, P205 content,           2.0     1.0     1.0       1.0     2.0      2.0          ...        ...      ...       Phosphates, naturels, teneur en
         metric tons (thousands)                                                                                                          P205 tonnes métriques (milliers)
         Abrasives, natural, metric tons                                                                                               Abrasifs naturels, tonnes métriques,
                                                    10.0    10.0    10.0      10.0      ...       ...        ...        ...      ...
         (thousands)                                                                                                                                              (milliers)


                                                                           VI ENERGY - ENERGIE

                                                   2002    2003    2004     2005     2006     2007      2008       2009       2010

         Electricity - total hydro production,                                                                                          Électricité - production hydraulique
                                                   364.7   440.2   473.2     516.2   548.4    612.7      619.4          ...      ...
         kilowatt hours (millions)                                                                                                         totale, kilowatt-heures (millions)

         Electricity - total thermal production,                                                                                          Électricité - production thermique
                                                    17.5    21.8    21.4      19.5    14.7     18.2       21.9          ...      ...
         kilowatt hours (millions)                                                                                                         totale, kilowatt-heures (millions)

         Electricity - total production, self-                                                                                         Electricité - Production totale privée
                                                      83      78      79       81       85       82         78          ...      ...
         producer (Million Kilowatt Hours)                                                                                                       (million de kilowatt heures)

         Electricity - total production, public                                                                                               Electricité - Production totale
                                                     365     445     473      516      548      612          ...        ...      ...
         (Million Kilowatt Hours)                                                                                                      publique (million de kilowatt heures)


      African Statistical Yearbook 2011 / Annuaire Statistique pour l'Afrique 2011
Burkina Faso                                                                                                                                           Burkina Faso
                                         VII TOURISM AND INFRASTRUCTURE - TOURISME ET INFRASTUCTURE

                                          2002      2003       2004       2005       2006         2007       2008      2009       2010

Arrivals - Tourists (thousands)          198.376    216.653    290.005    324.342    358.683     374.265    375.564    401.308        ...           Arrivées - touristes (milliers)

Rooms in hotels and similar                                                                                                               Chambres d'hotels et établissements
establishments (thousands)                    ...        ...        ...        ...        ...      5.771         ...        ...       ...                  assimilés (milliers)

Paved Road (% of total)                      15         15         15         15         15           15         ...        ...       ...        Routes asphaltées (% du total)
Total Network (Railways-km)                   ...        ...        ...        ...        ...         ...        ...        ...       ...         Réseau total voies ferrées-Km
Main Telephone Lines (per 1,000                                                                                                                 Lignes téléphoniques fixes (pour
                                               5          5          6          7          7           8          9        10         ...
inhabitants)                                                                                                                                                    1000 habitants)
Mobile Cellular Subscribers (per                                                                                                                Abonnés aux téléphones mobiles
                                               9        19         30         46         71          109       168          ...       ...
1,000 inhabitants)                                                                                                                                       (pour 1000 habitants)


                          VII FINANCIAL AND MONETARY STATISTICS - FINANCES ET STATISTIQUES MONETAIRES

                                          2002      2003       2004       2005       2006         2007       2008      2009       2010

VII-1 Monetary Statistics                                                                                                              VII-1 Statistiques monétaires
CFA Franc(Billions)                                                                                                                                  Franc CFA (Milliards)
Money supply (M1)                           244        452        378        352        367          468       503        615        645                  Masse monétaire (M1)
Quasi-money                                 153        185        206        204        250          295       354        433        575                          Quasi-monnaie
  of which Demand Deposit                     ...        ...        ...        ...        ...         ...        ...        ...       ...              dont Monnaie scripturale
Net foreign assets                          163        344        292        178        237          423       382        575        609                   Avoirs extérieurs nets
Domestic credit                             276        333        345        441        466          403       552        584        674                          Crédit intérieur

of which claims on private sector           294        340        381        473        540          546       662        671        733      dont créances sur le secteur privé

of which Claims on government                                                                                                                        dont créances nettes sur le
                                            - 19        - 8       - 37       - 33       - 75       - 143      - 112       - 88      - 60
sector, net                                                                                                                                                      gouvernement
International reserves (millions of US                                                                                                      Réserves internationales (millions de
                                            313        752        669        438        555        1 029       928       1 296     1 019
$)                                                                                                                                                                          $ EU)
Average Exchange Rate (National                                                                                                              Taux de change (moyen) (monnaie
                                          696.99     581.20     528.29     527.47     522.89      479.27     447.81     472.19    495.28
Currency per us $)                                                                                                                                       nationale par dollars)


VII-2 Public Finance                                                                                                                            VII-2 Finances publiques
CFA Franc(Billions)                                                                                                                                  Franc CFA (Milliards)
Total Revenues and Grants                   394        435        462        497        562          651       631        733        921                Recettes totales et dons
  Tax Revenue                               241        270        318        337        362          405       445        460         ...                       Recettes fiscales
  Non Tax Revenue                            19         31         26         28         29           35        39         38         ...                  Recettes non fiscales
  Grants                                    135        133        117        132        170          210       147        235         ...                                   Dons      103
Total Expenditures and Net Lending          503        509        577        642        738          835       792        985      1 122          Dépenses totales et prêts nets

  Current expenditure                       254        257        284        332        387          450       455        504         ...                   Dépenses courantes
  Of which Wages and Salaries               103        113        119        141        160          188       199        229         ...         Dont rémunérations et salaires
  Capital expenditure                       252        229        298        323        366          383       325        484         ...               Dépenses d'équipement
  Net Lending                                - 3        24         - 5       - 13       - 15           1        12         - 3        ...                              Prêts nets
Fiscal Balance                             - 109       - 74      - 115      - 145      - 177       - 184      - 161      - 252     - 201         Solde global y compris les dons


VII-3 Balance of Payments                                                                                                                   VII-3 Balance des paiements
CFA Franc(Billions)                                                                                                                                  Franc CFA (Milliards)
Trade balance                              - 211      - 212      - 245      - 294      - 254       - 287      - 401      - 437        ...                  Balance commerciale
Services Balance                            - 73      - 109      - 121      - 154      - 167       - 174      - 212      - 184        ...                   Balance des services
Net Income                                  - 15       - 15       - 16       - 11        - 1         - 1        - 2        - 7        ...                           Revenus nets
Current transfers, net total                 90        122        101        124        133          193       183        211         ...                    Transferts courants
Current account balance                    - 208      - 213      - 281      - 335      - 289       - 268      - 431      - 416        ...              Solde du compte courant


VII-4 External Debt and Financial Flows                                                                                      VII-4 Dette extérieure et flux financiers
US $(Millions)                                                                                                                                               $ E.U(Millions)
Total external debt                        1 677      1 789      2 106      2 115      1 216       1 337      1 633      1 931     2 464                  Dette extérieure totale
  Private                                      1        11           0          0          0           0          0          0         0                                   Privée
  Public                                   1 676      1 778      2 106      2 115      1 216       1 337      1 633      1 931     2 464                                Publique
Total external debt service                  33         49         46         45         41           19        49         48         67           Service de la dette extérieure
Net Foreign Direct Investment                                                                                                               Investissements étranger direct (flux
                                             15         29         14         34         34          344       137        171         ...
Inflows                                                                                                                                                           nets entrants)
Net Total Official Development                                                                                                                 Aide publique au développement
                                            440        528        642        693        874          951      1 001      1 084        ...
assistance                                                                                                                                                        (nette totale)


                                                                                            African Statistical Yearbook 2011 / Annuaire Statistique pour l'Afrique 2011
Burkina Faso                                                                                                                                           Burkina Faso

                                               2002       2003        2004        2005        2006        2007        2008        2009       2010

         CFA Franc(Millions)                                                                                                                                                 Franc CFA
         Exports, fob                                                                                                                                              Exportations, fàb


         Exports - Total                      170 791    186 271     257 154     246 470     307 638     298 542     310 407     382 950        ...                   Exportations - Total


         Main Products                                                                                                                                              Principaux produits


         Cotton, not carded, or combed         72 191    131 732     159 903     121 876     161 418     144 633      87 902     108 094        ...            coton, non cardé ni peigné


         Gold (including Gold Platinum), ,                                                                                                                or (y compris l'or platine), sous
                                                  832      1 336       1 519       1 621       4 676       4 615      55 643     136 571        ...
         unwrought                                                                                                                                                  formes brutes ou mi


         Other seeds and fruits oleaginous,                                                                                                            Autres graines et fruits oleagineux,
                                                9 648      4 580       6 221       9 144      14 021      28 656      18 428      21 616        ...
         even crush                                                                                                                                                       meme concasses


         Live bovine                            3 658      2 430       2 424       2 319       2 430       1 233       8 074       5 386        ... Animaux vivants de l'espèce bovine


         Cigars (including those has ends                                                                                                                Cigares (y compris ceux a bouts
                                                1 639      8 722       5 858       3 332       3 773       4 703       4 291       2 540        ...
         cups(cuttings))                                                                                                                                                        coupes)

         Main Destinations                                                                                                                                    Principales destinations

         Switzerland                          12 106.1    7 419.8    20 479.3    47 046.0    57 694.8    60 901.1    86 795.5   114 605.9       ...                                 Suisse


         France                               54 518.9    8 506.7    14 692.4    34 230.1    39 367.7    32 219.3    19 259.4    41 860.0       ...                                 France


         Belgium, Luxembourg                   4 669.6     935.8       188.1     15 398.6    19 911.6    25 673.7     8 605.4    18 799.4       ...                Belgique, Luxembourg


         Singapore                             6 369.6       21.6      502.9     12 946.1    11 693.6    15 985.0    23 789.7    19 576.4       ...                             Singapour


         Ivory Coast                           8 609.2    3 618.2    18 132.5     7 681.6     8 151.5     9 203.3    13 467.2     5 619.3       ...                          Côte d'Ivoire


                                               2002       2003        2004        2005        2006        2007        2008        2009       2010
         Imports, cif                                                                                                                                               Importations, cif

104      Imports - Total                      453 622    481 927     591 353     656 149     689 455     717 780     873 042           ...      ...         Importations - Total (millions)


                                                                                                                                                                    Principaux produits
         Main Products


         Petroleum oils&oils obtained from                                                                                                            Huiles et préparations de pétrole ou
                                               67 908     76 568      93 942     106 592     144 217     150 687     188 092     144 816        ...
         bituminous minerals                                                                                                                                             minéraux bitumin


         Rice                                  26 426     18 612      22 698      33 663      37 807      33 096      40 889      20 956        ...                                    Riz


         Medicaments (excluding goods n°                                                                                                                   Medicaments (a l'exclusion des
                                               18 662     16 225      18 930      21 311      23 182      28 093      40 127      31 572        ...
         3002)                                                                                                                                                    produits des n° 3002,

         Hydroliques cement (including                                                                                                                 Ciments hydroliques (y compris les
                                               17 212     17 970      21 451      24 018      23 812      27 443      30 977      23 409        ...
         cement not pulver                                                                                                                                            ciments non pulver


                                                                                                                                                           Voitures de tourisme et autres
         Motor cars and other vehicles         14 429     16 361      13 887      18 255      20 921      22 729      28 584      23 444        ...
                                                                                                                                                                   vehicules automobiles


         Main Origin                                                                                                                                          Principales provenances

         Ivory Coast                          79 951.3   39 912.6    85 190.3   103 518.5   136 245.8   126 903.0   131 181.1    94 399.8       ...                          Côte-d'Ivoire

         France                               89 823.7   97 759.9   112 887.0   107 617.0   117 581.6   116 096.4   122 388.4    89 108.9       ...                                 France

         China                                17 178.2   12 039.1    21 158.5    24 878.4    31 594.6    62 687.2    89 544.0    67 008.5       ...                                  Chine

         United States of America             12 922.1    9 136.5    11 449.0    26 860.1    25 259.2    49 618.8    59 830.4    50 194.0       ...                             Etats-Unis

         India                                 9 719.0   10 630.2     9 094.2    20 259.5    31 107.6    49 459.2    50 011.7    30 178.8       ...                                   Inde


      African Statistical Yearbook 2011 / Annuaire Statistique pour l'Afrique 2011
Burundi                                                                                                                                                                        Burundi

AREA (KM 2)                                                                                  27 834                                                                     SUPERFICIE (KM 2)
CAPITAL CITY                             Bujumbura                                                                                   Bujumbura                                      CAPITALE
CURRENCY                                 Burundi Franc                                                                          Franc Burundais                                     MONNAIE


                        I SOCIAL AND DEMOGRAPHIC INDICATORS — INDICATEURS DEMOGRAPHIQUES ET SOCIAUX

                                           2002       2003       2004        2005        2006            2007        2008         2009        2010
Population                                                                                                                                                                       Population
                                                                                                                                                             Population au milieu de l'année -
Mid-year population - Total (Million)          7.0        7.2        7.4         7.6         7.8             7.9         8.1          8.2         8.4
                                                                                                                                                                                Total (million)
                                                                                                                                                             Population au milieu de l'année -
Mid-year population - Urban (%)                8.7        8.9        9.2         9.5         9.7           10.0         10.1         10.5        10.7
                                                                                                                                                                                Urbaine (%)

Female (%)                                    51.4       51.4       51.2        51.1        50.9           51.0         50.8         50.8        50.8                              Femme (%)


Population by Age Group                                                                                                                                          Population par groupe d'âge


   0-14                                   3164 000   3213 000   3262 000    3311 000    3361 000       3412 000     3635 000     3720 000    3808 000                                      0-14


   15-64                                  3611 000   3736 000   3921 096    4113 605    4308 916       4506 988     4292 000     4884 131          ...                                    15-64


   65+                                     254 000    262 000    202 639     207 862     213 536        219 696      284 000      232 660          ...                                     65+


Active Population (000)                    3 258.0    3 380.0    3 510.0     3 643.0     3 777.0         3 917.0     4 044.0      4 191.0          ...                 Population active (000)

   Female (%)                                 52.5       52.3       52.2        37.7        51.9           51.7         51.6         51.5          ...                             Femme (%)

                                                                                                                                                            Taux brut de natalité - Total (par
Crude birth rate - Total (per 1000)           42.4       42.4       42.3        42.3        42.2           42.2         42.2         42.2        42.2
                                                                                                                                                                                        1000)
                                                                                                                                                          Taux brut de mortalité - Total (par
Crude death rate - Total (per 1000)           15.5       15.5       15.4        15.4        15.3           15.3         16.2         16.2        16.2
                                                                                                                                                                                       1000)
Life expectancy at birth - Total                                                                                                                            Espérance de vie à la naissance -
                                              47.6       46.3       46.1        44.8        44.6           44.6         49.3         49.3        49.3
(years)                                                                                                                                                                       Total (années)
Net reproduction rate - (per                                                                                                                                 Taux net de reproduction - (par
                                               2.3        2.3        2.3         2.4         2.4             2.4         2.4          2.4         2.4
woman)                                                                                                                                                                               femme)
                                                                                                                                                            Indice synthétique de fécondité -
Total fertility rate - (p woman)
              y        (per    )               6.3        6.3        6.3         6.3         6.3             6.3         6.0          6.0         6.0
                                                                                                                                                                                (par femme)

Education                                                                                                                                                                   Enseignement

Teaching staff at first level - Total                                                                                                                     Personnel enseignant - 1er degré -
                                             17.30       18.4       20.7        23.8        27.1           29.5         33.1         36.6          ...
(thousands)                                                                                                                                                                  Total (milliers)
Teaching staff at second level - Total                                                                                                                   Personnel enseignant - 2ème degré -
                                              4.50        4.6        5.2         5.1         5.7             6.3         7.5         16.8          ...
(thousands)                                                                                                                                                                   Total (milliers)      105
Teaching staff at third level - Total                                                                                                                  Personnel enseignant - 3ème degré -
                                               0.4        0.4        0.3         0.3         0.4             0.4         0.3          1.8          ...
(thousands)                                                                                                                                                                 Total (milliers)
First level student enrollment - Total                                                                                                                      Elèves inscrits - 1er degré - Total
                                              880        953       1 023       1 309       1 474          1 586        1 720        1 850          ...
(thousands)                                                                                                                                                                           (milliers)
First level student enrollment -                                                                                                                         Elèves inscrits - 1er degré - Femmes
                                              392        432        471         623         709             772         845          919           ...
Female (thousands)                                                                                                                                                                     (milliers)
Second level student enrollment -                                                                                                                         Elèves inscrits - 2ème degré - Total
                                              115        139        153         172         196             220         259          352           ...
Total (thousands)                                                                                                                                                                    (milliers)
Second level student enrollment -                                                                                                                               Elèves inscrits - 2ème degré -
                                               48         58         62          70          79              88         101            ...         ...
Female (thousands)                                                                                                                                                          Femmes (milliers)
Third level student enrollment - Total                                                                                                                    Elèves inscrits - 3ème degré - Total
                                               9.5       10.7       10.2        10.5        10.2           10.1        114.0         29.3          ...
(thousands)                                                                                                                                                                          (milliers)
Third level student enrollment -                                                                                                                                Elèves inscrits - 3ème degré -
                                               3.2        3.8        4.4         4.7         5.5              ...         ...          ...         ...
Female (thousands)                                                                                                                                                          Femmes (milliers)
Public expenditure on education (%                                                                                                                          Dépenses publiques consacrées à
                                              13.3       15.4       14.9        12.4        13.7           17.2         22.1         22.1          ...
of budget)                                                                                                                                                    l'enseignement (% du budget)

Health                                                                                                                                                                                  Santé

Hospital beds - Total (per 10 000                                                                                                                           Nombre de lits d'hôpitaux - Total
                                               64          3           3          2           7                6          ...          ...         ...
population)                                                                                                                                                                    (pour 10 000)
Nurses - Total (per 10 000                                                                                                                                 Nombre d'infirmières - Total (pour
                                                6          7          ...         ...        70               ...         ...          ...         ...
population)                                                                                                                                                                          10 000)
Physicians - Total (per 10 000                                                                                                                             Nombre de médecins - Total (pour
                                                1          1          1           1           1               1           ...          ...         ...
population)                                                                                                                                                                        10 000)
Public expenditure on Health (% of                                                                                                                       Dépenses publiques consacrées à la
                                                2          3          5           5           6               6            7            8          ...
budget)                                                                                                                                                               santé (% du budget)


                                                                                                   African Statistical Yearbook 2011 / Annuaire Statistique pour l'Afrique 2011
Burundi                                                                                                                                                      Burundi
                                                                  II NATIONAL ACCOUNTS — COMPTES NATIONAUX

                                                     2002         2003     2004     2005     2006      2007      2008       2009        2010

          Gross domestic product by kind of economic activity at current prices
                                                                                               Produit intérieur brut par branche d'activité économique aux prix courants


          Burundi Franc (Billions)                                                                                                                  Franc Burundais(Milliards)

          Agriculture                                       ...      ...      ...     501      539        566       583        646           ...                            Agriculture

          Mining and quarrying                              ...      ...      ...      10        6          6         6          7           ...                 Industries extractives

          Manufacturing                                     ...      ...      ...     120      117        126       127        139           ...            Industries manufacturières

          Electricity, gas & water                          ...      ...      ...      11        8          9         9          9           ...                 Electricité, gaz et eau

          Construction                                      ...      ...      ...      40       40         19        47         51           ...          Bâtiments et travaux publics
          Wholesale & retail trade,                                                                                                                    Commerce de gros et de détail,
                                                            ...      ...      ...     110      123        141       144        160           ...
          restaurants, hotels                                                                                                                                   restaurants et hôtels
                                                                                                                                                        Banques, assurances, affaires
          Finance, insurance, real estate, etc.             ...      ...      ...     175      192        221       218        225           ...
                                                                                                                                                                        immobilières
          Transport and communications                      ...      ...      ...      28       29         33        34         37           ...      Transport(s) et communications
                                                                                                                                                          Administrations publiques et
          Public administration and defense                 ...      ...      ...      89      105        116       114        123           ...
                                                                                                                                                                              défense
          Other services                                    ...      ...      ...      16       19         22        23         25           ...                        Autres services
                                                                                                                                                       Moins Services d’intermédiation
          Less Imputed Service Charges                      ...      ...      ...    - 38     - 35        - 40      - 38      - 46           ...
                                                                                                                                                                             financière
          Gross domestic product at factor                                                                                                         Produit intérieur brut aux couts des
                                                            ...      ...      ...   1 062    1 143       1 219     1 266     1 375           ...
          cost / basic prices                                                                                                                                    facteurs / prix de base

          Plus: Indirect Taxes / taxes on                                                                                                          Plus taxes indirectes/impôts sur les
                                                            ...      ...      ...      99      109        170       207        163           ...
          products, less subsidies                                                                                                                     produits, moins les subventions


          Expenditure on Gross domestic product at current purchaser's values
                                                                                                          Emploi du produit intérieur brut aux prix courants d'acquisition

          Burundi Franc( Billions)                                                                                                                  Franc Burundais(Milliards)
                                                                                                                                                             Consommation finale des
          Government final consumption                      ...      ...      ...     154      155        156       156        163           ...
                                                                                                                                                             administrations publiques

          Private final consumption                         ...      ...      ...   1 082    1 249       1 286     1 292     1 361           ...           Consommation finale privée

          Gross fixed capital formation                     ...      ...      ...     198      194        198       201        210           ...        Formation brute de capital fixe

          Increase in inventories                           ...      ...      ...       1       18         18        18         18           ...                   Variation des stocks

          Exports of goods and services                     ...      ...      ...      75       96         91        86         71           ...     Exportations de biens et services
106                                                                                                                                                     Moins importations de biens et
          Less imports of goods and services                ...      ...      ...     349      460        360       281        285           ...
                                                                                                                                                                              services
          GDP at purchasers' values                         ...      ...      ...   1 161    1 252       1 389     1 473     1 539           ...             PIB aux prix d'acquisition


          Gross domestic product by kind of economic activity at constant
                                                                                              Produit intérieur brut par branche d'activité economique aux prix constants
          prices
          Annual Growth Rates (%)                                                                                                           Taux de croissance annuel (%)
          Agriculture                                       ...      ...      ...      ...     1.8        -0.1       4.3       3.5           ...                            Agriculture

          Mining and quarrying                              ...      ...      ...      ...    -40.0        7.3       2.3       7.8           ...                 Industries extractives

          Manufacturing                                     ...      ...      ...      ...    20.8         7.3       2.3       6.3           ...            Industries manufacturières

          Electricity, gas & water                          ...      ...      ...      ...    -27.3        7.3       2.3       -3.2          ...                 Electricité, gaz et eau

          Construction                                      ...      ...      ...      ...     -2.5        2.5       5.6       3.5           ...          Bâtiments et travaux publics
          Wholesale & retail trade,                                                                                                                           Commerce de gros et de
                                                            ...      ...      ...      ...     1.8         8.4       4.8       3.0           ...
          restaurants, hotels                                                                                                                               détail,restaurants et hôtels
                                                                                                                                                         Banques, assurances, affaires
          Finance, insurance, real estate, etc.             ...      ...      ...      ...     5.7         8.4       4.8       3.3           ...
                                                                                                                                                                         immobilières
          Transport and communications                      ...      ...      ...      ...     -7.1        8.4       4.8       5.0           ...      Transport(s) et communications
                                                                                                                                                          Administrations publiques et
          Public administartion and defense                 ...      ...      ...      ...    23.6         5.3       5.8       3.6           ...
                                                                                                                                                                              défense
          Other services                                    ...      ...      ...      ...     0.0         8.4       4.8       3.4           ...                        Autres services
                                                                                                                                                       Moins Services d’intérmediation
          Less Imputed Service Charges                      ...      ...      ...      ...     5.3         8.4       4.8       3.2           ...
                                                                                                                                                                             financière
          Gross domestic product at factor                                                                                                         Produit intérieur brut aux couts des
                                                            ...      ...      ...      ...     5.2         3.9       4.3       3.8           ...
          cost / basic prices                                                                                                                                    facteurs / prix de base

          Plus: Indirect Taxes / taxes on                                                                                                          Plus taxes indirectes/impôts sur les
                                                            ...      ...      ...      ...     8.1         3.8      40.5       -1.6          ...
          products, less subsidies                                                                                                                     produits, moins les subventions

          Gross domestic product at market                                                                                                           Produit intérieur brut aux prix du
                                                            ...      ...      ...      ...     5.4         3.8       7.5       3.2           ...
          prices                                                                                                                                                                marché


          2008: semi-final                2009: Estimated                                                                             2008: semi-définitif            2009: Estimée


      African Statistical Yearbook 2011 / Annuaire Statistique pour l'Afrique 2011
Burundi                                                                                                                                                                      Burundi

Expenditure on Gross domestic product at constant purchasers'
                                                                                                            Emplois du produit intérieur brut aux prix constants d'acquisition
values

Annual Growth Rates (%)                                                                                                                          Taux de croissance annuel (%)
                                                                                                                                                                   Consommation finale des
Government final consumption                    ...         ...         ...         ...        0.0            -0.8         -3.0         3.2       ...
                                                                                                                                                                   administrations publiques

Private final consumption                       ...         ...         ...         ...       13.4            -4.0          5.5         3.2       ...            Consommation finale privée

Gross fixed capital formation                   ...         ...         ...         ...       -3.5           -10.2         57.7         3.2       ...        Formation brute de capital fixe

Exports of goods and services                   ...         ...         ...         ...       10.7             5.2        -24.2         3.2       ...      Exportations de biens et services

                                                                                                                                                             Moins importations de biens et
Less imports of goods and services              ...         ...         ...         ...       28.9           -25.1         12.6         3.2       ...
                                                                                                                                                                                   services


                                                                                  III INFLATION

                                           2002        2003        2004        2005        2006            2007         2008        2009       2010
Annual Growth Rates (%)                                                                                                                          Taux de croissance annuel (%)
All Item                                      -8.8       19.8          8.3       13.2          2.7             8.4         24.4       10.5       6.5                               Ensemble

Food                                          -5.1       12.6        10.6        17.1          0.1             8.8         33.0       10.1       6.9                            Alimentation

Health                                         7.5       13.9          8.6         8.7         4.2             8.5         11.2       24.2       0.2                                    Santé

Energy                                         3.4         3.9         4.5         9.9         8.0           10.8          15.8       11.8       9.9                                  Energie

Transport                                      1.3       29.6          7.9         8.8         7.0           12.0          25.9        -8.7      2.6                               Transport


                                                 IV AGRICULTURAL PRODUCTION - PRODUCTION AGRICOLE

                                           2002        2003        2004        2005        2006            2007         2008        2009       2010
Tons (Thousand)                                                                                                                                                       Tonnes (milliers)
Banana, Tons (thousands)                    1 603       1 760       1 587       1 616       1 607           1 701        1 760       1 806        ...                  Banane (000 Tonnes)

Sweet Potato, Tons (thousands)                813         808         834         867         837             874          900         484        ...            Patate douce (000 Tonnes)

Cassava, Tons (thousands)                     750         742         710         631         571             559          577         235        ...                  Manioc (000 Tonnes)

Beans, Tons (thousands)                       245         230         220         214         209             205          190         203        ...                  Haricot (000 Tonnes)

Maize, Tons (thousands)                       127         121         123         123         117             116          118         120        ...                     Maïs (000 Tonnes)


                                                        V MINING PRODUCTION - PRODUCTION MINIERE
                                                                                                                                                                                                 107
                                           2002        2003        2004        2005        2006            2007         2008        2009       2010

Gold ores and concentrates
                                            483.0      2 855.0     3 229.0     3 905.0     4 312.6         2 422.8      2 170.2      979.6        ...       Minerais d'or et concentrés (kg)
(Kilograms)
Cassiterit (Kilograms)                      483.0      8 767.0    18 612.0     8 100.0    78 893.0        50 600.0     96 384.0    20 250.0       ...                         Cassitérite (kg)


Colombo-Tantalit (Kilograms)              72 441.0    23 315.0    24 382.0    42 592.0    16 177.0        51 550.0    116 600.0    44 207.0       ...                 Colombo-tantalite (kg)


                                                                              VI ENERGY - ENERGIE

                                           2002        2003        2004        2005        2006            2007         2008        2009       2010

Electricity - total hydro production,                                                                                                                    Électricité - production hydraulique
                                            127.2       104.6         91.6      100.3         93.3          117.5        111.8           ...      ...
kilowatt hours (millions)                                                                                                                                   totale, kilowatt-heures (millions)

Electricity - total thermal production,                                                                                                                    Électricité - production thermique
                                               0.1         0.1         0.1         0.1         0.1             0.1          0.1          ...      ...
kilowatt hours (millions)                                                                                                                                   totale, kilowatt-heures (millions)

Electricity - total production, self-                                                                                                                   Electricité - Production totale privée
                                                ...         ...         ...         ...         ...             ...          ...         ...      ...
producer (Million Kilowatt Hours)                                                                                                                                 (million de kilowatt heures)

Electricity - total production, public                                                                                                                         Electricité - Production totale
                                              129         105          94         102          95             119          112           ...      ...
(Million Kilowatt Hours)                                                                                                                                publique (million de kilowatt heures)


                                                                                                     African Statistical Yearbook 2011 / Annuaire Statistique pour l'Afrique 2011
Burundi                                                                                                                                                                  Burundi
                                                  VII TOURISM AND INFRASTRUCTURE - TOURISME ET INFRASTUCTURE

                                                   2002       2003        2004        2005        2006        2007        2008        2009        2010

         Arrivals - Tourists (thousands)             74.4       74.1       133.2       148.4       201.2           ...         ...         ...         ...           Arrivées - touristes (milliers)

         Rooms in hotels and similar                                                                                                                         Chambres d'hotels et établissements
         establishments (thousands)                                                                                                                                           assimilés (milliers)
                                                     0.64       0.64       0.817       0.689       0.805           ...         ...         ...         ...
         Paved Road (% of total)                        4          4           4           4           4            4           4           4          ...        Routes asphaltées (% du total)
         Total Network (Railways-km)                  29          29          29          29          29          29          32           ...         ...         Réseau total voies ferrées-Km
         Main Telephone Lines (per 1,000                                                                                                                         Lignes téléphoniques fixes (pour
                                                        3          3           4           4           5            5           5          ...         ...
         inhabitants)                                                                                                                                                            1000 habitants)
         Mobile Cellular Subscribers (per                                                                                                                        Abonnés aux téléphones mobiles
                                                       8           9          14          21          30          34          60           ...         ...
         1,000 inhabitants)                                                                                                                                               (pour 1000 habitants)


                                   VII FINANCIAL AND MONETARY STATISTICS - FINANCES ET STATISTIQUES MONETAIRES

                                                   2002       2003        2004        2005        2006        2007        2008        2009        2010

         VII-1 Monetary Statistics                                                                                                                      VII-1 Statistiques monétaires
         Burundi Franc (Billions)                                                                                                                              Franc Burundais(Milliards)
         Money supply (M1)                           117         144         171         205         252         294         446         510         566                   Masse monétaire (M1)
         Quasi-money                                  45          58          52          73          90          98         112         128         148                           Quasi-monnaie
           of which Demand Deposit                     ...         ...         ...         ...         ...         ...         ...         ...         ...              dont Monnaie scripturale
         Net foreign assets                           17          45          37          74          81         138         266         276         194                    Avoirs extérieurs nets
         Domestic credit                             202         224         258         282         374         377         451         570         708                           Crédit intérieur

         of which claims on private sector           156         171         175         176         207         217         261         321         412       dont créances sur le secteur privé

         of which Claims on government                                                                                                                                dont créances nettes sur le
                                                      30          44          75         101         156         152         167         240         282
         sector, net                                                                                                                                                              gouvernement
         International reserves (millions of US                                                                                                              Réserves internationales (millions de
                                                      59          67          66         100         131         176         266         322         331
         $)                                                                                                                                                                                  $ EU)
         Average Exchange Rate (National                                                                                                                      Taux de change (moyen) (monnaie
                                                   930.75    1 082.62    1 100.90    1 081.58    1 028.68    1 081.87    1 185.69    1 230.18    1 230.36
         Currency per us $)                                                                                                                                               nationale par dollars)


         VII-2 Public Finance                                                                                                                                    VII-2 Finances publiques
         Burundi Franc (Billions)                                                                                                                              Franc Burundais(Milliards)
         Total Revenues and Grants                   186         201         256         280         288         363         398         417         527                 Recettes totales et dons
           Tax Revenue                                96         106         134         159         164         186         237         279           ...                       Recettes fiscales
           Non Tax Revenue                            16          15          14          18          19          31          23          23           ...                  Recettes non fiscales

108        Grants                                     63          65         108         103         105         162         138         107           ...                                   Dons

         Total Expenditures and Net Lending          236         242         298         299         319         393         439         537         581           Dépenses totales et prêts nets

           Current expenditure                       159         153         178         221         227         344         363         432           ...                   Dépenses courantes
           Of which Wages and Salaries                45          53          59          73          90         186         155         180           ...         Dont rémunérations et salaires
           Capital expenditure                        66          99         120          78          91         149          77         105           ...               Dépenses d'équipement
           Net Lending                                 2           2           3           2           4            0           0           0          ...                              Prêts nets
         Fiscal Balance                              - 50       - 42        - 42        - 19        - 31        - 30        - 41       - 121        - 55          Solde global y compris les dons


         VII-3 Balance of Payments                                                                                                                           VII-3 Balance des paiements
         Burundi Franc                                                                                                                                                      Franc Burundais
         Trade balance                               - 69      - 100       - 107       - 143       - 191       - 222       - 318       - 557           ...                  Balance commerciale
         Services Balance                            - 33       - 41        - 78       - 107       - 173       - 158       - 148       - 156           ...                   Balance des services
         Net Income                                  - 11       - 19        - 21        - 19          - 9         - 6         - 5       - 29           ...                           Revenus nets
         Current transfers, net total                109         133         170         259         236         261         221         316           ...                    Transferts courants
         Current account balance                      - 4       - 27        - 36        - 10       - 137       - 125       - 251       - 426           ...              Solde du compte courant


         VII-4 External Debt and Financial Flows                                                                                            VII-4 Dette extérieure et flux financiers
         US $                                                                                                                                                                               $ E.U
         Total external debt                        1 174      1 371       1 458       1 245       1 325       1 500       1 568         561           ...                 Dette extérieure totale
           Private                                     0           0           0           0           0            0           0           0          ...                                  Privée
           Public                                   1 174      1 371       1 458       1 245       1 325       1 500       1 568         561           ...                               Publique
         Total external debt service                  20          32         468         393          50          58          61       1 103           ...          Service de la dette extérieure
         Net Foreign Direct Investment                                                                                                                       Investissements étranger direct (flux
                                                       0           5          49         632          33         541       4 545         429           ...
         Inflows                                                                                                                                                                   nets entrants)
         Net Total Official Development                                                                                                                         Aide publique au développement
                                                     148         274         365         515         490         416         541           ...         ...
         assistance                                                                                                                                                                (nette totale)


      African Statistical Yearbook 2011 / Annuaire Statistique pour l'Afrique 2011
Burundi                                                                                                                                                       Burundi

                                   2002        2003        2004        2005        2006            2007        2008        2009       2010

Burundi Franc (Millions)                                                                                                                                 Franc Burundais
Exports, fob                                                                                                                                           Exportations, fàb


Exports - Total                    28 900      40 600      52 700      61 500      60 400          57 300           ...         ...      ...              Exportations - Total


Main Products                                                                                                                                           Principaux produits


Trade Coffee                       15 584      24 838      33 032      46 611      40 372          41 684      47 184      43 677        ...                   Café marchand


Tea                                 8 182      11 115      11 246       9 565      10 238           9 925      15 531      18 429        ...                               Thé


Granulated sugar                    1 698       1 330       3 272         970         466           1 221       1 465       2 211        ...                   Sucre cristallisé


Beers                               1 166       1 106       2 067       1 433         604             873       1 822       1 596        ...                             Bières


Cigarettes                            405         747         791         870         807             986       1 796       1 774        ...                        Cigarettes

Main Destinations                                                                                                                                  Principales destinations

United Kingdom                     5 472.1     6 649.8     6 348.3     7 696.9     7 393.3         6 916.9     9 107.7     7 598.5       ...                    Royaume -Uni


Switzerland                        5 643.0    12 993.9    15 222.5    22 419.6    20 338.6        19 590.0    23 018.7    20 802.8       ...                             Suisse


Netherlands                        1 500.4     1 811.4      371.0       211.6       314.0           322.7       826.8      1 227.0       ...                          Pays Bas


Kenya                              5 399.9        34.5      400.2       403.5      1 220.2          233.0      1 767.9      488.3        ...                             Kenya


Rwanda                             2 906.5     2 315.7     4 628.4     2 921.6     3 212.0         2 366.7     4 104.3     3 745.3       ...                           Rwanda


                                   2002        2003        2004        2005        2006            2007        2008        2009       2010
Imports, cif                                                                                                                                            Importations, cif

Imports - Total                         ...         ...         ...         ...         ...             ...         ...         ...      ...    Importations - Total (millions)    109

                                                                                                                                                        Principaux produits
Main Products


Pharmaceutical products             9 340      14 328      18 278      18 546      28 984          27 014      36 539      37 687        ...        Produits pharmaceutiques


Gas oil                             5 804       6 686      11 665      15 084      26 002          28 284      53 941      23 706        ...                            Gas oil


Vehicles                            5 557       5 450       8 565       8 667      25 566          15 657      14 858      16 375        ...             Voitures automobiles


Gasoline Engine                     5 972       7 405      10 017      13 075      23 631          25 160      37 545      18 073        ...             Essence pour moteur


                                                                                                                                               Engins mécaniques et pièces de
Mechanical appliances and parts     8 920      10 321      11 788      32 211      18 713          16 876      47 580      33 466        ...
                                                                                                                                                                    rechange


Main Origin                                                                                                                                       Principales provenances

Kenya                             14 613.6    24 368.9    30 275.9    36 824.3    36 463.7        31 835.3    35 881.4    41 701.0       ...                             Kenya

Belgium                           19 882.8    25 196.2    26 359.0    35 451.4    51 820.5        48 476.2    61 033.0    56 185.2       ...                          Belgique

France                             8 507.5     8 222.4    12 431.1    15 115.5    19 597.8        11 699.8    26 423.6    21 114.6       ...                            France

Tanzania                          12 510.6    19 900.1    16 402.1    13 934.8     7 803.0        10 601.9    19 957.7    22 191.9       ...                          Tanzanie

China                              5 992.3     7 066.5     6 987.6    12 740.8    19 312.2        15 047.3    28 646.4    41 117.9       ...                             Chine


                                                                                             African Statistical Yearbook 2011 / Annuaire Statistique pour l'Afrique 2011
Cameroon                                                                                                                                                                  Cameroun

         AREA (KM 2)                                                                                   475 650                                                                   SUPERFICIE (KM 2)
         CAPITAL CITY                             Yaounde                                                                                      Yaoundé                                       CAPITALE
         CURRENCY                                 CFA Franc                                                                                   Franc CFA                                      MONNAIE


                                 I SOCIAL AND DEMOGRAPHIC INDICATORS — INDICATEURS DEMOGRAPHIQUES ET SOCIAUX

                                                    2002        2003        2004        2005        2006         2007        2008         2009         2010
         Population                                                                                                                                                                       Population
                                                                                                                                                                      Population au milieu de l'année -
         Mid-year population - Total (Million)         16.2        16.6        17.0        17.5        17.8        18.2         18.6         18.9         19.4
                                                                                                                                                                                         Total (million)
                                                                                                                                                                      Population au milieu de l'année -
         Mid-year population - Urban (%)                 ...         ...         ...       48.8        49.4        50.1         50.7         51.4         52.0
                                                                                                                                                                                         Urbaine (%)

         Female (%)                                    50.7        50.7        51.0        50.6        50.6        50.6         50.6         50.5         50.5                              Femme (%)


         Population by Age Group                                                                                                                                          Population par groupe d'âge


            0-14                                   6958 430    7120 916    7582 000    7614 232    7777 321    7943 903     8114 053     8287 847     8465 364                                      0-14


            15-64                                  8673 390    8953 101    8772 000    9255 834    9454 992    9658 424     9866 220    10005 122    10295 330                                     15-64


            65+                                     531 780     551 983     646 000     593 770     603 756     613 909      624 234      634 731      645 406                                      65+


         Active Population (000)                    6 202.0     6 362.0     6 528.0         6.1     6 880.0      7 006.0     7 205.0      7 410.0           ...                 Population active (000)

            Female (%)                                 41.1        41.1        41.1        43.8        41.2        41.3         41.4         41.6           ...                             Femme (%)

                                                                                                                                                                     Taux brut de natalité - Total (par
         Crude birth rate - Total (per 1000)           37.7        37.8        37.8        37.7        37.5        37.2         36.9         36.4           ...
                                                                                                                                                                                                 1000)
                                                                                                                                                                   Taux brut de mortalité - Total (par
         Crude death rate - Total (per 1000)           10.2         8.8         8.3        10.3          ...       10.3           ...          ...        10.4
                                                                                                                                                                                                1000)
         Life expectancy at birth - Total                                                                                                                            Espérance de vie à la naissance -
                                                       59.0        61.3        50.6        61.2        61.2        61.2         51.1         51.4           ...
         (years)                                                                                                                                                                       Total (années)
         Net reproduction rate - (per                                                                                                                                 Taux net de reproduction - (par
                                                         ...         ...         ...        1.6          ...          ...         ...          ...          ...
         woman)                                                                                                                                                                               femme)
                                                                                                                                                                     Indice synthétique de fécondité -
         Total fertility rate - (p woman)
                       y        (per    )               5.1         4.8         5.0         4.8         4.8          4.7         4.6          4.5           ...
                                                                                                                                                                                         (par femme)

         Education                                                                                                                                                                   Enseignement

         Teaching staff at first level - Total                                                                                                                     Personnel enseignant - 1er degré -
                                                         ...       49.0          ...         ...       55.7        72.8         69.5         72.1           ...
         (thousands)                                                                                                                                                                  Total (milliers)
         Teaching staff at second level - Total                                                                                                                   Personnel enseignant - 2ème degré -
110                                                      ...       38.1          ...         ...       34.3        35.1         50.0         60.0           ...
         (thousands)                                                                                                                                                                   Total (milliers)
         Teaching staff at third level - Total                                                                                                                    Personnel enseignant - 3ème degré -
                                                         ...         ...         ...        2.2         2.2          2.2         2.7          3.2           ...
         (thousands)                                                                                                                                                                   Total (milliers)
         First level student enrollment - Total                                                                                                                      Elèves inscrits - 1er degré - Total
                                                      2 742       2 799       2 907       2 950       2 988       3 120        3 201        3 347           ...
         (thousands)                                                                                                                                                                           (milliers)
         First level student enrollment -                                                                                                                         Elèves inscrits - 1er degré - Femmes
                                                      1 259       1 279       1 364       1 347       1 357       1 432        1 469        1 542           ...
         Female (thousands)                                                                                                                                                                     (milliers)
         Second level student enrollment -                                                                                                                         Elèves inscrits - 2ème degré - Total
                                                         ...       806         901         918         698          809        1 003        1 264           ...
         Total (thousands)                                                                                                                                                                    (milliers)
         Second level student enrollment -                                                                                                                               Elèves inscrits - 2ème degré -
                                                         ...       368         329         344         307            ...       498            ...          ...
         Female (thousands)                                                                                                                                                          Femmes (milliers)
         Third level student enrollment - Total                                                                                                                    Elèves inscrits - 3ème degré - Total
                                                       77.7        81.3        83.9        99.9       120.3       132.1        150.9        174.1           ...
         (thousands)                                                                                                                                                                          (milliers)
         Third level student enrollment -                                                                                                                                Elèves inscrits - 3ème degré -
                                                       30.1        31.5        32.5        39.4        50.2        58.0         66.8           ...          ...
         Female (thousands)                                                                                                                                                          Femmes (milliers)
         Public expenditure on education (%                                                                                                                          Dépenses publiques consacrées à
                                                       14.5        17.3        17.2        15.9        16.8        13.1         15.4           ...          ...
         of budget)                                                                                                                                                    l'enseignement (% du budget)

         Health                                                                                                                                                                                  Santé

         Hospital beds - Total (per 10 000                                                                                                                           Nombre de lits d'hôpitaux - Total
                                                        41          42          22          44           ...          ...         ...          ...          ...
         population)                                                                                                                                                                    (pour 10 000)
         Nurses - Total (per 10 000                                                                                                                                 Nombre d'infirmières - Total (pour
                                                        41          42           5          44           ...          ...         ...          ...          ...
         population)                                                                                                                                                                          10 000)
         Physicians - Total (per 10 000                                                                                                                             Nombre de médecins - Total (pour
                                                          7          7           2          18           ...          ...         ...          ...          ...
         population)                                                                                                                                                                        10 000)
         Public expenditure on Health (% of                                                                                                                       Dépenses publiques consacrées à la
                                                          5          4           5           5            7           ...         ...          ...          ...
         budget)                                                                                                                                                               santé (% du budget)


      African Statistical Yearbook 2011 / Annuaire Statistique pour l'Afrique 2011
Cameroon                                                                                                                                      Cameroun
                                                II NATIONAL ACCOUNTS — COMPTES NATIONAUX

                                        2002    2003    2004      2005     2006       2007      2008       2009      2010

Gross domestic product by kind of economic activity at current prices
                                                                             Produit intérieur brut par branche d'activité économique aux prix courants


CFA Franc (Billions)                                                                                                                   Franc CFA (Milliards)

Agriculture                             1 551   1 594   1 580     1 666    1 816       2 066     2 257      2 391        ...                            Agriculture

Mining and quarrying                      547     499     555       748      966        958        926       807         ...                 Industries extractives

Manufacturing                           1 446   1 484   1 489     1 510    1 536       1 340     1 447      1 653        ...            Industries manufacturières

Electricity, gas & water                   46      50      76        78       95         99        102       100         ...                 Electricité, gaz et eau

Construction                              204     214     248       253      274        293        315       485         ...          Bâtiments et travaux publics
Wholesale & retail trade,                                                                                                          Commerce de gros et de détail,
                                        1 458   1 579   1 798     1 799    1 852       1 976     2 053      2 059        ...
restaurants, hotels                                                                                                                         restaurants et hôtels
                                                                                                                                    Banques, assurances, affaires
Finance, insurance, real estate, etc.     447     469     488       529      512        513        609       648         ...
                                                                                                                                                    immobilières
Transport and communications              356     392     391       362      417        470        518       534         ...      Transport(s) et communications
                                                                                                                                      Administrations publiques et
Public administration and defense         348     362     383       351      315        342        458       507         ...
                                                                                                                                                          défense
Other services                            654     739     790       851      916       1 011     1 007      1 060        ...                        Autres services
                                                                                                                                   Moins Services d’intermédiation
Less Imputed Service Charges             - 51    - 52    - 58      - 58     - 59        - 47      - 61       - 60        ...
                                                                                                                                                         financière
Gross domestic product at factor                                                                                               Produit intérieur brut aux couts des
                                        7 005   7 330   7 741     8 088    8 642       9 021     9 633     10 185        ...
cost / basic prices                                                                                                                          facteurs / prix de base

Plus: Indirect Taxes / taxes on                                                                                                Plus taxes indirectes/impôts sur les
                                          578     587     593       662      746        772        811       856         ...
products, less subsidies                                                                                                           produits, moins les subventions


Expenditure on Gross domestic product at current purchaser's values
                                                                                        Emploi du produit intérieur brut aux prix courants d'acquisition

CFA Franc( Billions)                                                                                                                   Franc CFA (Milliards)
                                                                                                                                         Consommation finale des
Government final consumption              775     790     847       872      901        993      1 127      1 243        ...
                                                                                                                                         administrations publiques

Private final consumption               5 367   5 716   5 947     6 298    6 715       7 170     7 840      8 304        ...           Consommation finale privée

Gross fixed capital formation           1 503   1 431   1 521     1 547    1 565       1 702     1 842      1 965        ...        Formation brute de capital fixe

Increase in inventories                   - 2    - 46      55       121       14         - 7        60        80         ...                   Variation des stocks

Exports of goods and services           1 512   1 602   1 617     1 790    2 160       2 343     2 520      1 770        ...     Exportations de biens et services
                                                                                                                                    Moins importations de biens et
                                                                                                                                                                       111
Less imports of goods and services      1 571   1 576   1 653     1 879    1 967       2 409     2 946      2 322        ...
                                                                                                                                                          services
GDP at purchasers' values               7 583   7 917   8 334     8 750    9 387       9 792    10 444     11 040        ...             PIB aux prix d'acquisition


Gross domestic product by kind of economic activity at constant
                                                                            Produit intérieur brut par branche d'activité economique aux prix constants
prices
Annual Growth Rates (%)                                                                                                 Taux de croissance annuel (%)
Agriculture                               3.7     3.5     4.4       2.7      3.0         5.9       5.2        2.9        ...                            Agriculture

Mining and quarrying                     -4.3    -4.9    -9.1       -9.4     7.6        -7.7       -1.8     -13.1        ...                 Industries extractives

Manufacturing                             3.0     2.4     2.3       2.0     -0.6         0.5       3.5       -1.0        ...            Industries manufacturières

Electricity, gas & water                 -4.6     7.2     6.9       2.1      3.3         4.5       5.6       -0.6        ...                 Electricité, gaz et eau

Construction                              5.7     4.3     8.4       1.1      4.0         0.5       -8.2      12.5        ...          Bâtiments et travaux publics
Wholesale & retail trade,                                                                                                                 Commerce de gros et de
                                          7.4     9.9     7.0       2.7      1.8         2.0       0.3       -0.1        ...
restaurants, hotels                                                                                                                     détail,restaurants et hôtels
                                                                                                                                     Banques, assurances, affaires
Finance, insurance, real estate, etc.     6.6     5.7     3.8       2.8      0.8         3.7       3.7        5.3        ...
                                                                                                                                                     immobilières
Transport and communications              9.8     2.8     3.1      -10.5     1.7         1.7       1.1        5.4        ...      Transport(s) et communications
                                                                                                                                      Administrations publiques et
Public administartion and defense         5.9     3.1     6.9       0.4      2.9         5.5       4.2        3.8        ...
                                                                                                                                                          défense
Other services                            6.5     7.4     9.0      11.5      8.9        11.4       4.6        7.3        ...                        Autres services
                                                                                                                                   Moins Services d’intérmediation
Less Imputed Service Charges              3.4     3.0     2.1       3.2     -3.8        -7.0       5.5       -6.0        ...
                                                                                                                                                         financière
Gross domestic product at factor                                                                                               Produit intérieur brut aux couts des
                                          4.2     4.2     3.9       1.7      2.9         3.3       2.6        1.7        ...
cost / basic prices                                                                                                                          facteurs / prix de base

Plus: Indirect Taxes / taxes on                                                                                                Plus taxes indirectes/impôts sur les
                                          1.3     1.4     0.7      10.5      7.3         2.9       6.0        4.9        ...
products, less subsidies                                                                                                           produits, moins les subventions

Gross domestic product at market                                                                                                 Produit intérieur brut aux prix du
                                          4.0     4.0     3.7       2.3      3.2         3.3       2.9        1.9        ...
prices                                                                                                                                                      marché


2009: Provisional                                                                                                                               2009: provisoire


                                                                               African Statistical Yearbook 2011 / Annuaire Statistique pour l'Afrique 2011
Cameroon                                                                                                                                                         Cameroun

         Expenditure on Gross domestic product at constant purchasers'
                                                                                                               Emplois du produit intérieur brut aux prix constants d'acquisition
         values

         Annual Growth Rates (%)                                                                                                                   Taux de croissance annuel (%)
                                                                                                                                                                     Consommation finale des
         Government final consumption                   3.5        3.4        3.9         0.7         3.0         9.1         6.3         4.6       ...
                                                                                                                                                                     administrations publiques

         Private final consumption                      4.3        6.0        3.2         3.1         3.7         4.6         3.2         3.1       ...            Consommation finale privée

         Gross fixed capital formation                  4.0       -5.9       11.1         0.5         0.2        11.7         4.6         3.5       ...        Formation brute de capital fixe

         Exports of goods and services                 -1.8       -0.1        9.0         1.4         1.3         5.3        -3.7       -12.5       ...      Exportations de biens et services

                                                                                                                                                               Moins importations de biens et
         Less imports of goods and services            -7.6        3.6       12.2         1.9         2.3        15.2         4.0        -2.1       ...
                                                                                                                                                                                     services


                                                                                         III INFLATION

                                                    2002       2003       2004        2005        2006        2007        2008        2009       2010
         Annual Growth Rates (%)                                                                                                                   Taux de croissance annuel (%)
         All Item                                       2.8        0.6        0.2         1.9         5.0         1.1         5.3         3.0      1.3                               Ensemble

         Food                                           4.8       -0.7       -1.9         0.8         6.6         1.6         9.1         5.9      1.2                            Alimentation

         Health                                         1.3        1.0        2.0         0.5         1.9         0.4         0.7         0.0     -0.6                                   Santé

         Energy                                         0.1        7.3        4.8       12.6        15.3          0.5         1.7        -4.2     -0.1                                  Energie

         Transport                                     -0.5        1.5        1.6         7.0         8.6         2.3         0.4        -0.7      0.9                               Transport


                                                          IV AGRICULTURAL PRODUCTION - PRODUCTION AGRICOLE

                                                    2002       2003       2004        2005        2006        2007        2008        2009       2010
         Tons (Thousand)                                                                                                                                                Tonnes (milliers)
         Cassava, Tons (thousands)                   2 004      2 048      2 093       2 394       2 652       2 767       2 883       2 941        ...               Manioc, tonnes (milliers)

         Plantains, Tons (thousands)                 1 237      1 275      1 315       2 013       2 175       2 338       2 501       2 550        ...     Banane-Plantain, tonnes (milliers)

         Taro, Tons (thousands)                      1 080      1 103      1 128       1 240       1 267       1 398       1 428       1 491        ...         Macabo/Taro, tonnes (milliers)

         Maize, tons (thousands)                       861        912        966       1 050       1 249       1 322       1 395       1 662        ...                  Maïs, tonnes (milliers)

         Banana, Tons (thousands)                      693        743        798         930         970       1 024       1 078         933        ...               Banane, tonnes (milliers)


                                                                V MINING PRODUCTION - PRODUCTION MINIERE
112
                                                    2002       2003       2004        2005        2006        2007        2008        2009       2010

         Crude petroleum, metric tons                                                                                                                           Pétrole brut, tonnes métriques
                                                   37 400.0   35 600.0   32 700.0    30 100.0    31 800.0    31 200.0    30 700.0    26 700.0       ...
         (thousands)                                                                                                                                                                  (milliers)
         Gold ores and concentrates,                 700.0      700.0      600.0       600.0       600.0       600.0           ...         ...      ...            Minerais d'or et concentrés,
         Kilograms                                                                                                                                                                Kilogrammes
         Marble, travertines, etc., metric tons                                                                                                               Marbles, travertins, etc., tonnes
                                                        0.3        0.4         ...         ...         ...         ...         ...         ...      ...
         (thousands)                                                                                                                                                       métriques (milliers)


                                                                                     VI ENERGY - ENERGIE

                                                    2002       2003       2004        2005        2006        2007        2008        2009       2010

         Electricity - total hydro production,                                                                                                             Électricité - production hydraulique
                                                    3 413.1    3 686.4    3 919.7     4 003.8     4 147.0     4 256.0     4 503.0     4 720.0       ...
         kilowatt hours (millions)                                                                                                                            totale, kilowatt-heures (millions)

         Electricity - total thermal production,                                                                                                             Électricité - production thermique
                                                       96.8       95.7       95.1        94.2        93.9        90.4        94.0          ...      ...
         kilowatt hours (millions)                                                                                                                            totale, kilowatt-heures (millions)

         Electricity - total production, self-                                                                                                            Electricité - Production totale privée
                                                         3          4          5           6           6          10            6          ...      ...
         producer (Million Kilowatt Hours)                                                                                                                          (million de kilowatt heures)

         Electricity - total production, public                                                                                                                  Electricité - Production totale
                                                     3 300      3 684      4 110       4 004       4 147       4 256           ...         ...      ...
         (Million Kilowatt Hours)                                                                                                                         publique (million de kilowatt heures)


      African Statistical Yearbook 2011 / Annuaire Statistique pour l'Afrique 2011
Cameroon                                                                                                                                                Cameroun
                                         VII TOURISM AND INFRASTRUCTURE - TOURISME ET INFRASTUCTURE

                                          2002      2003      2004      2005      2006        2007       2008      2009       2010

Arrivals - Tourists (thousands)             226         ...     190       176       185          327       340        342         ...           Arrivées - touristes (milliers)

Rooms in hotels and similar                                                                                                           Chambres d'hotels et établissements
establishments (thousands)                    ...       ...       ...   22.112        ...         ...    25.672     23.45         ...                  assimilés (milliers)

Paved Road (% of total)                       ...       ...      51        55        58           60         ...       ...        ...        Routes asphaltées (% du total)
Total Network (Railways-km)                1 016     1 016     1 016     1 016      982          974         ...       ...        ...         Réseau total voies ferrées-Km
Main Telephone Lines (per 1,000                                                                                                             Lignes téléphoniques fixes (pour
                                               7         6         6         7         7           9        13         19         ...
inhabitants)                                                                                                                                                1000 habitants)
Mobile Cellular Subscribers (per                                                                                                            Abonnés aux téléphones mobiles
                                             43        63        88       125       173          245       340        406         ...
1,000 inhabitants)                                                                                                                                   (pour 1000 habitants)


                          VII FINANCIAL AND MONETARY STATISTICS - FINANCES ET STATISTIQUES MONETAIRES

                                          2002      2003      2004      2005      2006        2007       2008      2009       2010

VII-1 Monetary Statistics                                                                                                          VII-1 Statistiques monétaires
CFA Franc (Billions)                                                                                                                             Franc CFA (Milliards)
Money supply (M1)                           814       771       830       833       936        1 166      1 358     1 451      1 486                  Masse monétaire (M1)
Quasi-money                                 528       588       617       685       737          757       828        872      1 006                          Quasi-monnaie
  of which Demand Deposit                     ...       ...       ...       ...       ...         ...        ...       ...        ...              dont Monnaie scripturale
Net foreign assets                          211       153       250       415      1 014       1 494      1 726     1 726      1 695                   Avoirs extérieurs nets
Domestic credit                            1 080     1 158     1 157     1 102      781          579       603        719        801                          Crédit intérieur

of which claims on private sector           676       740       755       832       859          910      1 088     1 188      1 246      dont créances sur le secteur privé

of which Claims on government                                                                                                                    dont créances nettes sur le
                                            308       313       310       187     - 156        - 442      - 617     - 597      - 539
sector, net                                                                                                                                                  gouvernement
International reserves (millions of US                                                                                                  Réserves internationales (millions de
                                            630       640       829       949      1 716       2 907      3 087     3 676      3 516
$)                                                                                                                                                                      $ EU)
Average Exchange Rate (National                                                                                                          Taux de change (moyen) (monnaie
                                          696.99    581.20    528.29    527.47    522.89      479.27     447.81    472.19     495.28
Currency per us $)                                                                                                                                   nationale par dollars)


VII-2 Public Finance                                                                                                                        VII-2 Finances publiques
CFA Franc (Billions)                                                                                                                             Franc CFA (Milliards)
Total Revenues and Grants                  1 383     1 340     1 310     1 594     4 473       1 963      2 215     1 887      1 960                Recettes totales et dons
  Tax Revenue                              1 218     1 166     1 154     1 352     1 635       1 700      1 970     1 640      1 699                        Recettes fiscales
  Non Tax Revenue                           138       135       147       195       174          161       153        160        174                   Recettes non fiscales
  Grants                                     27        40          9       47      2 664         102        92         87         87                                    Dons      113
Total Expenditures and Net Lending         1 216     1 223     1 159     1 261     1 367       1 537      1 984     1 933      2 001          Dépenses totales et prêts nets

  Current expenditure                       693       742       692       751       798          871      1 073     1 170      1 108                    Dépenses courantes
  Of which Wages and Salaries               390       421       450       414       418          435       561        629        632          Dont rémunérations et salaires
  Capital expenditure                       192       165       187       206       271          389       589        441        502                Dépenses d'équipement
  Net Lending                                17          7         0         0         0           0          0         0          0                               Prêts nets
Fiscal Balance                              167       118       151       333      3 105         426       231       - 46       - 41         Solde global y compris les dons


VII-3 Balance of Payments                                                                                                               VII-3 Balance des paiements
CFA Franc (Billions)                                                                                                                             Franc CFA (Milliards)
Trade balance                               106       101        86       198       350          352       206      - 118        177                   Balance commerciale
Services Balance                          - 197     - 518     - 434      - 257    - 228        - 189      - 527     - 445      - 442                    Balance des services
Net Income                                - 263     - 310     - 274      - 327    - 173        - 239      - 147      - 62       - 42                            Revenus nets
Current transfers, net total                 39       111        81       125       164          213       268        256        396                     Transferts courants
Current account balance                   - 315     - 617     - 540      - 261      112          137      - 201     - 369         88               Solde du compte courant


VII-4 External Debt and Financial Flows                                                                                 VII-4 Dette extérieure et flux financiers
US $ (Millions)                                                                                                                                          $ E.U (Millions)
Total external debt                        5 447     6 443     3 682     3 652     1 083         990       932        975         ...                 Dette extérieure totale
  Private                                      0         0      123       257        81           44          1         1         ...                                  Privée
  Public                                   5 447     6 443     3 559     3 395     1 002         946       932        974         ...                               Publique
Total external debt service                 156       165       137       162       136          101       111         97         ...          Service de la dette extérieure
Net Foreign Direct Investment                                                                                                           Investissements étranger direct (flux
                                            419       128        45       129          9         208       188          0         ...
Inflows                                                                                                                                                       nets entrants)
Net Total Official Development                                                                                                             Aide publique au développement
                                            657       896       791       413      1 691       1 908       525          0         ...
assistance                                                                                                                                                    (nette totale)


                                                                                        African Statistical Yearbook 2011 / Annuaire Statistique pour l'Afrique 2011
Cameroon                                                                                                                                                Cameroun

                                           2002        2003        2004        2005        2006        2007         2008         2009       2010

         CFA Franc (Millions)                                                                                                                                            Franc CFA
         Exports, fob                                                                                                                                          Exportations, fàb


         Exports - Total                 1 369 030   1 406 119   1 469 782   1 670 200   1 952 600   2 045 400    2 284 700    1 700 200       ...                Exportations - Total


         Main Products                                                                                                                                         Principaux produits


         Petroleum oils, crude            573 398     579 317     489 961     661 157     928 046     909 003     1 115 069     681 814        ...            Huiles brutes de pétrole


         Fuel, lubricant                   42 840      63 958     109 485     197 041     225 989     313 536      295 836       93 448        ...           Carburants et lubrifiants


         Woods                            137 660     156 930     190 801     177 378     183 935     234 087      219 004       99 821        ...                           Bois sciés


         Cocoa beans                      133 263     104 033     121 367     111 042     115 562      87 954      120 361      255 012        ...                Cacao brut en fèves


         Aluminium, crude                  44 513      47 377      45 348      57 827      79 106      78 692       74 301       22 146        ...                     Aluminium brut

         Main Destinations                                                                                                                                Principales destinations

         Spain                           249 628.0   284 633.0   269 039.0   290 491.0   483 152.0          ...          ...          ...      ...                            Espagne


         Italy                           238 053.0   175 116.0   149 945.0   173 305.0   430 180.0          ...          ...          ...      ...                               Italie


         France                          161 068.0   139 820.0   184 365.0   186 836.0   197 019.0          ...          ...          ...      ...                             France


         Netherlands                     160 460.0   138 133.0   111 575.0   112 549.0   118 120.0          ...          ...          ...      ...                           Pays bas


         USA                              84 987.0    98 044.0    94 669.0    98 871.0   118 651.0          ...          ...          ...      ...                                USA


                                           2002        2003        2004        2005        2006        2007         2008         2009       2010
         Imports, cif                                                                                                                                           Importations, cif

114      Imports - Total                 1 262 600   1 305 300   1 383 800   1 524 180   1 648 110   1 773 200    2 096 000    2 012 600       ...      Importations - Total (millions)


                                                                                                                                                               Principaux produits
         Main Products


         Hydrocarbons                     190 394     223 084     229 436     457 443     526 510     733 523      713 828      369 846        ...                     Hydrocarbures


         Cereals                           87 984      69 661      89 779     113 117     120 878     124 027      199 087      181 530        ...                            Céréales


         Machinery, mechanical            167 199     127 997     121 603     101 003     100 546     172 470      186 964      197 899        ...      Machines et app. Mécaniques


         Vehicles; tractors               112 052     116 567     113 639     102 034      96 318     126 056      143 594      146 442        ...   Véhicules automobiles; tracteurs


         Machinery, electrical             84 269      63 027     113 669      75 313      83 896      95 967      116 863      136 306        ...   Machines et appareils électriques


         Main Origin                                                                                                                                      Principales provenances

         Nigeria                         139 084.0   158 372.0   204 399.0   320 521.0   383 314.0          ...          ...          ...      ...                             Nigéria

         France                          314 780.0   227 749.0   285 746.0   269 611.0   287 881.0          ...          ...          ...      ...                             France

         China                            54 197.0    56 932.0    58 332.0    75 796.0   104 151.0          ...          ...          ...      ...                               Chine

         USA                             108 433.0    59 316.0    67 050.0    70 581.0    47 081.0          ...          ...          ...      ...                                USA

         Belgium                          51 866.0    49 166.0    62 284.0    56 134.0    66 530.0          ...          ...          ...      ...                            Belgique


      African Statistical Yearbook 2011 / Annuaire Statistique pour l'Afrique 2011
Cape Verde                                                                                                                                                            Cap-Vert

AREA (KM 2)                                                                                 4 033                                                                SUPERFICIE (KM 2)
CAPITAL CITY                             Praia                                                                                         Praia                                 CAPITALE
CURRENCY                                 Escudo                                                                                      Escudo                                  MONNAIE


                        I SOCIAL AND DEMOGRAPHIC INDICATORS — INDICATEURS DEMOGRAPHIQUES ET SOCIAUX

                                           2002       2003       2004       2005       2006         2007       2008       2009         2010
Population                                                                                                                                                                Population
                                                                                                                                                      Population au milieu de l'année -
Mid-year population - Total (Million)          0.5        0.5        0.5        0.5        0.5          0.5        0.5        0.5          0.5
                                                                                                                                                                         Total (million)
                                                                                                                                                      Population au milieu de l'année -
Mid-year population - Urban (%)               55.0       55.8       56.6       57.4       58.2         58.9       59.7       60.4         61.1
                                                                                                                                                                         Urbaine (%)

Female (%)                                    52.4       52.4       52.4       52.3       52.3         52.3       52.2       52.2         52.2                              Femme (%)


Population by Age Group                                                                                                                                   Population par groupe d'âge


   0-14                                    189 772    189 333    188 657    187 780    186 719      185 510    184 234    182 982      181 825                                      0-14


   15-64                                   244 465    252 087    259 915    267 940    276 143      284 485    292 913    301 353      309 751                                     15-64


   65+                                      20 469     21 020     21 456     21 718     21 797       21 722     21 525     21 271       21 006                                      65+


Active Population (000)                      167.8      173.9      180.7      187.2      193.5        200.2      207.0      214.2        221.2                  Population active (000)

   Female (%)                                 40.5       40.9       41.4       41.8       42.2         42.5       42.9       43.2         43.4                              Femme (%)

                                                                                                                                                     Taux brut de natalité - Total (par
Crude birth rate - Total (per 1000)           28.0       27.0       27.0       26.0       25.0         25.0       24.0       24.0         24.0
                                                                                                                                                                                 1000)
                                                                                                                                                   Taux brut de mortalité - Total (par
Crude death rate - Total (per 1000)            6.0        5.0        5.0        5.0        5.0          5.0        5.0        5.0          5.0
                                                                                                                                                                                1000)
Life expectancy at birth - Total                                                                                                                     Espérance de vie à la naissance -
                                              70.0       70.0       70.0       71.0       71.0         71.0       71.0       72.0         71.0
(years)                                                                                                                                                                Total (années)
Net reproduction rate - (per                                                                                                                          Taux net de reproduction - (par
                                                ...        ...        ...       2.0         ...          ...        ...        ...         1.0
woman)                                                                                                                                                                        femme)
                                                                                                                                                     Indice synthétique de fécondité -
Total fertility rate - (p woman)
              y        (per    )               3.0        3.0        3.0        3.0        3.0          3.0        3.0        3.0          3.0
                                                                                                                                                                         (par femme)

Education                                                                                                                                                            Enseignement

Teaching staff at first level - Total                                                                                                              Personnel enseignant - 1er degré -
                                              3.12        3.1        3.2        3.2        3.2          3.2        3.1        3.1           ...
(thousands)                                                                                                                                                           Total (milliers)
Teaching staff at second level - Total                                                                                                            Personnel enseignant - 2ème degré -
                                              1.96        2.1        2.2        2.2        3.2          3.2        3.4        3.3           ...                                              115
(thousands)                                                                                                                                                            Total (milliers)
Teaching staff at third level - Total                                                                                                           Personnel enseignant - 3ème degré -
                                               0.3        0.3        0.4        0.5        0.5          0.6        0.8        0.9           ...
(thousands)                                                                                                                                                          Total (milliers)
First level student enrollment - Total                                                                                                               Elèves inscrits - 1er degré - Total
                                               90         88         85         83         81           79         76         74            ...
(thousands)                                                                                                                                                                    (milliers)
First level student enrollment -                                                                                                                  Elèves inscrits - 1er degré - Femmes
                                               44         43         41         40         40           38         37         35            ...
Female (thousands)                                                                                                                                                              (milliers)
Second level student enrollment -                                                                                                                  Elèves inscrits - 2ème degré - Total
                                               48         50         50         51         61           61         62         61            ...
Total (thousands)                                                                                                                                                             (milliers)
Second level student enrollment -                                                                                                                        Elèves inscrits - 2ème degré -
                                               24         26         26         26         33           33         32         33            ...
Female (thousands)                                                                                                                                                   Femmes (milliers)
Third level student enrollment - Total                                                                                                             Elèves inscrits - 3ème degré - Total
                                               1.8        2.2        3.0        3.9        4.6          5.3        6.7        8.5           ...
(thousands)                                                                                                                                                                   (milliers)
Third level student enrollment -                                                                                                                         Elèves inscrits - 3ème degré -
                                               0.9        1.2        1.6        2.0        2.4          2.9        3.7        4.8           ...
Female (thousands)                                                                                                                                                   Femmes (milliers)
Public expenditure on education (%                                                                                                                   Dépenses publiques consacrées à
                                              17.0         ...      20.7       25.4       15.6         16.4         ...        ...          ...
of budget)                                                                                                                                             l'enseignement (% du budget)

Health                                                                                                                                                                           Santé

Hospital beds - Total (per 10 000                                                                                                                    Nombre de lits d'hôpitaux - Total
                                              210        200        210        210          ...          ...        ...      210            ...
population)                                                                                                                                                             (pour 10 000)
Nurses - Total (per 10 000                                                                                                                          Nombre d'infirmières - Total (pour
                                                ...        ...       83          ...       91            ...        ...      130            ...
population)                                                                                                                                                                   10 000)
Physicians - Total (per 10 000                                                                                                                      Nombre de médecins - Total (pour
                                                ...        ...       47          ...       42            ...        ...       60            ...
population)                                                                                                                                                                 10 000)
Public expenditure on Health (% of                                                                                                                Dépenses publiques consacrées à la
                                               11         11         12         10         11            ...        ...        ...          ...
budget)                                                                                                                                                        santé (% du budget)


                                                                                              African Statistical Yearbook 2011 / Annuaire Statistique pour l'Afrique 2011
Cape Verde                                                                                                                                             Cap-Vert
                                                            II NATIONAL ACCOUNTS — COMPTES NATIONAUX

                                                  2002      2003      2004      2005      2006       2007      2008       2009      2010

          Gross domestic product by kind of economic activity at current prices
                                                                                             Produit intérieur brut par branche d'activité économique aux prix courants


          Escudo (Millions)                                                                                                                                  Escudo(Millions)

          Agriculture                              7 546     8 083     8 113     7 773     8 120       7 722        ...       ...        ...                            Agriculture

          Mining and quarrying                     1 193     1 285     1 804     2 112     3 035       3 266        ...       ...        ...                 Industries extractives

          Manufacturing                            3 214     3 278     3 048     3 174     3 178       3 235        ...       ...        ...            Industries manufacturières

          Electricity, gas & water                   407     1 016     1 179       705       338        184         ...       ...        ...                 Electricité, gaz et eau

          Construction                             5 898     6 105     6 312     7 537     9 067      10 118        ...       ...        ...          Bâtiments et travaux publics
          Wholesale & retail trade,                                                                                                                Commerce de gros et de détail,
                                                  15 472    16 941    17 727    17 539    20 494      24 634        ...       ...        ...
          restaurants, hotels                                                                                                                               restaurants et hôtels
                                                                                                                                                    Banques, assurances, affaires
          Finance, insurance, real estate, etc.    7 326     7 404     7 924     8 404     9 873      11 544        ...       ...        ...
                                                                                                                                                                    immobilières
          Transport and communications            15 101    17 222    17 343    18 330    20 555      22 360        ...       ...        ...      Transport(s) et communications
                                                                                                                                                      Administrations publiques et
          Public administration and defense        9 367    10 322    11 106    11 779    12 521      13 134        ...       ...        ...
                                                                                                                                                                          défense
          Other services                           1 532     1 705     1 775     2 227     2 546       3 138        ...       ...        ...                        Autres services
                                                                                                                                                   Moins Services d’intermédiation
          Less Imputed Service Charges            - 2 209   - 2 510   - 2 578   - 2 655   - 3 323    - 4 741        ...       ...        ...
                                                                                                                                                                         financière
          Gross domestic product at factor                                                                                                     Produit intérieur brut aux couts des
                                                  64 846    70 851    73 753    76 924    86 404      94 595        ...       ...        ...
          cost / basic prices                                                                                                                                facteurs / prix de base

          Plus: Indirect Taxes / taxes on                                                                                                      Plus taxes indirectes/impôts sur les
                                                   7 912     8 676     8 334     9 262    10 981      12 658        ...       ...        ...
          products, less subsidies                                                                                                                 produits, moins les subventions


          Expenditure on Gross domestic product at current purchaser's values
                                                                                                        Emploi du produit intérieur brut aux prix courants d'acquisition

          Escudo (Millions)                                                                                                                                  Escudo(Millions)
                                                                                                                                                         Consommation finale des
          Government final consumption            13 410    15 948    17 472    18 522    19 002      21 573        ...       ...        ...
                                                                                                                                                         administrations publiques

          Private final consumption               61 402    65 323    65 326    70 067    80 107      84 084        ...       ...        ...           Consommation finale privée

          Gross fixed capital formation           26 151    24 735    31 962    30 858    37 646      49 812        ...       ...        ...        Formation brute de capital fixe

          Increase in inventories                   - 89      - 63       435       197     - 595        573         ...       ...        ...                   Variation des stocks

          Exports of goods and services           18 230    15 034    14 733    16 184    19 401      22 250        ...       ...        ...     Exportations de biens et services
116                                                                                                                                                 Moins importations de biens et
          Less imports of goods and services      46 345    41 450    47 840    49 642    58 176      71 040        ...       ...        ...
                                                                                                                                                                          services
          GDP at purchasers' values               72 758    79 527    82 087    86 186    97 384     107 252        ...       ...        ...             PIB aux prix d'acquisition


          Gross domestic product by kind of economic activity at constant
                                                                                            Produit intérieur brut par branche d'activité economique aux prix constants
          prices
          Annual Growth Rates (%)                                                                                                       Taux de croissance annuel (%)
          Agriculture                                -5.5      1.7       -0.2      -5.7      0.3         0.0        ...       ...        ...                            Agriculture

          Mining and quarrying                       3.8       7.8       6.3       9.3      15.4         9.6        ...       ...        ...                 Industries extractives

          Manufacturing                              -1.4      0.0       -6.0      8.7       -1.6        6.2        ...       ...        ...            Industries manufacturières

          Electricity, gas & water                  27.2      11.1      35.3     -13.0      22.4       -16.8        ...       ...        ...                 Electricité, gaz et eau

          Construction                              15.6       0.3       0.5      15.2      16.2         8.5        ...       ...        ...          Bâtiments et travaux publics
          Wholesale & retail trade,                                                                                                                       Commerce de gros et de
                                                    11.1       6.6       6.4       6.9       8.6        18.7        ...       ...        ...
          restaurants, hotels                                                                                                                           détail,restaurants et hôtels
                                                                                                                                                     Banques, assurances, affaires
          Finance, insurance, real estate, etc.      5.7       -4.3      0.9       -2.9     27.5        25.0        ...       ...        ...
                                                                                                                                                                     immobilières
          Transport and communications               0.0       5.2       7.8       -0.2     14.5         7.0        ...       ...        ...      Transport(s) et communications
                                                                                                                                                      Administrations publiques et
          Public administartion and defense          4.2       7.5       6.5       3.5       2.7         2.3        ...       ...        ...
                                                                                                                                                                          défense
          Other services                             5.4       7.0      11.2      13.0       7.2         8.1        ...       ...        ...                        Autres services
                                                                                                                                                   Moins Services d’intérmediation
          Less Imputed Service Charges              14.1      12.4       5.0       2.8      18.5        38.4        ...       ...        ...
                                                                                                                                                                         financière
          Gross domestic product at factor                                                                                                     Produit intérieur brut aux couts des
                                                     5.2       4.6       6.2       4.4       9.8         8.4                             ...
          cost / basic prices                                                                                                                                facteurs / prix de base

          Plus: Indirect Taxes / taxes on                                                                                                      Plus taxes indirectes/impôts sur les
                                                     6.1       5.4     -20.6      44.6      14.3        11.4        ...       ...        ...
          products, less subsidies                                                                                                                 produits, moins les subventions

          Gross domestic product at market                                                                                                       Produit intérieur brut aux prix du
                                                     5.3       4.7       4.3       6.5      10.1         8.6        ...       ...        ...
          prices                                                                                                                                                            marché


           2007: Provisional                                                                                                                                    2007: provisoire


      African Statistical Yearbook 2011 / Annuaire Statistique pour l'Afrique 2011
Cape Verde                                                                                                                                               Cap-Vert

Expenditure on Gross domestic product at constant purchasers'
                                                                                             Emplois du produit intérieur brut aux prix constants d'acquisition
values

Annual Growth Rates (%)                                                                                                        Taux de croissance annuel (%)
                                                                                                                                                 Consommation finale des
Government final consumption                9.6     16.8      10.3        6.6     -2.8        11.4         ...        ...       ...
                                                                                                                                                 administrations publiques

Private final consumption                   6.8      7.9       8.6        1.4      7.0         3.7         ...        ...       ...            Consommation finale privée

Gross fixed capital formation              20.7      -0.5     24.4       -6.6     18.3        37.0         ...        ...       ...        Formation brute de capital fixe

Exports of goods and services              12.2     -17.6      2.5        8.6     13.8        14.7         ...        ...       ...      Exportations de biens et services

                                                                                                                                           Moins importations de biens et
Less imports of goods and services         17.9      1.9      22.1       -6.6      7.0        23.7         ...        ...       ...
                                                                                                                                                                 services


                                                                         III INFLATION

                                          2002     2003      2004      2005      2006       2007       2008      2009       2010
Annual Growth Rates (%)                                                                                                        Taux de croissance annuel (%)
All Item                                    1.9      1.2      -1.9        0.4      4.8         4.4        6.8       1.0        2.0                               Ensemble

Food                                         ...       ...    -3.5       -0.1      6.5         5.0        9.1       1.9        2.2                            Alimentation

Health                                       ...       ...     4.7        1.4      0.4         0.3        4.7       6.2        2.3                                    Santé

Energy                                       ...       ...     3.5       10.1     12.1         9.4        5.5       0.0        2.7                                  Energie

Transport                                    ...       ...     1.5        3.3      8.1         2.7        8.7       -6.1       2.7                               Transport


                                              IV AGRICULTURAL PRODUCTION - PRODUCTION AGRICOLE

                                          2002     2003      2004      2005      2006       2007       2008      2009       2010
Tons (Thousand)                                                                                                                                     Tonnes (milliers)
Maize, Tons (thousands)                       5       12        10         4         4           3        12          ...       ...                  Maïs, tonnes (milliers)

Banane, Tons (thousands)                      6         6        6         6         7           7          7         ...       ...              Bananes, tonnes (milliers)

Coconuts, Tons (thousands)                    6         6        6         6         6           6          6         ...       ...         Noix de coco, tonnes (milliers)

Cabbages, Tones (thousands)                   4         4        4         4         5           5          5         ...       ...                Choux, tonnes (milliers)

Mango, Tons (thousands)                       5         5        5         5         5           6          6         ...       ...             Mangues, tonnes (milliers)


                                                   V MINING PRODUCTION - PRODUCTION MINIERE
                                                                                                                                                                               117
                                          2002     2003      2004      2005      2006       2007       2008      2009       2010

Salt and pure sodium chloride,                                                                                                             Sel et chlorure de sodium pur,
                                            2.0      2.0       2.0        2.0      2.0         2.0         ...        ...       ...
metric tons (thousands)                                                                                                                         tonnes métriques (milliers)
Abrasives, natural, metric tone             1.0      1.0        ...        ...      ...         ...        ...        ...       ...    Abrasifs naturels, tonnes métriques
(thousands)                                                                                                                                                       (milliers)

                                             ...       ...      ...        ...      ...         ...        ...        ...       ...


                                                                      VI ENERGY - ENERGIE

                                          2002     2003      2004      2005      2006       2007       2008      2009       2010

Electricity - total hydro production,                                                                                                  Électricité - production hydraulique
                                             ...       ...      ...        ...      ...         ...        ...        ...       ...
kilowatt hours (millions)                                                                                                                 totale, kilowatt-heures (millions)

Electricity - total thermal production,                                                                                                  Électricité - production thermique
                                          176.5    194.3     213.4      230.6    244.5       262.6         ...        ...       ...
kilowatt hours (millions)                                                                                                                 totale, kilowatt-heures (millions)

Electricity - total production, self-                                                                                                 Electricité - Production totale privée
                                              1         1        1         1         1           1         ...        ...       ...
producer (Million Kilowatt Hours)                                                                                                               (million de kilowatt heures)

Electricity - total production, public                                                                                                       Electricité - Production totale
                                            181      199       219       236       251         268         ...        ...       ...
(Million Kilowatt Hours)                                                                                                              publique (million de kilowatt heures)


                                                                                      African Statistical Yearbook 2011 / Annuaire Statistique pour l'Afrique 2011
Cape Verde                                                                                                                                                              Cap-Vert
                                                  VII TOURISM AND INFRASTRUCTURE - TOURISME ET INFRASTUCTURE

                                                   2002       2003        2004        2005        2006        2007        2008        2009        2010

         Arrivals - Tourists (thousands)              126         150         157         198         242         267         285           ...         ...           Arrivées - touristes (milliers)

         Rooms in hotels and similar                                                                                                                          Chambres d'hotels et établissements
         establishments (thousands)                                                                                                                                            assimilés (milliers)
                                                        3           3           3           4           ...         ...         ...         ...         ...
         Paved Road (% of total)                        ...         ...         ...         ...         ...         ...         ...         ...         ...        Routes asphaltées (% du total)
         Total Network (Railways-km)                    ...         ...         ...         ...         ...         ...         ...         ...         ...         Réseau total voies ferrées-Km
         Main Telephone Lines (per 1,000                                                                                                                          Lignes téléphoniques fixes (pour
                                                      154         155         153         150         148         146         144           ...         ...
         inhabitants)                                                                                                                                                             1000 habitants)
         Mobile Cellular Subscribers (per                                                                                                                         Abonnés aux téléphones mobiles
                                                       90         120         140         170         220         310         560           ...         ...
         1,000 inhabitants)                                                                                                                                                (pour 1000 habitants)


                                   VII FINANCIAL AND MONETARY STATISTICS - FINANCES ET STATISTIQUES MONETAIRES

                                                   2002       2003        2004        2005        2006        2007        2008        2009        2010

         VII-1 Monetary Statistics                                                                                                                       VII-1 Statistiques monétaires
         Escudo (Millions)                                                                                                                                                   Escudo(Millions)
         Money supply (M1)                         24 794      25 748      27 305      31 938      40 562      45 573      46 112      44 538      45 567                   Masse monétaire (M1)
         Quasi-money                               27 268      30 792      35 218      40 452      44 879      49 043      55 671      60 768      63 640                           Quasi-monnaie
           of which Demand Deposit                      ...         ...         ...         ...         ...         ...         ...         ...         ...              dont Monnaie scripturale
         Net foreign assets                        11 071      10 233      13 716      21 864      25 189      30 998      28 991      27 376      26 594                    Avoirs extérieurs nets
         Domestic credit                           52 256      56 709      59 279      62 344      72 983      78 555      91 381      99 192     106 110                           Crédit intérieur

         of which claims on private sector         24 703      28 344      31 061      33 699      43 683      55 559      70 443      78 761      84 301       dont créances sur le secteur privé

         of which Claims on government                                                                                                                                 dont créances nettes sur le
                                                   26 705      27 263      27 193      27 321      27 545      21 358      19 530      18 550      19 361
         sector, net                                                                                                                                                               gouvernement
         International reserves (millions of US                                                                                                               Réserves internationales (millions de
                                                       80          94         140         174         254         364         361         366         365
         $)                                                                                                                                                                                   $ EU)
         Average Exchange Rate (National                                                                                                                       Taux de change (moyen) (monnaie
                                                   117.17       97.70       88.81       88.67       87.90       80.57       75.28       79.38       83.26
         Currency per us $)                                                                                                                                                nationale par dollars)


         VII-2 Public Finance                                                                                                                                     VII-2 Finances publiques
         Escudo (Millions)                                                                                                                                                   Escudo(Millions)
         Total Revenues and Grants                 22 737      21 371      27 471      26 633      30 743      34 633      39 116      36 575      47 133                 Recettes totales et dons
           Tax Revenue                             14 678      15 457      16 638      18 601      22 828      26 219      29 584      25 676           ...                       Recettes fiscales
           Non Tax Revenue                          1 759       1 514       1 933       2 375       2 126       2 843       3 102       4 050           ...                  Recettes non fiscales
118        Grants                                   6 300       4 400       8 900       5 657       5 789       5 572       6 430       6 850           ...                                   Dons

         Total Expenditures and Net Lending        25 090      24 713      31 353      30 168      35 775      35 977      40 715      44 493      68 321           Dépenses totales et prêts nets

           Current expenditure                      8 647      12 075      15 008      13 869      17 693      16 348      17 774      19 899           ...                   Dépenses courantes
           Of which Wages and Salaries              7 092       9 361       9 805      10 733      11 547      12 491      13 518      14 844           ...         Dont rémunérations et salaires
           Capital expenditure                      9 360       7 674      11 191      11 073      12 415      12 237      16 264      17 823           ...               Dépenses d'équipement
           Net Lending                                200           0         100         147         301         293            0           0          ...                              Prêts nets
         Fiscal Balance                            - 2 353     - 3 342     - 3 882     - 3 535     - 5 031     - 1 344     - 1 599     - 7 917    - 21 188         Solde global y compris les dons


         VII-3 Balance of Payments                                                                                                                            VII-3 Balance des paiements
         Escudo (Millions)                                                                                                                                                   Escudo(Millions)
         Trade balance                            - 27 693    - 30 065    - 33 656    - 30 960    - 40 653    - 53 290    - 53 852    - 50 035    - 68 183                   Balance commerciale
         Services Balance                           1 472       1 404       2 826       6 148      13 822      15 776      18 534      14 321      11 747                     Balance des services
         Net Income                                - 1 612     - 1 419     - 1 616     - 2 984     - 3 952     - 2 586     - 3 737     - 4 225     - 5 176                            Revenus nets
         Current transfers, net total              19 814      21 214      20 685      24 949      25 383      24 278      24 065      27 550      32 986                      Transferts courants
         Current account balance                   - 8 020     - 8 866    - 11 762     - 2 847     - 5 400    - 15 822    - 14 990    - 12 389    - 28 626               Solde du compte courant


         VII-4 External Debt and Financial Flows                                                                                             VII-4 Dette extérieure et flux financiers
         US $ (Millions)                                                                                                                                                       $ E.U (Millions)
         Total external debt                          510         661         769         747         792         897         940       1 029       1 216                   Dette extérieure totale
           Private                                    123         161         228         248         206         257         278         259         245                                    Privée
           Public                                     388         500         542         499         586         640         662         770         971                                 Publique
         Total external debt service                   53          87          91         103          99          95         110         110         125            Service de la dette extérieure
         Net Foreign Direct Investment                                                                                                                        Investissements étranger direct (flux
                                                       39          34          68          82         131         190         212         120           ...
         Inflows                                                                                                                                                                    nets entrants)
         Net Total Official Development                                                                                                                          Aide publique au développement
                                                       92         147         143         162         138         165         222         196           ...
         assistance                                                                                                                                                                 (nette totale)


      African Statistical Yearbook 2011 / Annuaire Statistique pour l'Afrique 2011
Cape Verde                                                                                                                                          Cap-Vert

                                          2002     2003     2004     2005    2006      2007       2008      2009       2010

US $ (Millions)                                                                                                                                              Escudo
Exports, fob                                                                                                                                   Exportations, fàb


Exports - Total                               5        5        7       60      71         81         0          7         ...                    Exportations - Total


Main Products                                                                                                                                  Principaux produits


                                                                                                                                          Thons, albacore, congelés à
Tunas, yellowfin, frozen excluding
                                              0       ...      ...       8      11          6        18          7         ...       l'exclusion du n ° 03.04, foies et
heading No 03.04, livers and roes
                                                                                                                                                             laitances

                                                                                                                                    Listaos ou bonites à ventre rayé,
Skipjack or stripe-bellid bonito,frozen
                                             ...      ...      ...       3       6          6         8          4         ...    congelés ex headg n ° 03.04, foies
ex headg No 03.04,livers&roes
                                                                                                                                                          et laitances


Uppers and parts thereof, other than                                                                                              Tige et leurs parties, autres que les
                                              4        4        5        3       3          3         4          4         ...
stiffeners                                                                                                                                                  raidisseurs


Mens/boys trousers and shorts, of                                                                                                  Hommes, les garçons pantalon et
                                              1        1        2        1       2          5         4          5         ...
cotton, not knitted                                                                                                               courts métrages, du coton, tricotes
                                                                                                                                    Hommes, les garçons pantalon et
Mens/boys underpants and briefs, of
                                              1        2        2        1       2          1         1          1         ...       courts métrages, du coton, non
cotton, knitted
                                                                                                                                                            tricotes
Main Destinations                                                                                                                         Principales destinations

Portugal                                    8.7      9.9     13.5      9.1     8.9        9.8       13.1      10.1         ...                                Portugal


Spain                                       0.0      0.1      0.2     11.1    18.1       13.6       22.4      24.9         ...                                Espagne


United States                               2.0      6.0      4.0      2.8     1.0        2.2        0.5       0.8         ...                              États-Unis


Brazil                                      0.7      1.0      1.3      0.8     2.1       11.2        0.0       0.0         ...                                   Brésil


United Kingdom                              8.0      1.7      1.5      1.4     0.2        0.1        0.6       0.2         ...                           Royaume-Uni


                                          2002     2003     2004     2005    2006      2007       2008      2009       2010
Imports, cif                                                                                                                                    Importations, cif

Imports - Total                             327      361      441      480     617        807       999        788         ...         Importations - Total (millions)    119

                                                                                                                                               Principaux produits
Main Products


Petroleum oils&oils obtained from
                                                                                                                                       Huiles de pétrole, bitumineux,
bituminous minerals,o/than crude             14       19       18       51      78         87       142         89         ...
                                                                                                                                                   distilles, sauf brut
etc


Portland cement nes                           6        6        7        8      11         21        27         19         ...                   Ciment Portland NDA


Bars & rods,i/nas,hr,hd or he,cntg                                                                                                 Barres, i / nas, hr, hd ou he, ,cntg
                                              2        6        8       11      15         26        22          6         ...
indent,ribs,etc,prod dur rp/tar,nes                                                                                              indent,ribs, etc, prod dur rp/tar, nda

Milk and cream powder                                                                                                              Lait et crème en poudre non sucré
                                              6        6        9       10       9         16        13         10         ...
unsweetened exceeding 1.5% fat                                                                                                                 grasses excédant 1,5%


Beer made from malt                           5        8        7        6       8          9        10          9         ...                          Bières de malt


Main Origin                                                                                                                               Principales provenances

Portugal                                  139.7    155.0    173.5    184.2   237.9      311.3      380.9     310.1         ...                                Portugal

Brazil                                     18.6     28.7     45.6    111.7   132.6      157.2       39.6      29.6         ...                                   Brésil

Netherlands                                19.9     28.8     34.2     31.9    61.0       84.6      107.4     107.0         ...                               Pays-Bas

Spain                                      11.5     12.7     21.6     25.9    38.8       44.7       64.0      44.0         ...                                Espagne

Italy                                      10.4     10.5     17.4     35.8    31.5       35.9       34.2      31.0         ...                                   Italie


                                                                                 African Statistical Yearbook 2011 / Annuaire Statistique pour l'Afrique 2011
Central African Republic                                                                                                               République Centrafricaine

         AREA (KM 2)                                                                                   622 984                                                              SUPERFICIE (KM 2)
         CAPITAL CITY                             Bangui                                                                                        Bangui                                  CAPITALE
         CURRENCY                                 CFA Franc                                                                                  Franc CFA                                  MONNAIE


                                 I SOCIAL AND DEMOGRAPHIC INDICATORS — INDICATEURS DEMOGRAPHIQUES ET SOCIAUX

                                                    2002        2003        2004        2005        2006         2007        2008        2009       2010
         Population                                                                                                                                                                  Population
                                                                                                                                                                 Population au milieu de l'année -
         Mid-year population - Total (Million)          3.9         3.9         4.0         4.1         4.1          4.2         4.3         4.4       ...
                                                                                                                                                                                    Total (million)
                                                                                                                                                                 Population au milieu de l'année -
         Mid-year population - Urban (%)                 ...       18.9        38.0        38.0        38.0        38.0         18.9        38.7       ...
                                                                                                                                                                                    Urbaine (%)

         Female (%)                                    50.9        18.9        50.9        50.9        50.9        50.9         19.4        50.9       ...                             Femme (%)


         Population by Age Group                                                                                                                                     Population par groupe d'âge


            0-14                                   1626 574    1684 000    1704 000    1727 000    1751 000    1774 000     1796 000    1814 000       ...                                     0-14


            15-64                                  2112 289    2108 000    2163 000    2216 000    2272 000    2330 000     2391 000    2459 000       ...                                    15-64


            65+                                     151 060     103 000     105 000     108 000     110 000     113 000      115 000     117 000       ...                                     65+


         Active Population (000)                    1 718.0     1 350.0     1 387.0     1 425.0     1 464.0      1 504.0     1 545.0     1 588.0       ...                 Population active (000)

            Female (%)                                 45.7        42.0        41.8        41.8        41.9        41.9         41.8        41.9       ...                             Femme (%)

                                                                                                                                                                Taux brut de natalité - Total (par
         Crude birth rate - Total (per 1000)           38.8        39.1        37.7        37.2        36.6        36.0         38.8        34.9       ...
                                                                                                                                                                                            1000)
                                                                                                                                                              Taux brut de mortalité - Total (par
         Crude death rate - Total (per 1000)           18.1        20.4        17.9        17.7        17.5        17.2         18.0        16.7       ...
                                                                                                                                                                                           1000)
         Life expectancy at birth - Total                                                                                                                       Espérance de vie à la naissance -
                                                       46.0        42.7        46.0        46.2        46.4        46.7         47.0        47.4       ...
         (years)                                                                                                                                                                  Total (années)
         Net reproduction rate - (per                                                                                                                            Taux net de reproduction - (par
                                                         ...         ...        1.6          ...         ...          ...         ...         ...      ...
         woman)                                                                                                                                                                          femme)
                                                                                                                                                                Indice synthétique de fécondité -
         Total fertility rate - (p woman)
                       y        (per    )               5.3         5.1         5.2         5.1         5.0          4.9         4.9         4.7       ...
                                                                                                                                                                                    (par femme)

         Education                                                                                                                                                              Enseignement

         Teaching staff at first level - Total                                                                                                                Personnel enseignant - 1er degré -
                                                       4.80         3.6         4.4         5.1          ...         5.3         5.8         6.4       ...
         (thousands)                                                                                                                                                             Total (milliers)
         Teaching staff at second level - Total                                                                                                              Personnel enseignant - 2ème degré -
120                                                    1.00         1.0         1.0         1.5          ...          ...        1.1         0.9       ...
         (thousands)                                                                                                                                                              Total (milliers)
         Teaching staff at third level - Total                                                                                                               Personnel enseignant - 3ème degré -
                                                         ...         ...         ...         ...         ...          ...         ...         ...      ...
         (thousands)                                                                                                                                                              Total (milliers)
         First level student enrollment - Total                                                                                                                 Elèves inscrits - 1er degré - Total
                                                       368         255         366         413           ...        464         522         324        ...
         (thousands)                                                                                                                                                                      (milliers)
         First level student enrollment -                                                                                                                    Elèves inscrits - 1er degré - Femmes
                                                       149         114         147         169 171918 000           194         219         261        ...
         Female (thousands)                                                                                                                                                                (milliers)
         Second level student enrollment -                                                                                                                    Elèves inscrits - 2ème degré - Total
                                                        43          44          65          76           ...          ...        58          86        ...
         Total (thousands)                                                                                                                                                               (milliers)
         Second level student enrollment -                                                                                                                          Elèves inscrits - 2ème degré -
                                                        22          17          22          28           ...          ...        38          37        ...
         Female (thousands)                                                                                                                                                     Femmes (milliers)
         Third level student enrollment - Total                                                                                                               Elèves inscrits - 3ème degré - Total
                                                         ...         ...        6.4         6.3         4.5           ...        9.6          ...      ...
         (thousands)                                                                                                                                                                     (milliers)
         Third level student enrollment -                                                                                                                           Elèves inscrits - 3ème degré -
                                                         ...         ...         ...         ...        1.0           ...        2.4          ...      ...
         Female (thousands)                                                                                                                                                     Femmes (milliers)
         Public expenditure on education (%                                                                                                                     Dépenses publiques consacrées à
                                                       18.3        17.6        17.2        14.0        10.8        19.5         10.1        11.1       ...
         of budget)                                                                                                                                               l'enseignement (% du budget)

         Health                                                                                                                                                                             Santé

         Hospital beds - Total (per 10 000                                                                                                                      Nombre de lits d'hôpitaux - Total
                                                         ...         8           9           8            8            8          9          10        ...
         population)                                                                                                                                                               (pour 10 000)
         Nurses - Total (per 10 000                                                                                                                            Nombre d'infirmières - Total (pour
                                                          1          1           1           1            1            1          1            2       ...
         population)                                                                                                                                                                     10 000)
         Physicians - Total (per 10 000                                                                                                                        Nombre de médecins - Total (pour
                                                          1          0           0           0            0           1           1            1       ...
         population)                                                                                                                                                                   10 000)
         Public expenditure on Health (% of                                                                                                                  Dépenses publiques consacrées à la
                                                        12           7           9          11          12           11           9           ...      ...
         budget)                                                                                                                                                          santé (% du budget)


      African Statistical Yearbook 2011 / Annuaire Statistique pour l'Afrique 2011
Central African Republic                                                                                                     République Centrafricaine
                                                    II NATIONAL ACCOUNTS — COMPTES NATIONAUX

                                        2002       2003       2004       2005       2006         2007      2008       2009       2010

Gross domestic product by kind of economic activity at current prices
                                                                                        Produit intérieur brut par branche d'activité économique aux prix courants


CFA Franc (Millions)                                                                                                                               Franc CFA (Millions)

Agriculture                             351 740    359 283    352 778    368 151    401 380     416 396    467 646    479 574       ...                            Agriculture

Mining and quarrying                     22 728     17 391     20 074     20 458     20 349      21 208     13 904     23 124       ...                 Industries extractives

Manufacturing                            40 581     38 457     38 764     42 981     47 560      50 991     56 271     56 206       ...            Industries manufacturières

Electricity, gas & water                  4 271      5 548      5 749      5 841      6 544       6 801      5 959      6 474       ...                 Electricité, gaz et eau

Construction                             24 143     25 157     24 875     26 364     29 256      31 290     36 081     39 057       ...          Bâtiments et travaux publics
Wholesale & retail trade,                                                                                                                     Commerce de gros et de détail,
                                         75 204     70 926     73 792     81 045     88 841      98 826    108 437    115 602       ...
restaurants, hotels                                                                                                                                    restaurants et hôtels
                                                                                                                                               Banques, assurances, affaires
Finance, insurance, real estate, etc.        ...        ...        ...        ...        ...         ...        ...        ...      ...
                                                                                                                                                               immobilières
Transport and communications             29 086     27 431     28 540     31 047     38 215      42 510     46 645     53 114       ...      Transport(s) et communications
                                                                                                                                                 Administrations publiques et
Public administration and defense        46 230     41 200     38 300     39 200     37 200      36 300     36 900     39 375       ...
                                                                                                                                                                     défense
Other services                           61 923     45 898     50 550     55 020     58 040      62 746     66 964     83 928       ...                        Autres services
                                                                                                                                              Moins Services d’intermédiation
Less Imputed Service Charges                 ...        ...        ...        ...        ...         ...        ...        ...      ...
                                                                                                                                                                    financière
Gross domestic product at factor                                                                                                          Produit intérieur brut aux couts des
                                        655 906    631 291    633 422    670 107    727 385     767 068    838 807    896 454       ...
cost / basic prices                                                                                                                                     facteurs / prix de base

Plus: Indirect Taxes / taxes on                                                                                                           Plus taxes indirectes/impôts sur les
                                         35 105     30 900     37 300     42 000     42 900      46 400     50 400     53 550       ...
products, less subsidies                                                                                                                      produits, moins les subventions


Expenditure on Gross domestic product at current purchaser's values
                                                                                                   Emploi du produit intérieur brut aux prix courants d'acquisition

CFA Franc (Millions)                                                                                                                               Franc CFA (Millions)
                                                                                                                                                    Consommation finale des
Government final consumption             95 559     68 613     69 999     74 216     71 264      69 577     69 577     88 717       ...
                                                                                                                                                    administrations publiques

Private final consumption               557 850    549 556    590 230    627 173    675 177     723 842    808 394    807 055       ...           Consommation finale privée

Gross fixed capital formation            66 507     42 427     45 707     69 588     78 160      81 450    103 163    124 129       ...        Formation brute de capital fixe

Increase in inventories                      ...        ...        ...        ...        ...         ...        ...        ...      ...                   Variation des stocks

Exports of goods and services           110 300    120 800     93 920     94 263    115 011     123 143    102 553    140 571       ...     Exportations de biens et services
                                                                                                                                               Moins importations de biens et
                                                                                                                                                                                  121
Less imports of goods and services      139 205    119 205    129 134    153 133    169 327     184 544    194 480    210 468       ...
                                                                                                                                                                     services
GDP at purchasers' values               691 011    662 191    670 722    712 107    770 285     813 468    889 207    950 004       ...             PIB aux prix d'acquisition


Gross domestic product by kind of economic activity at constant
                                                                                       Produit intérieur brut par branche d'activité economique aux prix constants
prices
Annual Growth Rates (%)                                                                                                            Taux de croissance annuel (%)
Agriculture                                -0.5       -2.4        2.0        0.3        4.3         2.2        1.8       -8.9       ...                            Agriculture

Mining and quarrying                       -9.5      -21.2        9.0        7.5        8.0         0.5       -9.2       68.7       ...                 Industries extractives

Manufacturing                               1.3       -7.0        1.0        5.0        6.5         7.0        5.5       -0.1       ...            Industries manufacturières

Electricity, gas & water                   -2.5       11.6        1.0        1.0        5.5         3.0       -6.8        8.6       ...                 Electricité, gaz et eau

Construction                                0.0        0.0        1.0        3.0        4.0         6.0        5.5        6.1       ...          Bâtiments et travaux publics
Wholesale & retail trade,                                                                                                                            Commerce de gros et de
                                           -2.5       -5.5        2.0        5.1        5.0         8.0        5.0        3.5       ...
restaurants, hotels                                                                                                                                détail,restaurants et hôtels
                                                                                                                                                Banques, assurances, affaires
Finance, insurance, real estate, etc.        ...        ...        ...        ...        ...         ...        ...        ...      ...
                                                                                                                                                                immobilières
Transport and communications                1.5       -5.5        2.0        4.1       17.9         8.0        5.0       10.6       ...      Transport(s) et communications
                                                                                                                                                 Administrations publiques et
Public administartion and defense          -2.8      -13.1       -9.3       -0.1      -10.4        -4.3       -3.2        4.6       ...
                                                                                                                                                                     défense
Other services                             -2.5      -26.1        7.9        4.7        0.8         5.2        2.0       21.0       ...                        Autres services
                                                                                                                                              Moins Services d’intérmediation
Less Imputed Service Charges                 ...        ...        ...        ...        ...         ...        ...        ...      ...
                                                                                                                                                                    financière
Gross domestic product at factor                                                                                                          Produit intérieur brut aux couts des
                                           -1.2       -6.7        1.8        2.0        4.1         3.6        2.2       -0.6       ...
cost / basic prices                                                                                                                                     facteurs / prix de base

Plus: Indirect Taxes / taxes on                                                                                                           Plus taxes indirectes/impôts sur les
                                           13.0      -14.6       22.4        8.6       -2.0         6.2        1.5        3.2       ...
products, less subsidies                                                                                                                      produits, moins les subventions

Gross domestic product at market                                                                                                            Produit intérieur brut aux prix du
                                           -0.6       -7.1        2.7        2.4        3.8         3.7        2.2       -0.4       ...
prices                                                                                                                                                                 marché


2009: Provisional                                                                                                                                          2009: provisoire


                                                                                          African Statistical Yearbook 2011 / Annuaire Statistique pour l'Afrique 2011
Central African Republic                                                                                              République Centrafricaine

         Expenditure on Gross domestic product at constant purchasers'
                                                                                                    Emplois du produit intérieur brut aux prix constants d'acquisition
         values

         Annual Growth Rates (%)                                                                                                      Taux de croissance annuel (%)
                                                                                                                                                        Consommation finale des
         Government final consumption                -1.9     -30.4      2.7        2.2     -7.9      -4.1      -6.6       -0.4        ...
                                                                                                                                                        administrations publiques

         Private final consumption                   -1.1      -4.5      2.7        2.4      3.3      5.3        4.4       -0.4        ...            Consommation finale privée

         Gross fixed capital formation               -6.6     -38.1      2.7       46.8      7.8      2.3       18.4       -0.4        ...        Formation brute de capital fixe

         Exports of goods and services               -7.5      6.2       2.7       -3.2     17.1      5.2      -22.2       -0.4        ...      Exportations de biens et services

                                                                                                                                                  Moins importations de biens et
         Less imports of goods and services         -11.3     -17.0      2.7       14.4      6.1      7.0       -1.5       -0.4        ...
                                                                                                                                                                        services


                                                                                   III INFLATION

                                                   2002      2003      2004      2005      2006     2007      2008      2009       2010
         Annual Growth Rates (%)                                                                                                      Taux de croissance annuel (%)
         All Item                                    2.3       4.1      -2.1        2.9      6.7      1.0        9.3       3.5        1.8                               Ensemble

         Food                                        2.0       5.2      -4.1        3.5      7.1      1.5       11.8       3.9         ...                           Alimentation

         Health                                        ...       ...      ...        ...      ...       ...       ...        ...       ...                                  Santé

         Energy                                      1.9       -0.8     -4.4       -2.0      8.2      0.0        6.3      10.2         ...                                 Energie

         Transport                                     ...       ...      ...        ...      ...       ...       ...        ...       ...                              Transport


                                                        IV AGRICULTURAL PRODUCTION - PRODUCTION AGRICOLE

                                                   2002      2003      2004      2005      2006     2007      2008      2009       2010
         Tons (Thousand)                                                                                                                                   Tonnes (milliers)
         Cassava, Tons (thousands)                   563       564       566      1 367    1 097      966      1 781     4 090         ...               Manioc, tonnes (milliers)

         Yams, Tons (thousands)                      350       330       350      1 576    7 278    1 888      2 734     1 488         ...             Ignames, tonnes (milliers)

         Maize, Tons (thousands)                     113       119       125       131       131      141       141          ...       ...                  Maïs, tonnes (milliers)
         Groundnuts in shells, Tons                                                                                                                Arachides (en coques), tonnes
                                                     128       134       140       145       140      137         ...        ...       ...
         (thousands)                                                                                                                                                   (milliers)
         Banana, Tons (thousands)                    115       110       110       112       110      110         ...        ...       ...              Bananes, tonnes (milliers)


                                                             V MINING PRODUCTION - PRODUCTION MINIERE
122
                                                   2002      2003      2004      2005      2006     2007      2008      2009       2010

         Diamonds, industrial, carat
                                                   414.8     332.7     460.3      470.4    415.5    417.7      377.2     310.5         ... Diamants, industriels, carat (milliers)
         (thousands)
         Diamonds and other precious stones,       311.0     300.0     354.7      383.0    420.0        ...       ...        ...       ...            Diamants et autres pierres
         unworked carat (thousands)                                                                                                              précieuses brut carat (milliers)
         Gold ores and concentrates                                                                                                                   Minerais d'or et concentrés
                                                    15.9       0.1       3.1       10.4      8.7     12.5       37.1      61.4         ...
         (Kilograms)                                                                                                                                               (kilogrammes)


                                                                                VI ENERGY - ENERGIE

                                                   2002      2003      2004      2005      2006     2007      2008      2009       2010

         Electricity - total hydro production,                                                                                                Électricité - production hydraulique
                                                   120.5     120.4     126.5      133.6    139.6    137.1      125.7     136.4         ...
         kilowatt hours (millions)                                                                                                               totale, kilowatt-heures (millions)

         Electricity - total thermal production,                                                                                                Électricité - production thermique
                                                    25.0      26.0      27.0       28.0     29.0     30.0         ...    100.0         ...
         kilowatt hours (millions)                                                                                                               totale, kilowatt-heures (millions)

         Electricity - total production, self-                                                                                               Electricité - Production totale privée
                                                       ...       ...      ...        ...      ...       ...       ...        ...       ...
         producer (Million Kilowatt Hours)                                                                                                             (million de kilowatt heures)

         Electricity - total production, public                                                                                                     Electricité - Production totale
                                                     108       110       111       128       139      160         ...        ...       ...
         (Million Kilowatt Hours)                                                                                                            publique (million de kilowatt heures)


      African Statistical Yearbook 2011 / Annuaire Statistique pour l'Afrique 2011
Central African Republic                                                                                                              République Centrafricaine
                                         VII TOURISM AND INFRASTRUCTURE - TOURISME ET INFRASTUCTURE

                                          2002       2003        2004        2005        2006          2007       2008        2009          2010

Arrivals - Tourists (thousands)                 3           6          8          12          14            ...         ...         ...          ...           Arrivées - touristes (milliers)

Rooms in hotels and similar                                                                                                                          Chambres d'hotels et établissements
establishments (thousands)                     ...         ...         ...         ...         ...          ...         ...         ...          ...                  assimilés (milliers)

Paved Road (% of total)                       20          20          20          20          20           20          20          20            ...        Routes asphaltées (% du total)
Total Network (Railways-km)                     3           3           3           3           3            3           3           3           ...         Réseau total voies ferrées-Km
Main Telephone Lines (per 1,000                                                                                                                            Lignes téléphoniques fixes (pour
                                                2           2           2           2           3            3           3          ...          ...
inhabitants)                                                                                                                                                               1000 habitants)
Mobile Cellular Subscribers (per                                                                                                                           Abonnés aux téléphones mobiles
                                                3         10          15          24          26           31          35           ...          ...
1,000 inhabitants)                                                                                                                                                  (pour 1000 habitants)


                          VII FINANCIAL AND MONETARY STATISTICS - FINANCES ET STATISTIQUES MONETAIRES

                                          2002       2003        2004        2005        2006          2007       2008        2009          2010

VII-1 Monetary Statistics                                                                                                                         VII-1 Statistiques monétaires
CFA Franc (Millions)                                                                                                                                             Franc CFA (Millions)
Money supply (M1)                         94 739      85 435      97 715     113 703     105 461       97 294     113 720     131 516      139 273                   Masse monétaire (M1)
Quasi-money                               10 191      11 079      12 512      14 717      17 513       21 198      24 343      24 856       31 415                           Quasi-monnaie
  of which Demand Deposit                      ...         ...         ...         ...         ...          ...         ...         ...          ...              dont Monnaie scripturale
Net foreign assets                        47 921      40 153      42 498      48 782      36 003       24 986      24 513      28 664        9 313                    Avoirs extérieurs nets
Domestic credit                           96 546     102 177     115 342     126 145     135 725      142 702     159 815     162 846      179 023                           Crédit intérieur

of which claims on private sector         41 320      40 977      49 645      48 461      51 251       54 884      62 010      65 860       81 626       dont créances sur le secteur privé

of which Claims on government                                                                                                                                   dont créances nettes sur le
                                          47 163      52 760      58 960      72 037      79 293       83 628      95 660      95 210       95 353
sector, net                                                                                                                                                                 gouvernement
International reserves (millions of US                                                                                                                 Réserves internationales (millions de
                                             123         132         148         139         125           83         122         211          169
$)                                                                                                                                                                                     $ EU)
Average Exchange Rate (National                                                                                                                         Taux de change (moyen) (monnaie
                                          696.99      581.20      528.29      527.47      522.89       479.27      447.81      472.19       495.28
Currency per us $)                                                                                                                                                  nationale par dollars)


VII-2 Public Finance                                                                                                                                       VII-2 Finances publiques
CFA Franc (Millions)                                                                                                                                             Franc CFA (Millions)
Total Revenues and Grants                106 100      63 700      78 500      88 000     176 300      117 000     134 700     151 000      150 900                 Recettes totales et dons
  Tax Revenue                             61 400      45 000      48 300      50 500      60 500       59 500      70 600      81 800       89 500                         Recettes fiscales
  Non Tax Revenue                         17 000       8 600       7 500       8 000      12 900       24 100      21 800      19 800       16 400                    Recettes non fiscales
  Grants                                  27 700      10 100      22 700      29 500     102 900       33 400      42 300      49 400       45 000                                     Dons      123
Total Expenditures and Net Lending       114 672      85 329      93 406     120 400     107 200      107 600     143 600     144 300      277 187           Dépenses totales et prêts nets

  Current expenditure                     50 237      50 841      56 688      61 400      52 400       51 800      62 700      69 100       76 500                     Dépenses courantes
  Of which Wages and Salaries             33 134      34 513      38 878      39 200      37 200       37 400      38 600      42 200       44 800           Dont rémunérations et salaires
  Capital expenditure                     46 035      19 457      18 195      38 400      37 700       29 400      40 100      46 200      163 687                 Dépenses d'équipement
  Net Lending                                   0           0           0           0           0            0           0           0            0                               Prêts nets
Fiscal Balance                            - 8 572    - 21 629    - 14 906    - 32 400     69 100        9 400      - 8 900      6 700     - 126 287         Solde global y compris les dons


VII-3 Balance of Payments                                                                                                                              VII-3 Balance des paiements
CFA Franc (Millions)                                                                                                                                             Franc CFA (Millions)
Trade balance                             18 638       6 081      - 9 191    - 24 815    - 23 497     - 33 867    - 67 183    - 69 452     - 87 616                   Balance commerciale
Services Balance                         - 52 227    - 36 102    - 34 460    - 32 282    - 35 867     - 41 489    - 43 441    - 43 022     - 57 841                    Balance des services
Net Income                                - 6 103     - 1 328     - 7 355     - 7 178     - 7 830      - 7 457     - 9 957     - 9 957      - 1 926                            Revenus nets
Current transfers, net total              28 630      16 761      39 183      16 200      42 231       30 500      32 400      36 500       42 000                      Transferts courants
Current account balance                  - 11 062    - 14 588    - 11 824    - 48 075    - 24 963     - 52 313    - 88 181    - 85 931    - 105 382               Solde du compte courant


VII-4 External Debt and Financial Flows                                                                                              VII-4 Dette extérieure et flux financiers
US $ (Millions)                                                                                                                                                         $ E.U (Millions)
Total external debt                        1 048       1 241       1 080       1 073       1 087          986       1 050         264          297                   Dette extérieure totale
  Private                                     42          51          56          56            0            0           0           0            0                                   Privée
  Public                                   1 005       1 190       1 024       1 017       1 087          986       1 050         264          297                                 Publique
Total external debt service                   28          24          23          28          41           36          43          48           83            Service de la dette extérieure
Net Foreign Direct Investment                                                                                                                          Investissements étranger direct (flux
                                                6         22          29          32          35           57         117          42            ...
Inflows                                                                                                                                                                      nets entrants)
Net Total Official Development                                                                                                                            Aide publique au développement
                                              60          51         110          89         134          177         256         237            ...
assistance                                                                                                                                                                   (nette totale)


                                                                                                 African Statistical Yearbook 2011 / Annuaire Statistique pour l'Afrique 2011
Central African Republic                                                                                                     République Centrafricaine

                                           2002        2003        2004        2005        2006        2007        2008        2009       2010

         CFA Franc (Millions)                                                                                                                                       Franc CFA
         Exports, fob                                                                                                                                     Exportations, fàb


         Exports - Total                  102 408      74 420      70 661      67 389      82 422      85 418      66 192      52 953        ...             Exportations - Total


         Main Products                                                                                                                                    Principaux produits


         Diamonds                          26 316      28 332      27 765      33 176      32 666      29 755      22 198      17 506        ...                        Diamants


         Rough lumber                       5 735      34 600      16 582      19 301      39 800      18 578      15 858       5 527        ...                      Bois grume


         Cotton                             6 400         495       1 800          59         742         555       1 035         571        ...                           Coton


         Coffee                             1 323         800         992         903         779       4 189       2 069         223        ...                             Café


         Gold                                  71          10          37          34          55          77         252         384        ...                               Or

         Main Destinations                                                                                                                           Principales destinations

         Belgium                          16 733.0    13 678.0    25 425.0    17 448.0    17 905.0    15 443.0    15 526.0    17 629.0       ...                         Belgique


         France                           15 253.0    13 611.0     4 694.0    11 495.0     9 592.0     9 118.0     5 126.0     2 546.0       ...                          France


         Cameroon                         14 483.0    10 407.0          ...    7 347.0    14 695.0     8 610.0          ...    3 339.0       ...                       Cameroun


         Germany                            684.0       195.0      4 629.0     4 515.0     3 741.0     6 576.0     5 635.0     2 991.0       ...                       Allemagne


         Switzerland                        581.0       156.0      8 226.0     8 421.0     3 777.0     6 100.0     2 788.0     1 079.0       ...                           Suisse


                                           2002        2003        2004        2005        2006        2007        2008        2009       2010
         Imports, cif                                                                                                                                      Importations, cif

124      Imports - Total                        ...         ...         ...         ...         ...         ...         ...         ...      ...   Importations - Total (millions)


                                                                                                                                                          Principaux produits
         Main Products


         Food                              10 350      12 609      13 350      14 436      18 881      18 489      19 842      29 885        ...           Produits aliumentaires


         Textiles                           5 919       3 073       4 799       9 185       3 815       4 164       5 577       3 319        ...                          Textiles


         Transport equipment               10 008       7 079       8 357       8 366       6 481      14 204      13 950      11 505        ...          Matériels de transports


         Mineral fuels                      8 868       9 133      12 399      16 596      26 000         778       4 344         508        ...         Combustibles minéraux


         Chemical products
                                            5 434       8 831       4 358       5 999       5 018       9 297       9 616      11 178        ...              Produits chimiques


         Main Origin                                                                                                                                 Principales provenances

         France                           19 903.0    18 466.0    15 422.0     9 189.0    14 708.0    25 147.0    26 884.0    18 703.0       ...                          France

         Cameroun                         13 284.0     8 465.0     4 890.0    30 442.0     8 154.0     9 191.0    11 081.0     6 917.0       ...                       Cameroun

         Japon                             7 847.0     3 308.0     4 733.0     1 527.0     4 183.0     6 198.0     6 126.0     6 866.0       ...                           Japon

         Belgium                           2 948.0     5 333.0     2 796.0     5 961.0     3 174.0     3 114.0          ...         ...      ...                       Allemagne

         China                             2 424.0          ...    1 523.0          ...    3 131.0     5 723.0     4 767.0     5 988.0       ...                            Chine


      African Statistical Yearbook 2011 / Annuaire Statistique pour l'Afrique 2011
Chad                                                                                                                                                                        Tchad

AREA (KM 2)                                                                                1 284 000                                                             SUPERFICIE (KM 2)
CAPITAL CITY                             N Djamena                                                                                Ndjamena                                   CAPITALE
CURRENCY                                 CFA Franc                                                                                Franc CFA                                  MONNAIE


                        I SOCIAL AND DEMOGRAPHIC INDICATORS — INDICATEURS DEMOGRAPHIQUES ET SOCIAUX

                                           2002        2003        2004       2005       2006         2007        2008        2009       2010
Population                                                                                                                                                                Population
                                                                                                                                                      Population au milieu de l'année -
Mid-year population - Total (Million)          9.0         9.4         9.7       10.0       10.3        10.6         10.9        11.2       ...
                                                                                                                                                                         Total (million)
                                                                                                                                                      Population au milieu de l'année -
Mid-year population - Urban (%)               25.4        25.3        25.2       25.4       25.4        25.3         22.7        21.7       ...
                                                                                                                                                                         Urbaine (%)

Female (%)                                    50.4        50.4        50.4       50.4       50.4        50.4         50.3        50.7       ...                             Femme (%)


Population by Age Group                                                                                                                                   Population par groupe d'âge


   0-14                                   4149 000    4297 000    4450 000   4609 000   4729 000    4853 000     4981 000    5112 000       ...                                     0-14


   15-64                                  4592 000    4760 000    4935 000   5116 000   5270 000    5429 000     5592 000    5761 000       ...                                    15-64


   65+                                     299 000     306 000     314 000    322 000    329 000     336 000      342 000     349 000       ...                                     65+


Active Population (000)                    3 574.0     3 747.0     3 913.0    4 053.0    4 179.0      4 299.0     4 432.0     4 280.0       ...                 Population active (000)

   Female (%)                                 46.3        47.6        48.6       48.9       48.8        48.6         48.8        45.2       ...                             Femme (%)

                                                                                                                                                     Taux brut de natalité - Total (par
Crude birth rate - Total (per 1000)           48.2        47.7        47.5       47.7       46.3        46.2         45.9        45.3       ...
                                                                                                                                                                                 1000)
                                                                                                                                                   Taux brut de mortalité - Total (par
Crude death rate - Total (per 1000)           16.2        15.6        15.0       15.6       14.7        14.4         14.2        14.1       ...
                                                                                                                                                                                1000)
Life expectancy at birth - Total                                                                                                                     Espérance de vie à la naissance -
                                              48.7        48.7        49.5       50.2       50.2        52.2         52.2        52.2       ...
(years)                                                                                                                                                                Total (années)
Net reproduction rate - (per                                                                                                                          Taux net de reproduction - (par
                                               2.5         2.5         2.5        2.4        2.4          2.4         2.4         2.4       ...
woman)                                                                                                                                                                        femme)
                                                                                                                                                     Indice synthétique de fécondité -
Total fertility rate - (p woman)
              y        (per    )               6.6         6.6         6.6        6.4        6.2          6.2         6.2         6.2       ...
                                                                                                                                                                         (par femme)

Education                                                                                                                                                            Enseignement

Teaching staff at first level - Total                                                                                                              Personnel enseignant - 1er degré -
                                             16.14        18.5        20.0       20.7       21.8        24.5         27.4          ...      ...
(thousands)                                                                                                                                                           Total (milliers)
Teaching staff at second level - Total                                                                                                            Personnel enseignant - 2ème degré -
                                              6.20         6.4         6.5        7.7        8.9        11.2         12.7          ...      ...                                              125
(thousands)                                                                                                                                                            Total (milliers)
Teaching staff at third level - Total                                                                                                           Personnel enseignant - 3ème degré -
                                               0.8         1.1         1.3        1.4        1.5          2.0         2.4          ...      ...
(thousands)                                                                                                                                                          Total (milliers)
First level student enrollment - Total                                                                                                               Elèves inscrits - 1er degré - Total
                                             1 085       1 164       1 272      1 262      1 296       1 324           ...         ...      ...
(thousands)                                                                                                                                                                    (milliers)
First level student enrollment -                                                                                                                  Elèves inscrits - 1er degré - Femmes
                                              425         462         502        507        522          542         615           ...      ...
Female (thousands)                                                                                                                                                              (milliers)
Second level student enrollment -                                                                                                                  Elèves inscrits - 2ème degré - Total
                                              185         213         228        245        263          314           ...         ...      ...
Total (thousands)                                                                                                                                                             (milliers)
Second level student enrollment -                                                                                                                        Elèves inscrits - 2ème degré -
                                               46          52          56         63         69           97           ...         ...      ...
Female (thousands)                                                                                                                                                   Femmes (milliers)
Third level student enrollment - Total                                                                                                             Elèves inscrits - 3ème degré - Total
                                                ...        7.4        10.1       12.4         ...          ...       19.0          ...      ...
(thousands)                                                                                                                                                                   (milliers)
Third level student enrollment -                                                                                                                         Elèves inscrits - 3ème degré -
                                                ...        0.8         1.3        0.7         ...          ...        2.4          ...      ...
Female (thousands)                                                                                                                                                   Femmes (milliers)
Public expenditure on education (%                                                                                                                   Dépenses publiques consacrées à
                                                ...         ...        7.7       10.1         ...          ...         ...         ...      ...
of budget)                                                                                                                                             l'enseignement (% du budget)

Health                                                                                                                                                                           Santé

Hospital beds - Total (per 10 000                                                                                                                    Nombre de lits d'hôpitaux - Total
                                               16          18          18         20         20           24          26          26        ...
population)                                                                                                                                                             (pour 10 000)
Nurses - Total (per 10 000                                                                                                                          Nombre d'infirmières - Total (pour
                                                 7          7           6          6          6             5           5           5       ...
population)                                                                                                                                                                   10 000)
Physicians - Total (per 10 000                                                                                                                      Nombre de médecins - Total (pour
                                                 3          3           3          3          3            3            3          ...      ...
population)                                                                                                                                                                 10 000)
Public expenditure on Health (% of                                                                                                                Dépenses publiques consacrées à la
                                                 9          9           9          7          8            ...         ...         ...      ...
budget)                                                                                                                                                        santé (% du budget)


                                                                                                African Statistical Yearbook 2011 / Annuaire Statistique pour l'Afrique 2011
Chad                                                                                                                                                                                        Tchad
                                                                      II NATIONAL ACCOUNTS — COMPTES NATIONAUX

                                                     2002            2003         2004         2005         2006         2007          2008         2009           2010

          Gross domestic product by kind of economic activity at current prices
                                                                                                                Produit intérieur brut par branche d'activité économique aux prix courants


          CFA Franc (Millions)                                                                                                                                                         Franc CFA (Millions)

          Agriculture                               476 500         457 998      484 674      586 500      647 423      586 490        626 625     648 284        754 708                              Agriculture

          Mining and quarrying                           92 300     282 225      369 383     1 510 100    1 651 020    1 643 175     1 849 471    1 163 253      1 721 183                  Industries extractives

          Manufacturing                             125 100         121 645      117 175      143 500      166 694      171 825        183 279     194 945        210 684              Industries manufacturières

          Electricity, gas & water                        7 800       6 984        7 079        9 200       10 212       13 265         15 659      18 776         21 029                   Electricité, gaz et eau

          Construction                                   20 700      24 300       27 939       30 900       34 985       57 300         61 600      66 800         79 706            Bâtiments et travaux publics
          Wholesale & retail trade,                                                                                                                                               Commerce de gros et de détail,
                                                    295 400         302 624      310 200      336 400      378 653      363 208        397 343     422 154        461 838
          restaurants, hotels                                                                                                                                                              restaurants et hôtels
                                                                                                                                                                                   Banques, assurances, affaires
          Finance, insurance, real estate, etc.              ...          ...          ...          ...          ...          ...           ...            ...          ...
                                                                                                                                                                                                   immobilières
          Transport and communications                   42 000      40 259       44 300       54 400       59 623       55 723         59 352      61 577         65 803        Transport(s) et communications
                                                                                                                                                                                     Administrations publiques et
          Public administration and defense         151 900         171 463      184 300      210 800      241 427      324 708        356 651     402 162        434 404
                                                                                                                                                                                                         défense
          Other services                            118 400         120 735      130 300      153 700      165 787      161 881        174 292     186 471        193 803                          Autres services
                                                                                                                                                                                  Moins Services d’intermédiation
          Less Imputed Service Charges                       ...          ...          ...          ...          ...          ...           ...            ...          ...
                                                                                                                                                                                                        financière
          Gross domestic product at factor                                                                                                                                    Produit intérieur brut aux couts des
                                                   1 330 100       1 528 233    1 675 349    3 035 500    3 355 825    3 377 575     3 724 273    3 164 422      3 943 156
          cost / basic prices                                                                                                                                                               facteurs / prix de base

          Plus: Indirect Taxes / taxes on                                                                                                                                     Plus taxes indirectes/impôts sur les
                                                         55 207      53 544       56 921       65 221       72 821       80 421         84 021      91 434        101 497
          products, less subsidies                                                                                                                                                produits, moins les subventions


          Expenditure on Gross domestic product at current purchaser's values
                                                                                                                            Emploi du produit intérieur brut aux prix courants d'acquisition

          CFA Franc (Millions)                                                                                                                                                         Franc CFA (Millions)
                                                                                                                                                                                        Consommation finale des
          Government final consumption              106 155         108 239      114 486      135 406      162 800      235 400        279 100     311 100        315 312
                                                                                                                                                                                        administrations publiques

          Private final consumption                1 140 220       1 166 201    1 055 513    2 008 789    2 365 885    2 335 979     2 304 860    2 434 591      2 403 981            Consommation finale privée

          Gross fixed capital formation            1 451 374        891 977      743 660      722 004      873 958      878 071        989 551    1 222 424      1 594 111         Formation brute de capital fixe

          Increase in inventories                        25 000           0       20 700       20 700       12 000       12 000         14 000      15 000         10 000                     Variation des stocks

          Exports of goods and services             175 493         387 458     1 203 613    1 719 583    1 830 400    1 836 572     2 019 907    1 418 602      1 945 262      Exportations de biens et services
126                                                                                                                                                                                Moins importations de biens et
          Less imports of goods and services       1 512 936        972 098     1 405 701    1 505 761    1 816 397    1 840 025     1 799 124    2 145 862      2 224 013
                                                                                                                                                                                                         services
          GDP at purchasers' values                1 385 307       1 581 777    1 732 270    3 100 721    3 428 646    3 457 996     3 808 294    3 255 857      4 044 652              PIB aux prix d'acquisition


          Gross domestic product by kind of economic activity at constant
                                                                                                              Produit intérieur brut par branche d'activité economique aux prix constants
          prices
          Annual Growth Rates (%)                                                                                                                                      Taux de croissance annuel (%)
          Agriculture                                      -1.0          5.1         -6.1         13.6         -0.1         -1.4          -2.6         -6.4           14.6                             Agriculture

          Mining and quarrying                             36.4       140.9        234.1           2.6         -7.9         -6.6          -9.2         -5.4            4.2                  Industries extractives

          Manufacturing                                    13.0          1.0         -6.3         16.6          8.6          0.1          -0.9         -0.2            0.8             Industries manufacturières

          Electricity, gas & water                         15.9        -14.0         -1.2         30.6         10.0         31.7           8.6          8.3           11.5                  Electricité, gaz et eau

          Construction                                     13.8         23.5         15.8         12.3         11.2         64.8          -3.5          3.4           12.3           Bâtiments et travaux publics
          Wholesale & retail trade,                                                                                                                                                      Commerce de gros et de
                                                           12.5          5.0          7.0          5.9          5.1          4.3           2.8         -0.5            7.6
          restaurants, hotels                                                                                                                                                          détail,restaurants et hôtels
                                                                                                                                                                                    Banques, assurances, affaires
          Finance, insurance, real estate, etc.              ...          ...          ...          ...          ...          ...           ...            ...          ...
                                                                                                                                                                                                    immobilières
          Transport and communications                     10.9        -11.2          2.6         15.8          8.6         -6.6          -0.5         -1.3            5.9       Transport(s) et communications
                                                                                                                                                                                     Administrations publiques et
          Public administartion and defense                 6.9         18.1         11.9         10.4          9.5         24.5           5.8         11.8            0.2
                                                                                                                                                                                                         défense
          Other services                                    7.3          5.2          7.1         14.9          5.9          0.6           1.5         -3.0            3.4                         Autres services
                                                                                                                                                                                  Moins Services d’intérmediation
          Less Imputed Service Charges                       ...          ...          ...          ...          ...          ...           ...            ...          ...
                                                                                                                                                                                                        financière
          Gross domestic product at factor                                                                                                                                    Produit intérieur brut aux couts des
                                                            8.1         14.7         34.7          8.5          0.7          2.3          -1.8         -1.2            6.1
          cost / basic prices                                                                                                                                                               facteurs / prix de base

          Plus: Indirect Taxes / taxes on                                                                                                                                     Plus taxes indirectes/impôts sur les
                                                           19.4          4.0          9.5          9.9          4.4         11.2          -2.4          1.6            3.8
          products, less subsidies                                                                                                                                                produits, moins les subventions

          Gross domestic product at market                                                                                                                                      Produit intérieur brut aux prix du
                                                            8.5         14.3         33.7          8.6          0.8          2.6          -1.8         -1.1            6.1
          prices                                                                                                                                                                                           marché


          2008: semi-final           2009: Provisional      2010:Estimated                                                          2008: semi-définitif           2009: provisoire               2010:Estimée


      African Statistical Yearbook 2011 / Annuaire Statistique pour l'Afrique 2011
Chad                                                                                                                                                                 Tchad

Expenditure on Gross domestic product at constant purchasers'
                                                                                                   Emplois du produit intérieur brut aux prix constants d'acquisition
values

Annual Growth Rates (%)                                                                                                              Taux de croissance annuel (%)
                                                                                                                                                       Consommation finale des
Government final consumption               16.0        1.0        4.8       17.3       19.2         43.6       17.6      10.5        0.4
                                                                                                                                                       administrations publiques

Private final consumption                   6.5        4.5      37.2          8.6        6.2        17.5      -15.6       -4.2     -13.5             Consommation finale privée

Gross fixed capital formation             162.5      -24.7       -4.6        -6.4        5.0         -4.7       6.0      21.4       26.0         Formation brute de capital fixe

Exports of goods and services              13.7       -3.5      90.3        10.9        -1.5         -4.6      -8.2      24.8       -7.9       Exportations de biens et services

                                                                                                                                                 Moins importations de biens et
Less imports of goods and services        168.4      -33.9       -0.5        -6.1      15.3         19.6      -12.2      27.3       -0.2
                                                                                                                                                                       services


                                                                             III INFLATION

                                          2002     2003       2004        2005       2006         2007       2008      2009       2010
Annual Growth Rates (%)                                                                                                              Taux de croissance annuel (%)
All Item                                    5.2       -1.8       -5.3         7.9        8.0         -9.0       8.3      10.1        0.6                               Ensemble

Food                                        0.1        0.0       -0.1         0.1        0.1         -0.1        ...        ...       ...                           Alimentation

Health                                      0.0        0.1        0.0         0.0        0.0          0.0        ...        ...       ...                                  Santé

Energy                                      0.2        0.1       -0.1         0.1        0.1         -0.1        ...        ...       ...                                 Energie

Transport                                   0.1        0.0        0.0         0.0        0.0          0.1        ...        ...       ...                              Transport


                                              IV AGRICULTURAL PRODUCTION - PRODUCTION AGRICOLE

                                          2002     2003       2004        2005       2006         2007       2008      2009       2010
Tons (Thousand)                                                                                                                                           Tonnes (milliers)
Sorghum, Tons (thousands)                   481       565        449         583        694          577       685          ...       ...               Sorgho, tonnes (milliers)

Millet, Tons (thousands)                    357       516        298         578        590          495       523          ...       ...                   Mil, tonnes (milliers)
Groundnuts, in shells, Tons                                                                                                                        Arachides, en coques, tonnes
                                            450       450        450         450        450          450         ...        ...       ...
(thousands)                                                                                                                                                           (milliers)
Cereals, nes, Tons (thousands)              151       290        267         339        338          584       406          ...       ...        Céréales, nda, tonnes (milliers)

Cassava, Tons (thousands)                   322       325        325         325        325          330         ...        ...       ...               Manioc, tonnes (milliers)


                                                    V MINING PRODUCTION - PRODUCTION MINIERE
                                                                                                                                                                                     127
                                          2002     2003       2004        2005       2006         2007       2008      2009       2010

Crude petroleum, metric tons                                                                                                                     Pétrole brut, tonnes métriques
                                             ...   1 798.1    8 505.3     8 808.0    7 873.6      7 189.6        ...        ...       ...
(thousands)                                                                                                                                                            (milliers)
                                             ...        ...        ...         ...        ...          ...       ...        ...       ...


                                             ...        ...        ...         ...        ...          ...       ...        ...       ...


                                                                         VI ENERGY - ENERGIE

                                          2002     2003       2004        2005       2006         2007       2008      2009       2010

Electricity - total hydro production,                                                                                                        Électricité - production hydraulique
                                             ...        ...        ...         ...        ...          ...       ...        ...       ...
kilowatt hours (millions)                                                                                                                       totale, kilowatt-heures (millions)

Electricity - total thermal production,                                                                                                        Électricité - production thermique
                                           93.0      94.0       97.0       100.0      102.0        105.0         ...        ...       ...
kilowatt hours (millions)                                                                                                                       totale, kilowatt-heures (millions)

Electricity - total production, self-                                                                                                       Electricité - Production totale privée
                                             ...        ...        ...         ...        ...          ...       ...        ...       ...
producer (Million Kilowatt Hours)                                                                                                                     (million de kilowatt heures)

Electricity - total production, public                                                                                                             Electricité - Production totale
                                             93        94         97         100        102          105         ...        ...       ...
(Million Kilowatt Hours)                                                                                                                    publique (million de kilowatt heures)


                                                                                            African Statistical Yearbook 2011 / Annuaire Statistique pour l'Afrique 2011
Chad                                                                                                                                                                                     Tchad
                                                   VII TOURISM AND INFRASTRUCTURE - TOURISME ET INFRASTUCTURE

                                                     2002         2003         2004         2005          2006         2007         2008         2009         2010

         Arrivals - Tourists (thousands)                 32           21           26           29            16           25            ...          ...          ...           Arrivées - touristes (milliers)

         Rooms in hotels and similar                                                                                                                                   Chambres d'hotels et établissements
         establishments (thousands)                       1            1            1            1             ...          ...          ...          ...          ...                  assimilés (milliers)

         Paved Road (% of total)                          ...          ...          ...          ...           ...          ...          ...          ...          ...        Routes asphaltées (% du total)
         Total Network (Railways-km)                      ...          ...          ...          ...           ...          ...          ...          ...          ...         Réseau total voies ferrées-Km
         Main Telephone Lines (per 1,000                                                                                                                                     Lignes téléphoniques fixes (pour
                                                           1           1            1            1              1            1            1           ...          ...
         inhabitants)                                                                                                                                                                        1000 habitants)
         Mobile Cellular Subscribers (per                                                                                                                                    Abonnés aux téléphones mobiles
                                                           4           7           13           21            45           86          166            ...          ...
         1,000 inhabitants)                                                                                                                                                           (pour 1000 habitants)


                                   VII FINANCIAL AND MONETARY STATISTICS - FINANCES ET STATISTIQUES MONETAIRES

                                                     2002         2003         2004         2005          2006         2007         2008         2009         2010

         VII-1 Monetary Statistics                                                                                                                                  VII-1 Statistiques monétaires
         CFA Franc (Billions)                                                                                                                                                     Franc CFA (Milliards)
         Money supply (M1)                              177          171          175          232           358          390          441          443          558                   Masse monétaire (M1)
         Quasi-money                                     12           11           13           16            20           25           30           33           41                           Quasi-monnaie
           of which Demand Deposit                        ...          ...          ...          ...           ...          ...          ...          ...          ...              dont Monnaie scripturale
         Net foreign assets                              71           39           49           71           259          410          616          238          299                    Avoirs extérieurs nets
         Domestic credit                                152          172          177          215           160           37        - 100          268          360                           Crédit intérieur

         of which claims on private sector               56           67           73           88            85           98          140          167          197       dont créances sur le secteur privé

         of which Claims on government                                                                                                                                            dont créances nettes sur le
                                                         72           74           84           85            23         - 85        - 278           64          131
         sector, net                                                                                                                                                                          gouvernement
         International reserves (millions of US                                                                                                                          Réserves internationales (millions de
                                                        219          187          222          226           625          955        1 345          617          712
         $)                                                                                                                                                                                              $ EU)
         Average Exchange Rate (National                                                                                                                                  Taux de change (moyen) (monnaie
                                                     696.99       581.20       528.29       527.47        522.89       479.27       447.81       472.19       495.28
         Currency per us $)                                                                                                                                                           nationale par dollars)


         VII-2 Public Finance                                                                                                                                                VII-2 Finances publiques
         CFA Franc (Billions)                                                                                                                                                     Franc CFA (Milliards)
         Total Revenues and Grants                      204          260          358          394           625          814        1 043          666          785                 Recettes totales et dons
           Tax Revenue                                  103          126          216          280           556          752          977          612            ...                       Recettes fiscales
           Non Tax Revenue                                9            7           10           10              6          13             9            8           ...                  Recettes non fiscales
128        Grants                                        92          127          132          104            63           49           56           46            ...                                   Dons

         Total Expenditures and Net Lending             287          329          412          405           542          731          842        1 034        1 278           Dépenses totales et prêts nets

           Current expenditure                          138          134          140          187           343          464          579          716            ...                   Dépenses courantes
           Of which Wages and Salaries                   49           56           62           73            85          153          184          231            ...         Dont rémunérations et salaires
           Capital expenditure                          150          195          272          218           199          245          296          318            ...               Dépenses d'équipement
           Net Lending                                    0            0            0            0              0          21          - 32            0           ...                              Prêts nets
         Fiscal Balance                                - 83         - 69         - 54         - 11            83           84          200        - 368        - 493          Solde global y compris les dons


         VII-3 Balance of Payments                                                                                                                                       VII-3 Balance des paiements
         CFA Franc (Millions)                                                                                                                                                      Franc CFA (Millions)
         Trade balance                             - 916 900    - 136 238     657 297     1 157 659    1 047 064      895 792     1 083 730     173 445      672 372                    Balance commerciale
         Services Balance                          - 420 542    - 448 402    - 859 386    - 943 837    -1 033 061    - 899 246    - 862 946    - 900 704    - 951 124                    Balance des services
         Net Income                                 - 41 460    - 260 746    - 313 440    - 304 343      110 802     - 378 777    - 326 225     - 93 585    - 407 845                            Revenus nets
         Current transfers, net total                60 350       57 238      115 794      164 287        70 935      260 034      225 497      252 117      167 697                      Transferts courants
         Current account balance                  -1 318 552    - 788 148    - 399 734      73 766       195 740     - 122 197     120 056     - 568 728    - 518 900               Solde du compte courant


         VII-4 External Debt and Financial Flows                                                                                                       VII-4 Dette extérieure et flux financiers
         US $ (Millions)                                                                                                                                                                  $ E.U (Millions)
         Total external debt                          1 224        1 385        1 638        1 625         1 805        1 765        1 625        1 701        2 123                   Dette extérieure totale
           Private                                        0            0            0            0              0            0            0            0            0                                   Privée
           Public                                     1 224        1 385        1 638        1 625         1 805        1 765        1 625        1 701        2 123                                 Publique
         Total external debt service                     36           53           46           57            71           57          157           80          100            Service de la dette extérieure
         Net Foreign Direct Investment                                                                                                                                   Investissements étranger direct (flux
                                                        924          713          467         - 99         - 279         - 69          234          462            ...
         Inflows                                                                                                                                                                               nets entrants)
         Net Total Official Development                                                                                                                                     Aide publique au développement
                                                        229          252          337          380           288          358          419          561            ...
         assistance                                                                                                                                                                            (nette totale)


      African Statistical Yearbook 2011 / Annuaire Statistique pour l'Afrique 2011
Chad                                                                                                                                                          Tchad

                                        2002     2003     2004     2005       2006         2007       2008       2009      2010

US $ (Millions)                                                                                                                                              Franc CFA
Exports, fob                                                                                                                                       Exportations, fàb


Exports - Total                           185      602    2 199     3 142      3 410        3 677      4 275     2 160         ...                    Exportations - Total


Main Products                                                                                                                                      Principaux produits


Oils petroleum, bituminous,                                                                                                                Huiles de pétrole, bitumineux,
                                            0        4      93        424         97           27        136        ...        ...
distillates, except crude                                                                                                                              distilles, sauf brut


Lumber, tropical hardwood nes,                                                                                                       Bois d'oeuvre, nda feuillus tropicaux,
                                           ...      ...      ...        ...        ...          ...        0        ...        ...
sawn lengthwise >6mm                                                                                                                      sciés longitudinalement> 6 mm


Cotton, not carded, or combed              49       64      81         68         76           64         36        ...        ...            Coton, non cardé ni peigné


Logs, non-coniferous nes                   ...      ...      ...        ...        ...          ...        ...      ...        ...                 Grumes, non-conifères


Coffee, not roasted, not
                                           ...      ...      ...        ...        ...          ...        ...      ...        ...      Café, non torréfié, non décaféiné
decaffeinated

Main Destinations                                                                                                                             Principales destinations

United States                             6.3     24.7    827.8    1 580.1    2 021.3      2 239.9    3 470.8       ...        ...                              États-Unis


China                                     1.5      2.8    222.6     191.1      260.3         84.1       41.6        ...        ...                                   Chine


United Kingdom                            0.2      0.1    203.0     153.2         0.5          1.4        1.3       ...        ...                           Royaume-Uni


Japan                                     0.1      0.0      0.1        0.0      12.2         94.9      195.8        ...        ...                                  Japon


Taiwan, China                             0.7      2.9      0.8      82.4       57.1           0.5     102.5        ...        ...                          Taiwan, Chine


                                        2002     2003     2004     2005       2006         2007       2008       2009      2010
Imports, cif                                                                                                                                        Importations, cif

Imports - Total                            ...      ...      ...        ...        ...          ...        ...      ...        ...          Importations - Total (millions)   129

                                                                                                                                                   Principaux produits
Main Products


Parts of boring or sinking machinery,                                                                                                   Pièces du forage ou de fonçage,
                                           12       31      31         41         41           48         43        ...        ...
whether or not self-propelled                                                                                                          qu'ils soient ou non autopropulsés


Wheat or meslin flour                       9       10       8          8          9           18         23        ...        ...                           Blé ou méteil


Smokg tobacco,whether o not cntg                                                                                                     Smokg tabac, si o CNTG succédanés
                                            5        3       9          9         10            0         21        ...        ...
tobacco substitutes in any proportion                                                                                                      de tabac en toute proportion

                                                                                                                                      Les véhicules automobiles à usages
Special purpose motor vehicles nes          3        1       1          0          1            1         17        ...        ...
                                                                                                                                                           spéciaux nda


Tobacco, unmanufactured, stemmed
                                            0        0       0          0          0            0         14        ...        ...     Tabac, artisanal, filtre, ou emballe
or stripped


Main Origin                                                                                                                                   Principales provenances

France                                  126.9     88.9     81.2      93.8       90.1        132.7      144.2        ...        ...                                  France

United States                           127.3     64.4     40.4      53.8       60.3         71.1       62.5        ...        ...                              États-Unis

Germany                                  22.2     12.1     22.9      13.2       34.6         48.2       44.2        ...        ...                              Allemagne

China                                     1.7      1.7      5.9      14.9       14.1         69.7       79.9        ...        ...                                  Japon

Cameroon                                 39.0     45.9     27.7      26.2       28.7           0.0        0.0       ...        ...                              Cameroun


                                                                                     African Statistical Yearbook 2011 / Annuaire Statistique pour l'Afrique 2011
Comoros                                                                                                                                                            Comores

         AREA (KM 2)                                                                                 2 235                                                             SUPERFICIE (KM 2)
         CAPITAL CITY                             Moroni                                                                                   Moroni                                  CAPITALE
         CURRENCY                                 Comoros Franc                                                                    Franc Comorien                                  MONNAIE


                                 I SOCIAL AND DEMOGRAPHIC INDICATORS — INDICATEURS DEMOGRAPHIQUES ET SOCIAUX

                                                    2002       2003       2004       2005       2006         2007       2008         2009      2010
         Population                                                                                                                                                             Population
                                                                                                                                                            Population au milieu de l'année -
         Mid-year population - Total (Million)          0.6        0.6        0.6        0.6        0.6          0.6        0.7         0.7       ...
                                                                                                                                                                               Total (million)
                                                                                                                                                            Population au milieu de l'année -
         Mid-year population - Urban (%)               36.0       27.9       28.6       29.4       30.1         30.8       31.5        32.3       ...
                                                                                                                                                                               Urbaine (%)

         Female (%)                                    51.4       50.4       50.3       50.3       50.3         50.2       50.2        50.2       ...                             Femme (%)


         Population by Age Group                                                                                                                                Population par groupe d'âge


            0-14                                    257 191    265 315    268 627    271 262    273 413      275 483    277 997     282 295       ...                                     0-14


            15-64                                    18 336    284 146    294 472    305 422    317 240      330 027    343 538     356 142       ...                                    15-64


            65+                                     296 241     26 199     26 650     27 762     29 099       30 159     30 667      30 890       ...                                     65+


         Active Population (000)                      158.6      145.6      133.1      141.0      149.3        158.1      167.4       177.4       ...                 Population active (000)

            Female (%)                                 43.3       35.6       43.4       43.3       43.3         43.5       43.6        43.6       ...                             Femme (%)

                                                                                                                                                           Taux brut de natalité - Total (par
         Crude birth rate - Total (per 1000)           33.1       35.6       33.6       33.7       33.7         33.8       33.8        33.8       ...
                                                                                                                                                                                       1000)
                                                                                                                                                         Taux brut de mortalité - Total (par
         Crude death rate - Total (per 1000)            7.7        7.9        8.4        8.1        7.8          7.6        7.4         7.2       ...
                                                                                                                                                                                      1000)
         Life expectancy at birth - Total                                                                                                                  Espérance de vie à la naissance -
                                                       62.8       65.5       64.6       65.0       65.4         65.8       66.2        66.5       ...
         (years)                                                                                                                                                             Total (années)
         Net reproduction rate - (per                                                                                                                       Taux net de reproduction - (par
                                                         ...       2.6        2.7        2.5        2.5          2.5        2.4         2.4       ...
         woman)                                                                                                                                                                     femme)
                                                                                                                                                           Indice synthétique de fécondité -
         Total fertility rate - (p woman)
                       y        (per    )               4.2        5.3        5.2        5.2        5.1          5.0        5.0         4.9       ...
                                                                                                                                                                               (par femme)

         Education                                                                                                                                                         Enseignement

         Teaching staff at first level - Total                                                                                                           Personnel enseignant - 1er degré -
                                                         ...       2.1        2.2        3.0        2.4          2.1        3.7         2.5       ...
         (thousands)                                                                                                                                                        Total (milliers)
         Teaching staff at second level - Total                                                                                                         Personnel enseignant - 2ème degré -
130                                                      ...       0.3        0.3        0.4        0.4          0.4        0.5         0.5       ...
         (thousands)                                                                                                                                                         Total (milliers)
         Teaching staff at third level - Total                                                                                                          Personnel enseignant - 3ème degré -
                                                         ...        ...        ...        ...        ...          ...        ...         ...      ...
         (thousands)                                                                                                                                                         Total (milliers)
         First level student enrollment - Total                                                                                                            Elèves inscrits - 1er degré - Total
                                                         ...       76         80         84         87           91         94          96        ...
         (thousands)                                                                                                                                                                 (milliers)
         First level student enrollment -                                                                                                               Elèves inscrits - 1er degré - Femmes
                                                        46         46         48         49          ...          ...        ...         ...      ...
         Female (thousands)                                                                                                                                                           (milliers)
         Second level student enrollment -                                                                                                               Elèves inscrits - 2ème degré - Total
                                                        34         12         13         14         16           17         19          20        ...
         Total (thousands)                                                                                                                                                          (milliers)
         Second level student enrollment -                                                                                                                     Elèves inscrits - 2ème degré -
                                                        15         17         18         18          ...          ...        ...         ...      ...
         Female (thousands)                                                                                                                                                Femmes (milliers)
         Third level student enrollment - Total                                                                                                          Elèves inscrits - 3ème degré - Total
                                                         ...       1.7        1.8         ...        ...          ...        ...         ...      ...
         (thousands)                                                                                                                                                                (milliers)
         Third level student enrollment -                                                                                                                      Elèves inscrits - 3ème degré -
                                                         ...       0.7        0.8         ...        ...          ...        ...         ...      ...
         Female (thousands)                                                                                                                                                Femmes (milliers)
         Public expenditure on education (%                                                                                                                Dépenses publiques consacrées à
                                                       18.3       15.2       15.0       15.6       17.7         13.6         ...         ...      ...
         of budget)                                                                                                                                          l'enseignement (% du budget)

         Health                                                                                                                                                                        Santé

         Hospital beds - Total (per 10 000                                                                                                                 Nombre de lits d'hôpitaux - Total
                                                         ...        ...        ...        ...        ...          ...        ...         ...      ...
         population)                                                                                                                                                          (pour 10 000)
         Nurses - Total (per 10 000                                                                                                                       Nombre d'infirmières - Total (pour
                                                         ...        ...        ...        ...        ...          ...        ...         ...      ...
         population)                                                                                                                                                                10 000)
         Physicians - Total (per 10 000                                                                                                                   Nombre de médecins - Total (pour
                                                         ...        ...        ...        ...        ...          ...        ...         ...      ...
         population)                                                                                                                                                              10 000)
         Public expenditure on Health (% of                                                                                                             Dépenses publiques consacrées à la
                                                         ...        ...        ...        ...        ...          ...        ...         ...      ...
         budget)                                                                                                                                                     santé (% du budget)


      African Statistical Yearbook 2011 / Annuaire Statistique pour l'Afrique 2011
Comoros                                                                                                                                                            Comores
                                                        II NATIONAL ACCOUNTS — COMPTES NATIONAUX

                                            2002       2003       2004       2005       2006         2007       2008       2009       2010

Gross domestic product by kind of economic activity at current prices
                                                                                            Produit intérieur brut par branche d'activité économique aux prix courants


Comoros Franc (Millions)                                                                                                                           Franc Comorien(Millions)

Agriculture                                  53 000     56 882     59 933     62 033     65 254      67 874      68 320     80 902     85 351                             Agriculture

Mining and quarrying                             ...        ...        ...        ...        ...          ...        ...        ...        ...                 Industries extractives

Manufacturing                                 5 400      5 795      6 106      6 125      6 441       6 780       6 653      7 012      7 398             Industries manufacturières

Electricity, gas & water                      2 000      2 146      2 262      2 408      2 767       2 676       2 495      2 630      2 774                  Electricité, gaz et eau

Construction                                  7 837      8 411      8 862      9 243      9 348       8 639       9 696     10 220     10 782           Bâtiments et travaux publics
Wholesale & retail trade,                                                                                                                            Commerce de gros et de détail,
                                             33 000     35 417     37 317     38 120     42 361      45 830      54 068     48 095     50 740
restaurants, hotels                                                                                                                                           restaurants et hôtels
                                                                                                                                                      Banques, assurances, affaires
Finance, insurance, real estate, etc.         5 800      6 225      6 569      6 697      6 918       6 882       7 524      7 930      8 366
                                                                                                                                                                      immobilières
Transport and communications                  6 652      7 139      7 522      7 652      7 934       8 352       8 154      8 594      9 067       Transport(s) et communications
                                                                                                                                                        Administrations publiques et
Public administration and defense            17 949     19 264     20 297     21 253     21 409      22 534      21 301     22 451     23 686
                                                                                                                                                                            défense
Other services                                 692        743        783        853        827          869        896        944        996                          Autres services
                                                                                                                                                     Moins Services d’intermédiation
Less Imputed Service Charges                - 3 350    - 3 596    - 3 788    - 3 908    - 3 996      - 4 206    - 4 346    - 4 580    - 4 832
                                                                                                                                                                           financière
Gross domestic product at factor                                                                                                                 Produit intérieur brut aux couts des
                                            128 980    138 426    145 863    150 476    159 264     166 229     174 761    184 198    194 329
cost / basic prices                                                                                                                                            facteurs / prix de base

Plus: Indirect Taxes / taxes on                                                                                                                  Plus taxes indirectes/impôts sur les
                                                 ...        ...        ...        ...        ...          ...        ...        ...        ...
products, less subsidies                                                                                                                             produits, moins les subventions


Expenditure on Gross domestic product at current purchaser's values
                                                                                                        Emploi du produit intérieur brut aux prix courants d'acquisition

Comoros Franc (Millions)                                                                                                                           Franc Comorien(Millions)
                                                                                                                                                           Consommation finale des
Government final consumption                 20 538     19 297     19 275     19 463     21 255      21 455      20 322     21 419     22 597
                                                                                                                                                           administrations publiques

Private final consumption                   106 192    121 678    136 202    147 273    157 535     169 463     177 660    187 254    197 553            Consommation finale privée

Gross fixed capital formation                13 300     13 566     14 421     15 524     18 920      16 269      21 116     22 261     23 485         Formation brute de capital fixe

Increase in inventories                       2 500      2 500      2 500      2 500      2 850       2 909       3 040      3 204      3 380                    Variation des stocks

Exports of goods and services                20 192     11 695      7 382      4 757      3 893       4 936       5 330      5 613      5 922      Exportations de biens et services
                                                                                                                                                      Moins importations de biens et
                                                                                                                                                                                         131
Less imports of goods and services           33 743     30 311     33 917     39 041     45 189      48 803      52 707     55 553     58 609
                                                                                                                                                                            services
GDP at purchasers' values                   128 980    138 426    145 863    150 476    159 264     166 229     174 761    184 198    194 329              PIB aux prix d'acquisition


Gross domestic product by kind of economic activity at constant
                                                                                           Produit intérieur brut par branche d'activité economique aux prix constants
prices
Annual Growth Rates (%)                                                                                                                   Taux de croissance annuel (%)
Agriculture                                     2.7        2.9        2.7        3.0        2.6         2.3         1.7        1.1        1.8                             Agriculture

Mining and quarrying                             ...        ...        ...        ...        ...          ...        ...        ...        ...                 Industries extractives

Manufacturing                                  -0.6        2.5        1.0        2.7        3.0         -7.4       -3.9        2.1        1.8             Industries manufacturières

Electricity, gas & water                       -3.0        2.5        5.0        1.9        2.1       -10.5        -8.1        1.2        1.8                  Electricité, gaz et eau

Construction                                   10.8        3.9        0.5        2.5        3.1         -0.8       -3.7        1.2        1.8           Bâtiments et travaux publics
Wholesale & retail trade,                                                                                                                                   Commerce de gros et de
                                                0.8        1.8        0.5        3.6        3.3         1.6         1.3        1.2        1.8
restaurants, hotels                                                                                                                                       détail,restaurants et hôtels
                                                                                                                                                       Banques, assurances, affaires
Finance, insurance, real estate, etc.           3.3        2.1        1.5        2.5        3.1         1.7         3.7        1.2        1.8
                                                                                                                                                                       immobilières
Transport and communications                    2.1        2.5        3.0        2.8        3.1         -4.6       -6.5        1.2        1.8       Transport(s) et communications
                                                                                                                                                        Administrations publiques et
Public administartion and defense               2.1       -1.0        1.2        1.0        0.6         -0.8       -1.7        1.2        1.8
                                                                                                                                                                            défense
Other services                                  2.1        0.5        1.0        0.7        1.7         -0.3       -7.0        1.5        1.8                         Autres services
                                                                                                                                                     Moins Services d’intérmediation
Less Imputed Service Charges                   12.9        8.6        1.0        1.0        0.6      -199.2         8.5     -201.2        1.8
                                                                                                                                                                           financière
Gross domestic product at factor                                                                                                                 Produit intérieur brut aux couts des
                                                2.3        2.1        1.9        2.8        2.6         5.2         0.6       -3.4        1.8
cost / basic prices                                                                                                                                            facteurs / prix de base

Plus: Indirect Taxes / taxes on                                                                                                                  Plus taxes indirectes/impôts sur les
                                                 ...        ...        ...        ...        ...          ...        ...        ...        ...
products, less subsidies                                                                                                                             produits, moins les subventions

Gross domestic product at market                                                                                                                   Produit intérieur brut aux prix du
                                                2.3        2.1        1.9        2.8        2.6         5.2         0.6       -3.4        1.8
prices                                                                                                                                                                        marché


2009: Provisional          2010:Estimated                                                                                             2009: provisoire               2010:Estimée


                                                                                              African Statistical Yearbook 2011 / Annuaire Statistique pour l'Afrique 2011
Comoros                                                                                                                                                 Comores

         Expenditure on Gross domestic product at constant purchasers'
                                                                                                     Emplois du produit intérieur brut aux prix constants d'acquisition
         values

         Annual Growth Rates (%)                                                                                                       Taux de croissance annuel (%)
                                                                                                                                                         Consommation finale des
         Government final consumption                4.1      -6.0      -3.2       -2.4      0.0      14.3       -8.9       1.2        1.8
                                                                                                                                                         administrations publiques

         Private final consumption                   2.0      8.1       6.2         8.2      3.1        4.3       6.4       -3.3       1.8             Consommation finale privée

         Gross fixed capital formation              -3.2     -22.7     14.2         3.2     15.8       -3.6       3.6       1.2        1.8         Formation brute de capital fixe

         Exports of goods and services               3.1     -30.1     -34.5      -38.1     -20.2     88.8        3.8       1.2        1.8       Exportations de biens et services

                                                                                                                                                   Moins importations de biens et
         Less imports of goods and services         -2.1     -10.1      5.4        11.6      5.6      11.9       18.7       1.2        1.8
                                                                                                                                                                         services


                                                                                   III INFLATION

                                                   2002     2003      2004       2005      2006      2007      2008      2009       2010
         Annual Growth Rates (%)                                                                                                       Taux de croissance annuel (%)
         All Item                                    3.6      3.7       4.5         2.0      4.5       4.4        4.9       -3.1       2.1                               Ensemble

         Food                                        6.8      3.3       3.2         0.8      3.9       7.0        4.9       -7.5        ...                           Alimentation

         Health                                      0.0      0.0      16.5        -3.8      0.8      -14.7       4.8      20.8         ...                                  Santé

         Energy                                       ...       ...       ...        ...       ...       ...       ...        ...       ...                                 Energie

         Transport                                  -1.7      6.7       5.2        -0.6      -1.5      4.5        4.8       7.5         ...                              Transport


                                                       IV AGRICULTURAL PRODUCTION - PRODUCTION AGRICOLE

                                                   2002     2003      2004       2005      2006      2007      2008      2009       2010
         Tons (Thousand)                                                                                                                                    Tonnes (milliers)
         Coconuts, Tons (thousands)                  61        77        77         78        77        77         ...        ...       ...         Noix de coco, tonnes (milliers)

         Cassava, Tons (thousands)                   55        56        43         44        45        45        46         47         ...               Manioc, tonnes (milliers)

         Sweet Potatoes, Tons (thousands)              4       16        16         17        17        18        18         18         ...         Patate douce, tonnes (milliers)

         Taro, Tons (thousands)                        9        ...       ...        ...       ...       ...       ...        ...       ...                  Taro, tonnes (milliers)

         Yams, Tons (thousands)                        1       11        20         20        21        21        22         22         ...                      Produit 5: igname


                                                            V MINING PRODUCTION - PRODUCTION MINIERE
132
                                                   2002     2003      2004       2005      2006      2007      2008      2009       2010


                                                      ...       ...       ...        ...       ...       ...       ...        ...       ...

                                                      ...       ...       ...        ...       ...       ...       ...        ...       ...


                                                      ...       ...       ...        ...       ...       ...       ...        ...       ...


                                                                                VI ENERGY - ENERGIE

                                                   2002     2003      2004       2005      2006      2007      2008      2009       2010

         Electricity - total hydro production,                                                                                                 Électricité - production hydraulique
                                                     2.9      3.6       3.8         3.5      3.3        3.4        ...        ...       ...
         kilowatt hours (millions)                                                                                                                totale, kilowatt-heures (millions)

         Electricity - total thermal production,                                                                                                 Électricité - production thermique
                                                    30.0     31.0      39.0        43.0     46.0      48.0         ...        ...       ...
         kilowatt hours (millions)                                                                                                                totale, kilowatt-heures (millions)

         Electricity - total production, self-                                                                                                Electricité - Production totale privée
                                                      ...       ...       ...        ...       ...       ...       ...        ...       ...
         producer (Million Kilowatt Hours)                                                                                                              (million de kilowatt heures)

         Electricity - total production, public                                                                                                      Electricité - Production totale
                                                     33        35        44         48        51        50         ...        ...       ...
         (Million Kilowatt Hours)                                                                                                             publique (million de kilowatt heures)


      African Statistical Yearbook 2011 / Annuaire Statistique pour l'Afrique 2011
Comoros                                                                                                                                                                Comores
                                         VII TOURISM AND INFRASTRUCTURE - TOURISME ET INFRASTUCTURE

                                          2002       2003        2004        2005        2006          2007       2008        2009        2010

Arrivals - Tourists (thousands)             18.7        14.2        17.6        19.5          17         14.5           ...         ...       ...           Arrivées - touristes (milliers)

Rooms in hotels and similar                                                                                                                       Chambres d'hotels et établissements
establishments (thousands)                 0.094       0.187       0.187       0.164       0.164        0.164           ...         ...       ...                  assimilés (milliers)

Paved Road (% of total)                        ...         ...         ...         ...         ...          ...         ...        77         ...        Routes asphaltées (% du total)
Total Network (Railways-km)                    ...         ...         ...         ...         ...          ...         ...       884         ...         Réseau total voies ferrées-Km
Main Telephone Lines (per 1,000                                                                                                                         Lignes téléphoniques fixes (pour
                                              18          22          17          20          23           26          29          30         ...
inhabitants)                                                                                                                                                            1000 habitants)
Mobile Cellular Subscribers (per                                                                                                                        Abonnés aux téléphones mobiles
                                                0           3         14          25          59           62          64           ...       ...
1,000 inhabitants)                                                                                                                                               (pour 1000 habitants)


                          VII FINANCIAL AND MONETARY STATISTICS - FINANCES ET STATISTIQUES MONETAIRES

                                          2002       2003        2004        2005        2006          2007       2008        2009        2010

VII-1 Monetary Statistics                                                                                                                      VII-1 Statistiques monétaires
Comoros Franc (Millions)                                                                                                                                Franc Comorien(Millions)
Money supply (M1)                         24 865      24 458      23 036      21 597      28 384       32 141      34 769      35 754     40 423                  Masse monétaire (M1)
Quasi-money                               11 426      11 082      11 476      15 351      13 184       13 400      16 024      21 817     25 986                          Quasi-monnaie
  of which Demand Deposit                      ...         ...         ...         ...         ...          ...         ...         ...       ...              dont Monnaie scripturale
Net foreign assets                        41 018      38 553      38 011      37 799      40 166       43 156      40 203      44 114     44 156                   Avoirs extérieurs nets
Domestic credit                           11 387      13 542      11 394      15 997      17 367       19 413      27 503      37 172     41 863                          Crédit intérieur

of which claims on private sector          9 980      12 067      10 255      13 381      13 449       15 282      19 460      28 048     35 266      dont créances sur le secteur privé

of which Claims on government                                                                                                                                dont créances nettes sur le
                                           1 258         450         891       1 959       2 871        2 938       5 246       7 266      4 382
sector, net                                                                                                                                                              gouvernement
International reserves (millions of US                                                                                                              Réserves internationales (millions de
                                              80          94         104          86          94          117         112         150        138
$)                                                                                                                                                                                  $ EU)
Average Exchange Rate (National                                                                                                                      Taux de change (moyen) (monnaie
                                          522.74      435.90      396.21      395.60      392.17       359.45      335.85      354.14     371.46
Currency per us $)                                                                                                                                               nationale par dollars)


VII-2 Public Finance                                                                                                                                    VII-2 Finances publiques
Comoros Franc (Millions)                                                                                                                                Franc Comorien(Millions)
Total Revenues and Grants                 26 929      25 482      26 434      30 509      29 533       32 577      41 965      44 775     56 951                Recettes totales et dons
  Tax Revenue                             18 038      19 622      19 407      17 797      17 259       16 678      18 288      21 089         ...                       Recettes fiscales
  Non Tax Revenue                          3 483       2 713       3 038       6 175       4 296        4 482       5 091       5 313         ...                  Recettes non fiscales
  Grants                                   5 408       3 147       3 989       6 537       7 978       11 417      18 586      18 374         ...                                   Dons      133
Total Expenditures and Net Lending        31 768      30 347      28 847      30 425      32 971       37 960      46 338      43 347     48 250          Dépenses totales et prêts nets

  Current expenditure                     24 172      22 769      22 546      23 523      25 393       23 896      29 855      35 971         ...                   Dépenses courantes
  Of which Wages and Salaries             10 703      11 493      12 631      12 872      13 250       15 392      15 690      16 932         ...         Dont rémunérations et salaires
  Capital expenditure                      7 597       7 578       6 301       6 902       7 578       10 663      16 484       8 939         ...               Dépenses d'équipement
  Net Lending                               - 69           ...         ...         ...         ...          ...         ...         ...       ...                              Prêts nets
Fiscal Balance                             1 441         719       - 752       1 650      - 1 652      - 5 187     - 6 628     - 6 682     8 701         Solde global y compris les dons


VII-3 Balance of Payments                                                                                                                           VII-3 Balance des paiements
Comoros Franc (Millions)                                                                                                                                Franc Comorien(Millions)
Trade balance                            - 17 397    - 15 193    - 22 729    - 30 927    - 34 288     - 40 039    - 56 009    - 54 427        ...                  Balance commerciale
Services Balance                          - 1 537     - 2 760     - 2 059     - 1 227     - 3 181      - 3 392     - 4 562     - 9 947        ...                   Balance des services
Net Income                                 1 042      - 1 282     - 1 520     - 1 367      - 663          598       - 965         - 4         ...                           Revenus nets
Current transfers, net total              16 530      11 215      18 107      22 903      29 301       31 178      38 375      45 967         ...                    Transferts courants
Current account balance                   - 1 362     - 8 020     - 8 201    - 10 618     - 8 831     - 11 655    - 23 161    - 18 411        ...              Solde du compte courant


VII-4 External Debt and Financial Flows                                                                                              VII-4 Dette extérieure et flux financiers
US $ (Millions)                                                                                                                                                      $ E.U (Millions)
Total external debt                          147         147         147         147         148           89          87          87         ...                 Dette extérieure totale
  Private                                      0           0           0           0           0            0            0           0        ...                                  Privée
  Public                                     147         147         147         147         148           89          87          87         ...                               Publique
Total external debt service                    4           4           4           4           4            4            3           3        ...          Service de la dette extérieure
Net Foreign Direct Investment                                                                                                                       Investissements étranger direct (flux
                                               0           1           1           1           1            8            8          ...       ...
Inflows                                                                                                                                                                   nets entrants)
Net Total Official Development                                                                                                                         Aide publique au développement
                                              32          24          26          23          31           44          37           ...       ...
assistance                                                                                                                                                                (nette totale)


                                                                                                 African Statistical Yearbook 2011 / Annuaire Statistique pour l'Afrique 2011
Comoros                                                                                                                                           Comores

                                           2002        2003       2004       2005        2006        2007        2008       2009      2010

         Comoros Franc (Millions)                                                                                                                       Franc Comorien
         Exports, fob                                                                                                                                 Exportations, fàb


         Exports - Total                        ...    13 082      8 243      5 691       5 221       5 929       3 063      5 618       ...             Exportations - Total


         Main Products                                                                                                                                Principaux produits


         Vanilla                            7 189       3 995      2 809      1 166         543         202         264       726        ...                           Vanille


         Nails of girofle                   2 809          29        157        146         276         220         998       766        ...                 Clous de giroffe


         Ylang-Ylang                        1 351         664        200        747          80         193           ...       ...      ...                     Ylang-Ylang


         Other products                       312           ...        ...      101          22           ...         ...       ...      ...                  Autres produits


                                                ...         ...        ...        ...         ...         ...         ...       ...      ...

         Main Destinations                                                                                                                       Principales destinations

         France                            5 161.5     7 333.9    2 801.2    2 826.7     2 541.3     3 297.4     3 572.9        ...      ...                           France


         United States                     2 828.1     1 789.8    6 572.7     589.5       627.5       202.1       326.8         ...      ...                       États-Unis


         Singapore                         1 853.3      682.9     2 451.6    1 697.6     1 070.7     1 092.6      931.4         ...      ...                       Singapour


         Germany                           3 075.2     3 212.9     681.9     1 457.5      827.8       552.7       485.9         ...      ...                       Allemagne


         Turkey                                3.1         1.0     727.1      238.3       681.8      4 576.0     2 027.1        ...      ...                          Turquie


                                           2002        2003       2004       2005        2006        2007        2008       2009      2010
         Imports, cif                                                                                                                                  Importations, cif

134      Imports - Total                        ...    30 311     33 749     38 952      45 249      49 716      60 323     74 532       ...   Importations - Total (millions)


                                                                                                                                                      Principaux produits
         Main Products


         Rice                               4 117       2 866      2 313        578       2 092       3 044       4 721      3 747       ...                              Riz


         Meat                               2 361       2 790      3 099      3 781       2 588       1 700       3 293      1 846       ...                          Viande


         Petroleum Products                 5 963       5 949        584      4 897       3 329         225         137        78        ...               Produits Petroliers


         Iron and Steel                     1 109       1 313      1 773      2 694       2 627       1 015       3 162      4 266       ...                      Fer et Acier


                                            1 175         661        811      1 360       2 899       4 293       1 627      1 983       ...


         Main Origin                                                                                                                             Principales provenances

         France                           14 529.9    14 553.7    9 693.4    9 143.8    12 566.9     9 290.7     9 684.2        ...      ...                           France

         United Arab Emirates                   ...         ...        ...   7 057.7          ...   12 525.7    10 380.7        ...      ...             Émirats arabes unis

         South Africa                      6 613.1     7 057.5    4 589.3    2 964.8     3 246.0     4 384.1     2 226.0        ...      ...                  Afrique du Sud

         Pakistan                          1 202.6      633.8     1 969.3    2 639.3     3 657.7     2 381.4     4 286.0        ...      ...                       Allemagne

         China                              398.6       302.2      512.9      723.1      2 428.2     2 766.7     8 561.9        ...      ...                            Chine


      African Statistical Yearbook 2011 / Annuaire Statistique pour l'Afrique 2011
Congo                                                                                                                                                                            Congo

AREA (KM 2)                                                                                    342 000                                                                 SUPERFICIE (KM 2)
CAPITAL CITY                             Brazzaville                                                                                 Brazzaville                                   CAPITALE
CURRENCY                                 CFA Franc                                                                                   Franc CFA                                     MONNAIE


                        I SOCIAL AND DEMOGRAPHIC INDICATORS — INDICATEURS DEMOGRAPHIQUES ET SOCIAUX

                                            2002        2003        2004        2005        2006         2007        2008        2009        2010
Population                                                                                                                                                                      Population
                                                                                                                                                            Population au milieu de l'année -
Mid-year population - Total (Million)           3.2         3.3         3.3         3.4         3.5          3.6         3.6         3.7         3.8
                                                                                                                                                                               Total (million)
                                                                                                                                                            Population au milieu de l'année -
Mid-year population - Urban (%)               59.1         59.4        59.8        60.2        60.6        60.9         61.3        61.7        62.1
                                                                                                                                                                               Urbaine (%)

Female (%)                                    50.2         50.2        50.2        50.1        50.1        50.1         50.1        50.1        50.1                              Femme (%)


Population by Age Group                                                                                                                                         Population par groupe d'âge


   0-14                                   1335 089     1360 034    1384 673    1408 088    1429 919    1450 474     1470 295    1490 214    1510 786                                      0-14


   15-64                                  1721 655     1775 121    1828 112    1877 738    1922 878    1964 977     2006 833    2052 479    2104 774                                     15-64


   65+                                     122 916      125 614     128 267     130 828     133 276     135 654      138 024     140 489     143 118                                      65+


Active Population (000)                     1 328.0     1 371.4     1 413.7     1 451.2     1 485.7      1 521.9     1 554.4     1 593.5     1 637.2                  Population active (000)

   Female (%)                                 43.1         43.2        43.3        43.3        43.4        43.4         43.5        43.7        43.8                              Femme (%)

                                                                                                                                                           Taux brut de natalité - Total (par
Crude birth rate - Total (per 1000)           37.0         37.0        36.0        35.0        36.0        35.0         34.0        35.0        35.0
                                                                                                                                                                                       1000)
                                                                                                                                                         Taux brut de mortalité - Total (par
Crude death rate - Total (per 1000)           13.0         12.0        12.0        12.0        12.0        11.0         11.0          ...       13.0
                                                                                                                                                                                      1000)
Life expectancy at birth - Total                                                                                                                           Espérance de vie à la naissance -
                                              53.0         53.0        54.0        54.0        55.0        55.0         56.0          ...       54.0
(years)                                                                                                                                                                      Total (années)
Net reproduction rate - (per                                                                                                                                Taux net de reproduction - (par
                                                 ...         ...         ...        2.0          ...          ...         ...         ...        2.0
woman)                                                                                                                                                                              femme)
                                                                                                                                                           Indice synthétique de fécondité -
Total fertility rate - (p woman)
              y        (per    )                5.0         5.0         5.0         4.0         5.0          5.0         4.0          ...        4.0
                                                                                                                                                                               (par femme)

Education                                                                                                                                                                  Enseignement

Teaching staff at first level - Total                                                                                                                    Personnel enseignant - 1er degré -
                                              8.18          7.7         7.1        11.4        11.3        10.6         10.9        10.8          ...
(thousands)                                                                                                                                                                 Total (milliers)
Teaching staff at second level - Total                                                                                                                  Personnel enseignant - 2ème degré -
                                              7.97          6.9         6.8         6.9        15.9        15.2         15.6        15.4          ...                                              135
(thousands)                                                                                                                                                                  Total (milliers)
Teaching staff at third level - Total                                                                                                                 Personnel enseignant - 3ème degré -
                                                0.7         0.7         0.6         0.6         0.6          0.5         0.6         0.5          ...
(thousands)                                                                                                                                                                Total (milliers)
First level student enrollment - Total                                                                                                                     Elèves inscrits - 1er degré - Total
                                               525         510         584         597         617          622         619         621           ...
(thousands)                                                                                                                                                                          (milliers)
First level student enrollment -                                                                                                                        Elèves inscrits - 1er degré - Femmes
                                               254         245         281         286         291          258         295         297           ...
Female (thousands)                                                                                                                                                                    (milliers)
Second level student enrollment -                                                                                                                        Elèves inscrits - 2ème degré - Total
                                               191         199         234         263         436          284         360         322           ...
Total (thousands)                                                                                                                                                                   (milliers)
Second level student enrollment -                                                                                                                              Elèves inscrits - 2ème degré -
                                                78          80         109         114         195          128         161         145           ...
Female (thousands)                                                                                                                                                         Femmes (milliers)
Third level student enrollment - Total                                                                                                                   Elèves inscrits - 3ème degré - Total
                                              12.2         12.5          ...         ...         ...          ...         ...         ...         ...
(thousands)                                                                                                                                                                         (milliers)
Third level student enrollment -                                                                                                                               Elèves inscrits - 3ème degré -
                                                1.9         2.0          ...         ...         ...          ...         ...         ...         ...
Female (thousands)                                                                                                                                                         Femmes (milliers)
Public expenditure on education (%                                                                                                                         Dépenses publiques consacrées à
                                                9.9        12.0        11.2        11.5        11.4        11.4         11.4        11.4          ...
of budget)                                                                                                                                                   l'enseignement (% du budget)

Health                                                                                                                                                                                 Santé

Hospital beds - Total (per 10 000                                                                                                                          Nombre de lits d'hôpitaux - Total
                                                62          73          86         101         119            ...         ...         ...         ...
population)                                                                                                                                                                   (pour 10 000)
Nurses - Total (per 10 000                                                                                                                                Nombre d'infirmières - Total (pour
                                                 ...         ...         ...         ...         ...          ...         ...         ...         ...
population)                                                                                                                                                                         10 000)
Physicians - Total (per 10 000                                                                                                                            Nombre de médecins - Total (pour
                                                19          20          21          22           ...          ...         ...         ...         ...
population)                                                                                                                                                                       10 000)
Public expenditure on Health (% of                                                                                                                      Dépenses publiques consacrées à la
                                                  4          4           5           6            5           ...         ...         ...         ...
budget)                                                                                                                                                              santé (% du budget)


                                                                                                   African Statistical Yearbook 2011 / Annuaire Statistique pour l'Afrique 2011
Congo                                                                                                                                                                           Congo
                                                                 II NATIONAL ACCOUNTS — COMPTES NATIONAUX

                                                   2002         2003         2004         2005         2006         2007         2008         2009       2010

         Gross domestic product by kind of economic activity at current prices
                                                                                                           Produit intérieur brut par branche d'activité économique aux prix courants


         CFA Franc (Millions)                                                                                                                                              Franc CFA (Millions)

         Agriculture                              131 800      127 500      135 300      145 800      160 100      173 900      192 300      200 000        ...                            Agriculture

         Mining and quarrying                    1 126 400    1 016 800    1 389 500    2 059 500    2 773 500    2 172 000    2 905 500    2 107 500       ...                 Industries extractives

         Manufacturing                            112 000      122 400      122 300      128 400      144 500      162 200      181 400      199 200        ...            Industries manufacturières

         Electricity, gas & water                  18 500       18 800       19 200       22 200       25 200       28 800       31 100       32 900        ...                 Electricité, gaz et eau

         Construction                              75 900       84 900       86 500       97 800      109 000      124 200      139 400      158 000        ...          Bâtiments et travaux publics
         Wholesale & retail trade,                                                                                                                                    Commerce de gros et de détail,
                                                  167 600      177 800      182 800      199 600      220 200      243 400      269 600      302 000        ...
         restaurants, hotels                                                                                                                                                   restaurants et hôtels
                                                                                                                                                                       Banques, assurances, affaires
         Finance, insurance, real estate, etc.          ...          ...          ...          ...          ...          ...          ...          ...      ...
                                                                                                                                                                                       immobilières
         Transport and communications             123 400      124 800      134 500      146 300      162 200      180 900      201 900      223 200        ...      Transport(s) et communications
                                                                                                                                                                         Administrations publiques et
         Public administration and defense        147 900      147 200      152 300      159 600      172 900      181 400      191 500      205 300        ...
                                                                                                                                                                                             défense
         Other services                           129 300      146 400      165 100      185 000      203 800      222 500      242 000      264 300        ...                        Autres services
                                                                                                                                                                      Moins Services d’intermédiation
         Less Imputed Service Charges                   ...          ...          ...          ...          ...          ...          ...          ...      ...
                                                                                                                                                                                            financière
         Gross domestic product at factor                                                                                                                         Produit intérieur brut aux couts des
                                                 2 032 800    1 966 600    2 387 500    3 144 200    3 971 400    3 489 300    4 354 700    3 692 400       ...
         cost / basic prices                                                                                                                                                    facteurs / prix de base

         Plus: Indirect Taxes / taxes on                                                                                                                          Plus taxes indirectes/impôts sur les
                                                   72 100       65 200       68 300       66 400       71 200       74 300       81 000       66 000        ...
         products, less subsidies                                                                                                                                     produits, moins les subventions


         Expenditure on Gross domestic product at current purchaser's values
                                                                                                                       Emploi du produit intérieur brut aux prix courants d'acquisition

         CFA Franc (Millions)                                                                                                                                              Franc CFA (Millions)
                                                                                                                                                                            Consommation finale des
         Government final consumption             332 400      291 400      311 500      325 300      369 600      412 800      448 100      468 900        ...
                                                                                                                                                                            administrations publiques

         Private final consumption                763 000      783 800      826 800      876 900      968 900      987 500     1 269 300    1 006 100       ...           Consommation finale privée

         Gross fixed capital formation            448 200      491 800      563 700      775 300     1 152 300    1 426 600    1 775 600    1 928 700       ...        Formation brute de capital fixe

         Increase in inventories                   18 200       12 000       13 100       12 500        8 800       20 400       12 500        9 500        ...                   Variation des stocks

         Exports of goods and services           1 556 700    1 451 500    1 829 200    2 542 200    3 207 000    2 845 700    4 086 100    3 052 700       ...     Exportations de biens et services
136
                                                                                                                                                                       Moins importations de biens et
         Less imports of goods and services      1 013 600     998 700     1 088 500    1 321 600    1 664 000    2 129 400    3 155 900    2 707 500       ...
                                                                                                                                                                                             services
         GDP at purchasers' values               2 104 900    2 031 800    2 455 800    3 210 600    4 042 600    3 563 600    4 435 700    3 758 400       ...             PIB aux prix d'acquisition


         Gross domestic product by kind of economic activity at constant
                                                                                                         Produit intérieur brut par branche d'activité economique aux prix constants
         prices
         Annual Growth Rates (%)                                                                                                                           Taux de croissance annuel (%)
         Agriculture                                   8.6          6.3          4.8          4.4          5.4          5.0          5.6         -4.6       ...                            Agriculture

         Mining and quarrying                         -1.5         -7.2          0.5         12.4          6.8        -17.2          8.9         14.4       ...                 Industries extractives

         Manufacturing                                17.0         10.0          8.5          8.4          7.4          9.3          7.0          5.5       ...            Industries manufacturières

         Electricity, gas & water                     10.4          4.4          2.4          8.8          8.6         10.4          4.1          1.3       ...                 Electricité, gaz et eau

         Construction                                 -0.6          2.9          2.9          5.6          7.4         10.3          7.6          8.7       ...          Bâtiments et travaux publics
         Wholesale & retail trade,                                                                                                                                           Commerce de gros et de
                                                      13.8          5.0          4.3          4.4          5.9          7.2          6.0          7.5       ...
         restaurants, hotels                                                                                                                                               détail,restaurants et hôtels
                                                                                                                                                                        Banques, assurances, affaires
         Finance, insurance, real estate, etc.          ...          ...          ...          ...          ...          ...          ...          ...      ...
                                                                                                                                                                                        immobilières
         Transport and communications                 18.3         10.8          7.3          6.1          6.6          8.1          6.7          6.1       ...      Transport(s) et communications
                                                                                                                                                                         Administrations publiques et
         Public administartion and defense             2.2          0.1          2.1          4.3          4.7          4.9          3.0          2.9       ...
                                                                                                                                                                                             défense
         Other services                                2.9         10.0          7.9          6.1          5.7          5.9          4.1          4.8       ...                        Autres services
                                                                                                                                                                      Moins Services d’intérmediation
         Less Imputed Service Charges                   ...          ...          ...          ...          ...          ...          ...          ...      ...
                                                                                                                                                                                            financière
         Gross domestic product at factor                                                                                                                         Produit intérieur brut aux couts des
                                                       5.0          1.1          3.6          7.9          6.3         -1.7          6.5          6.9       ...
         cost / basic prices                                                                                                                                                    facteurs / prix de base

         Plus: Indirect Taxes / taxes on                                                                                                                          Plus taxes indirectes/impôts sur les
                                                      -5.8         -6.7          5.1          0.3          4.0          1.9          4.3          3.6       ...
         products, less subsidies                                                                                                                                     produits, moins les subventions

         Gross domestic product at market                                                                                                                           Produit intérieur brut aux prix du
                                                       4.6          0.8          3.7          7.6          6.2         -1.6          6.4          6.8       ...
         prices                                                                                                                                                                                marché


      African Statistical Yearbook 2011 / Annuaire Statistique pour l'Afrique 2011
Congo                                                                                                                                                                     Congo

Expenditure on Gross domestic product at constant purchasers'
                                                                                                         Emplois du produit intérieur brut aux prix constants d'acquisition
values

Annual Growth Rates (%)                                                                                                                    Taux de croissance annuel (%)
                                                                                                                                                             Consommation finale des
Government final consumption                  21.9        -3.1         7.4         3.6         5.4         -1.0         6.3      4.6        ...
                                                                                                                                                             administrations publiques

Private final consumption                      5.1         5.6         4.6         4.1         5.1          9.1         6.5      8.5        ...            Consommation finale privée

Gross fixed capital formation                -13.3         6.3        11.3        36.2        32.3         20.9         4.7      5.2        ...        Formation brute de capital fixe

Exports of goods and services                  0.3        -5.8         0.9        11.9         2.7        -17.2        10.8     -5.8        ...      Exportations de biens et services

                                                                                                                                                       Moins importations de biens et
Less imports of goods and services             1.3        -3.0         7.0        18.9        13.9          6.9         8.5     -0.3        ...
                                                                                                                                                                             services


                                                                                  III INFLATION

                                           2002        2003        2004        2005        2006         2007        2008       2009     2010
Annual Growth Rates (%)                                                                                                                    Taux de croissance annuel (%)
All Item                                       3.0         1.7         3.7         2.5         4.7          2.6         5.9      3.8       4.8                               Ensemble

Food                                           2.4        -4.7        -4.1         3.4         6.9          5.8         5.8      5.9        ...                           Alimentation

Health                                         7.4        -2.2       11.4          8.5         4.8         -3.4         0.0     -6.4        ...                                  Santé

Energy                                         0.1         0.7       12.1          2.1         9.1          7.3         3.6      0.6        ...                                 Energie

Transport                                      8.4       11.0          7.5        -1.2        -2.5         -3.4         6.0      4.3        ...                              Transport


                                                 IV AGRICULTURAL PRODUCTION - PRODUCTION AGRICOLE

                                           2002        2003        2004        2005        2006         2007        2008       2009     2010
Tons (Thousand)                                                                                                                                                 Tonnes (milliers)
                                                                                                                                                         Tubercule de manioc, tonnes
Cassava, Tons (thousands)                     787         878         932       1 007       1 072        1 140       1 106     1 123        ...
                                                                                                                                                                           (milliers)
Plantain, tons (thousands)                     66          70          74          75          75           77          76       76         ...      Banane plantain, tonnes (milliers)

Mango, Tons (thousands)                        26          30          30          32          34           36          35       36         ...              Mangue, tonnes (milliers)
Groundnuts in shells, Tons                                                                                                                              Arachides (en coques), tonnes
                                               21          22          22          23          23           24          24       24         ...
(thousands)                                                                                                                                                                 (milliers)
Yams, Tons (thousands)                         10          11          11          12          12           13          12       12         ...             Ignames, tonnes (milliers)


                                                        V MINING PRODUCTION - PRODUCTION MINIERE
                                                                                                                                                                                           137
                                           2002        2003        2004        2005        2006         2007        2008       2009     2010

Crude petroleum, metric tons                                                                                                                            Pétrole brut, tonnes métriques
                                          11 674.0    10 705.0    11 209.0    12 268.0    13 899.0     11 374.0    11 000.0       ...       ...
(thousands)                                                                                                                                                                   (milliers)
Natural gas (terajoules)                        ...     650.0       769.0       890.0       923.0        824.0           ...      ...       ...                Gaz naturel (térajoules)

Gold ores and concentrates                                                                                                                                 Minerais d'or et concentrés
                                              10.0        75.0      160.0       120.0       100.0            ...        1.2      0.8        ...
(Kilograms)                                                                                                                                                             (Kilogrammes)


                                                                              VI ENERGY - ENERGIE

                                           2002        2003        2004        2005        2006         2007        2008       2009     2010

Electricity - total hydro production,                                                                                                              Électricité - production hydraulique
                                            761.8       747.6       801.2       851.3       864.1        855.5       863.7     955.3        ...
kilowatt hours (millions)                                                                                                                             totale, kilowatt-heures (millions)

Electricity - total thermal production,                                                                                                              Électricité - production thermique
                                              10.0         9.2         9.2         9.1         9.1          9.2         9.0      8.1        ...
kilowatt hours (millions)                                                                                                                             totale, kilowatt-heures (millions)

Electricity - total production, self-                                                                                                             Electricité - Production totale privée
                                                ...         ...         ...         ...         ...          ...         ...      ...       ...
producer (Million Kilowatt Hours)                                                                                                                           (million de kilowatt heures)

Electricity - total production, public                                                                                                                   Electricité - Production totale
                                              397         760         840         915         935          842         967     1 947        ...
(Million Kilowatt Hours)                                                                                                                          publique (million de kilowatt heures)


                                                                                                  African Statistical Yearbook 2011 / Annuaire Statistique pour l'Afrique 2011
Congo                                                                                                                                                                                      Congo
                                                  VII TOURISM AND INFRASTRUCTURE - TOURISME ET INFRASTUCTURE

                                                    2002         2003         2004         2005          2006          2007          2008          2009          2010

         Arrivals - Tourists (thousands)                20           23           31           35            63            56            54             ...           ...           Arrivées - touristes (milliers)

         Rooms in hotels and similar                                                                                                                                      Chambres d'hotels et établissements
         establishments (thousands)                     3.2          3.5           4           4.6            5            5.2           6.5             7            ...                  assimilés (milliers)

         Paved Road (% of total)                          6           6            6            6             6             6             6              6            ...        Routes asphaltées (% du total)
         Total Network (Railways-km)                17 795       17 795       11 795       17 795        17 795        17 795        17 795        17 795             ...         Réseau total voies ferrées-Km
         Main Telephone Lines (per 1,000                                                                                                                                        Lignes téléphoniques fixes (pour
                                                          7           2            4            5             5             6             6             ...           ...
         inhabitants)                                                                                                                                                                           1000 habitants)
         Mobile Cellular Subscribers (per                                                                                                                                       Abonnés aux téléphones mobiles
                                                        70          101          115          163           263           363           500             ...           ...
         1,000 inhabitants)                                                                                                                                                              (pour 1000 habitants)


                                   VII FINANCIAL AND MONETARY STATISTICS - FINANCES ET STATISTIQUES MONETAIRES

                                                    2002         2003         2004         2005          2006          2007          2008          2009          2010

         VII-1 Monetary Statistics                                                                                                                                     VII-1 Statistiques monétaires
         CFA Franc (Millions)                                                                                                                                                         Franc CFA (Millions)
         Money supply (M1)                         271 235      235 148      278 789      396 194       584 613       623 647       853 396       891 172     1 075 220                   Masse monétaire (M1)
         Quasi-money                                20 458       49 443       55 446       62 036        82 889        91 015       126 499       137 412       152 048                           Quasi-monnaie
           of which Demand Deposit                       ...          ...          ...          ...           ...           ...           ...           ...           ...              dont Monnaie scripturale
         Net foreign assets                         29 776       - 1 510      51 007      452 840     1 035 290     1 102 660     1 870 720     1 823 930     2 166 360                    Avoirs extérieurs nets
         Domestic credit                           239 751      265 464      274 217       40 568      - 359 599     - 369 788     - 890 277     - 719 269     - 911 358                          Crédit intérieur

         of which claims on private sector          60 624       75 055       73 022       77 121        84 093        91 045       166 910       217 596       270 777       dont créances sur le secteur privé

         of which Claims on government                                                                                                                                               dont créances nettes sur le
                                                   173 340      183 726      189 170      - 45 567     - 456 103     - 483 901    -1 079 840     - 962 017    -1 197 950
         sector, net                                                                                                                                                                             gouvernement
         International reserves (millions of US                                                                                                                             Réserves internationales (millions de
                                                        32           35          120          732         1 841         2 174         3 872         3 806         4 288
         $)                                                                                                                                                                                                 $ EU)
         Average Exchange Rate (National                                                                                                                                     Taux de change (moyen) (monnaie
                                                    696.99       581.20       528.29       527.47        522.89        479.27        447.81        472.19        495.28
         Currency per us $)                                                                                                                                                              nationale par dollars)


         VII-2 Public Finance                                                                                                                                                   VII-2 Finances publiques
         CFA Franc (Millions)                                                                                                                                                         Franc CFA (Millions)
         Total Revenues and Grants                 575 400      613 500      745 800     1 245 700    1 796 000     1 578 900     2 497 000     1 333 700     2 759 000                 Recettes totales et dons
           Tax Revenue                             558 900      598 900      729 100     1 234 700    1 767 200     1 548 500     2 431 000     1 287 000     2 693 000                         Recettes fiscales
           Non Tax Revenue                          12 800        4 700        8 800        5 100        23 800        15 200        31 000        32 200        33 000                    Recettes non fiscales
138        Grants                                    3 700        9 900        7 900        5 900         5 000        15 200        35 000        14 500        33 000                                     Dons

         Total Expenditures and Net Lending        746 400      604 700      656 300      745 400     1 105 700     1 171 400     1 256 000     1 111 900     1 151 955           Dépenses totales et prêts nets

           Current expenditure                     281 500      221 900      244 600      275 400       342 800       380 700       407 000       387 500       436 000                     Dépenses courantes
           Of which Wages and Salaries             120 400      120 200      122 900      130 000       134 900       141 900       166 000       174 400       190 000           Dont rémunérations et salaires
           Capital expenditure                     181 700      134 800      160 700      170 200       359 300       387 800       471 000       484 100       544 348                 Dépenses d'équipement
           Net Lending                               1 600          800            0            0         4 500             0             0         1 000              0                               Prêts nets
         Fiscal Balance                           - 171 000       8 800       89 500      500 300       690 300       407 500     1 241 000       221 800     1 607 045          Solde global y compris les dons


         VII-3 Balance of Payments                                                                                                                                          VII-3 Balance des paiements
         CFA Franc (Millions)                                                                                                                                                         Franc CFA (Millions)
         Trade balance                            1 008 427    1 049 250    1 301 905    1 817 204    2 125 343     1 487 250     2 360 647     1 497 951     2 910 201                    Balance commerciale
         Services Balance                         - 397 169    - 394 617    - 433 301    - 630 921    -1 130 721    -1 316 016    -1 432 314    -1 338 900    -2 015 810                    Balance des services
         Net Income                               - 463 991    - 340 742    - 501 150    - 832 231     - 915 865     - 834 802     - 959 244     - 796 815    -1 176 846                            Revenus nets
         Current transfers, net total              - 15 143     - 10 917     - 11 382      16 052       - 13 380      - 18 087      - 20 987      - 20 987      - 20 987                     Transferts courants
         Current account balance                   132 124      302 975      356 071      370 104        65 377      - 681 655      - 51 897     - 658 752     - 303 442               Solde du compte courant


         VII-4 External Debt and Financial Flows                                                                                                         VII-4 Dette extérieure et flux financiers
         US $ (Millions)                                                                                                                                                                     $ E.U (Millions)
         Total external debt                         6 067        7 781        9 973        6 283         6 644         7 401         5 648         5 049         1 807                   Dette extérieure totale
           Private                                   1 162        1 611        1 758        1 644         1 832           558           454           486           978                                    Privée
           Public                                    4 905        6 169        8 215        4 639         4 812         6 842         5 194         4 564           829                                 Publique
         Total external debt service                   231          158          223          608           564           389           218           143           901            Service de la dette extérieure
         Net Foreign Direct Investment                                                                                                                                      Investissements étranger direct (flux
                                                       131          321          513        1 475         1 925         2 275         2 483         2 083             ...
         Inflows                                                                                                                                                                                  nets entrants)
         Net Total Official Development                                                                                                                                        Aide publique au développement
                                                        58           69          115        1 425           258           119           485           283             ...
         assistance                                                                                                                                                                               (nette totale)


      African Statistical Yearbook 2011 / Annuaire Statistique pour l'Afrique 2011
Congo                                                                                                                                               Congo

                           2002        2003        2004        2005        2006        2007        2008        2009       2010

CFA Franc (Millions)                                                                                                                                Franc CFA
Exports, fob                                                                                                                              Exportations, fàb


Exports - Total          1 479 200   1 592 400   1 813 700   2 503 000   3 412 500   2 744 500   3 628 300   2 898 800       ...             Exportations - Total


Main Products                                                                                                                             Principaux produits


Crude oil                1 363 801   1 206 642   1 604 245   2 304 094   2 901 774   2 548 936   3 320 876   2 620 811       ...                     Pétrole brut


Wood                      111 447     121 224     132 296     115 820     104 910     103 002      79 630      84 122        ...                             Bois


Sugar                       8 876       6 064      11 477      17 401      11 538       8 098       9 014       3 933        ...                            Sucre


Cocoa                         193         101          11          25          82          92          73          82        ...                           Cacao


Fish and Shrimp               863         592          47         276       1 833       1 578          16           ...      ...           Poissons et Crevettes

Main Destinations                                                                                                                    Principales destinations

France                   108 087.0    41 062.0    49 194.0   100 581.0    75 977.0    74 784.0   193 601.0   115 962.0       ...                          France


USA                      162 358.0   136 111.0   102 533.0   205 789.0   180 304.0   725 752.0   319 602.0   106 923.0       ...                       Etats-Unis


Italy                     26 195.0    25 292.0    13 103.0    76 116.0    96 030.0    44 253.0    83 483.0     9 786.0       ...                            Italie


Netherlands               24 131.0     5 009.0    43 535.0     1 916.0   105 578.0     5 549.0    42 314.0    30 600.0       ...                        Pays Bas


Belgium                    8 693.0     1 980.0     2 742.0      321.0      3 280.0     4 077.0     2 085.0      435.0        ...                         Belgique


                           2002        2003        2004        2005        2006        2007        2008        2009       2010
Imports, cif                                                                                                                               Importations, cif

Imports - Total           326 547     361 496     441 371     480 404     616 660     806 649     998 975     787 692        ...   Importations - Total (millions)   139

                                                                                                                                          Principaux produits
Main Products


Meat and offal             17 484      20 940      16 150      16 938      11 710      16 644      25 395       5 111        ...                Viandes et Abats


Mechanical Machinery       79 471      58 054      56 545       3 094     126 746     134 847      94 045      56 295        ...             Machine mécanique


Book in Box                27 523      27 574      25 115      41 498      48 491     121 608      69 467       7 079        ...               Ouvrage en Boite


Electrical Machinery       34 800      30 602      28 587      77 455      52 503      58 555      56 109      20 849        ...       Machine et app électrique


Cars and automobile        22 642      24 053      25 542      26 986      30 396      50 962      46 198      11 060        ...          Voitures et automobile


Main Origin                                                                                                                          Principales provenances

France                   115 473.0   113 580.0    98 666.0   164 469.0   191 005.0   269 117.0   168 468.0    47 287.0       ...                          France

USA                       50 349.0    42 341.0    40 098.0    26 707.0    37 004.0    45 486.0    38 843.0    22 023.0       ...                       Etats-Unis

Hungary                     142.0       213.0       148.0         20.0      252.0         13.0      387.0           ...      ...                         Hongrie

Netherlands               20 149.0    14 861.0    10 813.0    20 710.0    19 982.0    40 528.0    73 958.0     6 147.0       ...                        Pays Bas

Belgium and Luxembourg    22 087.0    17 709.0     9 964.0    14 668.0    73 534.0   114 642.0      122.0     16 208.0       ...        Belgique et Luxembourg


                                                                                 African Statistical Yearbook 2011 / Annuaire Statistique pour l'Afrique 2011
Congo, Dem. Republic                                                                                                                   Rép. Démocratique du Congo

         AREA (KM 2)                                                                                       2 345 409                                                               SUPERFICIE (KM 2)
         CAPITAL CITY                             Kinshasa                                                                                           Kinshasa                                  CAPITALE
         CURRENCY                                 Congolese Franc                                                                             Franc Congolais                                  MONNAIE


                                 I SOCIAL AND DEMOGRAPHIC INDICATORS — INDICATEURS DEMOGRAPHIQUES ET SOCIAUX

                                                     2002         2003         2004         2005         2006         2007         2008         2009       2010
         Population                                                                                                                                                                         Population
                                                                                                                                                                        Population au milieu de l'année -
         Mid-year population - Total (Million)          55.7         57.6         59.6         61.6         63.7         65.8         68.1         70.4       ...
                                                                                                                                                                                           Total (million)
                                                                                                                                                                        Population au milieu de l'année -
         Mid-year population - Urban (%)                  ...          ...        60.0         60.0         61.0         30.0         61.0         34.6       ...
                                                                                                                                                                                           Urbaine (%)

         Female (%)                                     50.5         50.5         50.5         50.5         50.5         51.0         50.5         50.4       ...                             Femme (%)


         Population by Age Group                                                                                                                                            Population par groupe d'âge


            0-14                                  26802 000     27713 000    28655 000    29629 000    30637 000    31679 000    32755 000    33869 000       ...                                     0-14


            15-64                                 27397 000     28329 000    29292 000    30287 000    31318 000    32381 000    33484 000    35769 000       ...                                    15-64


            65+                                    1503 000      1554 000     1607 000     1663 000     1718 000     1777 000     1837 000     1900 000       ...                                     65+


         Active Population (000)                    20 390.0     21 033.0     21 712.0     22 381.0     23 028.0     23 584.0     24 206.0     24 838.0       ...                 Population active (000)

            Female (%)                                  38.7         38.7         38.8         38.9         39.0         51.9         38.6         38.5       ...                             Femme (%)

                                                                                                                                                                       Taux brut de natalité - Total (par
         Crude birth rate - Total (per 1000)            48.5         48.0         47.4         46.8         46.1         44.1         44.9         44.3       ...
                                                                                                                                                                                                   1000)
                                                                                                                                                                     Taux brut de mortalité - Total (par
         Crude death rate - Total (per 1000)            17.9         17.6         17.4         17.3         17.2         16.1         17.0         16.8       ...
                                                                                                                                                                                                  1000)
         Life expectancy at birth - Total                                                                                                                              Espérance de vie à la naissance -
                                                        47.1         47.4         47.6         47.6         47.6         46.0         47.7         47.8       ...
         (years)                                                                                                                                                                         Total (années)
         Net reproduction rate - (per                                                                                                                                   Taux net de reproduction - (par
                                                          ...          ...          ...         2.3           ...          ...          ...          ...      ...
         woman)                                                                                                                                                                                 femme)
                                                                                                                                                                       Indice synthétique de fécondité -
         Total fertility rate - (p woman)
                       y        (per    )                6.7          6.6          6.5          6.4          6.3          6.3          6.0          5.9       ...
                                                                                                                                                                                           (par femme)

         Education                                                                                                                                                                     Enseignement

         Teaching staff at first level - Total                                                                                                                       Personnel enseignant - 1er degré -
                                                          ...          ...          ...          ...          ...       231.0        256.0           ...      ...
         (thousands)                                                                                                                                                                    Total (milliers)
         Teaching staff at second level - Total                                                                                                                     Personnel enseignant - 2ème degré -
                                                          ...          ...          ...          ...          ...       180.0        189.0           ...      ...
140      (thousands)                                                                                                                                                                     Total (milliers)
         Teaching staff at third level - Total                                                                                                                      Personnel enseignant - 3ème degré -
                                                          ...          ...          ...          ...          ...        17.0         20.0           ...      ...
         (thousands)                                                                                                                                                                     Total (milliers)
         First level student enrollment - Total                                                                                                                        Elèves inscrits - 1er degré - Total
                                                          ...          ...          ...          ...          ...       8 840        9 973           ...      ...
         (thousands)                                                                                                                                                                             (milliers)
         First level student enrollment -                                                                                                                           Elèves inscrits - 1er degré - Femmes
                                                      2 393            ...          ...          ...          ...       3 956        4 534           ...      ...
         Female (thousands)                                                                                                                                                                       (milliers)
         Second level student enrollment -                                                                                                                           Elèves inscrits - 2ème degré - Total
                                                      1 613            ...          ...          ...          ...       2 815        3 114           ...      ...
         Total (thousands)                                                                                                                                                                      (milliers)
         Second level student enrollment -                                                                                                                                 Elèves inscrits - 2ème degré -
                                                        591            ...          ...          ...          ...        980         1 107           ...      ...
         Female (thousands)                                                                                                                                                            Femmes (milliers)
         Third level student enrollment - Total                                                                                                                      Elèves inscrits - 3ème degré - Total
                                                          ...          ...          ...          ...          ...       237.8        306.4           ...      ...
         (thousands)                                                                                                                                                                            (milliers)
         Third level student enrollment -                                                                                                                                  Elèves inscrits - 3ème degré -
                                                          ...          ...          ...          ...          ...        61.5           ...          ...      ...
         Female (thousands)                                                                                                                                                            Femmes (milliers)
         Public expenditure on education (%                                                                                                                            Dépenses publiques consacrées à
                                                          ...          ...          ...          ...          ...          ...          ...          ...      ...
         of budget)                                                                                                                                                      l'enseignement (% du budget)

         Health                                                                                                                                                                                    Santé

         Hospital beds - Total (per 10 000                                                                                                                             Nombre de lits d'hôpitaux - Total
                                                          ...          ...         10            ...          ...          ...          ...          ...      ...
         population)                                                                                                                                                                      (pour 10 000)
         Nurses - Total (per 10 000                                                                                                                                   Nombre d'infirmières - Total (pour
                                                          ...          ...         51            ...          ...          ...          ...          ...      ...
         population)                                                                                                                                                                            10 000)
         Physicians - Total (per 10 000                                                                                                                               Nombre de médecins - Total (pour
                                                          ...          ...         10            ...           6           ...          ...          ...      ...
         population)                                                                                                                                                                          10 000)
         Public expenditure on Health (% of                                                                                                                         Dépenses publiques consacrées à la
                                                           1            6            5            6            6           ...          ...          ...      ...
         budget)                                                                                                                                                                 santé (% du budget)


      African Statistical Yearbook 2011 / Annuaire Statistique pour l'Afrique 2011
Congo, Dem. Republic                                                                                                                 Rép. Démocratique du Congo
                                                        II NATIONAL ACCOUNTS — COMPTES NATIONAUX

                                          2002         2003         2004         2005         2006         2007         2008         2009       2010

Gross domestic product by kind of economic activity at current prices
                                                                                                  Produit intérieur brut par branche d'activité économique aux prix courants


Congolese Franc (Millions)                                                                                                                                 Franc Congolais(Millions)

Agriculture                              962 100     1 150 600    1 226 900    1 223 565    1 435 395    1 684 031    1 918 669    2 125 509       ...                            Agriculture

Mining and quarrying                     166 100      198 700      262 400      431 187      362 609      483 748      555 171      462 171        ...                 Industries extractives

Manufacturing                            102 300      122 300      135 400     1 094 591    1 272 111    1 653 744    2 149 868    2 794 828       ...            Industries manufacturières

Electricity, gas & water                  58 900       70 400       85 100       60 921       84 129       84 627       88 518       96 138        ...                 Electricité, gaz et eau

Construction                              78 300       93 600      110 000      215 940      293 453      417 419      406 814      481 763        ...          Bâtiments et travaux publics
Wholesale & retail trade,                296 900      355 100      404 200      883 661     1 072 755    1 457 338    1 979 793    2 689 549       ...       Commerce de gros et de détail,
restaurants, hotels                                                                                                                                                   restaurants et hôtels
                                                                                                                                                              Banques, assurances, affaires
Finance, insurance, real estate, etc.    124 400       95 800      110 100            ...          ...          ...          ...          ...      ...
                                                                                                                                                                              immobilières
Transport and communications              70 700       84 600       97 800      783 874      943 633     1 253 145    1 664 176    2 210 026       ...      Transport(s) et communications
                                                                                                                                                                Administrations publiques et
Public administration and defense         21 700       26 000       44 600      253 186      394 024      544 042      817 329      989 759        ...
                                                                                                                                                                                    défense
Other services                             4 900       58 700       58 600      540 363      602 173      464 265      513 507      978 244        ...                        Autres services
                                                                                                                                                             Moins Services d’intermédiation
Less Imputed Service Charges                   ...          ...          ...    - 20 405     - 34 526     - 28 585     - 30 082     - 31 229       ...
                                                                                                                                                                                   financière
Gross domestic product at factor                                                                                                                         Produit intérieur brut aux couts des
                                        1 886 300    2 255 800    2 535 100    5 466 883    6 425 756    8 013 774 10 063 763 12 796 758           ...
cost / basic prices                                                                                                                                                    facteurs / prix de base

Plus: Indirect Taxes / taxes on                                                                                                                          Plus taxes indirectes/impôts sur les
                                          35 900       42 856       74 615      203 182      268 995      362 370      557 423      557 746        ...
products, less subsidies                                                                                                                                     produits, moins les subventions


Expenditure on Gross domestic product at current purchaser's values
                                                                                                              Emploi du produit intérieur brut aux prix courants d'acquisition

Congolese Franc (Millions)                                                                                                                                 Franc Congolais(Millions)
                                                                                                                                                                   Consommation finale des
Government final consumption             128 715      147 003      257 045      393 538      631 909      658 251      758 021      846 376        ...
                                                                                                                                                                   administrations publiques

Private final consumption               1 640 923    2 020 399    2 007 956    4 786 965    5 472 234    7 138 698    7 304 458    7 886 904       ...           Consommation finale privée

Gross fixed capital formation            116 319      306 179      499 480      662 043      987 034     1 968 587    3 169 471    4 289 643       ...        Formation brute de capital fixe

Increase in inventories                      120        2 961        4 726        5 885        4 160        5 039        5 302        6 342        ...                   Variation des stocks

Exports of goods and services            311 533      718 954      934 993     1 157 523    1 294 769    1 982 307    3 657 966    4 601 750       ...     Exportations de biens et services
                                                                                                                                                              Moins importations de biens et     141
Less imports of goods and services       275 410      896 840     1 094 485    1 335 889    1 695 355    3 376 738    4 274 032    4 276 511       ...
                                                                                                                                                                                    services
GDP at purchasers' values               1 922 200    2 298 656    2 609 715    5 670 065    6 694 751    8 376 144 10 621 186 13 354 504           ...             PIB aux prix d'acquisition


Gross domestic product by kind of economic activity at constant
                                                                                                Produit intérieur brut par branche d'activité economique aux prix constants
prices
Annual Growth Rates (%)                                                                                                                           Taux de croissance annuel (%)
Agriculture                                  -1.0          1.2          2.2          2.3          5.6          3.3          3.2          3.0       ...                            Agriculture

Mining and quarrying                          9.8         13.3          1.8          4.6        -10.7          2.5         11.4         -0.2       ...                 Industries extractives

Manufacturing                                 7.2         -3.9          4.9         20.3          8.2          4.4          3.4          2.5       ...            Industries manufacturières

Electricity, gas & water                      1.4          7.7         14.3         12.5          5.9         -1.1         -0.6          2.3       ...                 Electricité, gaz et eau

Construction                                 11.4         24.2         25.9         24.0          9.8         10.5         -1.6          1.8       ...          Bâtiments et travaux publics
Wholesale & retail trade,                                                                                                                                           Commerce de gros et de
                                              2.9          2.4         13.6          6.1          8.8          3.5          9.7         11.1       ...
restaurants, hotels                                                                                                                                               détail,restaurants et hôtels
                                                                                                                                                               Banques, assurances, affaires
Finance, insurance, real estate, etc.          ...          ...          ...          ...          ...          ...          ...          ...      ...
                                                                                                                                                                               immobilières
Transport and communications                 21.5         27.4          8.9          5.2          7.3          3.5          9.7         11.1       ...      Transport(s) et communications
                                                                                                                                                                Administrations publiques et
Public administartion and defense             2.7         12.5         19.0         12.0         -4.8         10.8          4.2        -26.6       ...
                                                                                                                                                                                    défense
Other services                                5.9          6.3          8.1          4.0          1.8         29.1          6.2         -5.9       ...                        Autres services
                                                                                                                                                             Moins Services d’intérmediation
Less Imputed Service Charges               -428.6        -44.4       260.0           0.0          5.6          6.3          6.2          2.8       ...
                                                                                                                                                                                   financière
Gross domestic product at factor                                                                                                                         Produit intérieur brut aux couts des
                                              5.3          6.2          7.2          8.3          4.9          6.5          5.9          2.9       ...
cost / basic prices                                                                                                                                                    facteurs / prix de base

Plus: Indirect Taxes / taxes on                                                                                                                          Plus taxes indirectes/impôts sur les
                                             16.7          5.0         19.0          6.7         16.0          0.4         14.2          0.9       ...
products, less subsidies                                                                                                                                     produits, moins les subventions

Gross domestic product at market                                                                                                                           Produit intérieur brut aux prix du
                                              3.5          5.4          7.3          6.1          5.3          6.3          6.2          2.8       ...
prices                                                                                                                                                                                marché


2009: Provisional                                                                                                                                                         2009: provisoire


                                                                                                    African Statistical Yearbook 2011 / Annuaire Statistique pour l'Afrique 2011
Congo, Dem. Republic                                                                                                           Rép. Démocratique du Congo

         Expenditure on Gross domestic product at constant purchasers'
                                                                                                                Emplois du produit intérieur brut aux prix constants d'acquisition
         values

         Annual Growth Rates (%)                                                                                                                     Taux de croissance annuel (%)
                                                                                                                                                                       Consommation finale des
         Government final consumption                  67.7       -11.3        54.2        25.7        18.1       13.5         6.9          3.7       ...
                                                                                                                                                                       administrations publiques

         Private final consumption                     -9.4        22.7         5.2         2.7         4.0        4.6         5.5          2.5       ...            Consommation finale privée

         Gross fixed capital formation                 51.7         3.9        -5.8        18.8        25.6       11.8         6.4          2.1       ...        Formation brute de capital fixe

         Exports of goods and services                 87.5        15.4         3.3         2.3         1.9       15.8         7.6          3.3       ...      Exportations de biens et services

                                                                                                                                                                 Moins importations de biens et
         Less imports of goods and services            44.9      111.5         -1.5         0.9        11.2       13.5         5.6          2.1       ...
                                                                                                                                                                                       services


                                                                                           III INFLATION

                                                    2002        2003        2004        2005        2006       2007        2008         2009       2010
         Annual Growth Rates (%)                                                                                                                     Taux de croissance annuel (%)
         All Item                                     16.9        13.8        11.0        15.9        21.4       22.3         44.7         34.8     17.2                               Ensemble

         Food                                            ...         ...         ...         ...      23.8       22.8         53.4         30.3     20.1                            Alimentation

         Health                                          ...         ...         ...         ...      37.7       15.0         19.4          7.5     11.8                                   Santé

         Energy                                          ...         ...         ...         ...      26.8       11.5         79.1         20.2     21.4                                  Energie

         Transport                                       ...         ...         ...         ...        4.2      62.6         -3.9         53.6     12.5                               Transport


                                                          IV AGRICULTURAL PRODUCTION - PRODUCTION AGRICOLE

                                                    2002        2003        2004        2005        2006       2007        2008         2009       2010
         Tons (Thousand)                                                                                                                                                  Tonnes (milliers)
         Cassava, Tons (thousands)                  14 930      14 945      14 951      14 974      14 989     15 004           ...          ...      ...               Manioc, tonnes (milliers)

         Maize, Tons (thousands)                     1 155       1 155       1 155       1 155       1 155      1 157           ...          ...      ...                  Maïs, tonnes (milliers)

         Banana, Tons (thousands)                      486         586         486         487         488        489           ...          ...      ...      Banane plantain, tonnes (milliers)
         Groundnuts, in shells, Tons                                                                                                                                Arachides en coques, tonnes
                                                       355         360         364         368         369        369           ...          ...      ...
         (thousands)                                                                                                                                                                  (milliers)
         Rice, Tons (thousands)                        314         315         315         315         316        316           ...          ...      ...                   Riz, tonnes (milliers)


                                                                 V MINING PRODUCTION - PRODUCTION MINIERE
142
                                                    2002        2003        2004        2005        2006       2007        2008         2009       2010


         Copper, Tons (thousands)                  27 359.0    16 359.0    19 019.0    26 389.0    97 360.0   96 391.0   335 066.0    120 976.0       ...                Cuivre, tonnes (milliers)

         Diamond, carats (thousands)               22 503.0    26 981.0    29 503.0    32 599.0    28 949.0   28 270.0    20 947.0      7 803.0       ...              Diamants, carat (milliers)


         Cobalt, Tons (thousands)                  11 865.0     7 929.0    10 246.0     8 234.0    15 324.0   17 886.0    42 461.0     22 538.0       ...            Cobalt, tonnes (thousands)


                                                                                       VI ENERGY - ENERGIE

                                                    2002        2003        2004        2005        2006       2007        2008         2009       2010

         Electricity - total hydro production,                                                                                                               Électricité - production hydraulique
                                                    5 937.0     5 980.0     6 922.0     7 128.0     7 629.0    7 543.0     7 495.0      3 163.0       ...
         kilowatt hours (millions)                                                                                                                              totale, kilowatt-heures (millions)

         Electricity - total thermal production,                                                                                                               Électricité - production thermique
                                                       20.0        21.0        22.0        23.0        24.0       26.0          ...          ...      ...
         kilowatt hours (millions)                                                                                                                              totale, kilowatt-heures (millions)

         Electricity - total production, self-                                                                                                              Electricité - Production totale privée
                                                       110         193         212         225         239        252           ...          ...      ...
         producer (Million Kilowatt Hours)                                                                                                                            (million de kilowatt heures)

         Electricity - total production, public                                                                                                                    Electricité - Production totale
                                                     5 888       6 065       6 640       7 194       7 647      8 050           ...          ...      ...
         (Million Kilowatt Hours)                                                                                                                           publique (million de kilowatt heures)


      African Statistical Yearbook 2011 / Annuaire Statistique pour l'Afrique 2011
Congo, Dem. Republic                                                                                                                      Rép. Démocratique du Congo
                                         VII TOURISM AND INFRASTRUCTURE - TOURISME ET INFRASTUCTURE

                                           2002         2003         2004         2005         2006             2007         2008         2009         2010

Arrivals - Tourists (thousands)                28           35           36           61           55               47            ...          ...          ...           Arrivées - touristes (milliers)

Rooms in hotels and similar                                                                                                                                     Chambres d'hotels et établissements
establishments (thousands)                      6            6            ...          ...          ...              ...          ...          ...          ...                  assimilés (milliers)

Paved Road (% of total)                         ...          ...           2           ...          ...              ...          ...          ...          ...        Routes asphaltées (% du total)
Total Network (Railways-km)                     ...          ...      4 499        3 641        3 641            3 641            ...          ...          ...         Réseau total voies ferrées-Km
Main Telephone Lines (per 1,000                                                                                                                                       Lignes téléphoniques fixes (pour
                                                 0           0             0            0            0                0            1           ...          ...
inhabitants)                                                                                                                                                                          1000 habitants)
Mobile Cellular Subscribers (per                                                                                                                                      Abonnés aux téléphones mobiles
                                               10           22           35           46           73              105          144            ...          ...
1,000 inhabitants)                                                                                                                                                             (pour 1000 habitants)


                          VII FINANCIAL AND MONETARY STATISTICS - FINANCES ET STATISTIQUES MONETAIRES

                                           2002         2003         2004         2005         2006             2007         2008         2009         2010

VII-1 Monetary Statistics                                                                                                                                    VII-1 Statistiques monétaires
Congolese Franc (Millions)                                                                                                                                           Franc Congolais(Millions)
Money supply (M1)                          57 157       72 110      117 078      138 893      211 983          300 273      392 484      479 875      573 760                   Masse monétaire (M1)
Quasi-money                                36 196       52 393       98 192      128 399      213 516          340 964      605 961     1 021 990    1 258 200                          Quasi-monnaie
  of which Demand Deposit                       ...          ...          ...          ...          ...              ...          ...          ...          ...              dont Monnaie scripturale
Net foreign assets                       - 267 173    - 306 771    - 341 297    - 327 079    - 385 390        - 241 203    - 295 990    - 763 866      28 826                    Avoirs extérieurs nets
Domestic credit                             3 561       31 727       32 404       98 524      183 247          281 405      593 591      659 614      552 488                           Crédit intérieur

of which claims on private sector          13 125       19 393       39 823       63 021      117 295          192 044      466 011      657 694      786 397       dont créances sur le secteur privé

of which Claims on government                                                                                                                                              dont créances nettes sur le
                                          - 10 391      12 104       - 9 250      35 055       62 467           84 266      118 196      - 26 995    - 261 833
sector, net                                                                                                                                                                            gouvernement
International reserves (millions of US                                                                                                                            Réserves internationales (millions de
                                               74           98          236          131          155              181           78        1 615        1 841
$)                                                                                                                                                                                                $ EU)
Average Exchange Rate (National                                                                                                                                    Taux de change (moyen) (monnaie
                                           346.69       405.40       399.48       473.91       468.28           516.75       559.29       809.79       905.91
Currency per us $)                                                                                                                                                             nationale par dollars)


VII-2 Public Finance                                                                                                                                                  VII-2 Finances publiques
Congolese Franc (Millions)                                                                                                                                           Franc Congolais(Millions)
Total Revenues and Grants                 159 640      223 322      299 357      564 898      856 866          877 100     1 356 400    2 190 063    3 718 080                Recettes totales et dons
  Tax Revenue                             152 193      176 816      248 003      388 956      485 935          697 300     1 087 400    1 446 523    1 911 008                        Recettes fiscales
  Non Tax Revenue                               0            0             0            0      42 800           63 800      118 000      119 540      278 272                    Recettes non fiscales
  Grants                                    7 447       46 506       51 354      175 942      328 131          116 000      151 000      624 000     1 528 800                                    Dons      143
Total Expenditures and Net Lending        198 406      319 634      405 772      670 512      883 936         1 026 400    1 624 900    2 773 121    4 023 975          Dépenses totales et prêts nets

  Current expenditure                     112 204      151 570      213 476      387 689      523 798          606 100      804 300     1 108 393    1 494 751                    Dépenses courantes
  Of which Wages and Salaries              39 287       57 104       93 223      146 776      218 898          357 400      452 200      547 562      744 865           Dont rémunérations et salaires
  Capital expenditure                      10 385       61 756       72 059      113 878      134 050          121 100      243 700      703 532     1 639 368                Dépenses d'équipement
  Net Lending                               7 986            0             0            0            0          20 000      130 000      270 000             0                               Prêts nets
Fiscal Balance                            - 38 766     - 96 312    - 106 415    - 105 614     - 27 070        - 149 300    - 268 500    - 583 058    - 305 895         Solde global y compris les dons


VII-3 Balance of Payments                                                                                                                                         VII-3 Balance des paiements
Congolese Franc (Millions)                                                                                                                                           Franc Congolais(Millions)
Trade balance                                  39        - 220         - 57         - 92        - 451            - 203         - 71       - 1 170           ...                  Balance commerciale
Services Balance                            - 161         - 99        - 371        - 314        - 355            - 883        - 915        - 932            ...                   Balance des services
Net Income                                  - 236            9        - 265        - 306        - 294            - 567        - 744        - 570            ...                           Revenus nets
Current transfers, net total                  359          165          437          464          530              850          694        1 270            ...                    Transferts courants
Current account balance                         1        - 146        - 256        - 247        - 571            - 803       - 1 036      - 1 403           ...              Solde du compte courant


VII-4 External Debt and Financial Flows                                                                                                         VII-4 Dette extérieure et flux financiers
US $ (Millions)                                                                                                                                                                    $ E.U (Millions)
Total external debt                         4 013        4 857        5 582        5 902        5 411            6 535        7 153       13 822            ...                 Dette extérieure totale
  Private                                   3 573        4 343        5 075        5 300        4 680            5 721        6 277             0           ...                                  Privée
  Public                                      440          515          506          602          731              814          876       13 822            ...                               Publique
Total external debt service                   373          463          380          566          825              627          595          765            ...          Service de la dette extérieure
Net Foreign Direct Investment                                                                                                                                     Investissements étranger direct (flux
                                              117          158           10         - 76        - 108              720        1 000            ...          ...
Inflows                                                                                                                                                                                 nets entrants)
Net Total Official Development                                                                                                                                       Aide publique au développement
                                            1 175        5 417        1 826        1 774        2 043            1 241        1 610            ...          ...
assistance                                                                                                                                                                              (nette totale)


                                                                                                          African Statistical Yearbook 2011 / Annuaire Statistique pour l'Afrique 2011
Congo, Dem. Republic                                                                                                    Rép. Démocratique du Congo

                                          2002         2003        2004        2005        2006        2007         2008         2009       2010

         Congolese Franc (Millions)                                                                                                                           Franc Congolais
         Exports, fob                                                                                                                                       Exportations, fàb


         Exports - Total                  542 238     718 954     934 993    1 157 523   1 294 769   1 982 307    3 657 966    4 601 750       ...             Exportations - Total


         Main Products                                                                                                                                      Principaux produits


         Diamonds                         131 768     245 353     210 143     405 840     302 220     349 599            ...          ...      ...                        Diamants


         Crude oil                         69 360     103 787     146 455     353 582     316 593           ...          ...          ...      ...                     Pétrole brut


         Cobalt                            26 014       7 547      55 603      94 235      73 297      98 793            ...          ...      ...                           Cobalt


         Copper                             3 721       5 410      29 395      69 361      53 966      72 712            ...          ...      ...                           Cuivre


         Log                                2 546       5 410       3 824       7 012       5 944       7 234            ...          ...      ...                         Grumes

         Main Destinations                                                                                                                             Principales destinations

         Belgium                        347 147.7    277 635.7   230 421.7   273 436.3   238 694.8   258 862.1    286 748.8           ...      ...                         Belgique


         China                            4 328.7     10 618.8    39 613.6    83 393.7   172 584.2   237 450.8    892 007.4           ...      ...                            Chine


         United States                   72 068.6     74 186.5    52 465.7   127 685.0    40 339.7   107 551.8    152 391.0           ...      ...                       États-Unis


         France                          28 298.5     23 310.7   102 397.2    55 085.9    58 694.9    99 514.4    183 580.0           ...      ...                          France


         Zambia                             563.3      4 861.2     5 616.9    10 338.7    14 687.8    65 996.1    301 159.9           ...      ...                          Zambie


                                          2002         2003        2004        2005        2006        2007         2008         2009       2010
         Imports, cif                                                                                                                                        Importations, cif

144      Imports - Total                       ...    896 840    1 094 485   1 335 889   1 695 355   3 376 738    4 276 738    4 276 511       ...   Importations - Total (millions)


                                                                                                                                                            Principaux produits
         Main Products


         Durum wheat                        6 698       6 668       9 159       8 666       8 366           ...          ...          ...      ...                        Blé (dur)


         Frozen fish                       16 113      10 970      13 512       8 099       9 643           ...          ...          ...      ...                 Poisson congelé


         Rice                              13 989       4 852       4 414       4 007       5 515           ...          ...          ...      ...                              Riz


         Wheat flour                       10 770       5 014       1 166       1 701       2 801           ...          ...          ...      ...               Farine de froment


         Meat and offal frozen              9 576       6 986       6 162      18 410       4 678           ...          ...          ...      ...        Viande et abats congelés


         Main Origin                                                                                                                                   Principales provenances

         South Africa                    53 390.9     66 169.6    82 689.0   130 919.0   170 305.6   320 847.4    633 675.0           ...      ...                  Afrique du Sud

         Belgium                         41 730.7     57 748.2    70 619.8   110 564.0   103 372.2   143 694.9    219 981.0           ...      ...                         Belgique

         Zimbabwe                         9 925.0          0.0     5 034.8     3 395.3   444 073.7    43 369.7      8 353.5           ...      ...                       Zimbabwe

         France                          27 366.4     48 772.1    48 354.3    61 882.8    82 296.6    97 663.4    103 514.1           ...      ...                          France

         Zambia                          13 582.6     16 853.8    42 108.6    46 220.9    62 914.7   126 906.9    161 672.0           ...      ...                          Zambie


      African Statistical Yearbook 2011 / Annuaire Statistique pour l'Afrique 2011
Côte d'Ivoire                                                                                                                                                        Côte d'Ivoire

AREA (KM 2)                                                                                       322 463                                                                SUPERFICIE (KM 2)
CAPITAL CITY                             Yamoussoukro                                                                               Yamoussoukro                                     CAPITALE
CURRENCY                                 CFA Franc                                                                                     Franc CFA                                     MONNAIE


                        I SOCIAL AND DEMOGRAPHIC INDICATORS — INDICATEURS DEMOGRAPHIQUES ET SOCIAUX

                                           2002         2003         2004         2005         2006         2007         2008         2009       2010
Population                                                                                                                                                                        Population
                                                                                                                                                              Population au milieu de l'année -
Mid-year population - Total (Million)         17.5         18.0         18.5         19.1         19.7         20.2         20.8         21.4       ...
                                                                                                                                                                                 Total (million)
                                                                                                                                                              Population au milieu de l'année -
Mid-year population - Urban (%)               44.5         45.5         46.2         47.0         47.8         48.6         49.4         50.1       ...
                                                                                                                                                                                 Urbaine (%)

Female (%)                                    49.0         49.0         49.0         49.0         49.0         49.0         49.0         49.1       ...                             Femme (%)


Population by Age Group                                                                                                                                           Population par groupe d'âge


   0-14                                   7353 000     7526 000     7687 000     7838 000     7988 000     8144 000     8311 000     8498 000       ...                                     0-14


   15-64                                  9679 000    10034 000    10407 000    10797 000    11197 000    11500 000    11999 000    12385 000       ...                                    15-64


   65+                                     429 000      441 000      452 000      462 000      473 000      484 000      497 000      512 000       ...                                     65+


Active Population (000)                    7 032.0      7 180.0      7 331.0      7 484.0      7 641.0      7 802.0      7 966.0      8 133.0       ...                 Population active (000)

   Female (%)                                 39.3         39.3         39.3         39.3         39.3         39.3         39.3         39.3       ...                             Femme (%)

                                                                                                                                                             Taux brut de natalité - Total (par
Crude birth rate - Total (per 1000)           39.3         39.0         38.6         38.3         37.9         37.5         37.1         36.7       ...
                                                                                                                                                                                         1000)
                                                                                                                                                           Taux brut de mortalité - Total (par
Crude death rate - Total (per 1000)           14.3         14.3         14.3         14.3         14.0         13.8         13.6         13.3       ...
                                                                                                                                                                                        1000)
Life expectancy at birth - Total                                                                                                                             Espérance de vie à la naissance -
                                              50.9         50.9         50.9         50.9         51.3         51.6         52.0         52.3       ...
(years)                                                                                                                                                                        Total (années)
Net reproduction rate - (per                                                                                                                                  Taux net de reproduction - (par
                                               1.9          1.9          1.9          1.8          1.8          1.8          1.8          1.8       ...
woman)                                                                                                                                                                                femme)
                                                                                                                                                             Indice synthétique de fécondité -
Total fertility rate - (p woman)
              y        (per    )               5.2          5.2          5.1          5.1          5.0          5.0          4.9          4.9       ...
                                                                                                                                                                                 (par femme)

Education                                                                                                                                                                    Enseignement

Teaching staff at first level - Total                                                                                                                      Personnel enseignant - 1er degré -
                                             50.97         36.5         37.1         38.1         45.8         53.2         56.2         56.6       ...
(thousands)                                                                                                                                                                   Total (milliers)
Teaching staff at second level - Total                                                                                                                    Personnel enseignant - 2ème degré -
                                             22.54         15.2         18.3         19.9         19.9         20.4         22.6         28.5       ...                                              145
(thousands)                                                                                                                                                                    Total (milliers)
Teaching staff at third level - Total                                                                                                                   Personnel enseignant - 3ème degré -
                                                ...          ...          ...          ...          ...          ...          ...          ...      ...
(thousands)                                                                                                                                                                  Total (milliers)
First level student enrollment - Total                                                                                                                       Elèves inscrits - 1er degré - Total
                                             2 114        1 478        1 624        1 662        2 112        2 180        2 356        2 383       ...
(thousands)                                                                                                                                                                            (milliers)
First level student enrollment -                                                                                                                          Elèves inscrits - 1er degré - Femmes
                                              915          655          723          743          931          962         1 039        1 065       ...
Female (thousands)                                                                                                                                                                      (milliers)
Second level student enrollment -                                                                                                                          Elèves inscrits - 2ème degré - Total
                                              682          462          596          660          751          818          818          930        ...
Total (thousands)                                                                                                                                                                     (milliers)
Second level student enrollment -                                                                                                                                Elèves inscrits - 2ème degré -
                                              242          169          219          246          287          296          313          354        ...
Female (thousands)                                                                                                                                                           Femmes (milliers)
Third level student enrollment - Total                                                                                                                     Elèves inscrits - 3ème degré - Total
                                                ...          ...          ...          ...       149.3        156.8           ...          ...      ...
(thousands)                                                                                                                                                                           (milliers)
Third level student enrollment -                                                                                                                                 Elèves inscrits - 3ème degré -
                                                ...          ...          ...          ...        48.9         52.2           ...          ...      ...
Female (thousands)                                                                                                                                                           Femmes (milliers)
Public expenditure on education (%                                                                                                                           Dépenses publiques consacrées à
                                                ...          ...          ...          ...          ...          ...          ...          ...      ...
of budget)                                                                                                                                                     l'enseignement (% du budget)

Health                                                                                                                                                                                   Santé

Hospital beds - Total (per 10 000                                                                                                                            Nombre de lits d'hôpitaux - Total
                                                1            2             2            2            1            2            2           ...      ...
population)                                                                                                                                                                     (pour 10 000)
Nurses - Total (per 10 000                                                                                                                                  Nombre d'infirmières - Total (pour
                                                ...          ...           6           ...           4            4            4           ...      ...
population)                                                                                                                                                                           10 000)
Physicians - Total (per 10 000                                                                                                                              Nombre de médecins - Total (pour
                                                ...          ...           1           ...           1            1            1           ...      ...
population)                                                                                                                                                                         10 000)
Public expenditure on Health (% of                                                                                                                        Dépenses publiques consacrées à la
                                                 6            6            6            5            5            5            4           ...      ...
budget)                                                                                                                                                                santé (% du budget)


                                                                                                      African Statistical Yearbook 2011 / Annuaire Statistique pour l'Afrique 2011
Côte d'Ivoire                                                                                                                                                     Côte d'Ivoire
                                                                    II NATIONAL ACCOUNTS — COMPTES NATIONAUX

                                                     2002          2003        2004        2005        2006         2007         2008        2009       2010

          Gross domestic product by kind of economic activity at current prices
                                                                                                           Produit intérieur brut par branche d'activité économique aux prix courants


          CFA Franc (Millions)                                                                                                                                             Franc CFA (Millions)

          Agriculture                              2 346 767     2 560 403   2 063 033   2 036 048   2 105 934   2 144 500     2 408 072   2 605 113        ...                            Agriculture

          Mining and quarrying                      138 104       283 942     282 015     319 239     501 236      409 707       498 204     411 516        ...                 Industries extractives

          Manufacturing                            1 314 273     1 310 488   1 350 565   1 427 282   1 370 344   1 523 119     1 742 047   1 776 299        ...            Industries manufacturières

          Electricity, gas & water                  124 143        95 788     106 533     108 600     105 765      125 496       135 410     143 399        ...                 Electricité, gaz et eau

          Construction                              239 608       184 525     185 813     201 077     213 007      210 677       238 908     231 502        ...          Bâtiments et travaux publics
          Wholesale & retail trade,                                                                                                                                   Commerce de gros et de détail,
                                                   1 122 740     1 019 242   1 077 462   1 101 893   1 091 447   1 138 852     1 228 821   1 292 597        ...
          restaurants, hotels                                                                                                                                                  restaurants et hôtels
                                                                                                                                                                       Banques, assurances, affaires
          Finance, insurance, real estate, etc.    1 297 040     1 215 407   1 312 007   1 508 381   1 568 467   1 552 347     1 703 496   1 823 481        ...
                                                                                                                                                                                       immobilières
          Transport and communications              497 247       636 380     636 380     629 460     679 339      827 777       912 590     968 492        ...      Transport(s) et communications
                                                                                                                                                                         Administrations publiques et
          Public administration and defense         617 763       655 375     666 660     653 531     612 653      646 359       658 404     633 205        ...
                                                                                                                                                                                             défense
          Other services                            335 596       349 087     397 837     410 273     432 737      448 640       452 759     513 881        ...                        Autres services
                                                                                                                                                                      Moins Services d’intermédiation
          Less Imputed Service Charges             - 232 779     - 284 739   - 307 488   - 321 019   - 341 596    - 351 719    - 372 470   - 392 211        ...
                                                                                                                                                                                            financière
          Gross domestic product at factor                                                                                                                        Produit intérieur brut aux couts des
                                                   7 800 502     8 025 898   7 770 817   8 074 765   8 339 333   8 675 755     9 606 240 10 007 275         ...
          cost / basic prices                                                                                                                                                   facteurs / prix de base

          Plus: Indirect Taxes / taxes on                                                                                                                         Plus taxes indirectes/impôts sur les
                                                    805 155       870 304     974 643     936 990     968 575    1 073 428     1 165 743   1 277 654        ...
          products, less subsidies                                                                                                                                    produits, moins les subventions


          Expenditure on Gross domestic product at current purchaser's values
                                                                                                                       Emploi du produit intérieur brut aux prix courants d'acquisition

          CFA Franc (Millions)                                                                                                                                             Franc CFA (Millions)
                                                                                                                                                                            Consommation finale des
          Government final consumption             1 135 733     1 030 820    971 301     952 368     900 190    1 298 823     1 466 813   1 527 992        ...
                                                                                                                                                                            administrations publiques

          Private final consumption                5 684 315     6 176 677   6 274 842   6 509 197   6 801 587   6 995 110     7 507 222   7 544 758        ...           Consommation finale privée

          Gross fixed capital formation             866 637       734 245     817 636     826 102     911 057    1 132 444     1 297 781   1 493 746        ...        Formation brute de capital fixe

          Increase in inventories                  - 377 129      196 918     - 35 739    194 730    - 204 577    - 166 093    - 197 315   - 323 940        ...                   Variation des stocks

          Exports of goods and services            4 084 447     3 726 745   4 058 332   4 496 718   4 874 327   4 604 547     5 212 347   5 259 258        ...     Exportations de biens et services
146                                                                                                                                                                    Moins importations de biens et
          Less imports of goods and services       2 788 346     2 969 203   3 340 912   3 967 360   3 974 676   4 115 648     4 514 866   4 216 885        ...
                                                                                                                                                                                             services
          GDP at purchasers' values                8 605 657     8 896 202   8 745 460   9 011 755   9 307 908   9 749 183 10 771 983 11 284 929            ...             PIB aux prix d'acquisition


          Gross domestic product by kind of economic activity at constant
                                                                                                         Produit intérieur brut par branche d'activité economique aux prix constants
          prices
          Annual Growth Rates (%)                                                                                                                          Taux de croissance annuel (%)
          Agriculture                                     -1.2         2.3         0.0         3.4         3.4         -0.9          2.7         2.7        ...                            Agriculture

          Mining and quarrying                           72.6         78.4        -0.4        -1.7        19.3        -25.1         -1.6        13.0        ...                 Industries extractives

          Manufacturing                                   -2.4        -3.3        -4.2         5.3        -3.0          9.9          2.6         1.9        ...            Industries manufacturières

          Electricity, gas & water                       -16.0       -12.8        12.2         0.4         0.7        22.7           2.9         2.9        ...                 Electricité, gaz et eau

          Construction                                    0.7        -26.4         3.5       -15.3        13.9         -9.0          8.6         -1.8       ...          Bâtiments et travaux publics
          Wholesale & retail trade,                                                                                                                                          Commerce de gros et de
                                                          -3.0       -11.4        10.4         2.6        -1.4        -12.4        -13.5       -19.4        ...
          restaurants, hotels                                                                                                                                              détail,restaurants et hôtels
                                                                                                                                                                        Banques, assurances, affaires
          Finance, insurance, real estate, etc.           0.0         -9.0         4.0        11.4         2.9         -9.2         -5.5       -13.4        ...
                                                                                                                                                                                        immobilières
          Transport and communications                   -22.9         4.7       -26.5       -13.6        -0.4        20.7           9.6        59.9        ...      Transport(s) et communications
                                                                                                                                                                         Administrations publiques et
          Public administartion and defense               -6.7         6.7         2.7        -0.6        -6.0          3.5          1.1         -0.2       ...
                                                                                                                                                                                             défense
          Other services                                  -4.5         3.1        12.2         3.5         3.8        55.6          63.5        17.1        ...                        Autres services
                                                                                                                                                                      Moins Services d’intérmediation
          Less Imputed Service Charges                    -5.2         7.9         0.9         4.4         6.4          3.0          5.9         5.3        ...
                                                                                                                                                                                            financière
          Gross domestic product at factor                                                                                                                        Produit intérieur brut aux couts des
                                                          -2.9        -1.9         0.1         2.5         1.2          1.3          2.6         3.1        ...
          cost / basic prices                                                                                                                                                   facteurs / prix de base

          Plus: Indirect Taxes / taxes on                                                                                                                         Plus taxes indirectes/impôts sur les
                                                         12.5          4.0        11.9        -4.8         4.2          5.7          2.1         6.8        ...
          products, less subsidies                                                                                                                                    produits, moins les subventions

          Gross domestic product at market                                                                                                                          Produit intérieur brut aux prix du
                                                          -1.7        -1.4         1.2         1.7         1.5          1.8          2.5         3.5        ...
          prices                                                                                                                                                                               marché


          2008: semi-final           2009: Provisional     2010:Estimated                                                     2008: semi-définitif      2009: provisoire              2010:Estimée


      African Statistical Yearbook 2011 / Annuaire Statistique pour l'Afrique 2011
Côte d'Ivoire                                                                                                                                       Côte d'Ivoire

Expenditure on Gross domestic product at constant purchasers'
                                                                                                Emplois du produit intérieur brut aux prix constants d'acquisition
values

Annual Growth Rates (%)                                                                                                           Taux de croissance annuel (%)
                                                                                                                                                    Consommation finale des
Government final consumption                 -0.2     18.0      28.5       36.9      35.8        45.3        2.4        0.0        ...
                                                                                                                                                    administrations publiques

Private final consumption                    -1.5      -2.1      -4.6       -4.4      -4.1         0.1       3.3       -1.1        ...            Consommation finale privée

Gross fixed capital formation               24.7      -17.2     12.0        -5.5     12.0        21.0       10.1      12.7         ...         Formation brute de capital fixe

Exports of goods and services               10.6      -11.8     15.1         8.4       5.8       -10.6      -0.8        5.6        ...       Exportations de biens et services

                                                                                                                                               Moins importations de biens et
Less imports of goods and services            3.3       2.7     11.1       14.2       -3.9        -0.8       2.4       -1.3        ...
                                                                                                                                                                     services


                                                                            III INFLATION

                                          2002      2003      2004       2005      2006        2007       2008      2009       2010
Annual Growth Rates (%)                                                                                                           Taux de croissance annuel (%)
All Item                                      3.1       3.3       1.5        3.9       2.5         1.9       6.3        1.0       1.4                                Ensemble

Food                                          5.2       3.7      -3.5        2.5       3.0         5.4      11.6        3.0      11.8                             Alimentation

Health                                        3.8       0.1      -0.3        1.4       1.8         2.8       1.5        0.2      -1.6                                    Santé

Energy                                        6.0     13.0       -2.2        2.6      -0.1        -2.5       9.9       -5.8       2.4                                  Energie

Transport                                    -0.2       0.3       6.8      14.0        8.7        -0.7       7.4        0.0       2.6                                Transport


                                                IV AGRICULTURAL PRODUCTION - PRODUCTION AGRICOLE

                                          2002      2003      2004       2005      2006        2007       2008      2009       2010
Tons (Thousand)                                                                                                                                         Tonnes (milliers)
Coffee green, Tons (thousands)               251       251       251        230       187         117        68        145         ...                 Café vert ('000 tonnes)

Cocoa beans, Tons (thousands)              1 277     1 371     1 388      1 360     1 409       1 230      1 382     1 305         ...          Cacao en fèves ('000 tonnes)

Cotton lint, Tons (thousands)                396       396       180        321       297         278       120        141         ...                    Coton ('000 tonnes)
                                                                                                                                               Caoutchouc sec (HEVEA) ('000
Natural rubber, Tons (thousands)             127       116       137        135       178         189       201        203         ...
                                                                                                                                                                   tonnes)
Banana, Tons (thousands)                     322       322       307        261       318         388       334        286         ...             Banane poyo ('000 tonnes)


                                                     V MINING PRODUCTION - PRODUCTION MINIERE
                                                                                                                                                                                   147
                                          2002      2003      2004       2005      2006        2007       2008      2009       2010

Crude petroleum, metric tons
                                           748.5    1 027.8   1 125.5    1 994.2   3 050.0     2 411.4   2 284.4    2 712.4        ...              Pétrole brut ('000 tonnes)
(thousands)
Gold ores and concentrates                3 360.0       2.0   1 321.0    1 638.0   1 327.0     1 466.0   2 884.0    7 055.0        ...                              Or fin (kg)
(Kilograms)
                                                                                                                                         Gaz naturel (nette, million de mètres
Natural gas, cubic meters (million)       1 393.0   1 224.2   1 555.8    1 737.6   1 740.4     1 573.9   1 657.3    1 540.0        ...
                                                                                                                                                                         cube)


                                                                        VI ENERGY - ENERGIE

                                          2002      2003      2004       2005      2006        2007       2008      2009       2010

Electricity - total hydro production,                                                                                                     Électricité - production hydraulique
                                          5 278.3   5 063.8   5 370.0    5 530.6   5 510.3     5 475.6   5 633.9         ...       ...
kilowatt hours (millions)                                                                                                                    totale, kilowatt-heures (millions)

Electricity - total thermal production,                                                                                                     Électricité - production thermique
                                            32.6      36.0      32.4       25.8      27.3        32.6       33.4         ...       ...
kilowatt hours (millions)                                                                                                                    totale, kilowatt-heures (millions)

Electricity - total production, self-                                                                                                     Electricité - Production totale privée
                                              67        60        68         74        73          67        67          ...       ...
producer (Million Kilowatt Hours)                                                                                                                   (million de kilowatt heures)

Electricity - total production, public                                                                                                          Electricité - Production totale
                                           5 296     5 087     5 398      5 563     5 530       5 514         ...        ...       ...
(Million Kilowatt Hours)                                                                                                                 publique (million de kilowatt heures)


                                                                                         African Statistical Yearbook 2011 / Annuaire Statistique pour l'Afrique 2011
Côte d'Ivoire                                                                                                                                                            Côte d'Ivoire
                                                  VII TOURISM AND INFRASTRUCTURE - TOURISME ET INFRASTUCTURE

                                                    2002         2003         2004         2005         2006         2007         2008         2009         2010

         Arrivals - Tourists (thousands)                 ...          ...          ...          ...          ...          ...          ...          ...          ...           Arrivées - touristes (milliers)

         Rooms in hotels and similar                                                                                                                                 Chambres d'hotels et établissements
         establishments (thousands)                      ...          ...          ...          ...          ...          ...          ...          ...          ...                  assimilés (milliers)

         Paved Road (% of total)                          8            8            8            8            8            8            8            8           ...        Routes asphaltées (% du total)
         Total Network (Railways-km)                82 639       82 639       82 639       82 639       82 639       82 639       82 639       82 639            ...         Réseau total voies ferrées-Km
         Main Telephone Lines (per 1,000                                                                                                                                   Lignes téléphoniques fixes (pour
                                                        18           13           14           13           14           13           17            ...          ...
         inhabitants)                                                                                                                                                                      1000 habitants)
         Mobile Cellular Subscribers (per                                                                                                                                  Abonnés aux téléphones mobiles
                                                        57           69           89          122          207          371          507            ...          ...
         1,000 inhabitants)                                                                                                                                                         (pour 1000 habitants)


                                   VII FINANCIAL AND MONETARY STATISTICS - FINANCES ET STATISTIQUES MONETAIRES

                                                    2002         2003         2004         2005         2006         2007         2008         2009         2010

         VII-1 Monetary Statistics                                                                                                                                VII-1 Statistiques monétaires
         CFA Franc (Millions)                                                                                                                                                    Franc CFA (Millions)
         Money supply (M1)                        1 750 480    1 145 080    1 300 350    1 397 260    1 551 050    1 983 270    1 999 470    2 341 650    2 590 240                  Masse monétaire (M1)
         Quasi-money                               641 084      618 634      632 217      683 882      743 718      853 324      997 883     1 170 100    1 393 690                          Quasi-monnaie
           of which Demand Deposit                       ...          ...          ...          ...          ...          ...          ...          ...          ...              dont Monnaie scripturale
         Net foreign assets                        899 006      464 347      673 402      722 979      836 117     1 060 080    1 007 950    1 157 730    1 368 020                   Avoirs extérieurs nets
         Domestic credit                          1 688 810    1 505 210    1 517 700    1 569 670    1 634 890    1 962 480    2 103 660    2 506 390    2 796 960                          Crédit intérieur

         of which claims on private sector        1 208 640    1 087 470    1 173 980    1 190 200    1 290 080    1 531 740    1 704 020    1 883 900    1 991 800      dont créances sur le secteur privé

         of which Claims on government                                                                                                                                          dont créances nettes sur le
                                                   472 319      412 513      343 715      379 464      344 814      430 739      399 645      621 893      802 432
         sector, net                                                                                                                                                                        gouvernement
         International reserves (millions of US                                                                                                                        Réserves internationales (millions de
                                                     1 863        1 304        1 694        1 322        1 798        2 519        2 253        3 267        3 542
         $)                                                                                                                                                                                            $ EU)
         Average Exchange Rate (National                                                                                                                                Taux de change (moyen) (monnaie
                                                    696.99       581.20       528.29       527.47       522.89       479.27       447.81       472.19       495.28
         Currency per us $)                                                                                                                                                         nationale par dollars)


         VII-2 Public Finance                                                                                                                                              VII-2 Finances publiques
         CFA Franc (Millions)                                                                                                                                                    Franc CFA (Millions)
         Total Revenues and Grants                1 456 800    1 391 000    1 514 350    1 566 000    1 615 500    1 842 000    2 156 300    2 120 700    2 159 796                Recettes totales et dons
           Tax Revenue                            1 259 300    1 190 100    1 241 350    1 251 100    1 364 000    1 438 900    1 638 000    1 795 600           ...                       Recettes fiscales
           Non Tax Revenue                         169 100      161 800      197 100      220 300      236 400      349 500      338 800      262 100            ...                  Recettes non fiscales
148        Grants                                   28 400       39 100       75 900       94 600       15 100       53 600      179 500       63 000            ...                                   Dons

         Total Expenditures and Net Lending       1 527 779    1 512 250    1 567 156    1 636 600    1 650 700    1 936 800    2 217 200    2 291 900    2 434 824          Dépenses totales et prêts nets

           Current expenditure                     917 329      969 540     1 027 123    1 110 500    1 151 300    1 330 600    1 527 100    1 560 600           ...                   Dépenses courantes
           Of which Wages and Salaries             523 529      539 400      545 779      563 400      589 000      640 300      711 700      745 000            ...         Dont rémunérations et salaires
           Capital expenditure                     257 100      213 700      258 624      235 300      239 000      253 600      319 600      334 300            ...               Dépenses d'équipement
           Net Lending                              12 850        9 110       10 571       20 300       22 100       28 800       17 700       12 400            ...                              Prêts nets
         Fiscal Balance                            - 70 979    - 121 250     - 52 806     - 70 600     - 35 200     - 94 800     - 60 900    - 171 200    - 275 028         Solde global y compris les dons


         VII-3 Balance of Payments                                                                                                                                     VII-3 Balance des paiements
         CFA Franc (Millions)                                                                                                                                                    Franc CFA (Millions)
         Trade balance                            1 964 934    1 485 793    1 388 287    1 290 348    1 625 683    1 229 011    1 487 375    2 002 592           ...                  Balance commerciale
         Services Balance                         - 668 833    - 648 549    - 670 867    - 680 990    - 726 032    - 743 176    - 732 643    - 749 670           ...                   Balance des services
         Net Income                               - 438 968    - 383 306    - 344 275    - 344 546    - 371 394    - 387 928    - 403 945    - 442 499           ...                           Revenus nets
         Current transfers, net total             - 321 997    - 282 766    - 245 906    - 243 885    - 277 811    - 164 545    - 148 878     - 46 620           ...                    Transferts courants
         Current account balance                   535 136      171 172      127 239       20 927      250 446      - 66 638     201 909      763 803            ...              Solde du compte courant


         VII-4 External Debt and Financial Flows                                                                                                     VII-4 Dette extérieure et flux financiers
         US $ (Millions)                                                                                                                                                                $ E.U (Millions)
         Total external debt                         6 437        6 142        6 071        6 220        6 459        6 397        6 449        5 856            ...                 Dette extérieure totale
           Private                                   1 334        1 267        1 269        1 305        1 313        1 292        1 371        1 373            ...                                  Privée
           Public                                    5 103        4 876        4 802        4 915        5 146        5 105        5 078        4 483            ...                               Publique
         Total external debt service                   805          573          565          480          442          401          375          168            ...          Service de la dette extérieure
         Net Foreign Direct Investment                                                                                                                                 Investissements étranger direct (flux
                                                       181          132          186          191          195          226          224          206            ...
         Inflows                                                                                                                                                                             nets entrants)
         Net Total Official Development                                                                                                                                   Aide publique au développement
                                                       284           40           78           95          120           83          231            ...          ...
         assistance                                                                                                                                                                          (nette totale)


      African Statistical Yearbook 2011 / Annuaire Statistique pour l'Afrique 2011
Côte d'Ivoire                                                                                                                               Côte d'Ivoire

                                2002        2003        2004        2005        2006        2007        2008        2009      2010

CFA Franc (Millions)                                                                                                                                     Franc CFA
Exports, fob                                                                                                                                   Exportations, fàb


Exports - Total               3 676 540   3 363 702   3 655 377   4 060 120   4 432 719   4 154 669   4 652 742   5 192 300      ...              Exportations - Total


Main Products                                                                                                                                  Principaux produits


Cocoa beans                   1 229 757   1 007 604    850 113     777 859     743 338     687 519     789 266    1 224 008      ...                      Cacao fèves


Peutroleum Products            405 836     240 454     172 603     281 657     706 326     514 507     716 107    1 423 484      ...                Produits pétroliers


Cocoa transformed              356 155     338 911     270 834     269 424     275 653     331 088     400 461     475 378       ...                Cacao transformé


Lumber                         157 106     136 919     160 559     157 962     148 290     153 567     153 069      84 297       ...                      Bois débités


Cotton mass                     93 444     103 143      81 466      73 708      59 056      46 829      35 879      32 085       ...                     Coton masse

Main Destinations                                                                                                                         Principales destinations

France                        458 008.2   607 488.4   818 331.6   700 139.0   779 995.1   788 324.8   610 260.6   526 603.4      ...                           France


Netherlands                   656 549.5   565 709.4   374 838.7   421 011.6   411 076.0   352 318.9   495 083.1   673 344.3      ...                         Pays-Bas


U.S.A                         261 683.4   226 033.2   336 186.4   540 315.2   386 245.2   261 550.7   425 264.5   373 497.3      ...                             U.S.A


Nigeria                       325 246.0    95 451.0   260 945.4   305 122.4   307 241.5   307 929.7   281 330.1   337 374.1      ...                           Nigéria


Italy                         131 977.4   109 356.3   165 092.7   105 731.6   166 033.5   134 089.6   171 205.3   154 707.7      ...                             Italie


                                2002        2003        2004        2005        2006        2007        2008        2009      2010
Imports, cif                                                                                                                                    Importations, cif

Imports - Total               2 788 346   2 969 203   3 340 912   3 967 360   3 974 676   4 189 309   4 390 395   4 350 439      ...    Importations - Total (millions)   149

                                                                                                                                               Principaux produits
Main Products


Petroleum products             370 833     350 609     576 627     868 024     966 459     964 787    1 259 525    819 869       ...                Produits pétroliers


Electrical Machinery           120 794     101 462     151 505     148 301     156 063     214 680     231 366     211 405       ...             Machines électriques


Fish, crustaceans, molluscs    123 646     115 160      98 567     105 437     119 320     131 335     174 626     168 763       ...   Poissons, crustacés, molusques


Rice                            93 178      91 265     113 211     133 920     152 293     156 034     209 506     281 480       ...                               Riz


Vehicles and trucks             60 523      93 567     164 868     135 947     135 436     163 680     141 341     122 662       ...             Véhicules et camions


Main Origin                                                                                                                               Principales provenances

Nigeria                       254 525.5   294 962.2   504 544.1   759 645.5   837 707.1   769 285.9 1 035 048.5   676 143.9      ...                           Nigéria

France                        388 068.1   667 203.4   811 360.3   858 157.0   776 060.3   694 909.4   447 431.5   467 500.9      ...                           France

China                          43 622.9    71 404.2    68 899.7    94 583.6   131 333.2   209 666.2   242 554.2   236 081.5      ...                  Chine Populaire

Germany                        64 956.4    58 100.5    65 659.6    55 215.3    76 047.2    86 607.6   100 443.7    96 713.9      ...                        Allemagne

U.S.A                          62 352.2    66 030.9    70 375.0    63 008.3    70 558.1    86 138.4    93 573.3   107 594.3      ...                             U.S.A


                                                                                      African Statistical Yearbook 2011 / Annuaire Statistique pour l'Afrique 2011
Djibouti                                                                                                                                                              Djibouti

         AREA (KM 2)                                                                                23 200                                                              SUPERFICIE (KM 2)
         CAPITAL CITY                             Djibouti                                                                                  Djibouti                                CAPITALE
         CURRENCY                                 Djibouti Franc                                                                   Franc Djiboutien                                 MONNAIE


                                 I SOCIAL AND DEMOGRAPHIC INDICATORS — INDICATEURS DEMOGRAPHIQUES ET SOCIAUX

                                                     2002      2003       2004       2005       2006         2007       2008          2009      2010
         Population                                                                                                                                                              Population
                                                                                                                                                             Population au milieu de l'année -
         Mid-year population - Total (Million)          0.6        0.6        0.6        0.6        0.7          0.7        0.7          0.9       ...
                                                                                                                                                                                Total (million)
                                                                                                                                                             Population au milieu de l'année -
         Mid-year population - Urban (%)                 ...        ...     486.6       86.0       87.0         87.0       87.0         87.8       ...
                                                                                                                                                                                Urbaine (%)

         Female (%)                                    50.1       50.1       50.1       50.0       50.0         50.0       50.0         50.0       ...                             Femme (%)


         Population by Age Group                                                                                                                                 Population par groupe d'âge


            0-14                                    236 112    242 167    248 376    254 585    260 950      267 474    274 161      311 789       ...                                     0-14


            15-64                                   356 271    365 407    374 776    384 145    393 749      403 593    413 683      524 434       ...                                    15-64


            65+                                       8 411      8 627      8 848      9 069      9 296        9 528      9 767       27 975       ...                                     65+


         Active Population (000)                      313.0      320.0      328.0      335.0      343.0        352.0      362.0        371.0       ...                 Population active (000)

            Female (%)                                 43.1       43.1       43.0       43.3       43.4         43.2       43.1         43.4       ...                             Femme (%)

                                                                                                                                                            Taux brut de natalité - Total (par
         Crude birth rate - Total (per 1000)           31.6       39.0       39.0       39.0       29.4         28.9       28.4         28.0       ...
                                                                                                                                                                                        1000)
                                                                                                                                                          Taux brut de mortalité - Total (par
         Crude death rate - Total (per 1000)           11.7       11.6       11.5       11.4       11.3         11.2       11.0         10.9       ...
                                                                                                                                                                                       1000)
         Life expectancy at birth - Total                                                                                                                   Espérance de vie à la naissance -
                                                       53.8       54.0       54.2       54.5       54.8         55.1       55.4         55.8       ...
         (years)                                                                                                                                                              Total (années)
         Net reproduction rate - (per                                                                                                                        Taux net de reproduction - (par
                                                         ...        ...        ...       1.7         ...          ...        ...          ...      ...
         woman)                                                                                                                                                                      femme)
                                                                                                                                                            Indice synthétique de fécondité -
         Total fertility rate - (p woman)
                       y        (per    )               4.6        4.2        4.2        4.2        4.1          4.0        3.9          3.8       ...
                                                                                                                                                                                (par femme)

         Education                                                                                                                                                          Enseignement

         Teaching staff at first level - Total                                                                                                            Personnel enseignant - 1er degré -
                                                       1.27        1.3        1.4        1.5        1.6          1.6        1.7           ...      ...
         (thousands)                                                                                                                                                         Total (milliers)
         Teaching staff at second level - Total                                                                                                          Personnel enseignant - 2ème degré -
                                                       0.51        0.6        0.7        0.7        0.8          0.8        1.0           ...      ...
150      (thousands)                                                                                                                                                          Total (milliers)
         Teaching staff at third level - Total                                                                                                           Personnel enseignant - 3ème degré -
                                                         ...       1.3        1.4        1.5        1.6          1.6         ...          ...      ...
         (thousands)                                                                                                                                                          Total (milliers)
         First level student enrollment - Total                                                                                                             Elèves inscrits - 1er degré - Total
                                                        39         40         41         43         47           49         49           50        ...
         (thousands)                                                                                                                                                                  (milliers)
         First level student enrollment -                                                                                                                Elèves inscrits - 1er degré - Femmes
                                                        23         24         18         19         20           22         22           23        ...
         Female (thousands)                                                                                                                                                            (milliers)
         Second level student enrollment -                                                                                                                Elèves inscrits - 2ème degré - Total
                                                        16         18         19         21         24           27         34           38        ...
         Total (thousands)                                                                                                                                                           (milliers)
         Second level student enrollment -                                                                                                                      Elèves inscrits - 2ème degré -
                                                          6          7         7          8          9           11          3            4        ...
         Female (thousands)                                                                                                                                                 Femmes (milliers)
         Third level student enrollment - Total                                                                                                           Elèves inscrits - 3ème degré - Total
                                                        0.7        0.9        1.1        1.7        1.9          2.2         ...          ...      ...
         (thousands)                                                                                                                                                                 (milliers)
         Third level student enrollment -                                                                                                                       Elèves inscrits - 3ème degré -
                                                        0.3        0.4        0.5        0.7        0.8          0.9         ...          ...      ...
         Female (thousands)                                                                                                                                                 Femmes (milliers)
         Public expenditure on education (%                                                                                                                 Dépenses publiques consacrées à
                                                       23.1       25.2       27.4       25.9       22.4         22.8         ...          ...      ...
         of budget)                                                                                                                                           l'enseignement (% du budget)

         Health                                                                                                                                                                         Santé

         Hospital beds - Total (per 10 000                                                                                                                  Nombre de lits d'hôpitaux - Total
                                                         ...        ...        ...       18         18           18         17            ...      ...
         population)                                                                                                                                                           (pour 10 000)
         Nurses - Total (per 10 000                                                                                                                        Nombre d'infirmières - Total (pour
                                                         ...        ...       33         33         21           20         20            ...      ...
         population)                                                                                                                                                                 10 000)
         Physicians - Total (per 10 000                                                                                                                    Nombre de médecins - Total (pour
                                                        20          ...       16          ...       13           13         19            ...      ...
         population)                                                                                                                                                               10 000)
         Public expenditure on Health (% of                                                                                                              Dépenses publiques consacrées à la
                                                        10         10          9         10         13            ...        ...          ...      ...
         budget)                                                                                                                                                      santé (% du budget)


      African Statistical Yearbook 2011 / Annuaire Statistique pour l'Afrique 2011
Djibouti                                                                                                                                                            Djibouti
                                                        II NATIONAL ACCOUNTS — COMPTES NATIONAUX

                                            2002       2003       2004       2005       2006        2007       2008       2009       2010

Gross domestic product by kind of economic activity at current prices
                                                                                            Produit intérieur brut par branche d'activité économique aux prix courants


Djibouti Franc (Millions)                                                                                                                        Franc Djiboutien(Millions)

Agriculture                                   3 178      3 294      3 460      3 728      4 017       4 367      5 475      6 089      6 537                             Agriculture

Mining and quarrying                           582        549        442        182        194         206        221        237        266                   Industries extractives

Manufacturing                                 2 344      2 432      2 556      2 742      2 940       3 168      3 422      3 687      3 951             Industries manufacturières

Electricity, gas & water                      4 972      5 277      5 641      6 098      6 507       7 006      7 691      8 286      8 559                  Electricité, gaz et eau

Construction                                  6 162      6 447      6 839      8 109      8 517       9 960     12 744     18 769     20 326           Bâtiments et travaux publics
Wholesale & retail trade,                                                                                                                           Commerce de gros et de détail,
                                             15 023     15 805     18 004     20 721     23 216      23 024     25 983     29 376     31 512
restaurants, hotels                                                                                                                                          restaurants et hôtels
                                                                                                                                                     Banques, assurances, affaires
Finance, insurance, real estate, etc.        11 944     12 389     13 028     13 902     14 835      16 119     17 905     21 638     23 273
                                                                                                                                                                     immobilières
Transport and communications                 25 073     25 943     27 230     27 933     29 951      32 232     36 027     43 785     47 772       Transport(s) et communications
                                                                                                                                                       Administrations publiques et
Public administration and defense            19 684     18 911     18 772     20 036     19 705      22 809     22 478     22 789     23 457
                                                                                                                                                                           défense
Other services                                1 753      1 816      1 908      2 025      2 141       2 241      2 487      2 685      2 824                         Autres services
                                                                                                                                                    Moins Services d’intermédiation
Less Imputed Service Charges                     ...        ...        ...        ...        ...         ...        ...        ...        ...
                                                                                                                                                                          financière
Gross domestic product at factor                                                                                                                Produit intérieur brut aux couts des
                                             90 715     92 862     97 880    105 476    112 023     121 132    134 433    157 341    168 477
cost / basic prices                                                                                                                                           facteurs / prix de base

Plus: Indirect Taxes / taxes on                                                                                                                 Plus taxes indirectes/impôts sur les
                                             11 918     13 091     13 650     12 924     13 916      15 472     16 260     17 276     17 994
products, less subsidies                                                                                                                            produits, moins les subventions


Expenditure on Gross domestic product at current purchaser's values
                                                                                                       Emploi du produit intérieur brut aux prix courants d'acquisition

Djibouti Franc (Millions)                                                                                                                        Franc Djiboutien(Millions)
                                                                                                                                                          Consommation finale des
Government final consumption                 26 008     28 462     29 498     31 652     31 521      32 880     34 520     36 339     37 758
                                                                                                                                                          administrations publiques

Private final consumption                    81 325     83 334     84 009     90 801    100 450     110 405    123 670    146 580    156 753            Consommation finale privée

Gross fixed capital formation                11 485     17 254     25 053     20 839     24 313      27 620     29 477     32 979     34 994         Formation brute de capital fixe

Increase in inventories                          ...        ...        ...        ...        ...         ...        ...        ...        ...                   Variation des stocks

Exports of goods and services                48 414     51 649     52 984     55 873     58 352      60 566     62 515     64 431     66 435      Exportations de biens et services
                                                                                                                                                     Moins importations de biens et     151
Less imports of goods and services           64 598     74 746     80 014     80 764     88 697      94 866     99 489    105 713    109 470
                                                                                                                                                                           services
GDP at purchasers' values                   102 633    105 953    111 530    118 400    125 939     136 604    150 693    174 617    186 471              PIB aux prix d'acquisition


Gross domestic product by kind of economic activity at constant
                                                                                           Produit intérieur brut par branche d'activité economique aux prix constants
prices
Annual Growth Rates (%)                                                                                                                  Taux de croissance annuel (%)
Agriculture                                     3.0        3.0        4.5        4.5        6.5         6.0        7.0        7.0         ...                            Agriculture

Mining and quarrying                           -6.3      -21.0      -60.0        3.0        3.0         4.0        4.0        4.0         ...                 Industries extractives

Manufacturing                                   3.1        3.1        4.0        4.0        4.0         5.0        7.0        7.0         ...            Industries manufacturières

Electricity, gas & water                        5.5        4.8        4.8        3.5        8.6         6.0        7.0        7.0         ...                 Electricité, gaz et eau

Construction                                    4.0        4.0       15.0       10.0       13.0        15.0       12.0       10.0         ...          Bâtiments et travaux publics
Wholesale & retail trade,                                                                                                                                  Commerce de gros et de
                                                4.7        4.6        4.5        5.7        6.8         7.0        7.2        6.6         ...
restaurants, hotels                                                                                                                                      détail,restaurants et hôtels
                                                                                                                                                      Banques, assurances, affaires
Finance, insurance, real estate, etc.           3.1        3.1        3.5        3.5        5.0         5.5        6.0        6.0         ...
                                                                                                                                                                      immobilières
Transport and communications                    2.9        2.9       -0.5        4.0        4.5         5.0        6.0        7.0         ...      Transport(s) et communications
                                                                                                                                                       Administrations publiques et
Public administartion and defense              -4.5       -2.7        4.3       -5.3       -2.6        -1.0       -3.3       -0.3         ...
                                                                                                                                                                           défense
Other services                                  3.0        3.0        3.0        3.0        3.0         3.0        4.0        4.0         ...                        Autres services
                                                                                                                                                    Moins Services d’intérmediation
Less Imputed Service Charges                     ...        ...        ...        ...        ...         ...        ...        ...        ...
                                                                                                                                                                          financière
Gross domestic product at factor                                                                                                                Produit intérieur brut aux couts des
                                                1.8        2.1        3.3        2.8        4.7         5.4        5.4        6.0         ...
cost / basic prices                                                                                                                                           facteurs / prix de base

Plus: Indirect Taxes / taxes on                                                                                                                 Plus taxes indirectes/impôts sur les
                                                9.1       10.8        0.6        5.8       64.3         3.4        3.4        3.4         ...
products, less subsidies                                                                                                                            produits, moins les subventions

Gross domestic product at market                                                                                                                  Produit intérieur brut aux prix du
                                                2.6        3.2        3.0        3.2       12.7         5.0        5.0        5.5         ...
prices                                                                                                                                                                       marché


2009: Provisional          2010:Estimated                                                                                            2009: provisoire               2010:Estimée


                                                                                              African Statistical Yearbook 2011 / Annuaire Statistique pour l'Afrique 2011
Djibouti                                                                                                                                               Djibouti

         Expenditure on Gross domestic product at constant purchasers'
                                                                                                  Emplois du produit intérieur brut aux prix constants d'acquisition
         values

         Annual Growth Rates (%)                                                                                                    Taux de croissance annuel (%)
                                                                                                                                                      Consommation finale des
         Government final consumption                7.9      7.7      3.6       -5.0     22.3      -6.7       6.3       -9.9        ...
                                                                                                                                                      administrations publiques

         Private final consumption                  -6.1     -6.6      5.9        6.1      2.7     15.8       17.5      -11.6        ...            Consommation finale privée

         Gross fixed capital formation              30.8     93.7     15.8       13.2     70.3     26.3       16.4      -15.2        ...        Formation brute de capital fixe

         Exports of goods and services               4.6     10.4     -3.9       11.4     12.7      -1.6       9.6      27.0         ...      Exportations de biens et services

                                                                                                                                                Moins importations de biens et
         Less imports of goods and services         -1.9     18.4      6.2       12.3     30.0     17.1       26.0      -15.1        ...
                                                                                                                                                                      services


                                                                                 III INFLATION

                                                   2002     2003     2004      2005      2006     2007      2008      2009       2010
         Annual Growth Rates (%)                                                                                                    Taux de croissance annuel (%)
         All Item                                    0.6      2.0      3.1        4.7      3.5      0.3       12.0       1.7        4.2                               Ensemble

         Food                                        1.2      3.9      4.2        1.4      4.0      7.8       16.8       1.3         ...                           Alimentation

         Health                                     -0.3      2.3      3.8        1.6     -3.1      0.3        8.3       1.4         ...                                   Santé

         Energy                                      0.8     -1.1      1.9        9.6     -2.2      4.7        6.6       3.5         ...                                 Energie

         Transport                                  -0.5      1.8      2.1        4.8      1.4      -0.5      10.4       7.4         ...                              Transport


                                                       IV AGRICULTURAL PRODUCTION - PRODUCTION AGRICOLE

                                                   2002     2003     2004      2005      2006     2007      2008      2009       2010
         Tons (Thousand)                                                                                                                                 Tonnes (milliers)
         Beans, dry, Tons (thousands)                  2        2        1          1        1        2          2         ...       ...         Fèves sèches, tonnes (milliers)

         Lemon, Tons (thousands)                       2        2        2         2         2        2          2         ...       ...               Citrons, tonnes (milliers)

         Tomato, Tons (thousands)                      1        1        1          1        1        1          1         ...       ...             Tomates, tonnes (milliers)

         Mango, Tons (thousands)                       0        0        0         0         0        0         ...        ...       ...             Mangues, tonnes (milliers)

         Oinons Green, Tons (thousands)                0        0        0         0         0        0         ...        ...       ...        Oignons verts, tonnes (milliers)


                                                            V MINING PRODUCTION - PRODUCTION MINIERE
152
                                                   2002     2003     2004      2005      2006     2007      2008      2009       2010

         Salt and pure sodium chloride,                                                                                                          Sel et chlorure de sodium pur,
                                                   102.0    102.0     78.0         ...      ...       ...       ...        ...       ...
         metric tons (thousands)                                                                                                                     tonnes métriques (milliers)
                                                      ...      ...      ...        ...      ...       ...       ...        ...       ...


                                                      ...      ...      ...        ...      ...       ...       ...        ...       ...


                                                                              VI ENERGY - ENERGIE

                                                   2002     2003     2004      2005      2006     2007      2008      2009       2010

         Electricity - total hydro production,                                                                                              Électricité - production hydraulique
                                                      ...      ...      ...        ...      ...       ...       ...        ...       ...
         kilowatt hours (millions)                                                                                                             totale, kilowatt-heures (millions)

         Electricity - total thermal production,                                                                                              Électricité - production thermique
                                                   200.0    200.0    215.0      255.0    280.0    292.0         ...        ...       ...
         kilowatt hours (millions)                                                                                                             totale, kilowatt-heures (millions)

         Electricity - total production, self-                                                                                             Electricité - Production totale privée
                                                      ...      ...      ...        ...      ...       ...       ...        ...       ...
         producer (Million Kilowatt Hours)                                                                                                           (million de kilowatt heures)

         Electricity - total production, public                                                                                                   Electricité - Production totale
                                                     248      261      274       298       307      321       326          ...       ...
         (Million Kilowatt Hours)                                                                                                          publique (million de kilowatt heures)


      African Statistical Yearbook 2011 / Annuaire Statistique pour l'Afrique 2011
Djibouti                                                                                                                                                                        Djibouti
                                         VII TOURISM AND INFRASTRUCTURE - TOURISME ET INFRASTUCTURE

                                          2002       2003        2004        2005        2006             2007         2008       2009          2010

Arrivals - Tourists (thousands)             22.5        23.2        26.3       30.25        39.5            48.7         53.6           ...          ...           Arrivées - touristes (milliers)

Rooms in hotels and similar                                                                                                                                Chambres d'hotels et établissements
establishments (thousands)                                                                                                                                                  assimilés (milliers)
                                            0.45        0.45        0.45        0.45        0.45           0.677        0.861           ...          ...
Paved Road (% of total)                       14          14          14          14          14              14           16          16            ...        Routes asphaltées (% du total)
Total Network (Railways-km)                3 048       3 048       3 132       3 132       3 132           3 132        3 132       3 132            ...         Réseau total voies ferrées-Km
Main Telephone Lines (per 1,000                                                                                                                                Lignes téléphoniques fixes (pour
                                              17          16          17          16          17              20           21           ...          ...
inhabitants)                                                                                                                                                                   1000 habitants)
Mobile Cellular Subscribers (per                                                                                                                               Abonnés aux téléphones mobiles
                                              34          38          54          68          67              96          162           ...          ...
1,000 inhabitants)                                                                                                                                                      (pour 1000 habitants)


                          VII FINANCIAL AND MONETARY STATISTICS - FINANCES ET STATISTIQUES MONETAIRES

                                          2002       2003        2004        2005        2006             2007         2008       2009          2010

VII-1 Monetary Statistics                                                                                                                             VII-1 Statistiques monétaires
Djibouti Franc (Millions)                                                                                                                                    Franc Djiboutien(Millions)
Money supply (M1)                         35 515      42 850      47 443      47 728      57 271          67 541       82 236     102 678      122 974                   Masse monétaire (M1)
Quasi-money                               29 922      34 207      40 311      49 981      51 419          50 491       60 074      64 514       59 704                           Quasi-monnaie
  of which Demand Deposit                      ...         ...         ...         ...         ...             ...          ...         ...          ...              dont Monnaie scripturale
Net foreign assets                        45 881      59 610      70 721      79 397      92 003          95 115      117 191     127 495      130 940                    Avoirs extérieurs nets
Domestic credit                           31 540      31 071      31 549      31 538      32 972          39 925       47 965      60 250       70 078                           Crédit intérieur

of which claims on private sector         25 629      24 967      24 991      25 282      27 579          33 939       43 211      54 717       66 282       dont créances sur le secteur privé

of which Claims on government                                                                                                                                       dont créances nettes sur le
                                           4 537       4 845       5 459       5 192       4 442           4 243        3 236       2 908        1 242
sector, net                                                                                                                                                                     gouvernement
International reserves (millions of US                                                                                                                     Réserves internationales (millions de
                                              74         100          94          89         120             132          175         242          254
$)                                                                                                                                                                                         $ EU)
Average Exchange Rate (National                                                                                                                             Taux de change (moyen) (monnaie
                                          177.72      177.72      177.72      177.72      177.72          177.72       177.72      177.72       177.72
Currency per us $)                                                                                                                                                      nationale par dollars)


VII-2 Public Finance                                                                                                                                           VII-2 Finances publiques
Djibouti Franc (Millions)                                                                                                                                    Franc Djiboutien(Millions)
Total Revenues and Grants                 30 948      37 966      42 156      46 714      47 742          53 002       73 091      68 916       74 066                 Recettes totales et dons
  Tax Revenue                             22 165      22 930      23 640      25 133      27 690          30 901       35 004      37 449       41 344                         Recettes fiscales
  Non Tax Revenue                          2 556       8 294      10 423      13 798      14 775          14 632       15 249      19 519       19 985                    Recettes non fiscales
  Grants                                   6 227       6 742       8 093       7 783       5 277           7 469       22 838      11 948       12 737                                     Dons      153
Total Expenditures and Net Lending        34 817      40 491      44 399      46 409      51 118          56 885       70 902      77 983       80 790           Dépenses totales et prêts nets

  Current expenditure                     26 832      29 281      31 521      30 861      35 734          34 658       40 677      39 031       42 337                     Dépenses courantes
  Of which Wages and Salaries             15 908      17 338      17 933      18 607      19 926          20 801       22 176      24 058       25 497           Dont rémunérations et salaires
  Capital expenditure                      4 695       7 436       9 117      11 711      10 302          16 859       24 164      32 121       31 481                 Dépenses d'équipement
  Net Lending                                  0           0           0           0           0               0            0            0            0                               Prêts nets
Fiscal Balance                            - 3 869     - 2 525     - 2 243        305      - 3 376         - 3 883       2 189      - 9 067      - 6 725         Solde global y compris les dons


VII-3 Balance of Payments                                                                                                                                  VII-3 Balance des paiements
Djibouti Franc (Millions)                                                                                                                                    Franc Djiboutien(Millions)
Trade balance                            - 28 691    - 35 719    - 39 718    - 47 523    - 59 859        - 80 064    - 109 654    - 90 105    - 105 273                   Balance commerciale
Services Balance                          23 231      25 895      24 299      29 271      28 484          30 795       30 390      51 717       68 561                     Balance des services
Net Income                                 2 718       9 000      11 506      11 941      15 021          16 722       15 995      12 618       20 997                             Revenus nets
Current transfers, net total               1 040       4 611       2 360       2 285      - 3 692         - 3 692      - 5 154     - 5 332      - 2 950                     Transferts courants
Current account balance                   - 1 702      3 787      - 1 553     - 4 026    - 20 046        - 36 238     - 68 423    - 31 101     - 18 665               Solde du compte courant


VII-4 External Debt and Financial Flows                                                                                                  VII-4 Dette extérieure et flux financiers
US $ (Millions)                                                                                                                                                             $ E.U (Millions)
Total external debt                          341         415         452         440         437             540          591         626          670                   Dette extérieure totale
  Private                                      0           0           0           0           0               0            0            0            0                                   Privée
  Public                                     341         415         452         440         437             540          591         626          670                                 Publique
Total external debt service                   16          18          22          23          23              24           27          29           32            Service de la dette extérieure
Net Foreign Direct Investment                                                                                                                              Investissements étranger direct (flux
                                               4          14          39          59         164             195          234         100            ...
Inflows                                                                                                                                                                          nets entrants)
Net Total Official Development                                                                                                                                Aide publique au développement
                                              74          79          64          74         115             112          121         162            ...
assistance                                                                                                                                                                       (nette totale)


                                                                                                    African Statistical Yearbook 2011 / Annuaire Statistique pour l'Afrique 2011
Djibouti                                                                                                                                    Djibouti

                                                  2002     2003     2004     2005     2006     2007     2008     2009     2010

         US $ (Millions)                                                                                                                       Franc Djiboutien
         Exports, fob                                                                                                                          Exportations, fàb


         Exports - Total                             ...      ...      ...      ...      ...      ...      ...      ...      ...                 Exportations - Total


         Main Products                                                                                                                         Principaux produits


         Oils petroleum, bituminous,                                                                                                   Huiles de pétrole, bitumineux,
                                                      8        6        0        0       1        27       28       20       ...
         distillates, except crude                                                                                                                 distilles, sauf brut


         Bovine, live except pure-bred
                                                      0        0        0        1       1        24       43       44       ...       Bovins vivants excepté laitiers
         breeding


         Animals, live                                0        0        0        0       2        15       41       28       ...                    Animaux, vivants


         Prefabricated buildings                      0        0        0        0       0         0        7        0       ...              Bâtiments préfabriqués


         Food preparations nes                        0        1        0        0       0         0        6        8       ...            Préparations alimentaires

         Main Destinations                                                                                                               Principales destinations

         Ethiopia                                  60.3     26.8     11.0     69.3    176.2      0.5      5.8      0.1       ...                              Ethiopie


         Saudi Arabia                               0.3      0.2      0.3      0.1      0.2    125.0    130.5    104.0       ...                      Arabie Saoudite


         Yemen                                     26.1      6.7      0.5      1.9      0.2      0.6      0.4      0.4       ...                               Yémen


         Kenya                                       ...      ...      ...     1.5      0.0     26.7     22.0      0.6       ...                                Kenya


         Egypt, Arab Rep.                           7.4      3.9      1.0      1.3      7.3      6.7     13.9     15.6       ...                               Egypte


                                                  2002     2003     2004     2005     2006     2007     2008     2009     2010
         Imports, cif                                                                                                                          Importations, cif

154      Imports - Total                            505      954      757    1 659    2 321    2 335    2 045    1 995       ...       Importations - Total (millions)


                                                                                                                                               Principaux produits
         Main Products


                                                                                                                                      Huile de palme et ses fractions,
         Palm oil and its fractions refined but
                                                      8       19       14       13      22        61      117      122       ...   raffinées, mais non chimiquement
         not chemically modified
                                                                                                                                                            modifiées
         Petroleum oils&oils obtained from
                                                                                                                                       Huiles de pétrole, bitumineux,
         bituminous minerals,o/than crude             3      164        4      659    1 052      777      103       17       ...
                                                                                                                                                   distilles, sauf brut
         etc

         Wheat nes and meslin                        35        9        5       23      16         4       63       91       ...                    Blé nda et méteil

         Diammonium phosphate, in                                                                                                  Diammonium phosphate, dans des
                                                     ...      ...      ...      ...      4        22       54        9       ...
         packages weighing more than 10 kg                                                                                               colis pesant plus de 10 kg


         Grain sorghum                                0        0        0        0       0         0       52       10       ...                      Sorgho à grains


         Main Origin                                                                                                                     Principales provenances

         Saudi Arabia                                ...   281.2       ...   676.8    939.6    640.1       ...      ...      ...                      Arabie Saoudite

         India                                     30.3     52.8    116.5    194.6    339.9    405.0    394.0    249.3       ...                                  Inde

         China                                     49.8     65.9     72.2    111.5    155.0    166.9    252.3    294.6       ...                                Chine

         United Arab Emirates                      49.2    104.3    146.3    178.5    245.9    286.0    273.1    271.0       ...                                Kenya

         Ethiopia                                  54.3     99.4     26.8     53.5     53.7     59.9     57.3     51.6       ...                              Ethiopie


      African Statistical Yearbook 2011 / Annuaire Statistique pour l'Afrique 2011
Egypt                                                                                                                                                                                      Egypte

AREA (KM 2)                                                                                       1 001 449                                                                      SUPERFICIE (KM 2)
CAPITAL CITY                             Cairo                                                                                                 Le Caire                                      CAPITALE
CURRENCY                                 Egyptian Pound                                                                                  Pound Egyptien                                      MONNAIE


                         I SOCIAL AND DEMOGRAPHIC INDICATORS — INDICATEURS DEMOGRAPHIQUES ET SOCIAUX

                                            2002         2003         2004         2005         2006             2007         2008         2009         2010
Population                                                                                                                                                                                Population
                                                                                                                                                                       Population au milieu de l'année -
Mid-year population - Total (Million)          72.9         74.3         75.7         77.2         78.6            80.1          81.5         83.0         84.5
                                                                                                                                                                                          Total (million)
                                                                                                                                                                       Population au milieu de l'année -
Mid-year population - Urban (%)                42.6         42.6         42.6         42.6         42.6            42.6          42.7         42.7         42.8
                                                                                                                                                                                          Urbaine (%)

Female (%)                                     49.7         49.7         49.7         49.7         49.7            49.7          49.7         49.7         49.7                              Femme (%)


Population by Age Group                                                                                                                                                    Population par groupe d'âge


   0-14                                   25764 523    25685 413    25660 051    25724 498    25893 033       26151 775     26473 338    26816 268    27148 626                                      0-14


   15-64                                  43946 746    45333 596    46689 854    47975 464    49175 972       50301 538     51367 413    52399 596    53418 439                                     15-64


   65+                                     3536 829     3648 481     3757 667     3862 662     3961 306        4056 354      4156 915     4275 298     4419 921                                       65+


Active Population (000)                    22 864.0     23 490.0     24 108.0     24 702.0     25 330.0         25 743.0     26 338.0     27 411.0     28 006.0                  Population active (000)

   Female (%)                                  24.0         24.0         24.0         24.0         24.0            24.0          24.0         23.0         23.0                              Femme (%)

                                                                                                                                                                      Taux brut de natalité - Total (par
Crude birth rate - Total (per 1000)            26.0         26.0         25.0         25.0         25.0            25.0          25.0         24.0         25.0
                                                                                                                                                                                                 1000)
                                                                                                                                                                     Taux brut de mortalité - Total (par
Crude death rate - Total (per 1000)             6.0          6.0          6.0          6.0          6.0              6.0          6.0          6.0          6.0
                                                                                                                                                                                                  1000)
Life expectancy at birth - Total                                                                                                                                      Espérance de vie à la naissance -
                                               69.0         69.0         69.0         70.0         70.0            70.0          70.0         70.0         70.0
(years)                                                                                                                                                                                 Total (années)
Net reproduction rate - (per                                                                                                                                           Taux net de reproduction - (par
                                                 ...          ...          ...         1.0           ...              ...          ...          ...         1.0
woman)                                                                                                                                                                                        femme)
                                                                                                                                                                      Indice synthétique de fécondité -
Total fertility rate - (per woman)              3.0          3.0          3.0          3.0          3.0              3.0          3.0          3.0          3.0
                                                                                                                                                                                          (par femme)

Education                                                                                                                                                                             Enseignement

Teaching staff at first level - Total                                                                                                                               Personnel enseignant - 1er degré -
                                             349.18        354.9        362.7        373.1        376.7           368.8            ...          ...          ...
(thousands)                                                                                                                                                                            Total (milliers)
Teaching staff at second level -                                                                                                                                   Personnel enseignant - 2ème degré -
                                             480.69        485.2        487.7        491.8        489.0           490.5            ...          ...          ...
Total (thousands)                                                                                                                                                                       Total (milliers)
                                                                                                                                                                                                             155
Teaching staff at third level - Total                                                                                                                              Personnel enseignant - 3ème degré -
                                                 ...        72.6         80.7           ...          ...              ...          ...          ...          ...
(thousands)                                                                                                                                                                             Total (milliers)
First level student enrollment - Total                                                                                                                                Elèves inscrits - 1er degré - Total
                                              7 855        7 874        7 928        9 564        9 795           9 988            ...          ...          ...
(thousands)                                                                                                                                                                                     (milliers)
First level student enrollment -                                                                                                                                   Elèves inscrits - 1er degré - Femmes
                                              3 721        3 749        3 796        4 527        4 643           4 754            ...          ...          ...
Female (thousands)                                                                                                                                                                              (milliers)
Second level student enrollment -                                                                                                                                   Elèves inscrits - 2ème degré - Total
                                              8 360        8 384        8 330           ...          ...              ...          ...          ...          ...
Total (thousands)                                                                                                                                                                              (milliers)
Second level student enrollment -                                                                                                                                         Elèves inscrits - 2ème degré -
                                              3 936        3 965        3 947           ...          ...              ...          ...          ...          ...
Female (thousands)                                                                                                                                                                    Femmes (milliers)
Third level student enrollment -                                                                                                                                    Elèves inscrits - 3ème degré - Total
                                                 ...     2 153.9      2 299.7      2 397.4      2 440.7          2 501.3      2 488.4           ...          ...
Total (thousands)                                                                                                                                                                              (milliers)
Third level student enrollment -                                                                                                                                          Elèves inscrits - 3ème degré -
                                                 ...          ...       982.4           ...          ...              ...          ...          ...          ...
Female (thousands)                                                                                                                                                                    Femmes (milliers)
Public expenditure on education (%                                                                                                                                    Dépenses publiques consacrées à
                                                5.2         16.2         15.5         16.0         12.0            12.6            ...          ...          ...
of budget)                                                                                                                                                              l'enseignement (% du budget)

Health                                                                                                                                                                                           Santé

Hospital beds - Total (per 10 000                                                                                                                                     Nombre de lits d'hôpitaux - Total
                                               307          308          310          311          229              245            ...          ...          ...
population)                                                                                                                                                                             (pour 10 000)
Nurses - Total (per 10 000                                                                                                                                           Nombre d'infirmières - Total (pour
                                                 ...        270          276          278          281              283            ...          ...          ...
population)                                                                                                                                                                                    10 000)
Physicians - Total (per 10 000                                                                                                                                       Nombre de médecins - Total (pour
                                               226          220          226          226          226              227            ...          ...          ...
population)                                                                                                                                                                                  10 000)
Public expenditure on Health (% of                                                                                                                                 Dépenses publiques consacrées à la
                                                  8            8            7            7            7               ...          ...          ...          ...
budget)                                                                                                                                                                          santé (% du budget)


                                                                                                           African Statistical Yearbook 2011 / Annuaire Statistique pour l'Afrique 2011
Egypt                                                                                                                                                                 Egypte
                                                               II NATIONAL ACCOUNTS — COMPTES NATIONAUX

                                                  2002       2003       2004       2005       2006        2007       2008         2009          2010

          Gross domestic product by kind of economic activity at current prices
                                                                                                   Produit intérieur brut par branche d'activité économique aux prix courants


          Egyptian Pound (Millions)                                                                                                                          Pound Egyptien(Millions)

          Agriculture                              58 369     63 822     69 252     75 291     81 766      99 953    113 104     135 465       160 970                             Agriculture

          Mining and quarrying                     29 360     42 348     57 427     64 026     89 834     103 656    133 674     147 966       165 747                   Industries extractives

          Manufacturing                            70 084     72 244     83 651     89 981     98 693     114 475    139 003     164 523       194 290             Industries manufacturières

          Electricity, gas & water                  7 455      8 021      8 664      9 778     11 038      12 270     14 166      16 020        18 287                  Electricité, gaz et eau

          Construction                             16 560     16 710     18 502     20 106     23 763      30 175     36 780      44 026        52 609           Bâtiments et travaux publics
          Wholesale & retail trade,                                                                                                                           Commerce de gros et de détail,
                                                   49 416     51 711     63 354     73 079     82 381     102 081    125 806     147 780       173 802
          restaurants, hotels                                                                                                                                          restaurants et hôtels
                                                                                                                                                               Banques, assurances, affaires
          Finance, insurance, real estate, etc.    44 191     46 718     51 131     55 463     60 350      75 179     86 465      98 389       112 957
                                                                                                                                                                               immobilières
          Transport and communications             31 952     36 536     44 305     51 915     59 892      76 735     90 669      98 973       108 021        Transport(s) et communications
                                                                                                                                                                  Administrations publiques et
          Public administration and defense        35 269     39 925     46 293     51 755     56 930      64 220     79 737      98 575       114 974
                                                                                                                                                                                      défense
          Other services                           11 908     12 586     13 744     15 118     16 498      31 643     35 898      39 466        45 694                         Autres services
                                                                                                                                                          Moins Services d’intermédiation
          Less Imputed Service Charges                 ...        ...        ...        ...        ...         ...        ...          ...           ...
                                                                                                                                                                                   financière
          Gross domestic product at factor                                                                                                             Produit intérieur brut aux couts des
                                                  354 564    390 619    456 322    506 511    581 144     710 388    855 302     991 183     1 147 350
          cost / basic prices                                                                                                                                        facteurs / prix de base

          Plus: Indirect Taxes / taxes on                                                                                                                  Plus taxes indirectes/impôts sur les
                                                   27 136     26 881     28 978     31 989     36 556      34 413     40 198      51 117        59 250
          products, less subsidies                                                                                                                             produits, moins les subventions


          Expenditure on Gross domestic product at current purchaser's values
                                                                                                              Emploi du produit intérieur brut aux prix courants d'acquisition

          Egyptian Pound (Millions)                                                                                                                          Pound Egyptien(Millions)
                                                                                                                                                                    Consommation finale des
          Government final consumption             45 200     52 900     61 900     68 600     75 900      84 400     97 500     118 300       134 700
                                                                                                                                                                    administrations publiques

          Private final consumption               285 500    304 900    347 800    385 300    436 100     539 200    647 600     793 200       901 700            Consommation finale privée

          Gross fixed capital formation            67 500     68 100     79 600     96 500    115 700     155 300    199 500     197 100       224 400         Formation brute de capital fixe

          Increase in inventories                   1 700      2 400      2 600       300           0           0      1 000       2 900         3 500                    Variation des stocks

          Exports of goods and services            68 000     91 000    137 000    163 400    185 000     225 300    295 900     260 100       257 600       Exportations de biens et services

156       Less imports of goods and services       86 200    101 800    143 600    175 600    195 000     259 400    346 000     329 300       315 300
                                                                                                                                                               Moins importations de biens et
                                                                                                                                                                                     services
          GDP at purchasers' values               381 700    417 500    485 300    538 500    617 700     744 800    895 500    1 042 300    1 206 600               PIB aux prix d'acquisition


          Gross domestic product by kind of economic activity at constant
                                                                                                 Produit intérieur brut par branche d'activité economique aux prix constants
          prices
          Annual Growth Rates (%)                                                                                                                  Taux de croissance annuel (%)
          Agriculture                                21.2        4.9        1.4        3.3        3.2         3.7        3.3          3.2          3.5                             Agriculture

          Mining and quarrying                       82.4        2.9        2.3        0.6       20.8         3.9        3.6          5.9          0.9                   Industries extractives

          Manufacturing                              22.2        1.0        3.1        4.4        5.8         7.3        8.0          3.7          5.1             Industries manufacturières

          Electricity, gas & water                    9.1        6.0        6.6        6.3        8.2         6.5        7.6         10.6          6.4                  Electricité, gaz et eau

          Construction                               13.7       -5.2        4.7        5.0       14.0        15.8       15.7         11.4         13.2           Bâtiments et travaux publics
          Wholesale & retail trade,                                                                                                                                 Commerce de gros et de
                                                    -10.6        2.4       10.5        6.7        6.0         9.4       10.8          2.4          7.7
          restaurants, hotels                                                                                                                                     détail,restaurants et hôtels
                                                                                                                                                                Banques, assurances, affaires
          Finance, insurance, real estate, etc.      83.2        2.3        2.8        3.7        4.8        11.5        6.7          4.6          5.3
                                                                                                                                                                                 immobilières
          Transport and communications               15.8        9.5        8.1        9.7        8.7         6.2       12.7          6.4          6.2        Transport(s) et communications
                                                                                                                                                                  Administrations publiques et
          Public administartion and defense          56.6        2.4        2.7        3.0        3.4         3.4        2.7          7.1          4.3
                                                                                                                                                                                      défense
          Other services                            -51.0        4.2        3.5        3.5        4.9         6.8        5.1         -2.4          5.0                         Autres services
                                                                                                                                                          Moins Services d’intérmediation
          Less Imputed Service Charges                 ...        ...        ...        ...        ...                    ...          ...           ...
                                                                                                                                                                                   financière
          Gross domestic product at factor                                                                                                             Produit intérieur brut aux couts des
                                                     19.5        3.0        4.3        4.6        6.9         7.1        7.2          4.7          5.1
          cost / basic prices                                                                                                                                        facteurs / prix de base

          Plus: Indirect Taxes / taxes on                                                                                                                  Plus taxes indirectes/impôts sur les
                                                      4.0        6.1        0.7        2.6        5.5         7.6        9.6         10.2          -2.2
          products, less subsidies                                                                                                                             produits, moins les subventions

          Gross domestic product at market                                                                                                                   Produit intérieur brut aux prix du
                                                     18.3        3.2        4.1        4.5        6.8         7.1        7.3          4.9          4.8
          prices                                                                                                                                                                       marché


          Break in the serie from 2002 and 2007                                                                                              Rupture de la série à partir 2002 et 2007


      African Statistical Yearbook 2011 / Annuaire Statistique pour l'Afrique 2011
Egypt                                                                                                                                                                                    Egypte

Expenditure on Gross domestic product at constant purchasers'
                                                                                                                         Emplois du produit intérieur brut aux prix constants d'acquisition
values

Annual Growth Rates (%)                                                                                                                                    Taux de croissance annuel (%)
                                                                                                                                                                             Consommation finale des
Government final consumption                    39.1            2.7           2.0           2.8           3.1              0.2       2.1        5.6        4.5
                                                                                                                                                                             administrations publiques

Private final consumption                       16.5            2.3           2.1           4.8           6.4              6.9       5.7        5.7        5.1            Consommation finale privée

Gross fixed capital formation                   16.2           -8.7           6.2          14.2          13.8             23.8      15.5       -9.1        2.1         Formation brute de capital fixe

Exports of goods and services                   22.8           13.8          25.3          20.2          21.3             23.3      28.8      -14.5       -3.0       Exportations de biens et services

                                                                                                                                                                       Moins importations de biens et
Less imports of goods and services              22.2            1.3          17.2          23.8          21.8             28.8      26.3      -17.9       -3.2
                                                                                                                                                                                             services


                                                                                           III INFLATION

                                             2002           2003          2004          2005          2006             2007       2008      2009        2010
Annual Growth Rates (%)                                                                                                                                    Taux de croissance annuel (%)
All Item                                         2.4            3.2          12.9           8.8           4.1             11.2      11.7      16.2          ...                              Ensemble

Food                                              ...            ...           ...           ...           ...              ...       ...        ...        ...                           Alimentation

Health                                            ...            ...           ...           ...           ...              ...       ...        ...        ...                                   Santé

Energy                                            ...            ...           ...           ...           ...              ...       ...        ...        ...                                 Energie

Transport                                         ...            ...           ...           ...           ...              ...       ...        ...        ...                              Transport


                                                        IV AGRICULTURAL PRODUCTION - PRODUCTION AGRICOLE

                                             2002           2003          2004          2005          2006             2007       2008      2009        2010
Tons (Thousand)                                                                                                                                                                 Tonnes (milliers)
Wheat, Tons (thousands)                       6 625          6 845         7 178         8 141         8 274            7 379      7 977         ...        ...                   Blé, tonnes (milliers)

Maize, Tons (thousands)                       6 431          6 530         6 236         7 085         6 374            6 243      6 544         ...        ...                 Maïs, tonnes (milliers)

Tomato, Tons (thousands)                      6 778          7 140         7 641         7 600         7 650            7 550         ...        ...        ...             Tomates, tonnes (milliers)

Rice, Tons (thousands)                        6 105          6 176         6 352         6 125         6 755            6 665         ...        ...        ...                   Riz, tonnes (milliers)

Sugar beets, Tons (thousands)                 3 168          2 692         2 861         3 430         5 300            5 600         ...        ...        ... Betteraves à sucre, tonnes (milliers)


                                                              V MINING PRODUCTION - PRODUCTION MINIERE
                                                                                                                                                                                                           157
                                             2002           2003          2004          2005          2006             2007       2008      2009        2010

Crude petroleum, metric tons                                                                                                                                            Pétrole brut, tonnes métriques
                                            30 706.0       30 549.0      29 040.0      27 044.0      25 934.0         26 354.0        ...        ...        ...
(thousands)                                                                                                                                                                                   (milliers)
Natural gas (terajoules)                  1076 806.0     1214 024.0    1311 413.0    1933 144.0    2074 343.0       2136 170.0        ...        ...        ...                Gaz naturel (térajoules)

Natural phosphates, P205 content,                                                                                                                                      Phosphates naturels, teneur en
                                              434.0          630.0         650.0         622.0         650.0            650.0         ...        ...        ...
metric tons (thousands)                                                                                                                                              P205, tonnes métriques (milliers)


                                                                                      VI ENERGY - ENERGIE

                                             2002           2003          2004          2005          2006             2007       2008      2009        2010

Electricity - total hydro production,                                                                                                                              Électricité - production hydraulique
                                            15 130.0       12 303.0      12 644.0      12 644.0      12 925.0         15 510.0        ...        ...        ...
kilowatt hours (millions)                                                                                                                                             totale, kilowatt-heures (millions)

Electricity - total thermal production,                                                                                                                              Électricité - production thermique
                                            70 603.0       79 343.0      88 132.0      98 494.0     104 866.0        111 788.0        ...        ...        ...
kilowatt hours (millions)                                                                                                                                             totale, kilowatt-heures (millions)

Electricity - total production, self-                                                                                                                             Electricité - Production totale privée
                                              2 950          2 950         2 950         3 000         3 000            3 000         ...        ...        ...
producer (Million Kilowatt Hours)                                                                                                                                           (million de kilowatt heures)

Electricity - total production, public                                                                                                                                   Electricité - Production totale
                                             82 996         88 982        98 349       108 690       115 407          125 129         ...        ...        ...
(Million Kilowatt Hours)                                                                                                                                          publique (million de kilowatt heures)


                                                                                                                 African Statistical Yearbook 2011 / Annuaire Statistique pour l'Afrique 2011
Egypt                                                                                                                                                                          Egypte
                                                  VII TOURISM AND INFRASTRUCTURE - TOURISME ET INFRASTUCTURE

                                                  2002        2003        2004        2005        2006        2007         2008         2009             2010

         Arrivals - Tourists (thousands)             5192        6045        8104        8608        9083      10610        12296             ...             ...        Arrivées - touristes (milliers)

         Rooms in hotels and similar                                                                                                                              Chambres d'hotels et établissements
         establishments (thousands)               132.109      136.51     148.039     170.776     177.613           ...          ...          ...             ...                  assimilés (milliers)

         Paved Road (% of total)                        ...         ...         ...         ...        81           ...          ...          ...             ...     Routes asphaltées (% du total)
         Total Network (Railways-km)                5 150           ...     5 150       5 150       5 195       5 195            ...          ...             ...      Réseau total voies ferrées-Km
         Main Telephone Lines (per 1,000                                                                                                                             Lignes téléphoniques fixes (pour
                                                      106         118         125         135         139         141          146            ...             ...
         inhabitants)                                                                                                                                                                 1000 habitants)
         Mobile Cellular Subscribers (per                                                                                                                            Abonnés aux téléphones mobiles
                                                       62          78         101         177         229         376          506            ...             ...
         1,000 inhabitants)                                                                                                                                                     (pour 1000 habitants)


                                        VII FINANCIAL AND MONETARY STATISTICS - FINANCES ET STATISTIQUES MONETAIRES

                                                  2002        2003        2004        2005        2006        2007         2008         2009             2010

         VII-1 Monetary Statistics                                                                                                                             VII-1 Statistiques monétaires
         Egyptian Pound (Millions)                                                                                                                                  Pound Egyptien(Millions)
         Money supply (M1)                         75 781      93 520     102 543     120 468     142 601     178 676      200 349      226 097         258 433                Masse monétaire (M1)
         Quasi-money                              257 031     310 114     366 416     402 389     458 708     537 599      591 029      640 257         704 822                        Quasi-monnaie
           of which Demand Deposit                      ...         ...         ...         ...         ...         ...          ...          ...             ...            dont Monnaie scripturale
         Net foreign assets                        18 043      32 806      54 108     111 639     187 997     231 587      247 440      255 846         304 920                 Avoirs extérieurs nets
         Domestic credit                          384 807     436 655     508 289     527 845     574 256     626 722      695 790      782 844         846 112                        Crédit intérieur

         of which claims on private sector        207 089     225 023     262 270     275 526     304 470     338 997      383 252      376 158         416 976     dont créances sur le secteur privé

         of which Claims on government                                                                                                                                   dont créances nettes sur le
                                                  127 180     158 140     186 352     179 036     191 057     196 026      229 002      311 935         322 948
         sector, net                                                                                                                                                                  gouvernement
         International reserves (millions of US                                                                                                                 Réserves internationales (millions de
                                                   13 242      13 589      14 273      20 609      24 462      30 188       32 216       32 253          33 154
         $)                                                                                                                                                                                     $ EU)
         Average Exchange Rate (National                                                                                                                         Taux de change (moyen) (monnaie
                                                     4.50        5.85        6.20        5.78        5.73        5.64         5.43         5.54            5.61
         Currency per us $)                                                                                                                                                    nationale par dollars)


         VII-2 Public Finance                                                                                                                                        VII-2 Finances publiques
         Egyptian Pound (Millions)                                                                                                                                  Pound Egyptien(Millions)
         Total Revenues and Grants                 78 318      89 146     101 879     109 987     149 520     180 216      218 500      278 569         224 987              Recettes totales et dons
           Tax Revenue                             50 801      55 736      67 158      75 960      98 029     114 327      137 378      163 182         145 544                       Recettes fiscales
           Non Tax Revenue                          4 265       3 290       5 050       3 497       1 584       3 886          971        7 646           7 700                  Recettes non fiscales
           Grants                                  23 252      30 120      29 671      30 530      49 907      62 003       80 151      107 740          71 743                                    Dons
158
         Total Expenditures and Net Lending       115 542     127 320     145 988     158 434     204 463     222 029      277 432      347 679         323 917        Dépenses totales et prêts nets

           Current expenditure                     95 766     107 069     123 137     137 195     184 776     196 531      245 337      305 541         287 438                   Dépenses courantes
           Of which Wages and Salaries             30 516      33 816      37 266      41 190      45 918      52 153       62 062       75 194          87 484        Dont rémunérations et salaires
           Capital expenditure                     19 776      20 251      22 851      21 239      19 687      25 498       32 095       42 138          36 480               Dépenses d'équipement
           Net Lending                                   0           0           0           0           0           0            0            0               0                             Prêts nets
         Fiscal Balance                           - 37 224    - 38 174    - 44 109    - 48 448    - 54 943    - 41 813     - 58 932     - 69 110        - 98 931      Solde global y compris les dons


         VII-3 Balance of Payments                                                                                                                              VII-3 Balance des paiements
         Egyptian Pound (Millions)                                                                                                                                  Pound Egyptien(Millions)
         Trade balance                            - 33 820    - 38 709    - 48 540    - 59 866    - 68 717    - 91 864    - 127 203    - 140 122       - 140 856                 Balance commerciale
         Services Balance                          16 378      29 581      46 624      46 785      43 916      58 201       73 920       69 591          82 448                  Balance des services
         Net Income                                   431       - 627      - 1 281        578       4 587       8 459        7 606        5 566         - 24 474                         Revenus nets
         Current transfers, net total              19 133      21 118      24 377      32 939      33 252      46 805       53 239       37 851          58 672                   Transferts courants
         Current account balance                    2 122      11 362      21 179      20 436      13 038      21 601        7 561      - 27 114        - 24 210            Solde du compte courant


         VII-4 External Debt and Financial Flows                                                                                                    VII-4 Dette extérieure et flux financiers
         US $ (Millions)                                                                                                                                                          $ E.U (Millions)
         Total external debt                       28 661      29 396      29 872      28 949      29 593      29 898       33 892       31 531          30 969                Dette extérieure totale
           Private                                  2 530       2 190       2 258       1 732       4 431       4 209        3 745        3 289           4 249                                  Privée
           Public                                  26 132      27 206      27 614      27 217      25 162      25 689       30 147       28 242          26 720                                Publique
         Total external debt service                3 788       3 890       3 874       4 175       5 150       4 160        4 451        5 664           4 521         Service de la dette extérieure
         Net Foreign Direct Investment                                                                                                                                Investissements étranger direct
                                                      647         237       2 157       5 376      10 043      11 578        9 495        6 712               ...
         Inflows                                                                                                                                                                  (flux nets entrants)
         Net Total Official Development                                                                                                                              Aide publique au développement
                                                    1 231         982       1 506         994         873       1 107        1 344          925               ...
         assistance                                                                                                                                                                      (nette totale)


      African Statistical Yearbook 2011 / Annuaire Statistique pour l'Afrique 2011
Egypt                                                                                                                                                        Egypte

                                    2002      2003      2004      2005      2006            2007      2008       2009       2010

US $                                                                                                                                                  Pound Egyptien
Exports, fob                                                                                                                                       Exportations, fàb


Exports - Total                      7 121     8 205    10 453    13 833    18 455          22 018     29 356    25 169         ...                   Exportations - Total


Main Products                                                                                                                                       Principaux produits


Crude Oil                              686     1 117     1 414     1 938     3 214           3 128      4 911     4 004         ...                            Pétrole brut


Peutroleum Products                  1 695     2 044     2 497     3 361     7 009           6 980      9 562     7 000         ...                     Produits pétroliers


Cotton                                  83       199       202       138       146             110       194         83         ...                                  Coton


Carbon                                  20        47        21        10        25              27        75         74         ...                                 Carbon


Rice                                    79        63        58       141       136             146       162         77         ...                                     Riz

Main Destinations                                                                                                                              Principales destinations

United States                       1 416.6   1 219.3   1 438.6   2 221.0   2 573.4         2 545.0   2 484.4    2 169.4        ...                              États-Unis


Italy                               1 059.6   1 120.2   1 587.2   1 582.5   2 674.0         2 491.3   3 296.3    2 009.4        ...                                   Italie


Spain                                249.2     373.5     567.9    1 321.2   1 992.0         2 017.6   2 327.7    1 999.4        ...                               Espagne


United Kingdom                       620.3     745.4     864.9     605.2    1 090.5         1 071.4   1 039.9     877.4         ...                          Royaume-Uni


India                                198.5     143.8     125.0     228.5    1 414.4         1 877.3   2 081.4    1 716.9        ...                                    Inde


                                    2002      2003      2004      2005      2006            2007      2008       2009       2010
Imports, cif                                                                                                                                        Importations, cif

Imports - Total                     12 496    10 893    12 841    19 812    20 594          27 033     52 772    44 934         ...         Importations - Total (millions)
                                                                                                                                                                               159
                                                                                                                                                    Principaux produits
Main Products


Wheat nes and meslin                   636       679       898       774     1 015           1 870      2 079     1 551         ...                      Blé nda et méteil


Petroleum oils&oils obtained from
                                                                                                                                            Huiles de pétrole, bitumineux,
bituminous minerals,o/than crude        54       111       100       868     1 262           1 556      1 303     1 699         ...
                                                                                                                                                        distilles, sauf brut
etc
Automobiles w reciprocatg piston                                                                                                      Automobiles w reciprocatg moteur à
engine displacg > 1500 cc to 3000       72       125       163       421       599             854      1 080       876         ...
                                                                                                                                       piston displacg> 1500 cc à 3000 cc
cc
Ferrous waste and scrap, iron or                                                                                                        Déchets et débris de fonte, fer ou
                                        61        75       211       262       489             465      1 062       331         ...
steel, nes                                                                                                                                                      acier, nda


Maize, nes                             485       518       426       519       456             803       924        845         ...                              Maïs, nda


Main Origin                                                                                                                                   Principales provenances

United States                       2 866.2   2 659.4   3 104.5   3 168.9   4 103.8         5 347.1   6 030.8    5 257.6        ...                              États-Unis

China                                852.9     936.8    1 388.4   1 934.0   2 975.5         4 468.1   5 874.3    5 107.4        ...                                  Chine

Germany                             1 295.6   1 462.3   1 774.5   2 109.4   2 386.1         2 929.4   3 926.7    3 716.6        ...                             Allemagne

Italy                               1 113.0   1 333.9   1 654.2   1 699.9   1 911.7         2 924.7   4 248.1    3 609.8        ...                                   Italie

France                               970.9    1 114.8   1 257.1   1 765.2   1 670.9         1 649.0   1 778.9    1 906.7        ...                                 France


                                                                                      African Statistical Yearbook 2011 / Annuaire Statistique pour l'Afrique 2011
Equatorial Guinea                                                                                                                              Guinée Equatoriale

         AREA (KM 2)                                                                               28 051                                                                SUPERFICIE (KM 2)
         CAPITAL CITY                            Malabo                                                                                         Malabo                               CAPITALE
         CURRENCY                                CFA Franc                                                                                   Franc CFA                               MONNAIE


                                 I SOCIAL AND DEMOGRAPHIC INDICATORS — INDICATEURS DEMOGRAPHIQUES ET SOCIAUX

                                                   2002       2003       2004       2005       2006         2007       2008       2009           2010
         Population                                                                                                                                                               Population
                                                                                                                                                              Population au milieu de l'année -
         Mid-year population - Total (Million)         0.6        0.6        0.6        0.6        0.6          0.6        0.7        0.7            0.7
                                                                                                                                                                                 Total (million)
                                                                                                                                                              Population au milieu de l'année -
         Mid-year population - Urban (%)              38.8       38.8       38.9       38.9       39.0         39.2       39.3       39.5           39.7
                                                                                                                                                                                 Urbaine (%)

         Female (%)                                   50.5       50.5       50.5       50.5       50.5         50.4       50.4       50.4           50.4                            Femme (%)


         Population by Age Group                                                                                                                                   Population par groupe d'âge


            0-14                                   243 869    248 378    252 745    257 215    261 864      266 682    271 718    276 995        282 531                                    0-14


            15-64                                  297 399    308 725    320 396    332 200    344 069      355 996    367 871    379 595        391 098                                   15-64


            65+                                     19 134     19 239     19 325     19 392     19 461       19 532     19 608     19 683         19 756                                    65+


         Active Population (000)                     200.6      208.9      217.4      225.9      234.4        242.9      251.3      261.3          269.9                Population active (000)

            Female (%)                                28.2       28.7       29.1       29.4       29.7         29.9       30.1       30.9           31.1                            Femme (%)

                                                                                                                                                              Taux brut de natalité - Total (par
         Crude birth rate - Total (per 1000)          39.0       39.0       39.0       38.0       38.0         38.0       38.0       38.0           38.0
                                                                                                                                                                                          1000)
                                                                                                                                                            Taux brut de mortalité - Total (par
         Crude death rate - Total (per 1000)          16.0       16.0       16.0       16.0       16.0         15.0       15.0       15.0           15.0
                                                                                                                                                                                         1000)
         Life expectancy at birth - Total                                                                                                                     Espérance de vie à la naissance -
                                                      49.0       49.0       49.0       49.0       50.0         50.0       50.0       51.0           50.0
         (years)                                                                                                                                                                Total (années)
         Net reproduction rate - (per                                                                                                                          Taux net de reproduction - (par
                                                        ...        ...        ...       2.0         ...          ...        ...        ...           2.0
         woman)                                                                                                                                                                        femme)
                                                                                                                                                              Indice synthétique de fécondité -
         Total fertility rate - (per woman)            6.0        6.0        6.0        6.0        5.0          5.0        5.0        5.0            5.0
                                                                                                                                                                                  (p femme)
                                                                                                                                                                                  (par        )

         Education                                                                                                                                                           Enseignement

         Teaching staff at first level - Total                                                                                                            Personnel enseignant - 1er degré -
                                                        ...       2.3         ...        ...        ...          ...       2.9        3.4             ...
         (thousands)                                                                                                                                                         Total (milliers)
         Teaching staff at second level -                                                                                                                   Personnel enseignant - 2ème degré
                                                        ...        ...        ...        ...        ...          ...        ...        ...            ...
160      Total (thousands)                                                                                                                                                    - Total (milliers)
         Teaching staff at third level - Total                                                                                                              Personnel enseignant - 3ème degré
                                                        ...        ...        ...        ...        ...          ...        ...        ...            ...
         (thousands)                                                                                                                                                          - Total (milliers)
         First level student enrollment -                                                                                                                     Elèves inscrits - 1er degré - Total
                                                       78         74          ...       76          ...          ...       81         82              ...
         Total (thousands)                                                                                                                                                              (milliers)
         First level student enrollment -                                                                                                                           Elèves inscrits - 1er degré -
                                                       37         36          ...       37          ...          ...       39         40              ...
         Female (thousands)                                                                                                                                                   Femmes (milliers)
         Second level student enrollment -                                                                                                                  Elèves inscrits - 2ème degré - Total
                                                       21          ...        ...        ...        ...          ...        ...        ...            ...
         Total (thousands)                                                                                                                                                             (milliers)
         Second level student enrollment -                                                                                                                       Elèves inscrits - 2ème degré -
                                                         8         ...        ...        ...        ...          ...        ...        ...            ...
         Female (thousands)                                                                                                                                                  Femmes (milliers)
         Third level student enrollment -                                                                                                                   Elèves inscrits - 3ème degré - Total
                                                        ...        ...        ...        ...        ...          ...        ...        ...            ...
         Total (thousands)                                                                                                                                                             (milliers)
         Third level student enrollment -                                                                                                                        Elèves inscrits - 3ème degré -
                                                        ...        ...        ...        ...        ...          ...        ...        ...            ...
         Female (thousands)                                                                                                                                                  Femmes (milliers)
         Public expenditure on education (%                                                                                                                   Dépenses publiques consacrées à
                                                       4.0        4.0         ...        ...        ...          ...        ...        ...            ...
         of budget)                                                                                                                                             l'enseignement (% du budget)

         Health                                                                                                                                                                          Santé

         Hospital beds - Total (per 10 000                                                                                                                    Nombre de lits d'hôpitaux - Total
                                                        ...        ...       48          ...        ...          ...        ...        ...            ...
         population)                                                                                                                                                             (pour 10 000)
         Nurses - Total (per 10 000                                                                                                                          Nombre d'infirmières - Total (pour
                                                        ...        ...        ...      220          ...          ...        ...       50              ...
         population)                                                                                                                                                                   10 000)
         Physicians - Total (per 10 000                                                                                                                     Nombre de médecins - Total (pour
                                                        ...        ...       32          ...        ...          ...        ...       30              ...
         population)                                                                                                                                                                10 000)
         Public expenditure on Health (% of                                                                                                                   Dépenses publiques consacrées à
                                                       21           9          7          7          7           ...        ...        ...            ...
         budget)                                                                                                                                                      la santé (% du budget)


      African Statistical Yearbook 2011 / Annuaire Statistique pour l'Afrique 2011
Equatorial Guinea                                                                                                                                               Guinée Equatoriale
                                                            II NATIONAL ACCOUNTS — COMPTES NATIONAUX

                                          2002            2003         2004         2005         2006            2007         2008         2009         2010

Gross domestic product by kind of economic activity at current
prices                                                                                                Produit intérieur brut par branche d'activité économique aux prix courants


CFA Franc (Millions)                                                                                                                                                         Franc CFA (Millions)

Agriculture                             1 258 903       1 353 002    2 198 244    3 381 515    3 830 831       4 082 408    5 323 007    3 110 128    3 906 174                             Agriculture

Mining and quarrying                       81 443        106 782      141 746      198 399      340 569          739 171    1 347 724    1 018 522    1 500 555                   Industries extractives

Manufacturing                                  2 104       2 622        3 267        3 975        4 837            5 921       7 150        8 783        10 945             Industries manufacturières

Electricity, gas & water                       5 956       7 034       10 255       13 865       19 994           25 792      30 950       36 521        43 825                  Electricité, gaz et eau

Construction                               20 995         24 861       51 655       66 900      118 976          157 827     218 727      347 516      326 250            Bâtiments et travaux publics
Wholesale & retail trade,                  17 152         21 044       27 841       32 227       36 029           39 588      43 607       48 766        52 967        Commerce de gros et de détail,
restaurants, hotels                                                                                                                                                             restaurants et hôtels
                                                                                                                                                                        Banques, assurances, affaires
Finance, insurance, real estate, etc.          3 687       4 524        7 251       12 154       14 138           17 327      24 029       28 362        43 205
                                                                                                                                                                                        immobilières
Transport and communications                   3 353       4 114        4 465        5 168        5 778            6 049       6 663        7 398         8 036        Transport(s) et communications
                                                                                                                                                                          Administrations publiques et
Public administration and defense          30 047         34 538       34 889       42 631       46 613           57 481      58 866       74 654      129 285
                                                                                                                                                                                              défense
Other services                                 7 109      10 823       11 746       13 597       15 201           17 103      19 339       21 283        23 117                         Autres services
                                                                                                                                                                    Moins Services d’intermédiation
Less Imputed Service Charges                      ...          ...          ...          ...          ...             ...          ...          ...           ...
                                                                                                                                                                                            financière
Gross domestic product at factor                                                                                                                                Produit intérieur brut aux couts des
                                        1 430 749       1 569 343    2 491 359    3 770 431    4 432 966       5 148 666    7 080 061    4 701 933    6 044 357
cost / basic prices                                                                                                                                                           facteurs / prix de base

Plus: Indirect Taxes / taxes on                                                                                                                                     Plus taxes indirectes/impôts sur les
                                           23 518         31 026       30 905       30 243       39 061           47 061      61 985       80 075        90 253
products, less subsidies                                                                                                                                                produits, moins les subventions


Expenditure on Gross domestic product at current purchaser's values
                                                                                                                      Emploi du produit intérieur brut aux prix courants d'acquisition

CFA Franc (Millions)                                                                                                                                                         Franc CFA (Millions)
                                                                                                                                                                             Consommation finale des
Government final consumption               76 901         65 023       81 348      118 592      128 125          137 874     195 586      224 841      268 750
                                                                                                                                                                             administrations publiques

Private final consumption                 205 001        225 758      253 510      289 200      317 888          352 175     389 978      374 706      530 714             Consommation finale privée

Gross fixed capital f
G     fi d     it l formation
                         ti               462 457        679 558      659 582      824 373     1 203 687       1 596 819    2 146 431    3 321 521    3 004 007         Formation b t d capital fi
                                                                                                                                                                        F    ti brute de   it l fixe

Increase in inventories                         100          200          200          200          200             200          200          200           200                    Variation des stocks

Exports of goods and services           1 492 989       1 584 036    2 503 705    3 745 182    4 327 686       4 984 292    6 839 862    4 277 112    5 569 067       Exportations de biens et services

Less imports of goods and services        783 181        954 207      976 081     1 176 874    1 505 559       1 875 633    2 430 012    3 416 372    3 238 128
                                                                                                                                                                        Moins importations de biens et     161
                                                                                                                                                                                              services
GDP at purchasers' values               1 454 267       1 600 369    2 522 264    3 800 674    4 472 027       5 195 727    7 142 045    4 782 007    6 134 610               PIB aux prix d'acquisition


Gross domestic product by kind of economic activity at constant
                                                                                                     Produit intérieur brut par branche d'activité economique aux prix constants
prices
Annual Growth Rates (%)                                                                                                                                    Taux de croissance annuel (%)
Agriculture                                     15.6         15.2         29.3          2.4         -3.7             3.8          0.3        -10.3          -7.2                            Agriculture

Mining and quarrying                            53.4          6.1         49.8         29.3         10.3           103.1         41.4         14.5          8.1                   Industries extractives

Manufacturing                                   13.6         17.3         20.6         17.7         17.7            14.4         14.8         16.9         20.6             Industries manufacturières

Electricity, gas & water                        21.4         18.2         41.8         35.2         44.2            20.0         13.5         11.5         16.0                  Electricité, gaz et eau

Construction                                    39.5         11.1       107.8          29.5         77.8            30.8         26.6         27.1          -9.1          Bâtiments et travaux publics
Wholesale & retail trade,                                                                                                                                                    Commerce de gros et de
                                                20.9         15.4         27.3         10.8          6.8             4.4          4.2          6.0          3.6
restaurants, hotels                                                                                                                                                        détail,restaurants et hôtels
                                                                                                                                                                         Banques, assurances, affaires
Finance, insurance, real estate, etc.           16.1         19.7         55.3         62.6         11.3            17.1         35.2         15.0         47.3
                                                                                                                                                                                          immobilières
Transport and communications                    24.8         17.9          3.5         10.8          6.8            -0.3          3.2          6.0          3.6        Transport(s) et communications
                                                                                                                                                                          Administrations publiques et
Public administartion and defense               14.6         13.9          1.0         22.2          9.3            22.3          1.4         16.8         72.2
                                                                                                                                                                                              défense
Other services                                  13.1         50.2          3.1         11.1          6.8             6.5          7.9          4.1          3.6                         Autres services
                                                                                                                                                                    Moins Services d’intérmediation
Less Imputed Service Charges                      ...          ...          ...          ...          ...             ...          ...          ...           ...
                                                                                                                                                                                            financière
Gross domestic product at factor                                                                                                                                Produit intérieur brut aux couts des
                                                20.4         14.3         33.8          9.1          5.5            24.1         15.5          4.6          1.3
cost / basic prices                                                                                                                                                           facteurs / prix de base

Plus: Indirect Taxes / taxes on                                                                                                                                     Plus taxes indirectes/impôts sur les
                                                24.0         21.8        -31.4        -19.1         14.0             4.1         12.2          4.8          2.7
products, less subsidies                                                                                                                                                produits, moins les subventions

Gross domestic product at market                                                                                                                                      Produit intérieur brut aux prix du
                                                20.4         14.4         32.6          8.9          5.6            24.0         15.5          4.6          1.3
prices                                                                                                                                                                                           marché


2008: semi-final           2009: Provisional      2010:Estimated                                                            2008: semi-définitif       2009: provisoire                2010:Estimée


                                                                                                            African Statistical Yearbook 2011 / Annuaire Statistique pour l'Afrique 2011
Equatorial Guinea                                                                                                                               Guinée Equatoriale

         Expenditure on Gross domestic product at constant purchasers'
                                                                                                                   Emplois du produit intérieur brut aux prix constants d'acquisition
         values

         Annual Growth Rates (%)                                                                                                                     Taux de croissance annuel (%)
                                                                                                                                                                       Consommation finale des
         Government final consumption                78.0          -22.7        -9.0       40.8          3.0         2.1     35.9        9.0         15.5
                                                                                                                                                                       administrations publiques

         Private final consumption                   35.6            4.3       15.1          9.9        -2.2         7.3      3.2        7.5          6.8            Consommation finale privée

         Gross fixed capital formation               -29.8         44.7          0.8       15.8          9.1       27.7      30.8       33.2         -3.1         Formation brute de capital fixe

         Exports of goods and services               18.3          13.0        39.1          5.0        -3.8       12.9       8.5       -1.6         -5.9       Exportations de biens et services

                                                                                                                                                                  Moins importations de biens et
         Less imports of goods and services          -28.6         37.8         -6.6       16.1          0.3       14.2      29.9       43.8         -5.5
                                                                                                                                                                                        services


                                                                                             III INFLATION

                                                   2002          2003        2004        2005        2006        2007       2008     2009         2010
         Annual Growth Rates (%)                                                                                                                     Taux de croissance annuel (%)
         All Item                                      7.6           7.3         4.2         5.7         4.4         2.8      6.0        5.5          4.7                               Ensemble

         Food                                           ...           ...         ...         ...         ...         ...      ...        ...          ...                           Alimentation

         Health                                         ...           ...         ...         ...         ...         ...      ...        ...          ...                                  Santé

         Energy                                         ...           ...         ...         ...         ...         ...      ...        ...          ...                                Energie

         Transport                                      ...           ...         ...         ...         ...         ...      ...        ...          ...                              Transport


                                                              IV AGRICULTURAL PRODUCTION - PRODUCTION AGRICOLE

                                                   2002          2003        2004        2005        2006        2007       2008     2009         2010
         Tons (Thousand)                                                                                                                                                   Tonnes (milliers)
         Cassava, Tons (thousands)                     45            45          45          45          45          45        45         ...          ...              Manioc, tonnes (milliers)

         Sweet Potato, Tons (thousands)                36            36          36          36          36          36        36         ...          ...      Patates douces, tonnes (milliers)

         Plantains, Tons (thousands)                   31            31          31          31          31          31        31         ...          ...            Plantains, tonnes (milliers)

         Banana, Tons (thousands)                      20            20          20          20          20          20        20         ...          ...              Banane, tonnes (milliers)

         Coconuts, Tons (thousands)                      6             6           6           6           6           6        6         ...          ...        Noix de coco, tonnes (milliers)


                                                                   V MINING PRODUCTION - PRODUCTION MINIERE
162
                                                   2002          2003        2004        2005        2006        2007       2008     2009         2010

         Crude petroleum, metric tons                                                                                                                             Pétrole brut, tonnes métriques
                                                  11 410.0      12 989.0    17 662.0    17 973.0    17 144.0    17 513.0       ...        ...          ...
         (thousands)                                                                                                                                                                    (milliers)
         Natural gas (terajoules)                 18 537.0      18 773.0    25 030.0    45 030.0    55 030.0    65 250.0       ...        ...          ...               Gaz naturel (térajoules)

         Gold ores and concentrates,                                                                                                                                  Minerais d'or et concentrés
                                                    500.0         500.0       500.0           ...         ...         ...      ...        ...          ...
         Kilograms                                                                                                                                                                 (Kilogrammes)


                                                                                        VI ENERGY - ENERGIE

                                                   2002          2003        2004        2005        2006        2007       2008     2009         2010

         Electricity - total hydro production,                                                                                                               Électricité - production hydraulique
                                                       7.0           7.0         7.0         7.0         7.0         2.0       ...        ...          ...
         kilowatt hours (millions)                                                                                                                              totale, kilowatt-heures (millions)

         Electricity - total thermal                                                                                                                           Électricité - production thermique
                                                     60.0          73.0        78.0        83.0        88.0        93.0        ...        ...          ...
         production, kilowatt hours (millions)                                                                                                                  totale, kilowatt-heures (millions)

         Electricity - total production, self-                                                                                                               Electricité - Production totale privée
                                                         0             0           0           0           0           0       ...        ...          ...
         producer (Million Kilowatt Hours)                                                                                                                             (million de kilowatt heures)

                                                                                                                                                                    Electricité - Production totale
         Electricity - total production, public
                                                       67            80          85          90          95          95        ...        ...          ...           publique (million de kilowatt
         (Million Kilowatt Hours)
                                                                                                                                                                                           heures)


      African Statistical Yearbook 2011 / Annuaire Statistique pour l'Afrique 2011
Equatorial Guinea                                                                                                                                                     Guinée Equatoriale
                                          VII TOURISM AND INFRASTRUCTURE - TOURISME ET INFRASTUCTURE

                                           2002        2003           2004          2005          2006            2007          2008          2009             2010

Arrivals - Tourists (thousands)                 ...          ...           ...           ...           ...             ...           ...           ...              ...           Arrivées - touristes (milliers)

Rooms in hotels and similar                                                                                                                                               Chambres d'hotels et établissements
establishments (thousands)                                                                                                                                                                 assimilés (milliers)
                                                ...          ...           ...           ...           ...             ...           ...           ...              ...
Paved Road (% of total)                         ...          ...           ...           ...           ...             ...           ...           ...              ...        Routes asphaltées (% du total)
Total Network (Railways-km)                     ...          ...           ...           ...           ...             ...           ...           ...              ...         Réseau total voies ferrées-Km
Main Telephone Lines (per 1,000                                                                                                                                               Lignes téléphoniques fixes (pour
                                               20           20            20            20            20              20            20            10                ...
inhabitants)                                                                                                                                                                                  1000 habitants)
Mobile Cellular Subscribers (per                                                                                                                                             Abonnés aux téléphones mobiles
                                               60           70           100           160           220             340           520           660                ...
1,000 inhabitants)                                                                                                                                                                    (pour 1000 habitants)


                               VII FINANCIAL AND MONETARY STATISTICS - FINANCES ET STATISTIQUES MONETAIRES

                                           2002        2003           2004          2005          2006            2007          2008          2009             2010

VII-1 Monetary Statistics                                                                                                                                           VII-1 Statistiques monétaires
CFA Franc (Millions)                                                                                                                                                               Franc CFA (Millions)
Money supply (M1)                          73 275      114 449       170 531       234 232       261 013         372 169       523 113       611 263          928 495                   Masse monétaire (M1)
Quasi-money                                25 808       40 793        36 646        44 822        57 512          77 748        62 270        84 103           90 545                           Quasi-monnaie
  of which Demand Deposit                       ...          ...           ...           ...           ...             ...           ...           ...              ...              dont Monnaie scripturale
Net foreign assets                        104 237      153 306       499 255     1 240 660     1 573 640        1 800 190    2 237 590     1 561 250         1 060 890                  Avoirs extérieurs nets
Domestic credit                             3 410       17 270      - 269 165     - 933 619    -1 224 590      -1 339 670    -1 686 980     - 698 559          46 657                           Crédit intérieur

of which claims on private sector          52 768       50 759        62 078        92 385       124 504         175 644       362 178       401 903          567 077       dont créances sur le secteur privé

of which Claims on government                                                                                                                                                dont créances nettes sur le
                                          - 50 811     - 34 346     - 332 006    -1 027 450    -1 354 040      -1 524 060    -2 071 320    -1 124 660        - 546 357
sector, net                                                                                                                                                                                gouvernement
International reserves (millions of US                                                                                                                                  Réserves internationales (millions
                                               89          238           945         2 102         3 067           3 846         4 431         3 252            2 287
$)                                                                                                                                                                                              de $ EU)
Average Exchange Rate (National                                                                                                                                       Taux de change (moyen) (monnaie
                                           696.99       581.20        528.29        527.47        522.89          479.27        447.81        472.19           495.28
Currency per us $)                                                                                                                                                                  nationale par dollars)


VII-2 Public Finance                                                                                                                                                         VII-2 Finances publiques
CFA Franc (Millions)                                                                                                                                                               Franc CFA (Millions)
Total Revenues and Grants                 414 500      472 300       773 525     1 410 189     2 103 730        2 308 526    3 051 786     2 368 087         2 798 772                Recettes totales et dons
  Tax Revenue                             400 652      454 632       751 285     1 363 559     2 038 599        2 169 606    2 952 362     2 293 388                ...                       Recettes fiscales
  Non Tax Revenue                          13 848       17 668        22 240        46 630        65 131         138 920        99 424        74 699                ...                  Recettes non fiscales
  Grants                                         0            0             0             0             0               0             0             0               ...                                   Dons
                                                                                                                                                                                                                    163
Total Expenditures and Net Lending        227 236      257 524       484 976       609 880       954 248        1 233 481    1 759 331     2 827 522         2 716 462         Dépenses totales et prêts nets

  Current expenditure                      76 901       65 023        81 348       118 592       128 125         137 918       195 586       224 842                ...                   Dépenses courantes
  Of which Wages and Salaries              26 047       27 538        30 889        36 631        40 613          52 481        56 366        70 654                ...        Dont rémunérations et salaires
  Capital expenditure                     126 634      169 741       363 035       446 003       759 837        1 018 846    1 391 510     2 482 257                ...               Dépenses d'équipement
  Net Lending                                    0            0             0             0             0               0             0             0               ...                              Prêts nets
Fiscal Balance                            187 264      214 776       288 549       800 309     1 149 482        1 075 045    1 292 455      - 459 435          82 310         Solde global y compris les dons


VII-3 Balance of Payments                                                                                                                                            VII-3 Balance des paiements
CFA Franc (Millions)                                                                                                                                                               Franc CFA (Millions)
Trade balance                            1 121 641     908 887     1 910 726     3 035 135     3 235 187        3 570 560    4 698 955     1 226 928                ...                  Balance commerciale
Services Balance                         - 411 833    - 418 707     - 383 102     - 466 826     - 427 445       - 523 155     - 722 423     - 760 733               ...                   Balance des services
Net Income                               - 898 780    - 735 548    -1 280 682    -1 832 249    -2 385 022      -2 968 017    -3 683 736    -1 365 148               ...                           Revenus nets
Current transfers, net total               - 7 738      - 4 335      - 10 077      - 13 998      - 17 579        - 21 915      - 27 159      - 33 492               ...                    Transferts courants
Current account balance                  - 196 711    - 249 703      236 865       722 062       405 141          57 473       265 638      - 932 445               ...             Solde du compte courant


VII-4 External Debt and Financial Flows                                                                                                                  VII-4 Dette extérieure et flux financiers
US $ (Millions)                                                                                                                                                                           $ E.U (Millions)
Total external debt                           447          307           323           245           156             136           120           620            1 093                  Dette extérieure totale
  Private                                     234             1             1             1             1               1             1          502              993                                    Privée
  Public                                      212          306           322           244           155             135           119           118              100                                 Publique
Total external debt service                      6          10            11            39            97              37            10            20               34           Service de la dette extérieure
Net Foreign Direct Investment                                                                                                                                                 Investissements étranger direct
                                              323          690           341           769           470           1 243         - 794         1 636                ...
Inflows                                                                                                                                                                                   (flux nets entrants)
Net Total Official Development                                                                                                                                               Aide publique au développement
                                               20           21            29            38            26              31            32            32                ...
assistance                                                                                                                                                                                       (nette totale)


                                                                                                             African Statistical Yearbook 2011 / Annuaire Statistique pour l'Afrique 2011
Equatorial Guinea                                                                                                         Guinée Equatoriale

                                                 2002    2003    2004      2005      2006      2007      2008      2009       2010

         US $ (Millions)                                                                                                                                       Franc CFA
         Exports, fob                                                                                                                                Exportations, fàb


         Exports - Total                         2 120   2 804    4 711     7 060     8 212    10 210    14 440     6 382        ...                    Exportations - Total


         Main Products                                                                                                                               Principaux produits


         Crude oil                               1 936   2 476    4 337     6 607     7 457     8 508    12 687         ...      ...                            Pétrole brut


         Methanol and Other Gases                  123     194      283       396       686     1 624     4 438         ...      ...                Méthanol et Autres Gaz


         Lumber                                    48      31        56        28        48        71        65         ...      ...                                    Bois


         Cocoa                                      2       2         2         1         2         2         3         ...      ...                                  Cacao


         Coffee                                     0       0         0         0         0         0         0         ...      ...                                    Café

         Main Destinations                                                                                                                      Principales destinations

         United States                           553.6   963.0   1 258.8   1 675.3   1 825.4   1 861.8   3 495.1   2 587.1       ...                              États-Unis


         China                                   382.7   411.9    996.6    1 437.8   2 537.6   1 697.3   2 267.9   1 055.1       ...                                   Chine


         Spain                                   488.4   762.1    684.7     739.2    1 043.8   1 239.1   2 787.9    639.1        ...                                Espagne


         Taiwan, China                            24.3    53.3    640.2     489.0     870.3    1 213.9   1 566.9    485.9        ...                          Taiwan, Chine


         France                                   97.2    24.7     62.2     217.4     187.4     667.7    1 202.1    337.5        ...                                 France


                                                 2002    2003    2004      2005      2006      2007      2008      2009       2010
         Imports, cif                                                                                                                                Importations, cif


164      Imports - Total                           443   1 224      737     1 116     1 619     1 344     1 726     1 985        ...         Importations - Total (millions)


                                                                                                                                                     Principaux produits
         Main Products


         Petroleum oils&oils obtained from
                                                                                                                                             Huiles de pétrole, bitumineux,
         bituminous minerals,o/than crude           5      32        59       104       119       117       166       113        ...
                                                                                                                                                         distilles, sauf brut
         etc

         Aircraft nes of an unladen weight >                                                                                              Aéronefs nda d'un poids à vide >
                                                    1       0         0         3         1        16        50        13        ...
         2,000 kg but not exceedg 15,000 kg                                                                                              2.000 kg mais pas sup 15.000 kg

         Parts of boring or sinking machinery,                                                                                            Pièces du forage ou de fonçage,
                                                   82      141      104        76       244       105        41        74        ...
         whether or not self-propelled                                                                                                   qu'ils soient ou non autopropulsés
         Electric conductors, for a voltage                                                                                              Conducteurs électriques, pour une
         >80V but not exceeding 1,000 V,            2       1         1         2         4         5        53        42        ...    tension> 80 V mais n'excédant pas
         nes                                                                                                                                                  1 000 V nda

         Bars & rods,i/nas,hr,hd or he,cntg                                                                                              Barres, i / nas, hr, hd ou he, ,cntg
                                                    1       1         4         4         8        20        34        23        ...
         indent,ribs,etc,prod dur rp/tar,nes                                                                                           indent,ribs, etc, prod dur rp/tar, nda


         Main Origin                                                                                                                            Principales provenances

         United States                           108.7   336.3    215.4     249.1     551.5     236.4     184.5     305.9        ...                              États-Unis

         Spain                                    60.8    90.3    112.9     112.5     145.3     174.3     213.4     271.3        ...                                Espagne

         Cote d'Ivoire                            17.3   131.1     36.3      87.5     114.6     104.9     148.4     112.6        ...                           Côte d'Ivoire

         United Kingdom                           54.8   177.9     62.8      70.6      83.6      77.7      79.1      68.0        ...                           Royaume-Uni

         France                                   38.0    89.1     42.5      63.6      89.7     114.9     169.8     164.7        ...                                 France


      African Statistical Yearbook 2011 / Annuaire Statistique pour l'Afrique 2011
Eritrea                                                                                                                                                                      Erythrée

AREA (KM 2)                                                                                   117 600                                                                  SUPERFICIE (KM 2)
CAPITAL CITY                             Asmara                                                                                            Asmara                                  CAPITALE
CURRENCY                                 Nakfa                                                                                              Nakfa                                  MONNAIE


                        I SOCIAL AND DEMOGRAPHIC INDICATORS — INDICATEURS DEMOGRAPHIQUES ET SOCIAUX

                                           2002        2003        2004        2005        2006         2007        2008        2009         2010
Population                                                                                                                                                                      Population
                                                                                                                                                            Population au milieu de l'année -
Mid-year population - Total (Million)          4.0         4.1         4.3         4.5         4.6          4.8         4.9         5.1          5.2
                                                                                                                                                                               Total (million)
                                                                                                                                                            Population au milieu de l'année -
Mid-year population - Urban (%)               18.4        18.7        19.0        19.4        19.8        20.2         20.6        21.1         21.6
                                                                                                                                                                               Urbaine (%)

Female (%)                                    50.5        50.5        50.5        50.5        50.5        50.4         50.4        50.4         50.4                              Femme (%)


Population by Age Group                                                                                                                                         Population par groupe d'âge


   0-14                                   1719 113    1767 144    1818 449    1872 445    1928 595    1986 520     2045 923    2106 565     2168 012                                      0-14


   15-64                                  2149 762    2269 378    2386 347    2494 760    2592 004    2679 613     2761 025    2841 714     2925 759                                     15-64


   65+                                      94 309      97 855     101 741     105 917     110 353     115 036      119 929     125 000      130 223                                      65+


Active Population (000)                    1 552.2     1 651.8     1 747.1     1 835.3     1 917.2      1 989.9     2 057.4     2 154.6      2 230.3                  Population active (000)

   Female (%)                                 42.7        43.1        43.3        43.5        43.6        43.7         43.7        44.5         44.7                              Femme (%)

                                                                                                                                                           Taux brut de natalité - Total (par
Crude birth rate - Total (per 1000)           38.0        38.0        38.0        38.0        38.0        38.0         37.0        36.0         37.0
                                                                                                                                                                                       1000)
                                                                                                                                                         Taux brut de mortalité - Total (par
Crude death rate - Total (per 1000)           10.0        10.0         9.0         9.0         9.0          9.0         8.0         8.0          9.0
                                                                                                                                                                                      1000)
Life expectancy at birth - Total                                                                                                                           Espérance de vie à la naissance -
                                              57.0        57.0        58.0        58.0        59.0        59.0         60.0        60.0         59.0
(years)                                                                                                                                                                      Total (années)
Net reproduction rate - (per                                                                                                                                Taux net de reproduction - (par
                                                ...         ...         ...        2.0          ...          ...         ...         ...         2.0
woman)                                                                                                                                                                              femme)
                                                                                                                                                           Indice synthétique de fécondité -
Total fertility rate - (p woman)
              y        (per    )               5.0         5.0         5.0         5.0         5.0          5.0         5.0         5.0          5.0
                                                                                                                                                                               (par femme)

Education                                                                                                                                                                  Enseignement

Teaching staff at first level - Total                                                                                                                    Personnel enseignant - 1er degré -
                                              7.50         7.7         8.0         7.9         7.7          6.9         6.6         7.8           ...
(thousands)                                                                                                                                                                 Total (milliers)
Teaching staff at second level - Total                                                                                                                  Personnel enseignant - 2ème degré -
                                              3.10         3.0         4.1         4.2         4.2          4.4          ...        5.6           ...                                              165
(thousands)                                                                                                                                                                  Total (milliers)
Teaching staff at third level - Total                                                                                                                Personnel enseignant - 3ème degré -
                                               0.3         0.2         0.4          ...         ...          ...         ...        0.6          0.6
(thousands)                                                                                                                                                               Total (milliers)
First level student enrollment - Total                                                                                                                     Elèves inscrits - 1er degré - Total
                                              330         359         375         378         364          332         314         300            ...
(thousands)                                                                                                                                                                          (milliers)
First level student enrollment -                                                                                                                        Elèves inscrits - 1er degré - Femmes
                                              146         160         166         167         162          150         141         135            ...
Female (thousands)                                                                                                                                                                    (milliers)
Second level student enrollment -                                                                                                                        Elèves inscrits - 2ème degré - Total
                                              153         161         194         217         228          218         229         241            ...
Total (thousands)                                                                                                                                                                   (milliers)
Second level student enrollment -                                                                                                                              Elèves inscrits - 2ème degré -
                                               60          63          70          81          86           90          95         100            ...
Female (thousands)                                                                                                                                                         Femmes (milliers)
Third level student enrollment - Total                                                                                                                   Elèves inscrits - 3ème degré - Total
                                               5.5         5.8         4.6          ...         ...          ...         ...        9.9         10.2
(thousands)                                                                                                                                                                         (milliers)
Third level student enrollment -                                                                                                                               Elèves inscrits - 3ème degré -
                                               0.7         0.8         0.6          ...         ...          ...         ...        2.4          2.5
Female (thousands)                                                                                                                                                         Femmes (milliers)
Public expenditure on education (%                                                                                                                         Dépenses publiques consacrées à
                                                ...         ...         ...         ...         ...          ...         ...         ...          ...
of budget)                                                                                                                                                   l'enseignement (% du budget)

Health                                                                                                                                                                                 Santé

Hospital beds - Total (per 10 000                                                                                                                          Nombre de lits d'hôpitaux - Total
                                                ...         ...        58           ...         ...          ...         ...        12            ...
population)                                                                                                                                                                   (pour 10 000)
Nurses - Total (per 10 000                                                                                                                                Nombre d'infirmières - Total (pour
                                                ...         ...         ...         ...         ...          ...         ...        60            ...
population)                                                                                                                                                                         10 000)
Physicians - Total (per 10 000                                                                                                                            Nombre de médecins - Total (pour
                                                ...         ...          5          ...         ...          ...         ...        10            ...
population)                                                                                                                                                                       10 000)
Public expenditure on Health (% of                                                                                                                      Dépenses publiques consacrées à la
                                                 4           4          4           4           4            ...         ...         ...          ...
budget)                                                                                                                                                              santé (% du budget)


                                                                                                  African Statistical Yearbook 2011 / Annuaire Statistique pour l'Afrique 2011
Eritrea                                                                                                                                                              Erythrée
                                                                    II NATIONAL ACCOUNTS — COMPTES NATIONAUX

                                                      2002          2003      2004      2005      2006       2007       2008      2009           2010

          Gross domestic product by kind of economic activity at current prices
                                                                                                     Produit intérieur brut par branche d'activité économique aux prix courants


           Nakfa (Millions)                                                                                                                                                 Nakfa(Millions)

          Agriculture                                  1 061         1 613     1 923     3 577     4 331       4 716     4 790     6 634              ...                            Agriculture

          Mining and quarrying                           117          148       201       217       217         269       267        360              ...                 Industries extractives

          Manufacturing                                1 059         1 241     1 550     1 081     1 054       1 062     1 224     1 600              ...            Industries manufacturières

          Electricity, gas & water                            ...       ...       ...       ...       ...         ...       ...        ...            ...                 Electricité, gaz et eau

          Construction                                 1 075         1 296     1 793     1 941     1 925       2 400     2 382     3 207              ...          Bâtiments et travaux publics
          Wholesale & retail trade,                                                                                                                             Commerce de gros et de détail,
                                                       1 885         2 152     2 711     2 926     3 262       3 553     3 705     5 041              ...
          restaurants, hotels                                                                                                                                            restaurants et hôtels
                                                                                                                                                                 Banques, assurances, affaires
          Finance, insurance, real estate, etc.               ...       ...       ...       ...       ...         ...       ...        ...            ...
                                                                                                                                                                                 immobilières
          Transport and communications                 1 208         1 378     1 736     1 874     2 089       2 275     2 373     3 229              ...      Transport(s) et communications
                                                                                                                                                                   Administrations publiques et
          Public administration and defense            2 664         3 143     3 920     4 213     4 727       5 133     5 353     7 290              ...
                                                                                                                                                                                       défense
          Other services                                      ...       ...       ...       ...       ...         ...       ...        ...            ...                        Autres services
                                                                                                                                                                Moins Services d’intermédiation
          Less Imputed Service Charges                        ...       ...       ...       ...       ...         ...       ...        ...            ...
                                                                                                                                                                                      financière
          Gross domestic product at factor                                                                                                                  Produit intérieur brut aux couts des
                                                       9 069        10 971    13 834    15 828    17 604      19 408    20 095    27 362              ...
          cost / basic prices                                                                                                                                             facteurs / prix de base

          Plus: Indirect Taxes / taxes on                                                                                                                   Plus taxes indirectes/impôts sur les
                                                       1 111         1 106     1 457     1 052     1 017        856      1 126     1 439              ...
          products, less subsidies                                                                                                                              produits, moins les subventions


          Expenditure on Gross domestic product at current purchaser's values
                                                                                                                Emploi du produit intérieur brut aux prix courants d'acquisition

           Nakfa (Millions)                                                                                                                                                 Nakfa(Millions)
                                                                                                                                                                      Consommation finale des
          Government final consumption                 4 037         5 628     5 598     5 948     4 827       5 195     5 594     5 760              ...
                                                                                                                                                                      administrations publiques

          Private final consumption                    8 533        10 625    14 855    15 733    17 106      17 165    17 534    25 023              ...           Consommation finale privée

          Gross fixed capital formation                3 008         3 206     3 098     3 433     2 548       2 568     2 698     2 628              ...        Formation brute de capital fixe

          Increase in inventories                             ...       ...       ...       ...       ...         ...       ...        ...            ...                   Variation des stocks

          Exports of goods and services                1 199          778       883      1 041     1 285       1 170      940      1 293              ...     Exportations de biens et services
166                                                                                                                                                              Moins importations de biens et
          Less imports of goods and services           6 598         8 160     9 143     9 274     7 144       5 834     5 545     5 902              ...
                                                                                                                                                                                       services
          GDP at purchasers' values                   10 180        12 077    15 291    16 880    18 622      20 264    21 220    28 801              ...             PIB aux prix d'acquisition


          Gross domestic product by kind of economic activity at constant
                                                                                                    Produit intérieur brut par branche d'activité economique aux prix constants
          prices
          Annual Growth Rates (%)                                                                                                                    Taux de croissance annuel (%)
          Agriculture                                   -34.8         24.7      -4.5      72.9       8.7         1.5     -12.5       5.7              ...                            Agriculture

          Mining and quarrying                           10.4          3.7       8.4       0.5     -10.3        15.6     -14.4       2.9              ...                 Industries extractives

          Manufacturing                                   7.7         -3.8       0.1     -35.2     -12.5        -6.1      -0.7       -0.2             ...            Industries manufacturières

          Electricity, gas & water                            ...       ...       ...       ...       ...         ...       ...        ...            ...                 Electricité, gaz et eau

          Construction                                   13.3         -1.1      10.8       0.6     -11.0        16.2     -14.5       2.8              ...          Bâtiments et travaux publics
          Wholesale & retail trade,                                                                                                                                    Commerce de gros et de
                                                          8.2         -6.4       1.0       0.3       0.1         1.5     -10.2       3.9              ...
          restaurants, hotels                                                                                                                                        détail,restaurants et hôtels
                                                                                                                                                                  Banques, assurances, affaires
          Finance, insurance, real estate, etc.               ...       ...       ...       ...       ...         ...       ...        ...            ...
                                                                                                                                                                                  immobilières
          Transport and communications                    8.3         -6.4       1.0       0.3       0.1         1.5     -10.1       3.9              ...      Transport(s) et communications
                                                                                                                                                                   Administrations publiques et
          Public administartion and defense               4.4         -3.2      -0.1      -0.1       0.7         1.2     -10.2       4.0              ...
                                                                                                                                                                                       défense
          Other services                                      ...       ...       ...       ...       ...         ...       ...        ...            ...                        Autres services
                                                                                                                                                                Moins Services d’intérmediation
          Less Imputed Service Charges                        ...       ...       ...       ...       ...         ...       ...        ...            ...
                                                                                                                                                                                      financière
          Gross domestic product at factor                                                                                                                  Produit intérieur brut aux couts des
                                                          0.0         -0.7       1.0       6.3      -0.2         2.8     -10.8       3.9              ...
          cost / basic prices                                                                                                                                             facteurs / prix de base

          Plus: Indirect Taxes / taxes on                                                                                                                   Plus taxes indirectes/impôts sur les
                                                              ...       ...       ...       ...       ...         ...       ...        ...            ...
          products, less subsidies                                                                                                                              produits, moins les subventions

          Gross domestic product at market                                                                                                                    Produit intérieur brut aux prix du
                                                          3.0         -2.7       1.5       2.6      -1.0         1.4      -9.8       3.6              ...
          prices                                                                                                                                                                         marché


          2008: semi-final                2009: Provisional                                                                                  2008: semi-définitif            2009: provisoire


      African Statistical Yearbook 2011 / Annuaire Statistique pour l'Afrique 2011
Eritrea                                                                                                                                                      Erythrée

Expenditure on Gross domestic product at constant purchasers'
                                                                                                Emplois du produit intérieur brut aux prix constants d'acquisition
values

Annual Growth Rates (%)                                                                                                           Taux de croissance annuel (%)
                                                                                                                                                    Consommation finale des
Government final consumption                -6.5     16.4      -19.0       -2.0     -25.5         2.0        1.1       -5.9        ...
                                                                                                                                                    administrations publiques

Private final consumption                  13.0       -0.8     13.2        -4.1      -1.4         -4.6     -12.8       7.8         ...            Consommation finale privée

Gross fixed capital formation              -14.4      6.4      -12.6      -21.3     -57.6        -45.3      -0.5      -36.9        ...        Formation brute de capital fixe

Exports of goods and services               7.2      -28.2      9.1         3.3     20.5         -10.9     -21.4      34.8         ...      Exportations de biens et services

                                                                                                                                              Moins importations de biens et
Less imports of goods and services          0.4      12.8       -2.5      -18.6     -35.9        -28.0     -10.0       5.2         ...
                                                                                                                                                                    services


                                                                           III INFLATION

                                          2002      2003      2004       2005      2006        2007       2008      2009       2010
Annual Growth Rates (%)                                                                                                           Taux de croissance annuel (%)
All Item                                   16.9      22.7      25.1        12.5     15.1          9.3       19.9      34.7       20.5                                Ensemble

Food                                          ...       ...       ...        ...       ...          ...       ...        ...       ...                            Alimentation

Health                                        ...       ...       ...        ...       ...          ...       ...        ...       ...                                   Santé

Energy                                        ...       ...       ...        ...       ...          ...       ...        ...       ...                                 Energie

Transport                                     ...       ...       ...        ...       ...          ...       ...        ...       ...                               Transport


                                               IV AGRICULTURAL PRODUCTION - PRODUCTION AGRICOLE

                                          2002      2003      2004       2005      2006        2007       2008      2009       2010
Tons (Thousand)                                                                                                                                        Tonnes (milliers)
Sorghum, Tons (thousands)                    28        64        45        114       223          303       303          ...       ...               Sorgho, tonnes (milliers)

Barley, Tons (thousands)                     10          9       11           9       52           39        39          ...       ...                 Orge, tonnes (milliers)

Potato, Tons (thousands)                     15        11        16         17        12             1         1          1        ...     Pomme de terre, tonnes (milliers)

Millet, Tons (thousands)                       5       12          8        17        56           63        63          ...       ...                 Millet, tonnes (milliers)

Cereals, nes, Tons (thousands)                 3         7         8        19        26           22        22          ...       ...        Céréales, nda, tonnes (milliers)


                                                    V MINING PRODUCTION - PRODUCTION MINIERE
                                                                                                                                                                                   167
                                          2002      2003      2004       2005      2006        2007       2008      2009       2010

Gold ores and concentrates,                                                                                                                       Minerais d'or et concentrés
                                              ...       ...       ...        ...       ...          ...       ...        ...       ...
Kilograms                                                                                                                                                      (Kilogrammes)
Salt and pure sodium chloride,            116.0      52.0      53.0         6.0     10.0          7.0         ...        ...       ...         Sel et chorure de sodium pur,
metric tons (thousands)                                                                                                                           tonnes métriques (milliers)

                                              ...       ...       ...        ...       ...          ...       ...        ...       ...


                                                                        VI ENERGY - ENERGIE

                                          2002      2003      2004       2005      2006        2007       2008      2009       2010

Electricity - total hydro production,                                                                                                     Électricité - production hydraulique
                                              ...       ...       ...        ...       ...          ...       ...        ...       ...
kilowatt hours (millions)                                                                                                                    totale, kilowatt-heures (millions)

Electricity - total thermal production,                                                                                                     Électricité - production thermique
                                          258.0     276.0     282.0       288.0    267.0        286.0         ...        ...       ...
kilowatt hours (millions)                                                                                                                    totale, kilowatt-heures (millions)

Electricity - total production, self-                                                                                                    Electricité - Production totale privée
                                               9       12          9          9         9          10         ...        ...       ...
producer (Million Kilowatt Hours)                                                                                                                  (million de kilowatt heures)

Electricity - total production, public                                                                                                          Electricité - Production totale
                                            249       264       274        280       260          278         ...        ...       ...
(Million Kilowatt Hours)                                                                                                                 publique (million de kilowatt heures)


                                                                                         African Statistical Yearbook 2011 / Annuaire Statistique pour l'Afrique 2011
Eritrea                                                                                                                                                         Erythrée
                                                  VII TOURISM AND INFRASTRUCTURE - TOURISME ET INFRASTUCTURE

                                                   2002       2003       2004       2005       2006       2007       2008       2009       2010

         Arrivals - Tourists (thousands)              101         80         87         83         78         81          ...        ...        ...           Arrivées - touristes (milliers)

         Rooms in hotels and similar                                                                                                                Chambres d'hotels et établissements
         establishments (thousands)                     4          4          5          5          5          ...        ...        ...        ...                  assimilés (milliers)

         Paved Road (% of total)                        ...        ...        ...        ...        ...        ...        ...        ...        ...        Routes asphaltées (% du total)
         Total Network (Railways-km)                    ...        ...        ...        ...        ...        ...        ...        ...        ...         Réseau total voies ferrées-Km
         Main Telephone Lines (per 1,000                                                                                                                  Lignes téléphoniques fixes (pour
                                                       10         10         10         10         10         10         10         10          ...
         inhabitants)                                                                                                                                                     1000 habitants)
         Mobile Cellular Subscribers (per                                                                                                                 Abonnés aux téléphones mobiles
                                                        ...        ...        5         10         10         20         20         30          ...
         1,000 inhabitants)                                                                                                                                        (pour 1000 habitants)


                                   VII FINANCIAL AND MONETARY STATISTICS - FINANCES ET STATISTIQUES MONETAIRES

                                                   2002       2003       2004       2005       2006       2007       2008       2009       2010

         VII-1 Monetary Statistics                                                                                                               VII-1 Statistiques monétaires
         Nakfa (Millions)                                                                                                                                             Nakfa(Millions)
         Money supply (M1)                          6 877      8 063      9 106     10 282     10 863     12 710     15 320     17 291     18 536                   Masse monétaire (M1)
         Quasi-money                                8 463      9 587     10 608     11 535     12 211     13 159     14 656     17 397     19 267                           Quasi-monnaie
           of which Demand Deposit                      ...        ...        ...        ...        ...        ...        ...        ...        ...              dont Monnaie scripturale
         Net foreign assets                         3 130      3 507      3 994      3 127      2 747      2 488      2 898      4 031      5 366                    Avoirs extérieurs nets
         Domestic credit                           13 571     15 790     18 401     21 223     23 175     24 548     28 669     32 293     35 531                           Crédit intérieur

         of which claims on private sector          2 913      3 648      4 120      4 653      4 839      4 202      4 681      4 787      5 334       dont créances sur le secteur privé

         of which Claims on government                                                                                                                         dont créances nettes sur le
                                                    9 691     11 689     13 719     15 874     17 743     19 778     23 391     26 949     29 614
         sector, net                                                                                                                                                       gouvernement
         International reserves (millions of US                                                                                                       Réserves internationales (millions de
                                                       30         25         35         28         25         34         58          ...        ...
         $)                                                                                                                                                                           $ EU)
         Average Exchange Rate (National                                                                                                               Taux de change (moyen) (monnaie
                                                    13.96      13.88      13.79      15.37      15.38      15.38      15.38      15.38      15.38
         Currency per us $)                                                                                                                                        nationale par dollars)


         VII-2 Public Finance                                                                                                                             VII-2 Finances publiques
         Nakfa                                                                                                                                                                      Nakfa
         Total Revenues and Grants                      ...        ...        ...        ...        ...        ...        ...        ...        ...               Recettes totales et dons
           Tax Revenue                                  ...        ...        ...        ...        ...        ...        ...        ...        ...                       Recettes fiscales
           Non Tax Revenue                              ...        ...        ...        ...        ...        ...        ...        ...        ...                  Recettes non fiscales
168        Grants                                       ...        ...        ...        ...        ...        ...        ...        ...        ...                                   Dons

         Total Expenditures and Net Lending             ...        ...        ...        ...        ...        ...        ...        ...        ...         Dépenses totales et prêts nets

           Current expenditure                          ...        ...        ...        ...        ...        ...        ...        ...        ...                   Dépenses courantes
           Of which Wages and Salaries                  ...        ...        ...        ...        ...        ...        ...        ...        ...         Dont rémunérations et salaires
           Capital expenditure                          ...        ...        ...        ...        ...        ...        ...        ...        ...               Dépenses d'équipement
           Net Lending                                  ...        ...        ...        ...        ...        ...        ...        ...        ...                              Prêts nets
         Fiscal Balance                                 ...        ...        ...        ...        ...        ...        ...        ...        ...        Solde global y compris les dons


         VII-3 Balance of Payments                                                                                                                    VII-3 Balance des paiements
         Nakfa (Millions)                                                                                                                                             Nakfa(Millions)
         Trade balance                             - 4 570    - 6 525    - 7 582    - 7 469    - 5 442    - 4 902    - 4 671    - 4 899    - 5 366                   Balance commerciale
         Services Balance                           - 828      - 857      - 678      - 764      - 416        238         65        294        321                     Balance des services
         Net Income                                  - 85      - 134      - 211      - 145      - 134      - 111      - 181      - 266      - 306                             Revenus nets
         Current transfers, net total               6 176      8 684      8 368      8 435      5 325      3 537      3 626      3 423      4 876                      Transferts courants
         Current account balance                      692      1 168      - 103         56      - 667     - 1 238    - 1 160    - 1 449     - 474                Solde du compte courant


         VII-4 External Debt and Financial Flows                                                                                      VII-4 Dette extérieure et flux financiers
         US $ (Millions)                                                                                                                                               $ E.U (Millions)
         Total external debt                          489        542        599        702        718        764        855        895        920                   Dette extérieure totale
           Private                                      0          0          0          0          0           0          0          0          0                                   Privée
           Public                                     489        542        599        702        718        764        855        895        920                                 Publique
         Total external debt service                   30         24         24         26         25         27         28         30         34            Service de la dette extérieure
         Net Foreign Direct Investment                                                                                                                Investissements étranger direct (flux
                                                       20         22        - 8        - 1          0           0          0          0         ...
         Inflows                                                                                                                                                            nets entrants)
         Net Total Official Development                                                                                                                  Aide publique au développement
                                                      226        317        265        349        126        158        144        145          ...
         assistance                                                                                                                                                         (nette totale)


      African Statistical Yearbook 2011 / Annuaire Statistique pour l'Afrique 2011
Eritrea                                                                                                                                           Erythrée

                                       2002     2003     2004     2005     2006       2007       2008      2009       2010

US $ (Millions)                                                                                                                                             Nakfa
Exports, fob                                                                                                                                 Exportations, fàb


Exports - Total                           ...      ...      ...      ...      ...         ...        ...       ...        ...                   Exportations - Total


Main Products                                                                                                                                Principaux produits


Diesel powered trucks with a GVW                                                                                                Diesel chariots de manutention d'un
                                          ...      ...      ...      ...      ...          0         5          0         ...
exceeding twenty tonnes                                                                                                            PTAC n'excédant pas cinq tonnes


Sesamum seeds, whether or not                                                                                                            Graines de sésame, même
                                           0        0        1        1        1           2         2          1         ...
broken                                                                                                                                                  concassées


Mens/boys shirts, of cotton, not                                                                                                    Hommes/garçons chemisiers en
                                           0       ...      ...       0        1           1         2          2         ...
knitted                                                                                                                                       coton, non tricotes

Military weapons,other than                                                                                                         Armes militaires, autres que les
revolvers,pistols & arms of headg No      ...      ...      ...      ...      ...         ...        1         ...        ...   revolvers, pistolets et armes du n °
93.07                                                                                                                                                          93.07
                                                                                                                                Sel (y compris le sel de table et sel
Salt (includg table salt&denaturd
                                          ...      ...      ...      ...      ...         ...        1          0         ...     denaturd) de chlorure de sodium
salt) pure sodium chloride&sea water
                                                                                                                                                 pur et l'eau de mer
Main Destinations                                                                                                                       Principales destinations

Dominican Republic                       0.0      0.1      0.0      0.0      0.0         0.0        0.0       0.0         ...               République dominicaine


Germany                                  1.2      0.6      0.7      1.3      0.1        52.7        0.3       5.6         ...                             Allemagne


Italy                                    2.8      1.4      1.7      2.1      3.0         5.4        4.0       3.7         ...                                  Italie


Kenya                                    0.0      0.0      0.1     12.0      0.4         0.0        2.5       0.3         ...                                 Kenya


India                                    0.0      0.2      0.9      0.8      0.6         1.0        6.8       0.1         ...                                   Inde


                                       2002     2003     2004     2005     2006       2007       2008      2009       2010
Imports, cif                                                                                                                                 Importations, cif

Imports - Total                          208      313      391      338      276         350       256        353         ...        Importations - Total (millions)    169

                                                                                                                                             Principaux produits
Main Products


Refined sugar, in solid form, nes          1        4        0       15        7          12        16         28         ... Sucre raffiné, sous forme solide, nsa


Wheat nes and meslin                      17       33       25       16        6          17        12         14         ...                      Blé nda et méteil


Wheeled tractors nes                       1        2        1        6        1           2         8          1         ...                Tracteurs à roues NDA

Pneumatic tires new of rubber for                                                                                                Pneumatiques de nouveaux pneus
                                           1        2        2        2        3           3         8          8         ...      de caoutchouc pour autobus ou
buses or lorries
                                                                                                                                                         camions
Veg fats&oils nes&their                                                                                                          Veg Graisses & huiles NDA et leurs
fractions,refind or not but not            0        2        7        0        0           0         0          0         ...     fractions, refind ou non, mais non
chemically mod                                                                                                                                    chimiquement mod

Main Origin                                                                                                                             Principales provenances

Italy                                   49.6     41.8     48.1     81.9     38.2        36.3       37.5      39.7         ...                                  Italie

United States                           28.8     87.1     54.0     31.1      8.8         6.1       14.9       6.7         ...                             États-Unis

India                                    0.0      9.5      8.0      6.9      8.0       102.7       21.0       7.2         ...                                   Inde

United Arab Emirates                     5.9     11.7     45.7     44.4     38.0        42.4       34.8      50.2         ...                  Emirats Arabes Unis

China                                    6.0      5.5      7.5      7.8     37.9        26.9       29.0      39.5         ...                                  Chine


                                                                                African Statistical Yearbook 2011 / Annuaire Statistique pour l'Afrique 2011
Ethiopia                                                                                                                                                                            Ethiopie

         AREA (KM 2)                                                                                       1 104 300                                                                  SUPERFICIE (KM 2)
         CAPITAL CITY                             Addis Ababa                                                                                     Addis-Abeba                                     CAPITALE
         CURRENCY                                 Ethiopian Birr                                                                                 Birr Ethiopien                                   MONNAIE


                                  I SOCIAL AND DEMOGRAPHIC INDICATORS — INDICATEURS DEMOGRAPHIQUES ET SOCIAUX

                                                     2002         2003         2004         2005         2006         2007         2008         2009         2010
         Population                                                                                                                                                                            Population
                                                                                                                                                                            Population au milieu de l'année -
         Mid-year population - Total (Million)          69.1         70.9         72.7         74.7         76.6         78.6         80.7         82.8         85.0
                                                                                                                                                                                               Total (million)
                                                                                                                                                                            Population au milieu de l'année -
         Mid-year population - Urban (%)                  ...        15.5         15.8         16.1         16.3         16.6         16.9         17.2         17.6
                                                                                                                                                                                               Urbaine (%)

         Female (%)                                     50.3         50.3         50.3         50.3         50.3         50.3         50.3         50.3         50.2                              Femme (%)


         Population by Age Group                                                                                                                                                Population par groupe d'âge


            0-14                                   31450 593    32131 261    32799 571    33459 876    34113 224    34759 793    35401 948    36042 194    36682 132                                      0-14


            15-64                                  35542 418    36611 568    37733 859    38910 405    40143 294    41431 791    42770 268    44150 696    45566 692                                     15-64


            65+                                     2065 602     2137 827     2212 796     2290 620     2371 180     2454 546     2541 219     2631 842     3037 099                                       65+


         Active Population (000)                    31 211.0     32 384.0     33 603.0     34 871.0     35 921.0     37 015.0     38 149.0     39 962.0     41 310.0                  Population active (000)

            Female (%)                                  46.0         46.0         47.0         47.0         47.0         47.0         47.0         48.0         48.0                              Femme (%)

                                                                                                                                                                           Taux brut de natalité - Total (par
         Crude birth rate - Total (per 1000)            41.0         40.0         40.0         40.0         39.0         39.0         38.0         38.0         38.0
                                                                                                                                                                                                      1000)
                                                                                                                                                                          Taux brut de mortalité - Total (par
         Crude death rate - Total (per 1000)            14.0         13.0         13.0         13.0         12.0         12.0         12.0         12.0         13.0
                                                                                                                                                                                                       1000)
         Life expectancy at birth - Total                                                                                                                                  Espérance de vie à la naissance -
                                                        52.0         53.0         53.0         54.0         54.0         55.0         55.0         56.0         53.0
         (years)                                                                                                                                                                             Total (années)
         Net reproduction rate - (per                                                                                                                                       Taux net de reproduction - (par
                                                          ...          ...          ...         2.0           ...          ...          ...          ...         2.0
         woman)                                                                                                                                                                                    femme)
                                                                                                                                                                           Indice synthétique de fécondité -
         Total fertility rate - (per woman)              6.0          6.0          6.0          6.0          6.0          5.0          5.0          5.0          5.0
                                                                                                                                                                                               (par femme)

         Education                                                                                                                                                                         Enseignement

         Teaching staff at first level - Total                                                                                                                           Personnel enseignant - 1er degré -
                                                          ...          ...          ...          ...          ...          ...       214.8        234.2           ...
         (thousands)                                                                                                                                                                        Total (milliers)
         Teaching staff at second level -                                                                                                                               Personnel enseignant - 2ème degré -
                                                          ...          ...          ...          ...          ...          ...        80.0         81.9           ...
         Total (thousands)                                                                                                                                                                   Total (milliers)
170
         Teaching staff at third level - Total                                                                                                                          Personnel enseignant - 3ème degré -
                                                         3.3          4.2          4.8          4.8          4.8          7.8          8.4           ...          ...
         (thousands)                                                                                                                                                                         Total (milliers)
         First level student enrollment - Total                                                                                                                            Elèves inscrits - 1er degré - Total
                                                       7 213        7 623        8 270       10 020       10 972       12 175       13 379       13 571           ...
         (thousands)                                                                                                                                                                                 (milliers)
         First level student enrollment -                                                                                                                               Elèves inscrits - 1er degré - Femmes
                                                       2 984        3 196        3 596        4 516        5 058        5 665        6 277        6 451           ...
         Female (thousands)                                                                                                                                                                          (milliers)
         Second level student enrollment -                                                                                                                               Elèves inscrits - 2ème degré - Total
                                                       1 734        1 858        2 141        2 488        2 993        3 430        3 696        3 926           ...
         Total (thousands)                                                                                                                                                                          (milliers)
         Second level student enrollment -                                                                                                                                     Elèves inscrits - 2ème degré -
                                                        665          676          778          927         1 152        1 371        1 547        1 707           ...
         Female (thousands)                                                                                                                                                                Femmes (milliers)
         Third level student enrollment -                                                                                                                                Elèves inscrits - 3ème degré - Total
                                                       101.8        148.0        172.1        191.2        180.3        255.5        264.8           ...          ...
         Total (thousands)                                                                                                                                                                          (milliers)
         Third level student enrollment -                                                                                                                                      Elèves inscrits - 3ème degré -
                                                        26.9         37.3         43.3         46.6         43.7         65.7         62.9           ...          ...
         Female (thousands)                                                                                                                                                                Femmes (milliers)
         Public expenditure on education (%                                                                                                                                Dépenses publiques consacrées à
                                                        15.6         18.2         20.4         19.7         17.5         23.3           ...          ...          ...
         of budget)                                                                                                                                                          l'enseignement (% du budget)

         Health                                                                                                                                                                                       Santé

         Hospital beds - Total (per 10 000                                                                                                                                 Nombre de lits d'hôpitaux - Total
                                                         14           20           20           20           20            ...         18           20            ...
         population)                                                                                                                                                                         (pour 10 000)
         Nurses - Total (per 10 000                                                                                                                                       Nombre d'infirmières - Total (pour
                                                         12           12           14            ...          ...          ...         19           20            ...
         population)                                                                                                                                                                                10 000)
         Physicians - Total (per 10 000                                                                                                                                   Nombre de médecins - Total (pour
                                                           2            2            2           ...          ...          ...           1           ...          ...
         population)                                                                                                                                                                              10 000)
         Public expenditure on Health (% of                                                                                                                             Dépenses publiques consacrées à la
                                                         10           11           10           10           10            ...          ...          ...          ...
         budget)                                                                                                                                                                      santé (% du budget)


      African Statistical Yearbook 2011 / Annuaire Statistique pour l'Afrique 2011
Ethiopia                                                                                                                                                                  Ethiopie
                                                           II NATIONAL ACCOUNTS — COMPTES NATIONAUX

                                            2002          2003      2004      2005       2006        2007        2008       2009            2010

Gross domestic product by kind of economic activity at current prices
                                                                                              Produit intérieur brut par branche d'activité économique aux prix courants


Ethiopian Birr (Millions)                                                                                                                                  Birr Ethiopien(Millions)

Agriculture                                 26 880        28 578    34 988     45 760     58 431      75 875     117 108    160 627        165 668                             Agriculture

Mining and quarrying                           399          454       473        560        676          636        944       1 270          2 475                   Industries extractives

Manufacturing                                3 508         3 867     4 216      4 683      5 533       7 136       9 251     11 813         14 467             Industries manufacturières

Electricity, gas & water                     1 471         1 574     1 812      1 952      2 316       3 136       3 481      3 717          4 457                  Electricité, gaz et eau

Construction                                 3 205         3 693     4 627      5 511      6 921       9 269      12 000     16 074         15 882            Bâtiments et travaux publics
Wholesale & retail trade,                                                                                                                                 Commerce de gros et de détail,
                                             8 623        10 059    11 426     13 741     18 177      25 474      36 913     56 629         66 432
restaurants, hotels                                                                                                                                                restaurants et hôtels
                                                                                                                                                           Banques, assurances, affaires
Finance, insurance, real estate, etc.        6 577         7 594     8 091      9 119     11 328      16 050      23 596     30 068         42 947
                                                                                                                                                                           immobilières
Transport and communications                 3 732         4 187     5 012      6 824      6 863       7 928       9 350     12 766         15 967        Transport(s) et communications
                                                                                                                                                              Administrations publiques et
Public administration and defense            3 870         4 120     4 099      4 687      5 447       6 343       8 370     10 320         11 577
                                                                                                                                                                                  défense
Other services                               3 887         4 587     5 036      5 853      7 258       9 158      12 463     15 501         17 922                         Autres services
                                                                                                                                                      Moins Services d’intermédiation
Less Imputed Service Charges                 - 374        - 509     - 594       - 683    - 1 007      - 1 200    - 1 657    - 2 544         - 2 843
                                                                                                                                                                               financière
Gross domestic product at factor                                                                                                                   Produit intérieur brut aux couts des
                                            61 779        68 204    79 185     98 006    121 943     159 803     231 820    316 241        354 952
cost / basic prices                                                                                                                                              facteurs / prix de base

Plus: Indirect Taxes / taxes on                                                                                                                        Plus taxes indirectes/impôts sur les
                                             4 778         5 228     7 476      8 467      9 698      12 186      16 785     19 139         28 412
products, less subsidies                                                                                                                                   produits, moins les subventions


Expenditure on Gross domestic product at current purchaser's values
                                                                                                          Emploi du produit intérieur brut aux prix courants d'acquisition

Ethiopian Birr (Millions)                                                                                                                                  Birr Ethiopien(Millions)
                                                                                                                                                                Consommation finale des
Government final consumption                 9 873         9 850    11 315     13 203     16 080      18 072      24 364     27 592         27 592
                                                                                                                                                                administrations publiques

Private final consumption                   49 949        57 630    67 094     89 676    112 272     142 857     216 432    293 463        341 447            Consommation finale privée

Gross fixed capital formation               16 052        16 305    22 705     25 293     33 176      44 294      56 055     75 377         75 377         Formation brute de capital fixe

Increase in inventories                             ...       ...       ...        ...        ...          ...        ...        ...             ...                  Variation des stocks

Exports of goods and services                8 389         9 779    12 914     16 077     18 205      21 854      28 317     35 233         35 233       Exportations de biens et services

Less imports of goods and services          17 707        20 131    27 367     37 776     48 092      55 088      76 564     96 285         96 285
                                                                                                                                                           Moins importations de biens et     171
                                                                                                                                                                                 services
GDP at purchasers' values                   66 557        73 432    86 661    106 473    131 641     171 989     248 605    335 380        383 364               PIB aux prix d'acquisition


Gross domestic product by kind of economic activity at constant
                                                                                            Produit intérieur brut par branche d'activité economique aux prix constants
prices
Annual Growth Rates (%)                                                                                                                        Taux de croissance annuel (%)
Agriculture                                    -1.9        -10.5      16.9       13.5       10.9         9.4         7.5        6.4             7.6                            Agriculture

Mining and quarrying                          10.5           4.1       2.0        4.1        7.2       -15.4        21.4       12.8           44.2                   Industries extractives

Manufacturing                                   1.3          0.8       6.6       12.8       10.6         8.3        10.3        9.1           10.0             Industries manufacturières

Electricity, gas & water                        9.7          4.8       6.6        7.9        8.8        13.6         4.8        5.0             5.1                 Electricité, gaz et eau

Construction                                  16.2          13.6      19.5        7.5       10.5        10.9        11.3       11.7           10.9            Bâtiments et travaux publics
Wholesale & retail trade,                                                                                                                                       Commerce de gros et de
                                                3.6          3.6       5.2       12.8       17.9        18.5        17.2       14.0           11.7
restaurants, hotels                                                                                                                                           détail,restaurants et hôtels
                                                                                                                                                            Banques, assurances, affaires
Finance, insurance, real estate, etc.         12.4           9.9       6.8       10.2       17.2        15.2        19.6       16.0           18.5
                                                                                                                                                                             immobilières
Transport and communications                    5.6         10.5       9.5       19.2        5.7         9.3        11.5        8.9           13.8        Transport(s) et communications
                                                                                                                                                              Administrations publiques et
Public administartion and defense             -15.6          1.4       0.2       11.6        6.4        11.8        12.5       18.4             3.4
                                                                                                                                                                                  défense
Other services                                  5.6          5.2       9.5       11.4        8.9        15.8        13.7       11.9           12.6                         Autres services
                                                                                                                                                      Moins Services d’intérmediation
Less Imputed Service Charges                  -36.1         14.7      18.5       16.5       40.3        13.5        30.0       12.5             8.7
                                                                                                                                                                               financière
Gross domestic product at factor                                                                                                                   Produit intérieur brut aux couts des
                                                1.6         -2.1      11.7       12.6       11.5        11.8        11.2       10.0           10.4
cost / basic prices                                                                                                                                              facteurs / prix de base

Plus: Indirect Taxes / taxes on                                                                                                                        Plus taxes indirectes/impôts sur les
                                                0.0         -3.0      37.6        3.1        2.7         7.2         5.6       -8.3           45.4
products, less subsidies                                                                                                                                   produits, moins les subventions

Gross domestic product at market                                                                                                                         Produit intérieur brut aux prix du
                                                1.5         -2.2      13.6       11.8       10.8        11.5        10.8        8.8           12.4
prices                                                                                                                                                                             marché


2009: semi-final                2010: Provisional                                                                                      2009: semi-définitif           2010: provisoire


                                                                                               African Statistical Yearbook 2011 / Annuaire Statistique pour l'Afrique 2011
Ethiopia                                                                                                                                                           Ethiopie

         Expenditure on Gross domestic product at constant purchasers'
                                                                                                              Emplois du produit intérieur brut aux prix constants d'acquisition
         values

         Annual Growth Rates (%)                                                                                                                Taux de croissance annuel (%)
                                                                                                                                                                   Consommation finale des
         Government final consumption                  2.9        -11.4      11.0          5.0        9.0       -4.2        4.4       -9.0      12.4
                                                                                                                                                                   administrations publiques

         Private final consumption                     1.1          2.5      12.4        21.8       12.5         8.6      16.7         7.3      12.4            Consommation finale privée

         Gross fixed capital formation               12.8         -10.8      32.8          0.9      16.6       14.2        -5.3      15.0       12.4         Formation brute de capital fixe

         Exports of goods and services                 6.6          3.3      27.2        13.3         1.3        2.6        0.3       -0.7      12.4       Exportations de biens et services

                                                                                                                                                             Moins importations de biens et
         Less imports of goods and services          13.9           0.8      31.0        25.6       14.0        -2.0        7.7       -0.3      12.4
                                                                                                                                                                                   services


                                                                                          III INFLATION

                                                   2002          2003      2004        2005       2006       2007       2008       2009       2010
         Annual Growth Rates (%)                                                                                                                 Taux de croissance annuel (%)
         All Item                                     -7.2         15.1       8.6         6.8       12.3       15.8       25.3       36.4        3.8                               Ensemble

         Food                                           ...          ...        ...         ...        ...        ...        ...        ...       ...                           Alimentation

         Health                                         ...          ...        ...         ...        ...        ...        ...        ...       ...                                   Santé

         Energy                                         ...          ...        ...         ...        ...        ...        ...        ...       ...                                 Energie

         Transport                                      ...          ...        ...         ...        ...        ...        ...        ...       ...                              Transport


                                                              IV AGRICULTURAL PRODUCTION - PRODUCTION AGRICOLE

                                                   2002          2003      2004        2005       2006       2007       2008       2009       2010
         Tons (Thousand)                                                                                                                                              Tonnes (milliers)
         Wheat, Tons (thousands)                    1 448         1 618     2 177       2 307      2 779      2 219      2 463      2 538         ...                   Blé, tonnes (milliers)

         Barley, Tons (thousands)                   1 184         1 087     1 376       1 398      1 410      1 271      1 352      1 519         ...                 Orge, tonnes (milliers)

         Maize, Tons (thousands)                    2 826         2 744     2 906       3 912      4 030      3 337      3 776      3 933         ...                 Maïs, tonnes (milliers)

         Sorghum, Tons (thousands)                  1 546         1 784     1 718       2 200      2 313      2 174      2 316      2 804         ...               Sorgho, tonnes (milliers)

         Teff, Tons (thousands)                         ...       1 627     1 677       2 026      2 176      2 438      2 993      3 028      3 179                    Téf, tonnes (milliers)


                                                                  V MINING PRODUCTION - PRODUCTION MINIERE
172
                                                   2002          2003      2004        2005       2006       2007       2008       2009       2010

         Gold ores and concentrates,                                                                                                                       Minerais aurifères et concentrés,
                                                   3 206.0      3 862.0    3 670.0     3 875.0    4 500.0    3 726.0    3 828.0    3 300.0        ...
         Kilograms                                                                                                                                                             Kilogrammes
         Silver ores and concentrates,             1 018.0      4 000.0    1 100.0     1 100.0    1 000.0     883.0      902.0      900.0         ...      Minerais d'argent et concentrés,
         Kilograms                                                                                                                                                             Kilogrammes
         Abrasives, natural, metric tons                                                                                                                 Abrasifs naturels, tonnes métriques
                                                    156.0        169.0      170.0       170.0      271.0      350.0          ...        ...       ...
         (thousands)                                                                                                                                                                (milliers)


                                                                                      VI ENERGY - ENERGIE

                                                   2002          2003      2004        2005       2006       2007       2008       2009       2010

         Electricity - total hydro production,                                                                                                           Électricité - production hydraulique
                                                   2 023.0      2 280.0    2 521.0     2 852.0    3 259.0    3 369.0         ...        ...       ...
         kilowatt hours (millions)                                                                                                                          totale, kilowatt-heures (millions)

         Electricity - total thermal production,                                                                                                           Électricité - production thermique
                                                     19.0          21.0      18.0        19.0       10.0      133.0          ...        ...       ...
         kilowatt hours (millions)                                                                                                                          totale, kilowatt-heures (millions)

         Electricity - total production, self-                                                                                                          Electricité - Production totale privée
                                                        ...          ...        ...         ...        ...        ...        ...        ...       ...
         producer (Million Kilowatt Hours)                                                                                                                        (million de kilowatt heures)

         Electricity - total production, public                                                                                                                Electricité - Production totale
                                                    2 043         2 302     2 540       2 872      3 270      3 503          ...        ...       ...
         (Million Kilowatt Hours)                                                                                                                       publique (million de kilowatt heures)


      African Statistical Yearbook 2011 / Annuaire Statistique pour l'Afrique 2011
Ethiopia                                                                                                                                                                Ethiopie
                                         VII TOURISM AND INFRASTRUCTURE - TOURISME ET INFRASTUCTURE

                                         2002       2003       2004       2005       2006             2007       2008       2009            2010

Arrivals - Tourists (thousands)             156        180        184        227        290              312        330         ...             ...         Arrivées - touristes (milliers)

Rooms in hotels and similar                                                                                                                         Chambres d'hotels et établissements
establishments (thousands)                    3          3         ...         3         ...              ...        ...        ...             ...                  assimilés (milliers)

Paved Road (% of total)                       ...        ...       19          ...        ...              ...        ...        ...             ...     Routes asphaltées (% du total)
Total Network (Railways-km)                   ...        ...        ...        ...        ...              ...        ...        ...             ...      Réseau total voies ferrées-Km
Main Telephone Lines (per 1,000                                                                                                                         Lignes téléphoniques fixes (pour
                                             10         10         10         10         10               10         10         10               ...
inhabitants)                                                                                                                                                             1000 habitants)
Mobile Cellular Subscribers (per                                                                                                                        Abonnés aux téléphones mobiles
                                               0          0          0        10         10               20         20         50               ...
1,000 inhabitants)                                                                                                                                                 (pour 1000 habitants)


                               VII FINANCIAL AND MONETARY STATISTICS - FINANCES ET STATISTIQUES MONETAIRES

                                         2002       2003       2004       2005       2006             2007       2008       2009            2010

VII-1 Monetary Statistics                                                                                                                        VII-1 Statistiques monétaires
Ethiopian Birr (Millions)                                                                                                                                 Birr Ethiopien(Millions)
Money supply (M1)                        16 558     18 595     22 312     25 981     32 056           38 904     49 106          ...             ...              Masse monétaire (M1)
Quasi-money                              12 976     14 613     17 293     20 988     24 303           29 974     35 882          ...             ...                      Quasi-monnaie
  of which Demand Deposit                     ...        ...        ...        ...        ...              ...        ...        ...             ...            dont Monnaie scripturale
Net foreign assets                       10 680     13 252     15 056     14 790     13 746           16 278     13 118          ...             ...               Avoirs extérieurs nets
Domestic credit                          29 570     33 203     38 480     49 555     58 770           72 516     92 233          ...             ...                      Crédit intérieur

of which claims on private sector        12 057     12 950     14 434     20 241     27 126           32 106     44 312          ...             ...   dont créances sur le secteur privé

of which Claims on government                                                                                                                                 dont créances nettes sur le
                                         16 101     18 621     20 487     25 543     28 056           35 302     37 006          ...             ...
sector, net                                                                                                                                                                gouvernement
International reserves (millions of US                                                                                                               Réserves internationales (millions de
                                            882        956      1 497      1 043        867            1 290        871      1 781               ...
$)                                                                                                                                                                                   $ EU)
Average Exchange Rate (National                                                                                                                       Taux de change (moyen) (monnaie
                                           8.57       8.60       8.64       8.67       8.70             8.97       9.60      11.78               ...
Currency per us $)                                                                                                                                                  nationale par dollars)


VII-2 Public Finance                                                                                                                                    VII-2 Finances publiques
Ethiopian Birr (Millions)                                                                                                                                 Birr Ethiopien(Millions)
Total Revenues and Grants                12 833     15 703     17 918     20 147     23 262           29 381     39 705     54 628          66 237              Recettes totales et dons
  Tax Revenue                             7 926      8 243     10 906     12 398     14 159           17 354     23 801     28 998          43 315                       Recettes fiscales
  Non Tax Revenue                         2 483      2 906      3 010      3 184      5 371            4 444      5 993     11 176          10 546                  Recettes non fiscales
  Grants                                  2 424      4 554      4 002      4 565      3 732            7 583      9 911     14 454          12 376                                    Dons
                                                                                                                                                                                              173
Total Expenditures and Net Lending       16 684     19 849     20 236     24 571     29 276           35 563     46 915     57 775          71 154        Dépenses totales et prêts nets

  Current expenditure                    10 555     13 536     11 965     13 228     15 234           17 165     22 794     27 176          31 832                   Dépenses courantes
  Of which Wages and Salaries             3 789      4 001      5 162      5 949      7 995            9 349     13 221     15 762          26 877        Dont rémunérations et salaires
  Capital expenditure                     6 129      6 313      8 271     11 343     14 042           18 398     24 121     30 599          39 322               Dépenses d'équipement
  Net Lending                                 ...        ...        ...        ...        ...              ...        ...        ...             ...                            Prêts nets
Fiscal Balance                           - 3 851    - 4 146    - 2 318    - 4 424    - 6 014          - 6 182    - 7 210    - 3 147         - 4 917      Solde global y compris les dons


VII-3 Balance of Payments                                                                                                                          VII-3 Balance des paiements
US $ (Millions)                                                                                                                                                      $ E.U(Millions)
Trade balance                            - 1 244    - 1 373    - 1 721    - 2 786    - 3 592          - 3 940    - 5 348    - 6 279         - 7 580                Balance commerciale
Services Balance                            153        167        310        277        149              161        126        419             546                  Balance des services
Net Income                                 - 40       - 66       - 64       - 36       - 38               14         20       - 42            - 98                          Revenus nets
Current transfers, net total                783      1 164      1 338      1 772      2 096            2 895      3 699      4 281           4 923                   Transferts courants
Current account balance                   - 347      - 109      - 136      - 773     - 1 386           - 871     - 1 504    - 1 621         - 2 209            Solde du compte courant


VII-4 External Debt and Financial Flows                                                                                                VII-4 Dette extérieure et flux financiers
US $ (Millions)                                                                                                                                                      $ E.U (Millions)
Total external debt                       6 142      6 797      7 215      5 927      6 332            2 369      3 124      4 552           5 206                Dette extérieure totale
  Private                                    17         15         14         10        333              335        331        569             526                                  Privée
  Public                                  6 125      6 782      7 200      5 917      5 999            2 033      2 793      3 982           4 680                                Publique
Total external debt service                 160        163        154        152         96               88         89         79             154         Service de la dette extérieure
Net Foreign Direct Investment                                                                                                                            Investissements étranger direct
                                            255        465        545        265        545              222        109         94               ...
Inflows                                                                                                                                                              (flux nets entrants)
Net Total Official Development                                                                                                                          Aide publique au développement
                                          1 324      1 626      1 828      1 927      1 980            2 578      3 328      3 820               ...
assistance                                                                                                                                                                  (nette totale)


                                                                                                African Statistical Yearbook 2011 / Annuaire Statistique pour l'Afrique 2011
Ethiopia                                                                                                                                         Ethiopie

                                                 2002     2003     2004     2005     2006      2007     2008      2009       2010

         US $ (Millions)                                                                                                                                 Birr Ethiopien
         Exports, fob                                                                                                                               Exportations, fàb


         Exports - Total                           485      171      158      236      244       296       361       473       577                     Exportations - Total


         Main Products                                                                                                                              Principaux produits


         Coffee, not roasted, not
                                                   154      186      247      361      399       420       520       402        ...      Café, non torréfié, non décaféiné
         decaffeinated


         Sesamum seeds, whether or not
                                                   28       49       73       155      177       164       194       326        ...        Graines de sésame, concassées
         broken


         Cut flowers and flower buds for                                                                                                   Cut flowers and flower buds for
                                                     2        5        7      14        31        66       112       141        ...
         bouquets, etc., fresh                                                                                                                        bouquets, etc., fresh


         Gold in unwrought forms non-                                                                                                    Or sous forme brute à usage non
                                                    ...      ...      ...     21         ...      89        74         ...      ...
         monetary                                                                                                                                              monétaire


         Waste&scrap of gold                        ...      ...      ...      ...       ...      15        53         ...      ...                  Déchets et débris d'or

         Main Destinations                                                                                                                     Principales destinations

         Germany                                  47.3     76.5     88.0    118.7    159.9     111.6     156.4     166.3        ...                              Allemagne


         United States                            28.4     33.6     45.4     66.7      85.4      93.3    158.9     119.5        ...                              États-Unis


         Japan                                    42.5     45.2     73.9     74.3      92.2      78.9     31.9      10.5        ...                                  Japon


         Italy                                    47.1     43.5     40.9     58.6      62.1      86.9     89.0      61.2        ...                                   Italie


         China                                     3.7      4.7     14.4     85.7    131.8       87.1     81.7     214.8        ...                                   Chine


                                                 2002     2003     2004     2005     2006      2007     2008      2009       2010
         Imports, cif                                                                                                                                Importations, cif

         Imports - Total                         1 568    2 102    2 557    4 082     4 532     5 335    7 093     7 030        ...         Importations - Total (millions)
174
                                                                                                                                                    Principaux produits
         Main Products


         Electrical apparatus for line                                                                                                        Appareils électriques pour la
                                                     2        8        9      19          3       12         9        30       595
         telephony/telegraphy nes                                                                                                              téléphonie/télégraphie NDA


         Wheat nes and meslin                        3      140      66       104       40        67       245       101       343                        Blé nda et méteil


         Diammonium phosphate, in                                                                                                      Diammonium phosphate, dans des
                                                     9       ...      ...     11        19        19       159       151        ...
         packages weighing more than 10 kg                                                                                                   colis pesant plus de 10 kg

         Apparatus for carrier-current/digital                                                                                                 Appareils pour systèmes de
                                                     1        2      22         6         8       45       122        85        ...
         line systems                                                                                                                   canalisation carrier-current/digital


         Bars & rods,i/nas,hr,hd or he,cntg                                                                                             Barres, i / nas, hr, hd ou he, ,cntg
                                                   11       17       30       48        35       122       100       108        ...
         indent,ribs,etc,prod dur rp/tar,nes                                                                                          indent,ribs, etc, prod dur rp/tar, nda


         Main Origin                                                                                                                           Principales provenances

         China                                    96.4    152.7    194.1    284.0    430.8     778.4    1 230.7   1 252.5       ...                                   Chine

         United States                            60.5    409.0    459.1    514.9    137.3     167.6     301.6     276.0        ...                              États-Unis

         Italy                                    92.7     97.1    111.4    182.3    193.7     246.1     268.2     211.1        ...                                   Italie

         Germany                                  64.0     77.1     77.6    136.4    157.6     162.7     149.8     174.2        ...                              Allemagne

         India                                    68.5     79.4     55.4     66.3    109.5     163.4     216.6     283.3        ...                                    Inde


      African Statistical Yearbook 2011 / Annuaire Statistique pour l'Afrique 2011
Gabon                                                                                                                                                                  Gabon

AREA (KM 2)                                                                               267 667                                                            SUPERFICIE (KM 2)
CAPITAL CITY                             Libreville                                                                           Libreville                                 CAPITALE
CURRENCY                                 CFA Franc                                                                           Franc CFA                                   MONNAIE


                        I SOCIAL AND DEMOGRAPHIC INDICATORS — INDICATEURS DEMOGRAPHIQUES ET SOCIAUX

                                            2002      2003       2004       2005       2006         2007       2008      2009       2010
Population                                                                                                                                                            Population
                                                                                                                                                  Population au milieu de l'année -
Mid-year population - Total (Million)          1.3        1.3        1.3        1.3        1.4         1.4        1.4        1.5        ...
                                                                                                                                                                     Total (million)
                                                                                                                                                  Population au milieu de l'année -
Mid-year population - Urban (%)                 ...        ...      83.0       80.1       84.0        85.0       85.0       85.6        ...
                                                                                                                                                                     Urbaine (%)

Female (%)                                    50.6       50.3       50.2       50.8       50.1        50.1       50.1       50.0        ...                             Femme (%)


Population by Age Group                                                                                                                               Population par groupe d'âge


   0-14                                    517 433    522 161    525 887    494 291    530 505     531 530    532 143    532 857        ...                                     0-14


   15-64                                   711 997    734 000    756 624    767 932    803 864     828 372    853 148    877 839        ...                                    15-64


   65+                                      59 543     59 836     60 187     50 223     61 242      61 982     62 865     63 892        ...                                     65+


Active Population (000)                      577.0      593.0      608.0      482.7      640.0       657.0      673.0      691.0        ...                 Population active (000)

   Female (%)                                 44.4       44.4       44.4       45.0       44.2        44.1       44.1       44.0        ...                             Femme (%)

                                                                                                                                                 Taux brut de natalité - Total (par
Crude birth rate - Total (per 1000)           30.1       29.6       29.0       28.5       28.1        27.7       27.3       26.9        ...
                                                                                                                                                                             1000)
                                                                                                                                               Taux brut de mortalité - Total (par
Crude death rate - Total (per 1000)           10.4       10.4       10.3       10.2       10.1         9.9        9.7        9.5        ...
                                                                                                                                                                            1000)
Life expectancy at birth - Total                                                                                                                 Espérance de vie à la naissance -
                                              59.4       59.3       59.3       59.5       59.7        60.1       60.5       60.9        ...
(years)                                                                                                                                                            Total (années)
Net reproduction rate - (per                                                                                                                      Taux net de reproduction - (par
                                                ...        ...        ...       1.3         ...         ...        ...        ...       ...
woman)                                                                                                                                                                    femme)
                                                                                                                                                 Indice synthétique de fécondité -
Total fertility rate - (p woman)
              y        (per    )               3.8        3.7        3.6        3.5        3.5         3.4        3.3        3.2        ...
                                                                                                                                                                     (par femme)

Education                                                                                                                                                        Enseignement

Teaching staff at first level - Total                                                                                                          Personnel enseignant - 1er degré -
                                                ...        ...       4.8        5.6        5.7          ...       7.2         ...       ...
(thousands)                                                                                                                                                       Total (milliers)
Teaching staff at second level - Total                                                                                                        Personnel enseignant - 2ème degré -
                                                ...        ...        ...        ...        ...         ...       3.0         ...       ...                                              175
(thousands)                                                                                                                                                        Total (milliers)
Teaching staff at third level - Total                                                                                                       Personnel enseignant - 3ème degré -
                                               0.5        0.5        0.5        0.5         ...         ...        ...        ...       ...
(thousands)                                                                                                                                                      Total (milliers)
First level student enrollment - Total                                                                                                           Elèves inscrits - 1er degré - Total
                                                ...        ...        ...        ...        ...         ...      348          ...       ...
(thousands)                                                                                                                                                                (milliers)
First level student enrollment -                                                                                                              Elèves inscrits - 1er degré - Femmes
                                              139        138        139          ...        ...         ...      168          ...       ...
Female (thousands)                                                                                                                                                          (milliers)
Second level student enrollment -                                                                                                              Elèves inscrits - 2ème degré - Total
                                              105          ...        ...        ...        ...         ...        ...        ...       ...
Total (thousands)                                                                                                                                                         (milliers)
Second level student enrollment -                                                                                                                    Elèves inscrits - 2ème degré -
                                                ...        ...        ...        ...        ...         ...        ...        ...       ...
Female (thousands)                                                                                                                                               Femmes (milliers)
Third level student enrollment - Total                                                                                                         Elèves inscrits - 3ème degré - Total
                                                ...      10.1       10.5         ...        ...         ...        ...        ...       ...
(thousands)                                                                                                                                                               (milliers)
Third level student enrollment -                                                                                                                     Elèves inscrits - 3ème degré -
                                                ...        ...        ...        ...        ...         ...        ...        ...       ...
Female (thousands)                                                                                                                                               Femmes (milliers)
Public expenditure on education (%                                                                                                               Dépenses publiques consacrées à
                                                ...        ...        ...        ...        ...         ...        ...        ...       ...
of budget)                                                                                                                                         l'enseignement (% du budget)

Health                                                                                                                                                                       Santé

Hospital beds - Total (per 10 000                                                                                                                Nombre de lits d'hôpitaux - Total
                                                ...        ...       55          ...        ...         ...        ...        ...       ...
population)                                                                                                                                                         (pour 10 000)
Nurses - Total (per 10 000                                                                                                                      Nombre d'infirmières - Total (pour
                                                ...        ...        ...        ...        ...         ...        ...        ...       ...
population)                                                                                                                                                               10 000)
Physicians - Total (per 10 000                                                                                                                  Nombre de médecins - Total (pour
                                                ...        ...         3          3         ...         ...        ...        ...       ...
population)                                                                                                                                                             10 000)
Public expenditure on Health (% of                                                                                                            Dépenses publiques consacrées à la
                                                ...        ...        ...        ...        ...         ...        ...        ...       ...
budget)                                                                                                                                                    santé (% du budget)


                                                                                              African Statistical Yearbook 2011 / Annuaire Statistique pour l'Afrique 2011
Gabon                                                                                                                                                   Gabon
                                                            II NATIONAL ACCOUNTS — COMPTES NATIONAUX

                                                  2002      2003     2004     2005     2006      2007       2008      2009       2010

          Gross domestic product by kind of economic activity at current prices
                                                                                         Produit intérieur brut par branche d'activité économique aux prix courants


          CFA Franc (Billions)                                                                                                                     Franc CFA (Milliards)

          Agriculture                               209       214      214      223      247        269       264        277         ...                            Agriculture

          Mining and quarrying                    1 464     1 527    1 778    2 460    2 675       2 853     3 684     2 282         ...                 Industries extractives

          Manufacturing                             182       183      190      209      225        250       251        230         ...            Industries manufacturières

          Electricity, gas & water                   46        48       54       57       62         70        81         88         ...                 Electricité, gaz et eau

          Construction                               84        72       76       79       92        102       113        112         ...          Bâtiments et travaux publics
          Wholesale & retail trade,                                                                                                            Commerce de gros et de détail,
                                                    242       247      240      256      279        303       333        350         ...
          restaurants, hotels                                                                                                                           restaurants et hôtels
                                                                                                                                                Banques, assurances, affaires
          Finance, insurance, real estate, etc.     486       478      482      515      561        611       668        687         ...
                                                                                                                                                                immobilières
          Transport and communications              191       197      204      211      228        281       295        267         ...      Transport(s) et communications
                                                                                                                                                  Administrations publiques et
          Public administration and defense         293       302      298      300      336        402       432        506         ...
                                                                                                                                                                      défense
          Other services                              ...      ...      ...      ...      ...         ...       ...        ...       ...                        Autres services
                                                                                                                                               Moins Services d’intermédiation
          Less Imputed Service Charges                ...      ...      ...      ...      ...         ...       ...        ...       ...
                                                                                                                                                                     financière
          Gross domestic product at factor                                                                                                 Produit intérieur brut aux couts des
                                                  3 199     3 268    3 535    4 311    4 704       5 140     6 121     4 799         ...
          cost / basic prices                                                                                                                            facteurs / prix de base

          Plus: Indirect Taxes / taxes on                                                                                                  Plus taxes indirectes/impôts sur les
                                                    239       251      257      260      288        338       333        332         ...
          products, less subsidies                                                                                                             produits, moins les subventions


          Expenditure on Gross domestic product at current purchaser's values
                                                                                                    Emploi du produit intérieur brut aux prix courants d'acquisition

          CFA Franc( Billions)                                                                                                                     Franc CFA (Milliards)
                                                                                                                                                     Consommation finale des
          Government final consumption              520       502      497      527      574        670       709        791         ...
                                                                                                                                                     administrations publiques

          Private final consumption               1 273     1 317    1 362    1 433    1 567       1 758     1 932     2 038         ...           Consommation finale privée

          Gross fixed capital formation           1 061     1 021    1 037    1 047    1 157       1 291     1 331     1 250         ...        Formation brute de capital fixe

          Increase in inventories                    25        25       19       14       51          4        32         27         ...                   Variation des stocks

          Exports of goods and services           1 907     1 970    2 287    3 026    3 265       3 558     4 401     2 893         ...     Exportations de biens et services
176                                                                                                                                             Moins importations de biens et
          Less imports of goods and services      1 349     1 316    1 409    1 476    1 622       1 802     1 951     1 868         ...
                                                                                                                                                                      services
          GDP at purchasers' values               3 437     3 519    3 792    4 571    4 992       5 478     6 454     5 131         ...             PIB aux prix d'acquisition


          Gross domestic product by kind of economic activity at constant
                                                                                        Produit intérieur brut par branche d'activité economique aux prix constants
          prices
          Annual Growth Rates (%)                                                                                                   Taux de croissance annuel (%)
          Agriculture                               -4.8      1.5      1.2      2.2      3.3         5.4      -0.2       2.9         ...                            Agriculture

          Mining and quarrying                      -1.8      7.8     -0.2     -0.2     -7.9         2.9      -1.9       -4.4        ...                 Industries extractives

          Manufacturing                             4.1      -1.2      2.1      6.5     -2.9         7.8       2.4      -11.3        ...            Industries manufacturières

          Electricity, gas & water                 21.2       3.8     10.2      2.5      6.0         3.7       7.0       1.4         ...                 Electricité, gaz et eau

          Construction                              3.3      -6.2      4.2      2.0      6.4         3.3       3.5       -3.3        ...          Bâtiments et travaux publics
          Wholesale & retail trade,                                                                                                                   Commerce de gros et de
                                                    -7.8      1.7     -0.7      5.6      5.3         7.0       5.0       2.3         ...
          restaurants, hotels                                                                                                                       détail,restaurants et hôtels
                                                                                                                                                 Banques, assurances, affaires
          Finance, insurance, real estate, etc.     3.4       0.4      0.9      5.6      5.4         6.0       5.7       1.3         ...
                                                                                                                                                                 immobilières
          Transport and communications              2.4       3.0      3.2      4.5      4.8         7.2       2.0       -6.2        ...      Transport(s) et communications
                                                                                                                                                  Administrations publiques et
          Public administartion and defense         -0.4      2.5      2.0      2.5      4.0         6.0       6.0       4.2         ...
                                                                                                                                                                      défense
          Other services                              ...      ...      ...      ...      ...         ...       ...        ...       ...                        Autres services
                                                                                                                                               Moins Services d’intérmediation
          Less Imputed Service Charges                ...      ...      ...      ...      ...         ...       ...        ...       ...
                                                                                                                                                                     financière
          Gross domestic product at factor                                                                                                 Produit intérieur brut aux couts des
                                                    0.3       2.7      1.3      3.0      0.5         5.4       2.7       -1.5
          cost / basic prices                                                                                                                            facteurs / prix de base

          Plus: Indirect Taxes / taxes on                                                                                                  Plus taxes indirectes/impôts sur les
                                                   -11.1     -2.8      1.4      2.4     15.3         9.1      -4.2       0.3         ...
          products, less subsidies                                                                                                             produits, moins les subventions

          Gross domestic product at market                                                                                                   Produit intérieur brut aux prix du
                                                    -0.3      2.5      1.4      3.0      1.2         5.6       2.3       -1.4        ...
          prices                                                                                                                                                        marché


           2009: Provisional                                                                                                                                2009: provisoire


      African Statistical Yearbook 2011 / Annuaire Statistique pour l'Afrique 2011
Gabon                                                                                                                                                                      Gabon

Expenditure on Gross domestic product at constant purchasers'
                                                                                                         Emplois du produit intérieur brut aux prix constants d'acquisition
values

Annual Growth Rates (%)                                                                                                                     Taux de croissance annuel (%)
                                                                                                                                                              Consommation finale des
Government final consumption                  -8.5        -3.5         1.8         6.7        -5.4         19.0        -1.9        4.9       ...
                                                                                                                                                              administrations publiques

Private final consumption                      4.0         1.4         3.0         5.5         5.2          6.9         4.4        3.5       ...            Consommation finale privée

Gross fixed capital formation                 -1.2        -1.1         0.8         0.6         8.1          7.1         3.2       -6.8       ...        Formation brute de capital fixe

Exports of goods and services                 -3.8         4.8         3.6         1.4        -5.7          6.3         0.7      -10.6       ...      Exportations de biens et services

                                                                                                                                                        Moins importations de biens et
Less imports of goods and services            -0.6        -3.0         4.8         3.2         6.7          8.7         5.5       -5.8       ...
                                                                                                                                                                              services


                                                                                  III INFLATION

                                           2002        2003        2004        2005        2006         2007        2008       2009       2010
Annual Growth Rates (%)                                                                                                                     Taux de croissance annuel (%)
All Item                                       0.2         2.1         0.4         3.7        -1.4          5.0         5.3        2.5      3.2                               Ensemble

Food                                            ...         ...         ...        0.2         0.9          2.2         7.8        3.7      4.5                            Alimentation

Health                                          ...         ...         ...        2.8         9.5         -2.0         1.9        2.9      0.9                                   Santé

Energy                                          ...         ...         ...         ...        2.8          9.1         9.1        4.1     -6.5                                  Energie

Transport                                       ...         ...         ...       -1.2         3.0        13.5          3.3       -6.3      1.2                               Transport


                                                 IV AGRICULTURAL PRODUCTION - PRODUCTION AGRICOLE

                                           2002        2003        2004        2005        2006         2007        2008       2009       2010
Tons (Thousand)                                                                                                                                                  Tonnes (milliers)
Plantains, Tons (thousands)                   269         270         270         270           ...          ...         ...        ...      ...        Banane plantain (1000 tonnes)

Cassava, Tons (thousands)                     226         234         228         229           ...          ...         ...        ...      ...                  Manioc (1000 tonnes)

Taro, Tons (thousands)                         56          55          54          55           ...          ...         ...        ...      ...                    Taro (1000 tonnes)
Groundnuts in shells, Tons
                                               16          17          17          17           ...          ...         ...        ...      ...    Arachide, en coques (1000 tonnes)
(thousands)
                                                                                                                                                          5 : Caoutchouc naturel (1000
Natural rubber, Tons (thousands)                ...         ...          1           9         12           13          19         17        ...
                                                                                                                                                                               tonnes)


                                                        V MINING PRODUCTION - PRODUCTION MINIERE
                                                                                                                                                                                            177
                                           2002        2003        2004        2005        2006         2007        2008       2009       2010

Crude Petroleum, metric tons
                                          12 563.0    13 433.0    13 483.0    13 305.0    11 930.0     12 130.0    12 700.0         ...      ...             Pétrole brut (1000 tonnes)
(thousands)
Gas natural, cubic meter (million)          138.7       146.6       143.6       150.9       155.3        167.1       187.3          ...      ...           Gaz naturel (millions de m3)


Manganese, Tons (thousands)                1 856.0     2 000.0     2 459.2     2 753.0     2 979.0      3 333.8     3 248.0    1 969.0       ...             Manganèse (1000 tonnes)


                                                                              VI ENERGY - ENERGIE

                                           2002        2003        2004        2005        2006         2007        2008       2009       2010

Electricity - total hydro production,                                                                                                               Électricité - production hydraulique
                                           1 266.0     1 314.6     1 337.1     1 363.7     1 463.0      1 525.0     1 639.1         ...      ...
kilowatt hours (millions)                                                                                                                              totale, kilowatt-heures (millions)

Electricity - total thermal production,                                                                                                               Électricité - production thermique
                                              73.0        68.0        67.0        60.0        65.0         53.0        55.0         ...      ...
kilowatt hours (millions)                                                                                                                              totale, kilowatt-heures (millions)

Electricity - total production, self-                                                                                                              Electricité - Production totale privée
                                              191         189         200         247         269          319           ...        ...      ...
producer (Million Kilowatt Hours)                                                                                                                            (million de kilowatt heures)

Electricity - total production, public                                                                                                                    Electricité - Production totale
                                            1 266       1 315       1 337       1 363       1 463        1 525           ...        ...      ...
(Million Kilowatt Hours)                                                                                                                           publique (million de kilowatt heures)


                                                                                                  African Statistical Yearbook 2011 / Annuaire Statistique pour l'Afrique 2011
Gabon                                                                                                                                                        Gabon
                                                  VII TOURISM AND INFRASTRUCTURE - TOURISME ET INFRASTUCTURE

                                                   2002      2003      2004      2005      2006      2007      2008       2009      2010

         Arrivals - Tourists (thousands)             208       222      180.6     151.4     149.7     159.4     185.6         ...       ...           Arrivées - touristes (milliers)

         Rooms in hotels and similar                                                                                                        Chambres d'hotels et établissements
         establishments (thousands)                    2         ...       ...       ...       ...    4.191         ...       ...       ...                  assimilés (milliers)

         Paved Road (% of total)                       ...       ...      10         ...       ...       ...        ...       ...       ...        Routes asphaltées (% du total)
         Total Network (Railways-km)                   ...     731       731       810       810      1 098         ...       ...       ...         Réseau total voies ferrées-Km
         Main Telephone Lines (per 1,000                                                                                                          Lignes téléphoniques fixes (pour
                                                      25        29        29          2       26        19         18         ...       ...
         inhabitants)                                                                                                                                             1000 habitants)
         Mobile Cellular Subscribers (per                                                                                                         Abonnés aux téléphones mobiles
                                                     217       228       364       538       643       822        898         ...       ...
         1,000 inhabitants)                                                                                                                                (pour 1000 habitants)


                                   VII FINANCIAL AND MONETARY STATISTICS - FINANCES ET STATISTIQUES MONETAIRES

                                                   2002      2003      2004      2005      2006      2007      2008       2009      2010

         VII-1 Monetary Statistics                                                                                                       VII-1 Statistiques monétaires
         CFA Franc (Billions)                                                                                                                          Franc CFA (Milliards)
         Money supply (M1)                           347       345       387       528       618       689        774       766        806                  Masse monétaire (M1)
         Quasi-money                                 252       247       272       312       360       356        367       399        416                          Quasi-monnaie
           of which Demand Deposit                     ...       ...       ...       ...       ...       ...        ...       ...       ...              dont Monnaie scripturale
         Net foreign assets                           24        71       280       531       705      1 019       974       977        894                   Avoirs extérieurs nets
         Domestic credit                             650       617       485       442       416       160        395       390        494                          Crédit intérieur

         of which claims on private sector           416       381       330       380       465       667        556       527        543      dont créances sur le secteur privé

         of which Claims on government                                                                                                                 dont créances nettes sur le
                                                     194       204       111        24       - 91    - 552      - 236     - 190      - 112
         sector, net                                                                                                                                               gouvernement
         International reserves (millions of US                                                                                               Réserves internationales (millions de
                                                     140       197       443       669      1 113     1 227     1 923      1 993     1 952
         $)                                                                                                                                                                   $ EU)
         Average Exchange Rate (National                                                                                                       Taux de change (moyen) (monnaie
                                                   696.99    581.20    528.29    527.47    522.89    479.27    447.81     472.19    495.28
         Currency per us $)                                                                                                                                nationale par dollars)


         VII-2 Public Finance                                                                                                                     VII-2 Finances publiques
         CFA Franc (Billions)                                                                                                                          Franc CFA (Milliards)
         Total Revenues and Grants                  1 090     1 050     1 114     1 362     1 583     1 636     2 078      1 282     1 719                Recettes totales et dons
           Tax Revenue                               972       913       961      1 216     1 442     1 466     1 910      1 072     1 522                        Recettes fiscales
           Non Tax Revenue                           116       136       151       144       140       170        168       207        207                   Recettes non fiscales
178        Grants                                      2          1         2         2         0        0           0         4         4                                    Dons

         Total Expenditures and Net Lending          969       789       827       931      1 088     1 166     1 296      1 271     1 778          Dépenses totales et prêts nets

           Current expenditure                       755       614       628       717       725       838        906       848        847                    Dépenses courantes
           Of which Wages and Salaries               221       229       226       228       252       302        324       370        385          Dont rémunérations et salaires
           Capital expenditure                       137       131       160       155       198       247        299       295        898                Dépenses d'équipement
           Net Lending                                17          0         0         5         0       10         21          0         0                               Prêts nets
         Fiscal Balance                              121       261       286       431       495       471        782        11       - 59         Solde global y compris les dons


         VII-3 Balance of Payments                                                                                                            VII-3 Balance des paiements
         CFA Franc (Billions)                                                                                                                          Franc CFA (Milliards)
         Trade balance                              1 125     1 241     1 508     2 152     2 351     2 575     3 344      1 971        ...                  Balance commerciale
         Services Balance                          - 465     - 388     - 414     - 548     - 567     - 617      - 644     - 523         ...                   Balance des services
         Net Income                                - 334     - 415     - 511     - 845     - 810     - 861     - 1 048    - 658         ...                           Revenus nets
         Current transfers, net total                - 90    - 104       - 95      - 91    - 106     - 118      - 136       - 90        ...                    Transferts courants
         Current account balance                     236       335       489       668       868       979      1 517       700         ...              Solde du compte courant


         VII-4 External Debt and Financial Flows                                                                               VII-4 Dette extérieure et flux financiers
         US $ (Millions)                                                                                                                                       $ E.U (Millions)
         Total external debt                        3 096     3 363     3 604     3 416     3 117     4 040     2 264      2 035     1 933                  Dette extérieure totale
           Private                                   185       135        95        68        37       977        964       834        775                                   Privée
           Public                                   2 911     3 228     3 509     3 348     3 080     3 063     1 300      1 201     1 158                                Publique
         Total external debt service                 464       601       593       493       639       755      2 528       485        517           Service de la dette extérieure
         Net Foreign Direct Investment                                                                                                        Investissements étranger direct (flux
                                                      37       206       320       242       268       269        209        33         ...
         Inflows                                                                                                                                                    nets entrants)
         Net Total Official Development                                                                                                          Aide publique au développement
                                                      72       - 11       40        60        29        51         62        78         ...
         assistance                                                                                                                                                 (nette totale)


      African Statistical Yearbook 2011 / Annuaire Statistique pour l'Afrique 2011
Gabon                                                                                                                                                     Gabon

                                     2002     2003       2004       2005       2006         2007       2008       2009      2010

US $ (Millions)                                                                                                                                           Franc CFA
Exports, fob                                                                                                                                    Exportations, fàb


Exports - Total                      1 781     1 847      2 151      2 882      3 166        3 446      4 352     2 632         ...                Exportations - Total


Main Products                                                                                                                                   Principaux produits


Crude oil                            1 372     1 419      1 567      2 193      2 653        2 485      3 707     2 170         ...                        Pétrole brut


Rough lumber                           138       144        131        160        159          192        165       197         ...                    Bois en grumes


Manganese                               29        33         80         94         98          107         92       148         ...                         Manganèse


Lumber                                  65        77         85         90        103          127        107        ...        ...                         Bois ouvrés


                                        ...        ...        ...        ...        ...          ...        ...      ...        ...

Main Destinations                                                                                                                          Principales destinations

United States                           ...   1 004.9    1 012.1    1 751.1    1 836.5      1 604.7    2 204.1       ...        ...                          Etats-Unis


France                               128.0     116.3      145.8      123.2      222.1        341.4      255.4        ...        ...                             France


China                                 75.3     130.9      111.5      107.0      332.2        287.7      560.7        ...        ...                               Chine


Japan                                 18.5      94.4         1.1        2.8        1.9       167.5       29.4        ...        ...                              Japon


Thailand                               0.5        0.1      16.5       29.6       66.4         95.2         0.1       ...        ...                          Thaïlande


                                     2002     2003       2004       2005       2006         2007       2008       2009      2010
Imports, cif                                                                                                                                     Importations, cif

Imports - Total                        791       701        675        776        904        1 010      1 141       941         ...      Importations - Total (millions)   179

                                                                                                                                                Principaux produits
Main Products


                                                                                                                                             Outillage et matériels non
Tools and materials non-electric       146       108        138        149        185          205        250        ...        ...
                                                                                                                                                            électriques


Food                                   132       135        142        147        151          185        202        ...        ...               Produits alimentaires


                                                                                                                                       Produits de consommation non
Consumer Products nonfood              130       100        110        121        132          149        210        ...        ...
                                                                                                                                                         alimentaires

Vehicles                                65        77         57         73         91           97        102        ...        ...                           Véhicules


Electrical machinery and apparatus      60        50         57         69         80           90         79        ...        ...   Machines et appareils électriques


Main Origin                                                                                                                                Principales provenances

France                               308.8     285.0      259.6      305.2      362.0        365.5      403.9        ...        ...                             France

United States                           ...     67.2       57.5       50.3       66.2         60.1       84.9        ...        ...                          Etats-Unis

Chine                                  8.5        9.0        8.6      14.2       23.6         39.2       45.0        ...        ...                               Chine

Netherlands                           31.2      38.3       27.5       20.8       25.2         32.3       39.0        ...        ...                           Pays-Bas

Cameroon                              16.8      19.4       24.2       28.2       31.3         31.4       26.8        ...        ...                          Cameroun


                                                                                      African Statistical Yearbook 2011 / Annuaire Statistique pour l'Afrique 2011
Gambia                                                                                                                                                                Gambie

         AREA (KM 2)                                                                                11 295                                                             SUPERFICIE (KM 2)
         CAPITAL CITY                             Banjul                                                                                    Banjul                                 CAPITALE
         CURRENCY                                 Gambian Dalasi                                                                   Dalasi Gambien                                  MONNAIE


                                 I SOCIAL AND DEMOGRAPHIC INDICATORS — INDICATEURS DEMOGRAPHIQUES ET SOCIAUX

                                                    2002       2003       2004       2005       2006         2007       2008         2009      2010
         Population                                                                                                                                                             Population
                                                                                                                                                            Population au milieu de l'année -
         Mid-year population - Total (Million)          1.4        1.4        1.4        1.5        1.5          1.6        1.6         1.7       ...
                                                                                                                                                                               Total (million)
                                                                                                                                                            Population au milieu de l'année -
         Mid-year population - Urban (%)                 ...        ...      53.0       54.0       55.0         56.0       57.0        57.3       ...
                                                                                                                                                                               Urbaine (%)

         Female (%)                                    50.4       50.4       50.4       50.4       50.4         50.4       50.4        50.6       ...                             Femme (%)


         Population by Age Group                                                                                                                                Population par groupe d'âge


            0-14                                    597 926    616 994    635 710    653 941    671 605      688 684    705 194     721 174       ...                                     0-14


            15-64                                   755 274    779 736    804 526    829 743    855 393      881 506    908 215     935 694       ...                                    15-64


            65+                                      38 178     39 591     41 018     42 454     43 885       45 321     46 791      48 343       ...                                     65+


         Active Population (000)                      626.0      482.4      500.8      519.8      539.6        560.1      560.1       560.1       ...                 Population active (000)

            Female (%)                                 45.7      217.0      227.7         ...        ...          ...        ...         ...      ...                             Femme (%)

                                                                                                                                                           Taux brut de natalité - Total (par
         Crude birth rate - Total (per 1000)           40.0       39.4       43.0       42.0       42.6         42.3       42.0        41.6       ...
                                                                                                                                                                                       1000)
                                                                                                                                                         Taux brut de mortalité - Total (par
         Crude death rate - Total (per 1000)           12.5       12.3        8.9        8.8        8.6          8.4        8.2         8.1       ...
                                                                                                                                                                                      1000)
         Life expectancy at birth - Total                                                                                                                  Espérance de vie à la naissance -
                                                       54.4       64.5       64.7       64.9       65.1         65.2       65.4        65.1       ...
         (years)                                                                                                                                                             Total (années)
         Net reproduction rate - (per                                                                                                                       Taux net de reproduction - (par
                                                         ...        ...        ...       1.9         ...          ...        ...         ...      ...
         woman)                                                                                                                                                                     femme)
                                                                                                                                                           Indice synthétique de fécondité -
         Total fertility rate - (p woman)
                       y        (per    )               5.5        5.4        5.3        5.3        5.3          5.2        5.2         5.2       ...
                                                                                                                                                                               (par femme)

         Education                                                                                                                                                         Enseignement

         Teaching staff at first level - Total                                                                                                           Personnel enseignant - 1er degré -
                                                         ...        ...        ...        ...        ...          ...        ...         ...      ...
         (thousands)                                                                                                                                                        Total (milliers)
         Teaching staff at second level - Total                                                                                                         Personnel enseignant - 2ème degré -
180                                                      ...        ...        ...        ...        ...          ...        ...         ...      ...
         (thousands)                                                                                                                                                         Total (milliers)
         Teaching staff at third level - Total                                                                                                          Personnel enseignant - 3ème degré -
                                                         ...        ...        ...        ...        ...          ...        ...         ...      ...
         (thousands)                                                                                                                                                         Total (milliers)
         First level student enrollment - Total                                                                                                            Elèves inscrits - 1er degré - Total
                                                       196        205        205        208        219          221        236         230        ...
         (thousands)                                                                                                                                                                 (milliers)
         First level student enrollment -                                                                                                               Elèves inscrits - 1er degré - Femmes
                                                        86        102        104        105        111          113        120         115        ...
         Female (thousands)                                                                                                                                                           (milliers)
         Second level student enrollment -                                                                                                               Elèves inscrits - 2ème degré - Total
                                                        73         82         96         99        102          105        111         114        ...
         Total (thousands)                                                                                                                                                          (milliers)
         Second level student enrollment -                                                                                                                     Elèves inscrits - 2ème degré -
                                                        25         29         31         32         33           33         37          39        ...
         Female (thousands)                                                                                                                                                Femmes (milliers)
         Third level student enrollment - Total                                                                                                          Elèves inscrits - 3ème degré - Total
                                                         ...        ...       1.5         ...        ...          ...        ...         ...      ...
         (thousands)                                                                                                                                                                (milliers)
         Third level student enrollment -                                                                                                                      Elèves inscrits - 3ème degré -
                                                         ...        ...       0.3         ...        ...          ...        ...         ...      ...
         Female (thousands)                                                                                                                                                Femmes (milliers)
         Public expenditure on education (%                                                                                                                Dépenses publiques consacrées à
                                                        8.9         ...        ...        ...        ...          ...        ...         ...      ...
         of budget)                                                                                                                                          l'enseignement (% du budget)

         Health                                                                                                                                                                        Santé

         Hospital beds - Total (per 10 000                                                                                                                 Nombre de lits d'hôpitaux - Total
                                                         ...       11          ...       10         10           10         10          10        ...
         population)                                                                                                                                                          (pour 10 000)
         Nurses - Total (per 10 000                                                                                                                       Nombre d'infirmières - Total (pour
                                                         ...         1         ...         2          8            5          6          ...      ...
         population)                                                                                                                                                                10 000)
         Physicians - Total (per 10 000                                                                                                                   Nombre de médecins - Total (pour
                                                         ...         0         ...         1          1            1         ...         ...      ...
         population)                                                                                                                                                              10 000)
         Public expenditure on Health (% of                                                                                                             Dépenses publiques consacrées à la
                                                          9        13         12         11         11            ...        ...         ...      ...
         budget)                                                                                                                                                     santé (% du budget)


      African Statistical Yearbook 2011 / Annuaire Statistique pour l'Afrique 2011
Gambia                                                                                                                                                    Gambie
                                                  II NATIONAL ACCOUNTS — COMPTES NATIONAUX

                                        2002      2003      2004      2005      2006        2007      2008       2009      2010

Gross domestic product by kind of economic activity at current prices
                                                                                   Produit intérieur brut par branche d'activité économique aux prix courants


Gambian Dalasi (Millions)                                                                                                               Dalasi Gambien(Millions)

Agriculture                              2 779     3 717     4 667     4 888     3 885       4 044     5 590      6 417        ...                            Agriculture

Mining and quarrying                      181       229       267       395       400         343        374       406         ...                 Industries extractives

Manufacturing                             809       822       973      1 185     1 259       1 327     1 241      1 278        ...            Industries manufacturières

Electricity, gas & water                   91       115       134       175       195         317        334       355         ...                 Electricité, gaz et eau

Construction                              740       897       982       547       824         712        820       829         ...          Bâtiments et travaux publics
Wholesale & retail trade,                                                                                                                Commerce de gros et de détail,
                                         4 021     4 296     4 819     4 772     5 661       6 587     6 824      6 693        ...
restaurants, hotels                                                                                                                               restaurants et hôtels
                                                                                                                                          Banques, assurances, affaires
Finance, insurance, real estate, etc.    1 390     1 888     1 702     1 850     1 968       2 049     2 543      2 841        ...
                                                                                                                                                          immobilières
Transport and communications             1 270     1 986     1 923     2 165     2 216       2 385     2 231      2 467        ...      Transport(s) et communications
                                                                                                                                            Administrations publiques et
Public administration and defense         369       417       376       416       471         561        832       894         ...
                                                                                                                                                                défense
Other services                            418       473       426       574       633         749        953       969         ...                        Autres services
                                                                                                                                         Moins Services d’intermédiation
Less Imputed Service Charges            - 507     - 573     - 516     - 600     - 684        - 672     - 743      - 868        ...
                                                                                                                                                               financière
Gross domestic product at factor                                                                                                     Produit intérieur brut aux couts des
                                        11 560    14 268    15 755    16 367    16 829      18 402    20 999     22 279        ...
cost / basic prices                                                                                                                                facteurs / prix de base

Plus: Indirect Taxes / taxes on                                                                                                      Plus taxes indirectes/impôts sur les
                                          - 43    - 372      1 626     1 567     1 856       2 154     1 980      2 527        ...
products, less subsidies                                                                                                                 produits, moins les subventions


Expenditure on Gross domestic product at current purchaser's values
                                                                                              Emploi du produit intérieur brut aux prix courants d'acquisition

Gambian Dalasi (Millions)                                                                                                               Dalasi Gambien(Millions)
                                                                                                                                               Consommation finale des
Government final consumption             1 244     1 325     1 404     1 261     1 164        984      1 747      1 885        ...
                                                                                                                                               administrations publiques

Private final consumption                8 184    10 268    15 172    16 191    15 912      18 252    19 279     20 813        ...           Consommation finale privée

Gross fixed capital formation            5 056     5 806     5 121     4 979     5 712       5 797     5 957      6 430        ...        Formation brute de capital fixe

Increase in inventories                 - 319     - 173       625       653       640         699        626       676         ...                   Variation des stocks

Exports of goods and services             780       965      1 148     1 211     1 493       1 634     1 465      1 581        ...     Exportations de biens et services
                                                                                                                                          Moins importations de biens et
                                                                                                                                                                             181
Less imports of goods and services       3 428     4 295     6 089     6 361     6 237       6 809     6 095      6 579        ...
                                                                                                                                                                services
GDP at purchasers' values               11 517    13 895    17 381    17 935    18 685      20 556    22 978     24 806        ...             PIB aux prix d'acquisition


Gross domestic product by kind of economic activity at constant
                                                                                  Produit intérieur brut par branche d'activité economique aux prix constants
prices
Annual Growth Rates (%)                                                                                                       Taux de croissance annuel (%)
Agriculture                                 ...       ...       ...       ...    -14.3        -1.9      26.6        5.5        ...                            Agriculture

Mining and quarrying                        ...       ...       ...       ...      1.2       -14.1       8.8        8.8        ...                 Industries extractives

Manufacturing                               ...       ...       ...       ...      4.1         3.9       -8.3       0.4        ...            Industries manufacturières

Electricity, gas & water                    ...       ...       ...       ...      8.7        59.1       1.7       10.0        ...                 Electricité, gaz et eau

Construction                                ...       ...       ...       ...      6.0        -4.3       5.0        3.0        ...          Bâtiments et travaux publics
Wholesale & retail trade,                                                                                                                       Commerce de gros et de
                                            ...       ...       ...       ...     16.0        10.3       -1.7       1.2        ...
restaurants, hotels                                                                                                                           détail,restaurants et hôtels
                                                                                                                                           Banques, assurances, affaires
Finance, insurance, real estate, etc.       ...       ...       ...       ...      2.4        -0.2      19.2        2.9        ...
                                                                                                                                                           immobilières
Transport and communications                ...       ...       ...       ...      2.7         7.0       -8.0       8.0        ...      Transport(s) et communications
                                                                                                                                            Administrations publiques et
Public administartion and defense           ...       ...       ...       ...     11.1        12.9      42.1        2.0        ...
                                                                                                                                                                défense
Other services                              ...       ...       ...       ...     11.0        17.8      27.0       37.1        ...                        Autres services
                                                                                                                                         Moins Services d’intérmediation
Less Imputed Service Charges                ...       ...       ...       ...     11.8        -7.0       5.7        6.0        ...
                                                                                                                                                               financière
Gross domestic product at factor                                                                                                     Produit intérieur brut aux couts des
                                                                                   2.1         5.6       8.4        5.3        ...
cost / basic prices                                                                                                                                facteurs / prix de base

Plus: Indirect Taxes / taxes on                                                                                                      Plus taxes indirectes/impôts sur les
                                            ...       ...       ...       ...     16.1        10.1      -12.0       2.0        ...
products, less subsidies                                                                                                                 produits, moins les subventions

Gross domestic product at market                                                                                                       Produit intérieur brut aux prix du
                                            ...       ...       ...       ...      3.4         6.0       6.3        5.0        ...
prices                                                                                                                                                            marché


2009: Estimated                                                                                                                                         2009: Estimée


                                                                                     African Statistical Yearbook 2011 / Annuaire Statistique pour l'Afrique 2011
Gambia                                                                                                                                                   Gambie

         Expenditure on Gross domestic product at constant purchasers'
                                                                                                   Emplois du produit intérieur brut aux prix constants d'acquisition
         values

         Annual Growth Rates (%)                                                                                                     Taux de croissance annuel (%)
                                                                                                                                                       Consommation finale des
         Government final consumption                 ...      ...      ...        ...     -9.6     -19.8      70.0       5.0         ...
                                                                                                                                                       administrations publiques

         Private final consumption                    ...      ...      ...        ...    12.9       4.3        1.5       5.0         ...            Consommation finale privée

         Gross fixed capital formation                ...      ...      ...        ...    -19.2     12.3       -6.3       5.0         ...        Formation brute de capital fixe

         Exports of goods and services                ...      ...      ...        ...    20.8       3.9      -18.0       5.0         ...      Exportations de biens et services

                                                                                                                                                 Moins importations de biens et
         Less imports of goods and services           ...      ...      ...        ...     -3.9      3.6      -18.1       5.0         ...
                                                                                                                                                                       services


                                                                                 III INFLATION

                                                   2002     2003     2004      2005      2006      2007      2008      2009      2010
         Annual Growth Rates (%)                                                                                                     Taux de croissance annuel (%)
         All Item                                    8.6     17.0     14.3        5.0      2.1       5.4        4.4       4.6        5.0                                Ensemble

         Food                                       12.3     20.4     16.1        3.2      0.4         ...      6.1       5.4        6.7                             Alimentation

         Health                                     13.9     13.2     10.1        5.5      2.3         ...      0.3       0.7        0.1                                    Santé

         Energy                                      0.0      0.0      0.0        0.0      0.0         ...      4.3       4.4        2.5                                  Energie

         Transport                                  13.9     13.2     10.1        5.5      2.3         ...      3.0       2.0       13.3                                Transport


                                                       IV AGRICULTURAL PRODUCTION - PRODUCTION AGRICOLE

                                                   2002     2003     2004      2005      2006      2007      2008      2009      2010
         Tons (Thousand)                                                                                                                                  Tonnes (milliers)
         Groundnuts in shells, Tons                   93      136      118        82        73       110       140        163         ...           Arachides en coques, tonnes
         (thousands)                                                                                                                                                  (milliers)
         Millet, Tons (thousands)                    107      116       ...      123       118        89       122        103         ...                 Millet, tonnes (milliers)

         Sorghum, Tons (thousands)                    33       29       ...       31        20        18        26         13         ...               Sorgho, tonnes (milliers)

         Maize, Tons (thousands)                      30       29       ...       30        29        31        45         69         ...                  Maïs, tonnes (milliers)

         Rice, Tons (thousands)                       18       21       ...       20        16        11        38         68         ...                   Riz, tonnes (milliers)


                                                            V MINING PRODUCTION - PRODUCTION MINIERE
182
                                                   2002     2003     2004      2005      2006      2007      2008      2009      2010

         Gravel and crushed stone, metric                                                                                                         Graviers et pierres concentrés,
                                                   500.0       ...      ...        ...       ...       ...       ...       ...        ...
         tons (thousands)                                                                                                                            tonnes métriques (milliers)
         Clays, metric tons (thousands)              8.6      9.0       ...        ...       ...       ...       ...       ...        ...    Argiles, tonnes métriques (milliers)


                                                      ...      ...      ...        ...       ...       ...       ...       ...        ...


                                                                              VI ENERGY - ENERGIE

                                                   2002     2003     2004      2005      2006      2007      2008      2009      2010

         Electricity - total hydro production,                                                                                               Électricité - production hydraulique
                                                      ...      ...      ...        ...       ...       ...       ...       ...        ...
         kilowatt hours (millions)                                                                                                              totale, kilowatt-heures (millions)

         Electricity - total thermal production,                                                                                               Électricité - production thermique
                                                   151.2    168.0    185.0      203.0    216.0     229.0         ...       ...        ...
         kilowatt hours (millions)                                                                                                              totale, kilowatt-heures (millions)

         Electricity - total production, self-                                                                                              Electricité - Production totale privée
                                                      16       18       20        23        26        28         ...       ...        ...
         producer (Million Kilowatt Hours)                                                                                                            (million de kilowatt heures)

         Electricity - total production, public                                                                                                    Electricité - Production totale
                                                     135      150      165       180       190       201         ...       ...        ...
         (Million Kilowatt Hours)                                                                                                           publique (million de kilowatt heures)


      African Statistical Yearbook 2011 / Annuaire Statistique pour l'Afrique 2011
Gambia                                                                                                                                                                 Gambie
                                         VII TOURISM AND INFRASTRUCTURE - TOURISME ET INFRASTUCTURE

                                          2002       2003       2004       2005        2006         2007       2008        2009        2010

Arrivals - Tourists (thousands)           48.002     75.347     90.095     107.904      124.8      142.606     146.759     141.569         ...           Arrivées - touristes (milliers)

Rooms in hotels and similar                                                                                                                    Chambres d'hotels et établissements
establishments (thousands)                     ...        ...        ...     6.132      7.984        8.623       8.623       8.623         ...                  assimilés (milliers)

Paved Road (% of total)                        ...        ...        ...         ...        ...          ...         ...         ...       ...        Routes asphaltées (% du total)
Total Network (Railways-km)                    ...        ...      730         780        780          780           ...         ...       ...         Réseau total voies ferrées-Km
Main Telephone Lines (per 1,000                                                                                                                      Lignes téléphoniques fixes (pour
                                              28         29         42          44         53           56          58          58         ...
inhabitants)                                                                                                                                                         1000 habitants)
Mobile Cellular Subscribers (per                                                                                                                     Abonnés aux téléphones mobiles
                                              72         10         10          10         10           10          10         275         ...
1,000 inhabitants)                                                                                                                                            (pour 1000 habitants)


                          VII FINANCIAL AND MONETARY STATISTICS - FINANCES ET STATISTIQUES MONETAIRES

                                          2002       2003       2004       2005        2006         2007       2008        2009        2010

VII-1 Monetary Statistics                                                                                                                   VII-1 Statistiques monétaires
Gambian Dalasi (Millions)                                                                                                                            Dalasi Gambien(Millions)
Money supply (M1)                          1 757      2 873      3 108       3 321      4 185        4 209       5 120       5 600         ...                 Masse monétaire (M1)
Quasi-money                                1 446      1 720      2 324       2 825      3 572        4 065       4 677       6 095         ...                         Quasi-monnaie
  of which Demand Deposit                      ...        ...        ...         ...        ...          ...         ...         ...       ...              dont Monnaie scripturale
Net foreign assets                         1 731      1 531      2 924       3 025      4 047        3 860       3 271       3 702         ...                  Avoirs extérieurs nets
Domestic credit                            1 866      3 265      2 481       3 130      3 876        3 828       6 166       7 560         ...                         Crédit intérieur

of which claims on private sector          1 227      1 633      1 454       1 719      2 230        2 600       3 164       3 694         ...     dont créances sur le secteur privé

of which Claims on government                                                                                                                             dont créances nettes sur le
                                             565      1 426        940       1 289      1 516        1 137       2 677       3 187         ...
sector, net                                                                                                                                                           gouvernement
International reserves (millions of US                                                                                                           Réserves internationales (millions de
                                             107         59         84          98        121          143         117         224         ...
$)                                                                                                                                                                               $ EU)
Average Exchange Rate (National                                                                                                                   Taux de change (moyen) (monnaie
                                           19.92      27.31      30.03       28.58      28.07        24.88       22.19       26.64         ...
Currency per us $)                                                                                                                                            nationale par dollars)


VII-2 Public Finance                                                                                                                                 VII-2 Finances publiques
Gambian Dalasi (Millions)                                                                                                                            Dalasi Gambien(Millions)
Total Revenues and Grants                  1 523      1 820      3 065       2 823      3 203        3 662       3 744       4 909      4 781                Recettes totales et dons
  Tax Revenue                              1 040      1 381      2 245       2 263      2 678        3 037       3 146       3 517      3 441                        Recettes fiscales
  Non Tax Revenue                            162        194        273         340        346          431         354         371        430                   Recettes non fiscales
  Grants                                     321        246        547         220        180          194         244       1 021        910                                    Dons      183
Total Expenditures and Net Lending         1 854      2 293      3 750       3 961      4 211        3 635       4 138       5 684      4 943          Dépenses totales et prêts nets

  Current expenditure                        948      1 099      1 168       1 290      1 663        1 771       2 472       2 881      3 056                    Dépenses courantes
  Of which Wages and Salaries                395        453        518         554        653          680         983       1 192      1 461          Dont rémunérations et salaires
  Capital expenditure                        568        608      1 734       1 450      1 564          973         857       1 924      1 045                Dépenses d'équipement
  Net Lending                               - 33       - 23       - 23        - 30         63           76          96         138       - 32                               Prêts nets
Fiscal Balance                             - 331      - 472      - 685      - 1 138    - 1 008          28       - 394       - 775      - 162         Solde global y compris les dons


VII-3 Balance of Payments                                                                                                                        VII-3 Balance des paiements
Gambian Dalasi (Millions)                                                                                                                            Dalasi Gambien(Millions)
Trade balance                             - 2 880    - 2 068    - 3 061     - 3 616    - 3 368      - 3 762     - 1 915     - 2 393        ...                  Balance commerciale
Services Balance                             629      1 132        806       1 010       - 56        1 045         714         571         ...                   Balance des services
Net Income                                 - 446      - 648      - 816       - 924     - 1 063      - 1 111      - 757       - 215         ...                           Revenus nets
Current transfers, net total                 852      1 465      1 982       2 054      2 459        2 123       1 809       3 619         ...                    Transferts courants
Current account balance                   - 1 844     - 118     - 1 089     - 1 476    - 2 028      - 1 705      - 149       1 582         ...              Solde du compte courant


VII-4 External Debt and Financial Flows                                                                                           VII-4 Dette extérieure et flux financiers
US $ (Millions)                                                                                                                                                   $ E.U (Millions)
Total external debt                          432        456        480         549        568          180         236         316         ...                 Dette extérieure totale
  Private                                     58         61           0          0          0            0           0           0         ...                                  Privée
  Public                                     498        514        588         621        677          299         301         316         ...                               Publique
Total external debt service                   65         43         52          62         69           71          69          70         ...          Service de la dette extérieure
Net Foreign Direct Investment                                                                                                                    Investissements étranger direct (flux
                                              43         15         49          45         71           76          63           0         ...
Inflows                                                                                                                                                                nets entrants)
Net Total Official Development                                                                                                                      Aide publique au développement
                                              62         63         55          60         73           73          94           0         ...
assistance                                                                                                                                                             (nette totale)


                                                                                              African Statistical Yearbook 2011 / Annuaire Statistique pour l'Afrique 2011
Gambia                                                                                                                                         Gambie

                                                  2002     2003     2004     2005     2006     2007     2008     2009       2010

         US $ (Millions)                                                                                                                           Dalasi Gambien
         Exports, fob                                                                                                                            Exportations, fàb


         Exports - Total                            109      101      97       81       84       91       87         81        ...                  Exportations - Total


         Main Products                                                                                                                           Principaux produits


         Ground nut Shelled                           1        0       1        2        6        1        1          0        ...               Noix d'arachide, coque


         Fish and fish preserved                      1        0       0        1        0        3        3          0        ...      Poissons et poissons conservés


         Hides and skins                              0        0       0        0        0        0        0          0        ...                       Cuirs et peaux


         Cotton                                       0        0       0        0        0        0        0          0        ...                                Coton


         Fruits and Vegetable                         1        1       1        1        3        1        3          0        ...                    Fruits et légumes

         Main Destinations                                                                                                                  Principales destinations

         India                                      4.4      3.8     11.3     12.7     17.3     15.4     29.0      52.4        ...                                 Inde


         United Kingdom                             5.8      4.7      5.9      5.3      6.6      4.3      2.9     416.7     131.4                         Royaume-Uni


         France                                     6.9      0.3      5.8      0.3      2.9      2.6      2.1     228.8     170.9                                France


         China                                       ...     1.5      0.1      0.2      0.4      8.7      3.2     170.9        ...                                Chine


         Belgium                                    1.9      1.0      1.0      1.3      0.9      2.1      1.8     131.4        ...                             Belgique


                                                  2002     2003     2004     2005     2006     2007     2008     2009       2010
         Imports, cif                                                                                                                            Importations, cif

184      Imports - Total                             ...      ...      ...      ...      ...      ...      ...        ...      ...       Importations - Total (millions)


                                                                                                                                                 Principaux produits
         Main Products


                                                                                                                                        Huile de palme et ses fractions,
         Palm oil and its fractions refined but
                                                      3        9      12       14       16       28       30         30        ...   raffinées, mais non chimiquement
         not chemically modified
                                                                                                                                                              modifiées


         Rice, broken                                 0        1       4       14       13       17       28         32        ...                            Riz, cassé


         Rice, semi-milled or wholly milled,                                                                                         Riz semi-blanchi ou blanchi, même
                                                      0        1       3       13        3        4       25          9        ...
         whether or not polished or glazed                                                                                                                 poli ou glacé

         Refined sugar, in solid form, nes           19       24      24       24       26       39       23         48        ... Sucre raffiné, sous forme solide, nsa


         Wheat or meslin flour                        7        8      13        9       14       19       11         17        ...                    Blé nda et méteil


         Main Origin                                                                                                                       Principales provenances

         China                                     81.9    116.0    124.2    124.4    162.4    185.6    175.7     929.1        ...                                Chine

         Senegal                                   33.8     42.9     65.7     73.4     83.3     83.7     90.6         ...      ...                              Sénégal

         Brazil                                    22.1     27.2     31.0     32.5     42.3     62.8     48.5     460.7        ...                                Brésil

         Ivory Coast                               18.0     15.9     17.7     49.5     51.9     47.3     62.1    1 156.3       ...                                Chine

         Netherlands                               21.0     24.4     23.8     23.7     28.7     40.8     42.9     458.7        ...                            Pays-Bas


      African Statistical Yearbook 2011 / Annuaire Statistique pour l'Afrique 2011
Ghana                                                                                                                                                                                Ghana

AREA (KM 2)                                                                                         238 533                                                                SUPERFICIE (KM 2)
CAPITAL CITY                             Accra                                                                                                     Accra                               CAPITALE
CURRENCY                                 Cedi                                                                                                       Cedi                               MONNAIE


                        I SOCIAL AND DEMOGRAPHIC INDICATORS — INDICATEURS DEMOGRAPHIQUES ET SOCIAUX

                                           2002           2003         2004         2005         2006         2007         2008         2009       2010
Population                                                                                                                                                                          Population
                                                                                                                                                                Population au milieu de l'année -
Mid-year population - Total (Million)         20.5           21.0         21.4         21.9         22.4         22.9         23.4         23.8       ...
                                                                                                                                                                                   Total (million)
                                                                                                                                                                Population au milieu de l'année -
Mid-year population - Urban (%)                   ...          ...        47.0         48.0         49.0         49.0         50.0         50.7       ...
                                                                                                                                                                                   Urbaine (%)

Female (%)                                    49.3           49.3         49.3         49.3         49.3         49.3         49.3         49.3       ...                             Femme (%)


Population by Age Group                                                                                                                                             Population par groupe d'âge


   0-14                                   8318 729       8445 202     8569 415     8690 831     8809 016     8924 693     9039 833     9157 090       ...                                     0-14


   15-64                                 11461 808      11791 375    12124 083    12458 641    12794 707    13132 627    13472 684    13815 422       ...                                    15-64


   65+                                     694 384        717 982      741 760      765 696      789 615      813 645      838 411      864 749       ...                                     65+


Active Population (000)                    9 003.0        9 235.0      9 468.0      9 707.0      9 945.0     10 250.0     10 527.0     10 816.0       ...                 Population active (000)

   Female (%)                                 48.6           48.8         49.0         49.2         49.4         49.0         49.0         49.0       ...                             Femme (%)

                                                                                                                                                               Taux brut de natalité - Total (par
Crude birth rate - Total (per 1000)           33.8           33.6         33.3         33.1         32.9         32.6         32.4         32.1       ...
                                                                                                                                                                                           1000)
                                                                                                                                                             Taux brut de mortalité - Total (par
Crude death rate - Total (per 1000)           10.7           10.8         11.0         11.1         11.1         11.1         11.1         11.0       ...
                                                                                                                                                                                          1000)
Life expectancy at birth - Total                                                                                                                               Espérance de vie à la naissance -
                                              57.2           56.9         56.7         56.5         56.5         56.5         56.6         56.8       ...
(years)                                                                                                                                                                          Total (années)
Net reproduction rate - (per                                                                                                                                    Taux net de reproduction - (par
                                                  ...          ...          ...         1.6           ...          ...          ...          ...      ...
woman)                                                                                                                                                                                  femme)
                                                                                                                                                               Indice synthétique de fécondité -
Total fertility rate - (p woman)
              y        (per    )                 4.6          4.5          4.5          4.4          4.4          4.3          4.3          4.2       ...
                                                                                                                                                                                   (par femme)

Education                                                                                                                                                                      Enseignement

Teaching staff at first level - Total                                                                                                                        Personnel enseignant - 1er degré -
                                                  ...          ...          ...          ...          ...          ...          ...          ...      ...
(thousands)                                                                                                                                                                     Total (milliers)
Teaching staff at second level - Total                                                                                                                      Personnel enseignant - 2ème degré -
                                                  ...          ...          ...          ...          ...          ...          ...          ...      ...                                              185
(thousands)                                                                                                                                                                      Total (milliers)
Teaching staff at third level - Total                                                                                                                     Personnel enseignant - 3ème degré -
                                                  ...          ...          ...          ...          ...          ...          ...          ...      ...
(thousands)                                                                                                                                                                    Total (milliers)
First level student enrollment - Total                                                                                                                         Elèves inscrits - 1er degré - Total
                                                  ...          ...          ...          ...          ...          ...          ...          ...      ...
(thousands)                                                                                                                                                                              (milliers)
First level student enrollment -                                                                                                                            Elèves inscrits - 1er degré - Femmes
                                             1 227          1 219        1 270        1 404        1 518        1 634        1 700           ...      ...
Female (thousands)                                                                                                                                                                        (milliers)
Second level student enrollment -                                                                                                                            Elèves inscrits - 2ème degré - Total
                                             1 107          1 171        1 277        1 350        1 454        1 619        1 691           ...      ...
Total (thousands)                                                                                                                                                                       (milliers)
Second level student enrollment -                                                                                                                                  Elèves inscrits - 2ème degré -
                                              497            527          568          608          653          740          776            ...      ...
Female (thousands)                                                                                                                                                             Femmes (milliers)
Third level student enrollment - Total                                                                                                                       Elèves inscrits - 3ème degré - Total
                                                  ...          ...          ...       119.6        110.2        140.0           ...          ...      ...
(thousands)                                                                                                                                                                             (milliers)
Third level student enrollment -                                                                                                                                   Elèves inscrits - 3ème degré -
                                                  ...          ...          ...        41.8         37.1         47.9           ...          ...      ...
Female (thousands)                                                                                                                                                             Femmes (milliers)
Public expenditure on education (%                                                                                                                             Dépenses publiques consacrées à
                                                  ...          ...          ...          ...          ...          ...          ...          ...      ...
of budget)                                                                                                                                                       l'enseignement (% du budget)

Health                                                                                                                                                                                     Santé

Hospital beds - Total (per 10 000                                                                                                                              Nombre de lits d'hôpitaux - Total
                                                 82            ...         89            ...          ...          ...          ...          ...      ...
population)                                                                                                                                                                       (pour 10 000)
Nurses - Total (per 10 000                                                                                                                                    Nombre d'infirmières - Total (pour
                                                  ...          ...          ...         90            ...          ...          ...          ...      ...
population)                                                                                                                                                                             10 000)
Physicians - Total (per 10 000                                                                                                                                Nombre de médecins - Total (pour
                                                   9          11           15            ...          ...          ...          ...          ...      ...
population)                                                                                                                                                                           10 000)
Public expenditure on Health (% of                                                                                                                          Dépenses publiques consacrées à la
                                                   9            9            7            7            4           ...          ...          ...      ...
budget)                                                                                                                                                                  santé (% du budget)


                                                                                                        African Statistical Yearbook 2011 / Annuaire Statistique pour l'Afrique 2011
Ghana                                                                                                                                                  Ghana
                                                           II NATIONAL ACCOUNTS — COMPTES NATIONAUX

                                                  2002     2003     2004     2005     2006       2007       2008      2009       2010

          Gross domestic product by kind of economic activity at current prices
                                                                                         Produit intérieur brut par branche d'activité économique aux prix courants


          Cedi (Millions)                                                                                                                                    Cedi(Millions)

          Agriculture                             1 717    2 418    3 032    3 643     5 415       6 320     8 875    11 379     13 037                             Agriculture

          Mining and quarrying                      231      311      366      447      497         602       693        740       823                   Industries extractives

          Manufacturing                             441      594      698      842     1 824       1 991     2 277     2 478      2 791             Industries manufacturières

          Electricity, gas & water                  132      177      207      267      367         357       384        413       527                   Electricité, gaz et eau

          Construction                              432      587      703      888     1 016       1 565     2 501     3 144      3 901           Bâtiments et travaux publics
          Wholesale & retail trade,                                                                                                            Commerce de gros et de détail,
                                                    336      453      549      694     2 426       2 960     3 919     5 134      6 420
          restaurants, hotels                                                                                                                           restaurants et hôtels
                                                                                                                                                Banques, assurances, affaires
          Finance, insurance, real estate, etc.     211      286      342      423      995        1 341     1 781     2 344      3 197
                                                                                                                                                                immobilières
          Transport and communications              215      293      353      437     2 840       3 360     3 884     4 484      5 329       Transport(s) et communications
                                                                                                                                                  Administrations publiques et
          Public administration and defense         492      659      773      932      862        1 289     1 799     2 479      2 935
                                                                                                                                                                      défense
          Other services                            173      231      273      327     1 566       1 971     2 552     3 337      4 187                         Autres services
                                                                                                                                               Moins Services d’intermédiation
          Less Imputed Service Charges               ...      ...      ...      ...       ...         ...       ...        ...       ...
                                                                                                                                                                     financière
          Gross domestic product at factor                                                                                                 Produit intérieur brut aux couts des
                                                  4 380    6 009    7 298    8 899    17 810      21 755    28 664    35 932     43 148
          cost / basic prices                                                                                                                            facteurs / prix de base

          Plus: Indirect Taxes / taxes on                                                                                                  Plus taxes indirectes/impôts sur les
                                                    506      607      691      827      895        1 400     1 515       936      1 651
          products, less subsidies                                                                                                             produits, moins les subventions


          Expenditure on Gross domestic product at current purchaser's values
                                                                                                    Emploi du produit intérieur brut aux prix courants d'acquisition

          Cedi (Millions)                                                                                                                                    Cedi(Millions)
                                                                                                                                                     Consommation finale des
          Government final consumption              859    1 172    1 320    1 489     2 114       2 676     3 393     3 535      5 025
                                                                                                                                                     administrations publiques

          Private final consumption               3 871    4 980    6 085    7 903    15 450      19 598    26 183    30 115     35 615            Consommation finale privée

          Gross fixed capital formation             939    1 517    2 267    2 821     4 047       4 656     6 474     7 216     10 037         Formation brute de capital fixe

          Increase in inventories                    ...      ...      ...      ...       ...         ...       ...        ...       ...                   Variation des stocks

          Exports of goods and services           2 073    2 691    3 140    3 510     4 712       5 679     7 554    11 245     11 325      Exportations de biens et services
186                                                                                                                                             Moins importations de biens et
          Less imports of goods and services      2 856    3 745    4 823    5 997     7 619       9 454    13 425    15 244     17 203
                                                                                                                                                                      services
          GDP at purchasers' values               4 886    6 616    7 989    9 726    18 705      23 155    30 179    36 867     44 799              PIB aux prix d'acquisition


          Gross domestic product by kind of economic activity at constant
                                                                                        Produit intérieur brut par branche d'activité economique aux prix constants
          prices
          Annual Growth Rates (%)                                                                                                   Taux de croissance annuel (%)
          Agriculture                               4.4      6.1      7.0      4.1       4.5        -1.7       7.4       7.6        4.8                             Agriculture

          Mining and quarrying                      4.5      4.7      3.0      6.3       3.5       101.5      13.2      -10.5       6.0                  Industries extractives

          Manufacturing                             4.8      4.6      4.6      5.0       2.0       -33.6       9.0       7.1        6.0             Industries manufacturières

          Electricity, gas & water                  4.1      4.2      3.7     12.4       2.6         1.2      27.9       2.5        6.0                  Electricité, gaz et eau

          Construction                              5.0      6.1      6.6     10.0      15.0        32.4      18.4      13.6        6.0           Bâtiments et travaux publics
          Wholesale & retail trade,                                                                                                                   Commerce de gros et de
                                                    5.6      5.0      6.0     10.0       7.5        10.0      10.0       7.7        7.7
          restaurants, hotels                                                                                                                       détail,restaurants et hôtels
                                                                                                                                                 Banques, assurances, affaires
          Finance, insurance, real estate, etc.     5.5      5.2      4.8      7.6       7.6        12.4      11.5       7.6        7.6
                                                                                                                                                                 immobilières
          Transport and communications              5.7      5.8      5.2      7.9       7.2         6.0       8.0      11.8       11.8       Transport(s) et communications
                                                                                                                                                  Administrations publiques et
          Public administartion and defense         3.6      4.0      4.4      5.0       5.7         6.0       2.7      15.5       15.5
                                                                                                                                                                      défense
          Other services                            4.0      3.8      4.0      4.0       4.3         5.1       5.3       -9.6      -3.6                         Autres services
                                                                                                                                               Moins Services d’intérmediation
          Less Imputed Service Charges               ...      ...      ...      ...       ...         ...       ...        ...       ...
                                                                                                                                                                     financière
          Gross domestic product at factor                                                                                                 Produit intérieur brut aux couts des
                                                    4.6      5.3      5.7      6.0       6.6         4.5       9.3       6.5        6.8
          cost / basic prices                                                                                                                            facteurs / prix de base

          Plus: Indirect Taxes / taxes on                                                                                                  Plus taxes indirectes/impôts sur les
                                                    4.3      4.4      4.3      4.4       2.8        45.6      -4.2      -25.2       2.8
          products, less subsidies                                                                                                             produits, moins les subventions

          Gross domestic product at market                                                                                                   Produit intérieur brut aux prix du
                                                    4.5      5.2      5.6      5.9       6.4         6.5       8.4       4.7        6.6
          prices                                                                                                                                                        marché


      Break in the serie from 2006                                                                                                    Rupture de la série à partir 2006


      African Statistical Yearbook 2011 / Annuaire Statistique pour l'Afrique 2011
Ghana                                                                                                                                                                   Ghana

Expenditure on Gross domestic product at constant purchasers'
                                                                                                       Emplois du produit intérieur brut aux prix constants d'acquisition
values

Annual Growth Rates (%)                                                                                                                  Taux de croissance annuel (%)
                                                                                                                                                           Consommation finale des
Government final consumption                  -4.4         4.5        -5.4        -3.9       -3.4         1.5      13.0      -11.9      57.0
                                                                                                                                                           administrations publiques

Private final consumption                     12.3         6.5         3.1         6.3        7.8         8.0       7.9       1.9        5.9             Consommation finale privée

Gross fixed capital formation                -21.1        29.3        28.7         7.7       23.6        18.3      30.1      -24.2      45.7         Formation brute de capital fixe

Exports of goods and services                 -2.2        -6.1        11.4         9.3       10.3        18.2      16.7      12.6       53.7       Exportations de biens et services

                                                                                                                                                     Moins importations de biens et
Less imports of goods and services             2.1         7.7         8.9         6.7       13.7        21.7      24.6      -14.1      69.4
                                                                                                                                                                           services


                                                                                  III INFLATION

                                           2002        2003        2004        2005       2006        2007       2008      2009       2010
Annual Growth Rates (%)                                                                                                                  Taux de croissance annuel (%)
All Item                                     14.8        26.7        12.6        15.4       11.7        10.7       16.4      19.2       10.8                               Ensemble

Food                                            ...         ...         ...      13.6         9.9         9.5      15.2      15.6        6.1                            Alimentation

Health                                          ...         ...         ...      20.2       20.7        31.7       19.6      48.3       12.1                                   Santé

Energy                                          ...         ...         ...      24.0       20.0        16.1       17.8       4.6       14.8                                  Energie

Transport                                       ...         ...         ...      31.5       28.0        17.4       23.2       2.8       10.3                               Transport


                                                 IV AGRICULTURAL PRODUCTION - PRODUCTION AGRICOLE

                                           2002        2003        2004        2005       2006        2007       2008      2009       2010
Tons (Thousand)                                                                                                                                               Tonnes (milliers)
Cassava, Tons (thousands)                   9 731      10 239       9 739       9 567      9 638       9 650         ...        ...       ...               Manioc, tonnes (milliers)

Yams, Tons (thousands)                      3 900       3 813       3 892       3 893      3 600       3 550         ...        ...       ...             Ignames, tonnes (milliers)

Plantains, Tons (thousands)                 2 279       2 329       2 381       2 792      2 900       2 930         ...        ...       ...             Plantains, tonnes (milliers)

Taro, Tons (thousands)                      1 860       1 805       1 716       1 686      1 660       1 662         ...        ...       ...                Taros, tonnes (milliers)

Maize, Tons (thousands)                     1 400       1 289       1 158       1 171      1 189       1 100      1 100         ...       ...                  Maïs, tonnes (milliers)


                                                        V MINING PRODUCTION - PRODUCTION MINIERE
                                                                                                                                                                                         187
                                           2002        2003        2004        2005       2006        2007       2008      2009       2010

Aluminium ores and concentrates                                                                                                                  Minerais d'aluminium et concentrés
                                            684.0       495.0       498.0       606.7      841.8      1 033.4        ...        ...       ...
(Bauxite), metric tons (thousands)                                                                                                                      (Bauxite), tonnes métriques
Gold ores and concentrates,               65 547.0    69 600.0    63 139.0    66 530.0   72 323.0    83 558.0        ...        ...       ...            Minerais d'or et concentrés
Kilograms                                                                                                                                                             (Kilogrammes)
Diamonds, industrial, carat
                                            193.0       180.0       180.0       200.0      190.0       180.0         ...        ...       ... Diamants industriels, carat (milliers)
(thousands)


                                                                              VI ENERGY - ENERGIE

                                           2002        2003        2004        2005       2006        2007       2008      2009       2010

Electricity - total hydro production,                                                                                                            Électricité - production hydraulique
                                           5 036.0     3 885.0     5 281.0     5 629.0    5 619.0     3 727.0        ...        ...       ...
kilowatt hours (millions)                                                                                                                           totale, kilowatt-heures (millions)

Electricity - total thermal production,                                                                                                            Électricité - production thermique
                                           2 265.0     2 020.0      763.0      1 164.0    2 816.0     3 257.0        ...        ...       ...
kilowatt hours (millions)                                                                                                                           totale, kilowatt-heures (millions)

Electricity - total production, self-                                                                                                           Electricité - Production totale privée
                                                 5           5           5          5          6           6         ...        ...       ...
producer (Million Kilowatt Hours)                                                                                                                         (million de kilowatt heures)

Electricity - total production, public                                                                                                                 Electricité - Production totale
                                            7 296       5 900       6 039       6 788      8 429       6 978         ...        ...       ...
(Million Kilowatt Hours)                                                                                                                        publique (million de kilowatt heures)


                                                                                                African Statistical Yearbook 2011 / Annuaire Statistique pour l'Afrique 2011
Ghana                                                                                                                                                                      Ghana
                                                  VII TOURISM AND INFRASTRUCTURE - TOURISME ET INFRASTUCTURE

                                                   2002       2003       2004        2005        2006        2007        2008        2009        2010

         Arrivals - Tourists (thousands)              483        531         584         429         497         587           ...         ...        ...           Arrivées - touristes (milliers)

         Rooms in hotels and similar                                                                                                                      Chambres d'hotels et établissements
         establishments (thousands)                    16         17          18          19           ...         ...         ...         ...        ...                  assimilés (milliers)

         Paved Road (% of total)                        ...        ...         ...        15           ...         ...         ...         ...        ...        Routes asphaltées (% du total)
         Total Network (Railways-km)                    ...      977         977           ...         ...         ...         ...         ...        ...         Réseau total voies ferrées-Km
         Main Telephone Lines (per 1,000                                                                                                                        Lignes téléphoniques fixes (pour
                                                       13         14          15          15          16          16            6          ...        ...
         inhabitants)                                                                                                                                                           1000 habitants)
         Mobile Cellular Subscribers (per                                                                                                                       Abonnés aux téléphones mobiles
                                                       19         38          79         131         233         332         496           ...        ...
         1,000 inhabitants)                                                                                                                                              (pour 1000 habitants)


                                   VII FINANCIAL AND MONETARY STATISTICS - FINANCES ET STATISTIQUES MONETAIRES

                                                   2002       2003       2004        2005        2006        2007        2008        2009        2010

         VII-1 Monetary Statistics                                                                                                                     VII-1 Statistiques monétaires
         Cedi (Millions)                                                                                                                                                       Cedi(Millions)
         Money supply (M1)                          1 307      1 512       1 924       2 161       2 962       3 968       5 531       6 721      8 664                   Masse monétaire (M1)
         Quasi-money                                  360        542         690         962       1 389       1 986       2 756       3 873      4 998                           Quasi-monnaie
           of which Demand Deposit                      ...        ...         ...         ...         ...         ...         ...         ...        ...              dont Monnaie scripturale
         Net foreign assets                           352        933       1 251       1 478       2 088       2 431       2 686       3 827      5 486                    Avoirs extérieurs nets
         Domestic credit                            1 690      1 781       2 511       3 000       3 948       5 294       8 420      10 511     12 893                           Crédit intérieur

         of which claims on private sector            594        827       1 052       1 512       2 075       3 355       4 793       5 730      7 039       dont créances sur le secteur privé

         of which Claims on government                                                                                                                               dont créances nettes sur le
                                                      854        688       1 347       1 229       1 533       1 323       2 641       3 606      4 643
         sector, net                                                                                                                                                             gouvernement
         International reserves (millions of US                                                                                                             Réserves internationales (millions de
                                                      540      1 353       1 627       1 753       2 090           ...         ...         ...        ...
         $)                                                                                                                                                                                 $ EU)
         Average Exchange Rate (National                                                                                                                     Taux de change (moyen) (monnaie
                                                     0.79       0.87        0.90        0.91        0.92        0.94        1.06        1.41       1.43
         Currency per us $)                                                                                                                                              nationale par dollars)


         VII-2 Public Finance                                                                                                                                   VII-2 Finances publiques
         Cedi (Millions)                                                                                                                                                       Cedi(Millions)
         Total Revenues and Grants                    944      1 615       2 375       2 830       3 192       4 508       5 623       6 881      8 167                 Recettes totales et dons
           Tax Revenue                                765      1 263       1 702       2 013       2 326       3 313       4 368       4 804      6 068                         Recettes fiscales
           Non Tax Revenue                             26         40         165         311         231         338         434         870        813                    Recettes non fiscales
188        Grants                                     153        312         508         506         635         857         821       1 207      1 286                                     Dons

         Total Expenditures and Net Lending         1 275      1 903       2 659       2 986       4 010       5 701       8 012       8 417     11 089           Dépenses totales et prêts nets

           Current expenditure                        559        763         973       1 138       1 870       2 176       3 104       3 268      4 536                     Dépenses courantes
           Of which Wages and Salaries                414        557         699         827       1 137       1 419       1 988       2 479      3 051           Dont rémunérations et salaires
           Capital expenditure                        299        591         989       1 167       1 449       1 630       2 481       2 497      3 336                 Dépenses d'équipement
           Net Lending                                  0          0           0           0            0        387         279         288           0                               Prêts nets
         Fiscal Balance                             - 331      - 288       - 284       - 156       - 818      - 1 193     - 2 389     - 1 535    - 2 923         Solde global y compris les dons


         VII-3 Balance of Payments                                                                                                                          VII-3 Balance des paiements
         Cedi (Millions)                                                                                                                                                       Cedi(Millions)
         Trade balance                             - 5 482    - 5 811    - 14 327    - 23 066    - 27 741    - 36 419    - 52 877    - 49 762         ...                  Balance commerciale
         Services Balance                           - 923     - 2 338     - 3 204     - 1 510     - 1 229     - 1 494     - 1 913     - 2 703         ...                   Balance des services
         Net Income                                 - 984     - 1 569     - 1 779     - 1 696     - 1 167     - 1 026     - 1 472     - 5 483         ...                           Revenus nets
         Current transfers, net total               7 141     12 128      16 470      19 262      22 712      21 170      29 352      16 144          ...                    Transferts courants
         Current account balance                    - 247      2 410      - 2 841     - 7 009     - 7 426    - 17 768    - 26 910    - 41 804         ...              Solde du compte courant


         VII-4 External Debt and Financial Flows                                                                                            VII-4 Dette extérieure et flux financiers
         US $ (Millions)                                                                                                                                                     $ E.U (Millions)
         Total external debt                        7 215      8 689       9 581       7 982       4 217       5 748       6 227       7 298          ...                 Dette extérieure totale
           Private                                  1 083      1 140       3 133       1 634       2 041       2 162       2 192       2 252          ...                                  Privée
           Public                                   6 131      7 549       6 448       6 348       2 177       3 586       4 035       5 046          ...                               Publique
         Total external debt service                  267        161         195         227         581         181         329         579          ...          Service de la dette extérieure
         Net Foreign Direct Investment                                                                                                                      Investissements étranger direct (flux
                                                       59        105         139         145         636         855       2 120           ...        ...
         Inflows                                                                                                                                                                  nets entrants)
         Net Total Official Development                                                                                                                        Aide publique au développement
                                                      657        967       1 403       1 136       1 175       1 154       1 293           ...        ...
         assistance                                                                                                                                                               (nette totale)


      African Statistical Yearbook 2011 / Annuaire Statistique pour l'Afrique 2011
Ghana                                                                                                                                                       Ghana

                                         2002     2003     2004     2005     2006         2007       2008       2009       2010

US $ (Millions)                                                                                                                                                    Cedi
Exports, fob                                                                                                                                      Exportations, fàb


Exports - Total                          2 015    2 562    2 704    2 802     3 727        4 172      5 270      5 786        ...                   Exportations - Total


Main Products                                                                                                                                     Principaux produits


Cocoa beans, whole or broken, raw                                                                                                   Cacao en fèves et brisures de fèves,
                                           564      803      934      947     1 183        1 401      1 743      1 578        ...
or roasted                                                                                                                                            bruts ou torrefiés


Minerais de manganèse et leurs                                                                                                       Manganese ores and concentrates
                                            74      102      125      146       116          254        620        264        ...
concentrés, etc                                                                                                                                                  etc


Petroleum oils&oils obtained from
                                                                                                                                          Huiles de pétrole, bitumineux,
bituminous minerals,o/than crude            40       64       93      157       107          125        173         20        ...
                                                                                                                                                      distilles, sauf brut
etc

Tuna, skipjack, bonito,                                                                                                                           Thon, bonite, bonite,
                                            61       76       73       78        77           96        130        123        ...
prepared/preserved, not mince                                                                                                           prepares/conserves, pas mache


Cocoa paste not defatted                    25       30       51       46        71           85        102        125        ...         Pâte de cacao non dégraissée

Main Destinations                                                                                                                           Principales destinations

Netherlands                              196.9    172.3    292.5    297.9     304.0        335.5      586.7      467.2        ...                               Pays-Bas


United Kingdom                           178.0    228.3    247.4    196.6     244.3        318.1      383.9      289.9        ...                          Royaume-Uni


France                                   130.0    176.8    181.6    154.8     161.4        262.8      294.2      253.8        ...                                 France


United States                            128.5     93.4    159.9    173.5     209.7        212.1      241.3      144.4        ...                              États-Unis


Germany                                  120.4    137.4    113.4    116.5     157.9        178.6      143.7      150.4        ...                             Allemagne


                                         2002     2003     2004     2005     2006         2007       2008       2009       2010
Imports, cif                                                                                                                                      Importations, cif

Imports - Total                             ...      ...      ...      ...        ...          ...        ...        ...      ...         Importations - Total (millions)    189

                                                                                                                                                  Principaux produits
Main Products


Petroleum oils and oils obtained from                                                                                                    Huiles de pétrole, les huiles de
                                           354      451       ...       0     1 525          800      1 496        298        ...
bituminous minerals, crude                                                                                                                   minéraux bitumineux, brut

Petroleum oils&oils obtained from
                                                                                                                                          Huiles de pétrole, bitumineux,
bituminous minerals,o/than crude            55       90      121      123       299          432        688        329        ...
                                                                                                                                                      distilles, sauf brut
etc

Dentifrices                                  2        3        4        4        74           17        466         10        ...                             Dentifrices

Rice, semi-milled or wholly milled,                                                                                                  Riz semi-blanchi ou blanchi, même
                                            46       60      128      111        91          140        192        180        ...
whether or not polished or glazed                                                                                                                          poli ou glacé

                                                                                                                                         Huile de palme et ses fractions,
Palm oil and its fractions refined but
                                            27       55       59       57        82          119        160         82        ...     raffinées, mais non chimiquement
not chemically modified
                                                                                                                                                               modifiées

Main Origin                                                                                                                                 Principales provenances

China                                    182.3    321.8    510.4    672.4     803.1       1 228.0    1 747.9    1 533.7       ...                                  Chine

Nigeria                                  380.2    454.8      0.0      0.0    1 563.1       859.4     1 861.7     303.5        ...                                 Nigéria

United States                            192.6    209.4    306.5    337.5     289.7        415.9      608.7      634.3        ...                              États-Unis

United Kingdom                           209.2    264.3    313.2    281.7     349.4        429.3      489.2      404.4        ...                          Royaume-Uni

India                                     96.4    169.5    168.1    201.9     280.5        767.9      551.3      383.2        ...                                    Inde


                                                                                    African Statistical Yearbook 2011 / Annuaire Statistique pour l'Afrique 2011
Guinea                                                                                                                                                                      Guinée

         AREA (KM 2)                                                                                   245 857                                                              SUPERFICIE (KM 2)
         CAPITAL CITY                             Conakry                                                                                     Conakry                                   CAPITALE
         CURRENCY                                 Guinea Franc                                                                          Franc Guinéen                                   MONNAIE


                                 I SOCIAL AND DEMOGRAPHIC INDICATORS — INDICATEURS DEMOGRAPHIQUES ET SOCIAUX

                                                    2002        2003        2004        2005        2006         2007        2008        2009       2010
         Population                                                                                                                                                                  Population
                                                                                                                                                                 Population au milieu de l'année -
         Mid-year population - Total (Million)          8.3         8.6         8.8         9.1         9.3          9.6         9.9        10.2       ...
                                                                                                                                                                                    Total (million)
                                                                                                                                                                 Population au milieu de l'année -
         Mid-year population - Urban (%)               15.6        15.6        15.6        15.7        15.7        15.7         15.7        15.7       ...
                                                                                                                                                                                    Urbaine (%)

         Female (%)                                    50.9        50.9        50.9        50.8        50.8        50.8         50.7        50.7       ...                             Femme (%)


         Population by Age Group                                                                                                                                     Population par groupe d'âge


            0-14                                   3735 814    3785 077    3830 845    3880 096    3938 950    4012 533     4104 881    4218 987       ...                                     0-14


            15-64                                  4187 101    4366 967    4561 730    4763 622    4966 089    5164 095     5354 191    5533 912       ...                                    15-64


            65+                                     401 124     408 016     413 847     420 312     428 568     439 011      451 245     464 692       ...                                     65+


         Active Population (000)                    4 141.0     4 225.0     4 312.0     4 349.0     4 478.3      4 613.6     4 755.0     4 835.0       ...                 Population active (000)

            Female (%)                                 47.0        47.0        47.0        47.7        47.7        47.7         47.7        47.1       ...                             Femme (%)

                                                                                                                                                                Taux brut de natalité - Total (par
         Crude birth rate - Total (per 1000)           40.1        40.3        40.5        40.8        41.1        41.4         41.5        41.6       ...
                                                                                                                                                                                            1000)
                                                                                                                                                              Taux brut de mortalité - Total (par
         Crude death rate - Total (per 1000)           12.4        12.1        11.9        11.7        11.6        11.4         11.2        11.0       ...
                                                                                                                                                                                           1000)
         Life expectancy at birth - Total                                                                                                                       Espérance de vie à la naissance -
                                                         ...         ...         ...       54.0        54.0        54.0         54.0        58.4       ...
         (years)                                                                                                                                                                  Total (années)
         Net reproduction rate - (per                                                                                                                            Taux net de reproduction - (par
                                                         ...         ...         ...        2.1          ...          ...         ...         ...      ...
         woman)                                                                                                                                                                          femme)
                                                                                                                                                                Indice synthétique de fécondité -
         Total fertility rate - (p woman)
                       y        (per    )                ...         ...         ...        5.7         5.7          5.7         5.7         5.3       ...
                                                                                                                                                                                    (par femme)

         Education                                                                                                                                                              Enseignement

         Teaching staff at first level - Total                                                                                                                Personnel enseignant - 1er degré -
                                                      21.13        23.9        25.4        26.9        28.3        29.0         30.9        31.8       ...
         (thousands)                                                                                                                                                             Total (milliers)
         Teaching staff at second level - Total                                                                                                              Personnel enseignant - 2ème degré -
190                                                    7.25         8.4         9.4        11.0        12.2        13.3         14.9        16.4       ...
         (thousands)                                                                                                                                                              Total (milliers)
         Teaching staff at third level - Total                                                                                                               Personnel enseignant - 3ème degré -
                                                        0.8         0.9         0.0         0.9         1.0          1.3          ...         ...      ...
         (thousands)                                                                                                                                                              Total (milliers)
         First level student enrollment - Total                                                                                                                 Elèves inscrits - 1er degré - Total
                                                       998        1 073       1 147       1 207       1 258       1 318        1 364       1 390       ...
         (thousands)                                                                                                                                                                      (milliers)
         First level student enrollment -                                                                                                                    Elèves inscrits - 1er degré - Femmes
                                                       418         458         497         532         564          596         616         629        ...
         Female (thousands)                                                                                                                                                                (milliers)
         Second level student enrollment -                                                                                                                    Elèves inscrits - 2ème degré - Total
                                                       271         301         340         416         478          526         520         549        ...
         Total (thousands)                                                                                                                                                               (milliers)
         Second level student enrollment -                                                                                                                          Elèves inscrits - 2ème degré -
                                                        79          94         105         138         163          187         187         198        ...
         Female (thousands)                                                                                                                                                     Femmes (milliers)
         Third level student enrollment - Total                                                                                                               Elèves inscrits - 3ème degré - Total
                                                         ...       16.9        17.2        23.8        42.7        68.3         80.2          ...      ...
         (thousands)                                                                                                                                                                     (milliers)
         Third level student enrollment -                                                                                                                           Elèves inscrits - 3ème degré -
                                                         ...        2.6         2.7         4.4         9.1        16.7         19.6          ...      ...
         Female (thousands)                                                                                                                                                     Femmes (milliers)
         Public expenditure on education (%                                                                                                                     Dépenses publiques consacrées à
                                                       15.5        16.6        14.2        13.8        11.2        23.3           ...         ...      ...
         of budget)                                                                                                                                               l'enseignement (% du budget)

         Health                                                                                                                                                                             Santé

         Hospital beds - Total (per 10 000                                                                                                                      Nombre de lits d'hôpitaux - Total
                                                         ...         ...        54           ...         ...          ...         ...         ...      ...
         population)                                                                                                                                                               (pour 10 000)
         Nurses - Total (per 10 000                                                                                                                            Nombre d'infirmières - Total (pour
                                                         ...         ...         ...         ...         ...          ...         ...         ...      ...
         population)                                                                                                                                                                     10 000)
         Physicians - Total (per 10 000                                                                                                                        Nombre de médecins - Total (pour
                                                         ...          1          1           2           ...          ...         ...         ...      ...
         population)                                                                                                                                                                   10 000)
         Public expenditure on Health (% of                                                                                                                  Dépenses publiques consacrées à la
                                                        21          15           9          12          13            2           2           ...      ...
         budget)                                                                                                                                                          santé (% du budget)


      African Statistical Yearbook 2011 / Annuaire Statistique pour l'Afrique 2011
Guinea                                                                                                                                                                                   Guinée
                                                             II NATIONAL ACCOUNTS — COMPTES NATIONAUX

                                            2002            2003         2004         2005         2006          2007         2008         2009         2010

Gross domestic product by kind of economic activity at current prices
                                                                                                       Produit intérieur brut par branche d'activité économique aux prix courants


Guinea Franc (Millions)                                                                                                                                                Franc Guinéen(Millions)

Agriculture                               1 260 935       1 421 547    1 901 906    2 384 891    3 312 611     4 056 952    4 741 217    5 232 139    5 490 562                             Agriculture

Mining and quarrying                       989 591        1 044 254    1 236 241    1 858 676    3 312 436     3 391 578    4 611 290    4 258 238    6 359 669                  Industries extractives

Manufacturing                              220 709         405 530      462 179      651 210      855 182      1 123 440    1 297 652    1 492 445    1 715 763             Industries manufacturières

Electricity, gas & water                    57 215          30 200       33 525       45 586       57 268        69 210       78 128       90 706      104 240                   Electricité, gaz et eau

Construction                               558 264         690 230      756 830      876 131     1 318 210     1 742 054    2 063 721    2 304 933    2 695 285           Bâtiments et travaux publics
Wholesale & retail trade,                                                                                                                                              Commerce de gros et de détail,
                                          1 269 915       1 136 990    1 359 666    1 866 029    2 212 357     2 911 528    3 240 893    3 579 839    4 179 676
restaurants, hotels                                                                                                                                                             restaurants et hôtels
                                                                                                                                                                        Banques, assurances, affaires
Finance, insurance, real estate, etc.               ...          ...          ...          ...          ...           ...          ...          ...          ...
                                                                                                                                                                                        immobilières
Transport and communications               282 441         486 730      585 816      648 691      783 704       998 329     1 067 334    1 193 685    1 388 325       Transport(s) et communications
                                                                                                                                                                          Administrations publiques et
Public administration and defense          273 700         973 203     1 051 992    1 261 745    1 671 152     1 275 979    1 458 569    1 511 512    1 839 212
                                                                                                                                                                                              défense
Other services                             471 552         177 700      204 067      279 033      369 516       437 243      447 356      559 419      673 796                          Autres services
                                                                                                                                                                       Moins Services d’intermédiation
Less Imputed Service Charges                        ...          ...          ...          ...          ...           ...          ...          ...          ...
                                                                                                                                                                                             financière
Gross domestic product at factor                                                                                                                                   Produit intérieur brut aux couts des
                                          5 384 322       6 366 384    7 592 222    9 871 992 13 892 437      16 006 314 19 006 160 20 222 915 24 446 528
cost / basic prices                                                                                                                                                              facteurs / prix de base

Plus: Indirect Taxes / taxes on                                                                                                                                    Plus taxes indirectes/impôts sur les
                                           444 810         474 566      565 496      831 676     1 201 768     1 347 920    1 774 270    1 902 040    2 561 980
products, less subsidies                                                                                                                                               produits, moins les subventions


Expenditure on Gross domestic product at current purchaser's values
                                                                                                                    Emploi du produit intérieur brut aux prix courants d'acquisition

Guinea Franc (Millions)                                                                                                                                                Franc Guinéen(Millions)
                                                                                                                                                                             Consommation finale des
Government final consumption               467 387         538 812      566 225      670 729     1 065 135     1 156 306    1 270 764    1 889 117    3 324 492
                                                                                                                                                                             administrations publiques

Private final consumption                 4 497 143       4 872 395    5 837 802    7 696 937 11 262 116      13 859 268 16 253 045 17 896 362 20 554 912                  Consommation finale privée

Gross fixed capital formation             1 083 819       1 355 343    1 858 242    2 490 042    3 385 086     3 339 048    4 429 171    3 631 784    4 851 720         Formation brute de capital fixe

Increase in inventories                     33 744         123 317      136 512      216 780      123 896        93 870      140 854       - 8 536       4 807                     Variation des stocks

Exports of goods and services             1 602 350       1 675 045    1 905 691    3 382 903    5 769 804     5 231 391    7 008 952    5 356 962    8 864 519      Exportations de biens et services
                                                                                                                                                                        Moins importations de biens et
                                                                                                                                                                                                           191
Less imports of goods and services        1 855 310       1 723 963    2 146 753    3 753 722    6 511 832     6 325 649    8 322 357    6 640 734 10 591 942
                                                                                                                                                                                              services
GDP at purchasers' values                 5 829 132       6 840 950    8 157 718 10 703 668 15 094 205        17 354 234 20 780 430 22 124 955 27 008 508                    PIB aux prix d'acquisition


Gross domestic product by kind of economic activity at constant
                                                                                                     Produit intérieur brut par branche d'activité economique aux prix constants
prices
Annual Growth Rates (%)                                                                                                                                     Taux de croissance annuel (%)
Agriculture                                     4.2             3.5          3.2          1.3          3.9           2.8          3.6          3.2          3.2                             Agriculture

Mining and quarrying                            2.9             2.7          1.1          2.4         -1.6           2.4         14.2         -7.3          1.1                  Industries extractives

Manufacturing                                   5.9            -4.0          3.0          3.5          1.8          -0.1          1.5          1.6          1.2             Industries manufacturières

Electricity, gas & water                        3.0            -5.5          0.9          1.0          0.5           5.1          5.5          4.5          1.7                  Electricité, gaz et eau

Construction                                    8.0            -1.0          6.0          6.0          8.0           1.5          7.5         -0.1          4.5           Bâtiments et travaux publics
Wholesale & retail trade,                                                                                                                                                     Commerce de gros et de
                                                3.5             1.1          1.0          1.5          1.5           1.0          2.3         -1.2          1.0
restaurants, hotels                                                                                                                                                         détail,restaurants et hôtels
                                                                                                                                                                         Banques, assurances, affaires
Finance, insurance, real estate, etc.               ...          ...          ...          ...          ...           ...          ...          ...          ...
                                                                                                                                                                                         immobilières
Transport and communications                    2.6             1.0          1.2          1.8          0.5           1.1          2.8         -0.5          1.4       Transport(s) et communications
                                                                                                                                                                          Administrations publiques et
Public administartion and defense               2.5             1.5          1.3          1.7          1.0          -0.2          2.5          3.5          1.7
                                                                                                                                                                                              défense
Other services                                  1.9             1.5          1.4          1.2          2.5           0.5          1.3          2.5          1.3                         Autres services
                                                                                                                                                                       Moins Services d’intérmediation
Less Imputed Service Charges                        ...          ...          ...          ...          ...           ...          ...          ...          ...
                                                                                                                                                                                             financière
Gross domestic product at factor                                                                                                                                   Produit intérieur brut aux couts des
                                                3.9             1.3          2.2          2.3          2.2           1.5          5.1         -0.1          2.1
cost / basic prices                                                                                                                                                              facteurs / prix de base

Plus: Indirect Taxes / taxes on                                                                                                                                    Plus taxes indirectes/impôts sur les
                                               24.9             0.1          3.6         12.4          6.2           5.2          2.8         -2.5         -0.2
products, less subsidies                                                                                                                                               produits, moins les subventions

Gross domestic product at market                                                                                                                                     Produit intérieur brut aux prix du
                                                5.2             1.2          2.3          3.0          2.5           1.8          4.9         -0.3          1.9
prices                                                                                                                                                                                          marché


2009: semi-final                2010: Provisional                                                                                                       2009: provisoire               2010:Estimée


                                                                                                         African Statistical Yearbook 2011 / Annuaire Statistique pour l'Afrique 2011
Guinea                                                                                                                                                             Guinée

         Expenditure on Gross domestic product at constant purchasers'
                                                                                                            Emplois du produit intérieur brut aux prix constants d'acquisition
         values

         Annual Growth Rates (%)                                                                                                              Taux de croissance annuel (%)
                                                                                                                                                                Consommation finale des
         Government final consumption                  21.8       10.8        1.0       13.9       52.7        4.4       55.1       15.2     -5.3
                                                                                                                                                                administrations publiques

         Private final consumption                      1.1       -7.8        3.4       -3.1       -4.4       11.3       -9.8      -26.3     11.7             Consommation finale privée

         Gross fixed capital formation                 29.4        9.7       18.9       23.3       26.4       -4.1       34.5       19.9     11.1         Formation brute de capital fixe

         Exports of goods and services                  0.7        6.2       -4.1        3.5       -2.1       -3.8       19.8        8.4      7.9       Exportations de biens et services

                                                                                                                                                          Moins importations de biens et
         Less imports of goods and services             6.6       -7.6        9.0        8.9       20.0       10.0       30.6       -4.7     13.3
                                                                                                                                                                                services


                                                                                        III INFLATION

                                                    2002       2003       2004       2005       2006       2007       2008       2009       2010
         Annual Growth Rates (%)                                                                                                              Taux de croissance annuel (%)
         All Item                                       3.0      12.9       17.5       31.4       34.7       22.9       18.4         4.7     15.8                               Ensemble

         Food                                           9.9       -9.5       -7.7      39.6       47.1       17.3       13.2          ...      ...                           Alimentation

         Health                                         4.2        9.4      -25.4      14.0       22.7       19.0       14.1          ...      ...                                  Santé

         Energy                                         2.8        6.2      -22.5      19.2       39.3       14.4       14.3          ...      ...                                 Energie

         Transport                                      3.3      16.6       -14.9      38.4       43.9        -9.1      16.3          ...      ...                              Transport


                                                          IV AGRICULTURAL PRODUCTION - PRODUCTION AGRICOLE

                                                    2002       2003       2004       2005       2006       2007       2008       2009       2010
         Tons (Thousand)                                                                                                                                           Tonnes (milliers)
         Rice, Tons (thousands)                      1 034      1 089      1 147      1 208      1 272      1 340      1 402      1 466        ...            Riz Paddy, tonnes (milliers)

         Maize, Tons (thousands)                        25         27         30         32         35         38         42         45        ...                  Maïs, tonnes (milliers)

         Fonio, Tons (thousands)                       178        188        198        208        219        231        243        256        ...                 Fonio, tonnes (milliers)

         Groundnuts, Tons (thousands)                4 458      5 112      5 863      6 724      7 712      8 845     10 144     11 634        ...             Arachide, tonnes (milliers)

         Cassava, Tons (thousands)                     836        878        922        969      1 017      1 069      1 122      1 179        ...               Manioc, tonnes (milliers)


                                                                V MINING PRODUCTION - PRODUCTION MINIERE
192
                                                    2002       2003       2004       2005       2006       2007       2008       2009       2010

         Aluminium ores and concentrates                                                                                                              Minerais d'aluminium et concentrés
                                                   15 177.9   15 260.9   16 241.2   16 484.1   16 956.6   16 700.0   17 965.0   18 954.8       ...
         (Bauxite), metric tons (thousands)                                                                                                                    (Bauxite), tonnes (milliers)
         Gold ores and concentrates                17 578.4   16 935.0   14 518.0   18 328.0   18 455.2   19 053.6   19 975.6   20 946.0       ...           Minerais d'or et concentrés,
         (Kilograms)                                                                                                                                                         Kilogrammes

         Diamonds, carat (thousands)                 513.4      698.6      719.4      699.7      468.9     1 012.6    1 063.3    1 190.9       ...               Diamant (milliers carats)


                                                                                    VI ENERGY - ENERGIE

                                                    2002       2003       2004       2005       2006       2007       2008       2009       2010

         Electricity - total hydro production,                                                                                                        Électricité - production hydraulique
                                                     699.8      583.2      652.6      581.1      542.8      632.6      660.7          ...      ...
         kilowatt hours (millions)                                                                                                                       totale, kilowatt-heures (millions)

         Electricity - total thermal production,                                                                                                        Électricité - production thermique
                                                       73.8       69.5       73.7       78.5       84.7       20.2       19.3         ...      ...
         kilowatt hours (millions)                                                                                                                       totale, kilowatt-heures (millions)

         Electricity - total production, self-                                                                                                       Electricité - Production totale privée
                                                       315        316        320        231        168        182        174          ...      ...
         producer (Million Kilowatt Hours)                                                                                                                     (million de kilowatt heures)

         Electricity - total production, public                                                                                                             Electricité - Production totale
                                                       700        583        653        581        542        633        440          ...      ...
         (Million Kilowatt Hours)                                                                                                                    publique (million de kilowatt heures)


      African Statistical Yearbook 2011 / Annuaire Statistique pour l'Afrique 2011
Guinea                                                                                                                                                                                 Guinée
                                         VII TOURISM AND INFRASTRUCTURE - TOURISME ET INFRASTUCTURE

                                           2002         2003         2004         2005         2006         2007         2008          2009          2010

Arrivals - Tourists (thousands)            42.507       43.966       44.622       45.334       46.096            ...          ...           ...           ...           Arrivées - touristes (milliers)

Rooms in hotels and similar                                                                                                                                   Chambres d'hotels et établissements
establishments (thousands)                      4        3.747        3.886        4.295        4.495            ...          ...           ...           ...                  assimilés (milliers)

Paved Road (% of total)                        35           31           41           35           35           35           35            35             ...        Routes asphaltées (% du total)
Total Network (Railways-km)                     ...      6 758        6 758        6 758        6 758        6 758        6 758         6 758             ...         Réseau total voies ferrées-Km
Main Telephone Lines (per 1,000                                                                                                                                     Lignes téléphoniques fixes (pour
                                              216          247          326            3             2            2            2            ...           ...
inhabitants)                                                                                                                                                                        1000 habitants)
Mobile Cellular Subscribers (per                                                                                                                                    Abonnés aux téléphones mobiles
                                               71           94          250          205          201          208          391             ...           ...
1,000 inhabitants)                                                                                                                                                           (pour 1000 habitants)


                          VII FINANCIAL AND MONETARY STATISTICS - FINANCES ET STATISTIQUES MONETAIRES

                                           2002         2003         2004         2005         2006         2007         2008          2009          2010

VII-1 Monetary Statistics                                                                                                                                  VII-1 Statistiques monétaires
Guinea Franc (Millions)                                                                                                                                              Franc Guinéen(Millions)
Money supply (M1)                         681 228      893 055     1 143 310    1 394 200           ...          ...          ...           ...           ...                 Masse monétaire (M1)
Quasi-money                               144 302      206 281      356 870      606 326            ...          ...          ...           ...           ...                         Quasi-monnaie
  of which Demand Deposit                       ...          ...          ...          ...          ...          ...          ...           ...           ...              dont Monnaie scripturale
Net foreign assets                         71 909      - 10 892      90 958      168 216            ...          ...          ...           ...           ...                  Avoirs extérieurs nets
Domestic credit                           794 387     1 098 650    1 331 460    1 899 270           ...          ...          ...           ...           ...                         Crédit intérieur

of which claims on private sector         241 832      289 157      308 810      605 410            ...          ...          ...           ...           ...     dont créances sur le secteur privé

of which Claims on government                                                                                                                                            dont créances nettes sur le
                                          539 300      801 417     1 016 010    1 287 230           ...          ...          ...           ...           ...
sector, net                                                                                                                                                                          gouvernement
International reserves (millions of US                                                                                                                          Réserves internationales (millions de
                                              171            ...        110           95            ...          ...          ...           ...           ...
$)                                                                                                                                                                                              $ EU)
Average Exchange Rate (National                                                                                                                                  Taux de change (moyen) (monnaie
                                          1 975.84     1 984.93     2 225.03     3 644.33     5 350.00     4 122.80     5 500.00            ...           ...
Currency per us $)                                                                                                                                                           nationale par dollars)


VII-2 Public Finance                                                                                                                                                VII-2 Finances publiques
Guinea Franc (Millions)                                                                                                                                              Franc Guinéen(Millions)
Total Revenues and Grants                 876 868      982 793     1 027 395    1 631 530    2 658 392    2 726 610    3 368 120    3 492 790     4 523 823                 Recettes totales et dons
  Tax Revenue                             692 600      705 230      873 381     1 433 330    2 141 782    2 347 350    3 060 140    3 303 880             ...                       Recettes fiscales
  Non Tax Revenue                          71 260       48 870       62 614      123 300      271 530      129 930      204 970       108 330             ...                  Recettes non fiscales
  Grants                                  113 008      228 693       91 400       74 900      245 080      249 330      103 010        80 580             ...                                   Dons      193
Total Expenditures and Net Lending       1 157 389    1 322 533    1 464 192    1 724 984    2 710 304    2 641 329    3 617 895    5 240 240     7 778 736           Dépenses totales et prêts nets

  Current expenditure                     454 690      514 630      534 108      648 651     1 095 870    1 167 790    1 844 855    2 470 100             ...                   Dépenses courantes
  Of which Wages and Salaries             236 890      258 610      274 804      332 506      444 420      607 210      856 270     1 109 230             ...         Dont rémunérations et salaires
  Capital expenditure                     369 000      390 613      444 000      500 378      672 350      682 440      837 290     1 577 180             ...               Dépenses d'équipement
  Net Lending                               4 400        1 420          700          140        8 144        2 724        2 970         7 740             ...                              Prêts nets
Fiscal Balance                           - 280 521    - 339 740    - 436 797     - 93 454     - 51 912      85 281     - 249 775    -1 747 450    -3 254 913         Solde global y compris les dons


VII-3 Balance of Payments                                                                                                                                       VII-3 Balance des paiements
Guinea Franc (Millions)                                                                                                                                              Franc Guinéen(Millions)
Trade balance                            - 114 420     425 553      - 76 920     - 76 920    - 150 320    - 136 240     - 22 220      980 889             ...                  Balance commerciale
Services Balance                         - 240 170    - 474 475    - 197 170    - 195 430    - 217 500    - 247 420    - 337 110    -1 897 586            ...                   Balance des services
Net Income                               - 102 330     - 78 090     - 59 800     - 48 400     - 59 780     - 63 150     - 80 550     - 307 177            ...                           Revenus nets
Current transfers, net total               45 950      109 250       13 160      - 10 080     - 20 610    - 130 590      18 480      - 694 833            ...                    Transferts courants
Current account balance                  - 199 630     - 17 762    - 117 720    - 151 640    - 227 030    - 455 570    - 423 240    -1 918 708            ...              Solde du compte courant


VII-4 External Debt and Financial Flows                                                                                                      VII-4 Dette extérieure et flux financiers
US $ (Millions)                                                                                                                                                                  $ E.U (Millions)
Total external debt                         3 046        3 364        3 290        3 235        3 188        3 242        3 099         3 015         3 054                   Dette extérieure totale
  Private                                       0            0            0            0             0            0            0             0          101                                    Privée
  Public                                    3 046        3 364        3 290        3 235        3 188        3 242        3 099         3 015         2 952                                 Publique
Total external debt service                   134          167          180          196          209          203          174           166             ...          Service de la dette extérieure
Net Foreign Direct Investment                                                                                                                                   Investissements étranger direct (flux
                                               30           83           98          105          125          386          382           141             ...
Inflows                                                                                                                                                                               nets entrants)
Net Total Official Development                                                                                                                                     Aide publique au développement
                                              254          254          278          198          170          228          328           215             ...
assistance                                                                                                                                                                            (nette totale)


                                                                                                      African Statistical Yearbook 2011 / Annuaire Statistique pour l'Afrique 2011
Guinea                                                                                                                                Guinée

                                           2002      2003       2004      2005       2006    2007    2008    2009     2010

         US $ (Millions)                                                                                                                  Franc Guinéen
         Exports, fob                                                                                                                 Exportations, fàb


         Exports - Total                     531          ...      584       678       661   1 070   1 441   1 603       ...             Exportations - Total


         Main Products                                                                                                                Principaux produits


         Bauxite                             282        256        292       358       405     431     518     571       ...                          Bauxite


         Allumine                            138        145        163       173       147     215     263     318       ...                         Allumine


         Diamonds                             36         52         48        45        43      51      62      69       ...                         Diamant


         Gold                                162        179        165       182       327     438     465     515       ...                               Or


         Coffee                                5         14         12        19        22      22      22      23       ...                             Café

         Main Destinations                                                                                                        Principales destinations

         East African / Southern              0.4        0.6     916.0        5.8      8.2    11.9    85.6      ...      ...         Afrique de l'est/Australe


         Liberia                              0.2        0.3     709.1        3.3      6.0    11.3    41.4      ...      ...                           Liberia


         North Africa                         8.5        1.1     471.0        2.0      1.5     0.9     3.1      ...      ...                 Afrique du Nord


         Europe                             337.3      303.4     122.9      161.8    217.1   299.7   132.9      ...      ...                          Europe


         China                                9.8        0.0     115.2        3.6      7.2    11.5    40.0      ...      ...                            Chine


                                           2002      2003       2004      2005       2006    2007    2008    2009     2010
         Imports, cif                                                                                                                  Importations, cif

194      Imports - Total                     655        630        778       817     1 066   1 107   1 252      ...      ...   Importations - Total (millions)


                                                                                                                                      Principaux produits
         Main Products


         Food                                118        111        160       147       160     186     185     165       ...            Produits alimentaires


         Other consumer goods                113         96        134       119       147     165     175     173       ...   Autres biens de consommation


         Petroleum Products                  106         96        124       124       202     300     383     260       ...               Produits pétroliers


         Intermediate goods                  130        131        142       168       230     232     259     209       ...             Biens intermédiaires


         Equipment goods                     188        197        217       259       327     224     250     176       ...             Biens d'équipement


         Main Origin                                                                                                             Principales provenances

         Europe                                ...        ...     51.4       79.7     38.7    38.8    35.0      ...      ...                          Europe

         European Union                     251.9      257.9     272.1      485.8    338.2   491.6   472.5      ...      ...              Union Européenne

         Other Asian countries              160.4      185.4     184.6      260.6    244.1    87.6   285.9      ...      ...              Autres Pays d' Asie

         Ivory Coast                         97.2       43.2     169.0      382.9    237.0   130.6   120.3      ...      ...                    Côte d'Ivoire

         North America                       57.0       25.1      40.0      116.1     52.0    58.1     0.0      ...      ...              Amérique du Nord


      African Statistical Yearbook 2011 / Annuaire Statistique pour l'Afrique 2011
Guinea-Bissau                                                                                                                                              Guinée-Bissau

AREA (KM 2)                                                                                36 125                                                                SUPERFICIE (KM 2)
CAPITAL CITY                             Bissau                                                                                      Bissau                                  CAPITALE
CURRENCY                                 CFA Franc                                                                                Franc CFA                                  MONNAIE


                         I SOCIAL AND DEMOGRAPHIC INDICATORS — INDICATEURS DEMOGRAPHIQUES ET SOCIAUX

                                           2002       2003       2004       2005       2006             2007      2008       2009       2010
Population                                                                                                                                                                Population
                                                                                                                                                       Population au milieu de l'année -
Mid-year population - Total (Million)          1.2        1.2        1.3        1.3        1.3             1.4        1.4        1.5        1.6
                                                                                                                                                                          Total (million)
                                                                                                                                                       Population au milieu de l'année -
Mid-year population - Urban (%)               33.0       33.0       33.0       33.0       33.0            33.0       33.0       48.0       48.0
                                                                                                                                                                          Urbaine (%)

Female (%)                                    51.7       51.7       51.7       51.7       51.7            51.7       51.7       51.7       51.7                              Femme (%)


Population by Age Group                                                                                                                                    Population par groupe d'âge


   0-14                                    563 488    575 596    588 230    601 450    615 331         629 964    640 595    646 352    665 439                                      0-14


   15-64                                   586 870    599 481    612 639    626 408    640 865         656 105    667 178    822 769    847 065                                     15-64


   65+                                      64 055     65 432     66 868     68 371     69 949          71 612     72 820     51 709     53 235                                       65+


Active Population (000)                      874.4      893.2      912.8      933.3      954.8           977.5      994.0      573.2      590.2                  Population active (000)

   Female (%)                                 52.6       52.6       52.6       52.6       52.6            52.6       52.6       21.0       21.0                              Femme (%)

                                                                                                                                                      Taux brut de natalité - Total (par
Crude birth rate - Total (per 1000)           42.8       42.6       42.3       42.1       40.9            41.5       41.2       42.0       41.8
                                                                                                                                                                                 1000)
                                                                                                                                                     Taux brut de mortalité - Total (par
Crude death rate - Total (per 1000)           18.6       18.4       18.2       18.0       17.3            17.5       17.2       16.0       16.0
                                                                                                                                                                                  1000)
Life expectancy at birth - Total                                                                                                                      Espérance de vie à la naissance -
                                              46.3       46.5       46.7       46.9       46.0            46.2       46.4       47.0       47.0
(years)                                                                                                                                                                 Total (années)
Net reproduction rate - (per                                                                                                                           Taux net de reproduction - (par
                                                ...        ...        ...       2.4         ...             ...        ...        ...        ...
woman)                                                                                                                                                                        femme)
                                                                                                                                                      Indice synthétique de fécondité -
Total fertility rate - (per woman)             6.8        6.8        6.8        6.8        6.8             6.8        6.8        6.8        6.8
                                                                                                                                                                          (par femme)

Education                                                                                                                                                             Enseignement

Teaching staff at first level - Total                                                                                                               Personnel enseignant - 1er degré -
                                                ...        ...       5.6        5.6        5.7             5.7        5.8        5.9        6.0
(thousands)                                                                                                                                                            Total (milliers)
Teaching staff at second level -                                                                                                                   Personnel enseignant - 2ème degré -
                                                ...        ...       1.9        1.9        1.8             1.8        1.8        1.8        1.8
Total (thousands)                                                                                                                                                       Total (milliers)
                                                                                                                                                                                             195
Teaching staff at third level - Total                                                                                                              Personnel enseignant - 3ème degré -
                                                ...        ...       0.1        0.1        0.1             0.2        0.1         ...        ...
(thousands)                                                                                                                                                             Total (milliers)
First level student enrollment - Total                                                                                                                Elèves inscrits - 1er degré - Total
                                                ...        ...      252        269        286              303       326        343        360
(thousands)                                                                                                                                                                     (milliers)
First level student enrollment -                                                                                                                   Elèves inscrits - 1er degré - Femmes
                                                ...        ...      119        129        139              149       156        167        177
Female (thousands)                                                                                                                                                              (milliers)
Second level student enrollment -                                                                                                                   Elèves inscrits - 2ème degré - Total
                                                ...        ...       51         54         58              62         65         68         72
Total (thousands)                                                                                                                                                              (milliers)
Second level student enrollment -                                                                                                                         Elèves inscrits - 2ème degré -
                                                ...        ...       15         16         17              19         20         20         22
Female (thousands)                                                                                                                                                    Femmes (milliers)
Third level student enrollment -                                                                                                                    Elèves inscrits - 3ème degré - Total
                                                ...        ...        ...       3.1        3.7              ...        ...        ...        ...
Total (thousands)                                                                                                                                                              (milliers)
Third level student enrollment -                                                                                                                          Elèves inscrits - 3ème degré -
                                                ...        ...        ...        ...        ...             ...        ...        ...        ...
Female (thousands)                                                                                                                                                    Femmes (milliers)
Public expenditure on education (%                                                                                                                    Dépenses publiques consacrées à
                                                ...        ...        ...        ...        ...             ...        ...       7.0        8.0
of budget)                                                                                                                                              l'enseignement (% du budget)

Health                                                                                                                                                                           Santé

Hospital beds - Total (per 10 000                                                                                                                     Nombre de lits d'hôpitaux - Total
                                                ...        ...         6          6          6               6          6        12         13
population)                                                                                                                                                             (pour 10 000)
Nurses - Total (per 10 000                                                                                                                           Nombre d'infirmières - Total (pour
                                                ...         7          7         ...        ...             ...        ...       14         14
population)                                                                                                                                                                    10 000)
Physicians - Total (per 10 000                                                                                                                       Nombre de médecins - Total (pour
                                                ...         1          1         ...        ...             ...        ...         1          1
population)                                                                                                                                                                  10 000)
Public expenditure on Health (% of                                                                                                                 Dépenses publiques consacrées à la
                                                 8          7          4          5          5               7          8          9          9
budget)                                                                                                                                                          santé (% du budget)


                                                                                                  African Statistical Yearbook 2011 / Annuaire Statistique pour l'Afrique 2011
Guinea-Bissau                                                                                                                                    Guinée-Bissau
                                                                  II NATIONAL ACCOUNTS — COMPTES NATIONAUX

                                                      2002      2003      2004      2005      2006        2007       2008      2009        2010

          Gross domestic product by kind of economic activity at current prices
                                                                                                   Produit intérieur brut par branche d'activité économique aux prix courants


          CFA Franc(Millions)                                                                                                                                 Franc CFA (Millions)

          Agriculture                                 117 799   113 907   114 001   130 037   125 795     138 737   173 021    165 500    166 792                            Agriculture

          Mining and quarrying                           206       230       135        91        83         147       105        110         116                  Industries extractives

          Manufacturing                                37 372    38 040    37 549    36 952    35 659      36 693    43 207     44 142     44 877            Industries manufacturières

          Electricity, gas & water                      1 468     1 477     1 350     1 489     1 316       1 119     1 502      1 636      1 670                 Electricité, gaz et eau

          Construction                                  6 802     7 595     4 476     3 020     2 740       4 898     3 469      5 154      5 739          Bâtiments et travaux publics
          Wholesale & retail trade,                                                                                                                     Commerce de gros et de détail,
                                                       59 594    54 277    55 440    59 441    60 090      69 579    72 874     79 184     80 173
          restaurants, hotels                                                                                                                                    restaurants et hôtels
                                                                                                                                                         Banques, assurances, affaires
          Finance, insurance, real estate, etc.         1 160     1 290     1 282     1 612     2 080       1 483     1 487      1 491      1 495
                                                                                                                                                                         immobilières
          Transport and communications                  7 852     8 256    10 301    10 881    13 509      13 763    15 941     20 028     21 142       Transport(s) et communications
                                                                                                                                                            Administrations publiques et
          Public administration and defense            29 286    29 696    30 234    33 255    32 036      34 350    33 623     41 712     41 724
                                                                                                                                                                                défense
          Other services                               12 645    10 468    12 831    15 264    16 738      16 902    18 007     17 487     17 500                        Autres services
                                                                                                                                                     Moins Services d’intermédiation
          Less Imputed Service Charges                  - 331     - 542     - 451     - 802   - 1 395       - 717     - 717    - 5 782     - 4 803
                                                                                                                                                                              financière
          Gross domestic product at factor                                                                                                        Produit intérieur brut aux couts des
                                                      273 853   264 694   267 148   291 240   288 651     316 954   362 519    370 662    392 425
          cost / basic prices                                                                                                                                   facteurs / prix de base

          Plus: Indirect Taxes / taxes on                                                                                                            Plus taxes indirectes/impôts sur les
                                                        9 591     5 805     8 961    10 922    13 850      14 086    14 932     24 422     26 376
          products, less subsidies                                                                                                                       produits, moins les subventions


          Expenditure on Gross domestic product at current purchaser's values
                                                                                                              Emploi du produit intérieur brut aux prix courants d'acquisition

          CFA Franc(Millions)                                                                                                                                 Franc CFA (Millions)
                                                                                                                                                              Consommation finale des
          Government final consumption                 42 321    46 396    40 149    46 004    45 824      50 415    45 986     53 297     55 196
                                                                                                                                                              administrations publiques

          Private final consumption                   244 188   218 720   246 883   273 287   286 391     303 860   357 433    364 196    368 527           Consommation finale privée

          Gross fixed capital formation                23 678    26 279    20 728    18 792    21 233      38 193    32 526     31 212     39 818        Formation brute de capital fixe

          Increase in inventories                        304       305       312      1 120   - 1 904        554       378        400         422                   Variation des stocks

          Exports of goods and services                44 561    43 120    43 410    47 813    36 836      55 626    58 627     60 502     73 360      Exportations de biens et services

196       Less imports of goods and services           71 608    64 320    75 373    84 854    85 879     117 608   117 499    114 523    118 523
                                                                                                                                                         Moins importations de biens et
                                                                                                                                                                               services
          GDP at purchasers' values                   283 444   270 499   276 109   302 162   302 501     331 040   377 451    395 084    418 800              PIB aux prix d'acquisition


          Gross domestic product by kind of economic activity at constant
                                                                                                 Produit intérieur brut par branche d'activité economique aux prix constants
          prices
          Annual Growth Rates (%)                                                                                                             Taux de croissance annuel (%)
          Agriculture                                    -0.2       4.3      -1.6      10.4      -0.6         1.8       5.4        2.4         2.7                           Agriculture

          Mining and quarrying                          141.7      18.4     -38.8     -27.8     -14.3        96.2     -34.6        4.5         4.8                 Industries extractives

          Manufacturing                                   5.3       5.7      -3.3       4.3      -1.8        -6.1       0.2        4.5         4.8           Industries manufacturières

          Electricity, gas & water                       20.3     -10.6       2.8      10.3     -11.5       -15.0      34.1        4.5         4.8                Electricité, gaz et eau

          Construction                                   95.8      13.9     -40.3     -31.6      -5.4        85.0     -33.3       10.0       10.0          Bâtiments et travaux publics
          Wholesale & retail trade,                                                                                                                           Commerce de gros et de
                                                        -16.5      -4.8      11.8      -7.6       5.2        11.8       6.3        2.8         4.6
          restaurants, hotels                                                                                                                               détail,restaurants et hôtels
                                                                                                                                                          Banques, assurances, affaires
          Finance, insurance, real estate, etc.           7.5      11.2      -0.6      25.7      37.5       -30.4     -26.4        4.1         4.1
                                                                                                                                                                           immobilières
          Transport and communications                   -7.6       6.9      17.0     -13.2      24.1        -7.6      14.3        5.4         5.4      Transport(s) et communications
                                                                                                                                                            Administrations publiques et
          Public administartion and defense              -3.9       4.8       0.6       8.0      -3.9         4.4      -8.7       -1.0        -1.0
                                                                                                                                                                                défense
          Other services                                 18.9     -15.4      19.8      16.4       6.3        -4.0       3.4        2.8         4.0                       Autres services
                                                                                                                                                      Moins Services d’intérmediation
          Less Imputed Service Charges                   18.6      63.7     -16.8      77.8      85.4       -49.8     -26.6      116.5      116.4
                                                                                                                                                                               financière
          Gross domestic product at factor                                                                                                         Produit intérieur brut aux couts des
                                                         -2.5       1.8       1.8       3.7       1.2         3.3       3.1        2.5         2.9
          cost / basic prices                                                                                                                                    facteurs / prix de base

          Plus: Indirect Taxes / taxes on                                                                                                            Plus taxes indirectes/impôts sur les
                                                         46.8     -39.5      54.4      21.9      26.8         1.7       6.0       14.5       14.5
          products, less subsidies                                                                                                                       produits, moins les subventions

          Gross domestic product at market                                                                                                             Produit intérieur brut aux prix du
                                                         -1.3       0.4       2.8       4.3       2.1         3.2       3.2        3.0         3.5
          prices                                                                                                                                                                 marché


           2009: Provisional         2010:Estimates                                                                                       2009: provisoire             2010:Estimée


      African Statistical Yearbook 2011 / Annuaire Statistique pour l'Afrique 2011
Guinea-Bissau                                                                                                                                            Guinée-Bissau

Expenditure on Gross domestic product at constant purchasers'
                                                                                                       Emplois du produit intérieur brut aux prix constants d'acquisition
values

Annual Growth Rates (%)                                                                                                                  Taux de croissance annuel (%)
                                                                                                                                                            Consommation finale des
Government final consumption                -5.9        14.3      -14.8      12.1       -0.7             6.1      -16.5       0.0         3.0
                                                                                                                                                            administrations publiques

Private final consumption                   -0.4         -8.3     17.1        -0.7      3.6              1.2        6.3       1.2         0.3            Consommation finale privée

Gross fixed capital formation              29.1         14.2      -21.3       -8.7     15.1             80.2      -13.4       5.2         6.7         Formation brute de capital fixe

Exports of goods and services              -19.9         -9.0      9.6        9.7      -10.8            50.1        7.4       2.0         9.2       Exportations de biens et services

                                                                                                                                                      Moins importations de biens et
Less imports of goods and services          -6.0        -20.1     34.5        -6.9      -0.8            43.9       -2.4       -2.7       -0.9
                                                                                                                                                                            services


                                                                              III INFLATION

                                          2002         2003      2004       2005      2006            2007      2008       2009       2010
Annual Growth Rates (%)                                                                                                                  Taux de croissance annuel (%)
All Item                                    3.3          -3.5      0.8        3.3       0.7              4.6       10.4      -2.6        3.6                                Ensemble

Food                                         ...         -5.0      1.8        3.4       0.4              5.9       16.2       -3.8       8.3                             Alimentation

Health                                       ...         3.2       -1.2       1.0       7.7              1.6        1.6       1.7        1.4                                    Santé

Energy                                       ...         -2.8      1.7        0.2       3.8              5.5        8.9       0.1        -1.1                                  Energie

Transport                                    ...         0.1       1.4       15.2       3.6             -2.9        6.1       -4.7       0.7                                Transport


                                                    IV AGRICULTURAL PRODUCTION - PRODUCTION AGRICOLE

                                          2002         2003      2004       2005      2006            2007      2008       2009       2010
Tons (Thousand)                                                                                                                                                Tonnes (milliers)
Rice, Tons (thousands)                        ...         88        89         98       106              131       149          ...        ...                   Riz, tonnes (milliers)

Cashew nuts, Tons (thousands)                 ...         81        81         81        81              81         81          ...        ...        Noix de cajou, tonnes (milliers)

Palm nuts, Tons (thousands)                   ...         80        82         84        80              80         80          ...        ...       Noix de palme, tonnes (milliers)

Coconuts, Tons (thousands)                    ...         46        46         46        46              46         46          ...        ...         Noix de coco, tonnes (milliers)

Millet, Tons (thousands)                      ...         17        18         26        28              26         31          ...        ...                   Mil, tonnes (milliers)


                                                        V MINING PRODUCTION - PRODUCTION MINIERE
                                                                                                                                                                                          197
                                          2002         2003      2004       2005      2006            2007      2008       2009       2010


                                              ...          ...       ...        ...       ...             ...        ...        ...        ...

                                              ...          ...       ...        ...       ...             ...        ...        ...        ...


                                              ...          ...       ...        ...       ...             ...        ...        ...        ...


                                                                           VI ENERGY - ENERGIE

                                          2002         2003      2004       2005      2006            2007      2008       2009       2010

Electricity - total hydro production,                                                                                                             Électricité - production hydraulique
                                              ...        0.0       0.0        0.0       0.0              0.0        0.0         ...        ...
kilowatt hours (millions)                                                                                                                            totale, kilowatt-heures (millions)

Electricity - total thermal production,                                                                                                             Électricité - production thermique
                                           60.0         61.0      63.0       64.0      66.0             70.0         ...        ...        ...
kilowatt hours (millions)                                                                                                                            totale, kilowatt-heures (millions)

Electricity - total production, self-                                                                                                            Electricité - Production totale privée
                                               5            5         5          5         6               7         ...        ...        ...
producer (Million Kilowatt Hours)                                                                                                                          (million de kilowatt heures)

Electricity - total production, public                                                                                                                  Electricité - Production totale
                                             55           56        58         59        60              63          ...        ...        ...
(Million Kilowatt Hours)                                                                                                                         publique (million de kilowatt heures)


                                                                                                African Statistical Yearbook 2011 / Annuaire Statistique pour l'Afrique 2011
Guinea-Bissau                                                                                                                                          Guinée-Bissau
                                                  VII TOURISM AND INFRASTRUCTURE - TOURISME ET INFRASTUCTURE

                                                  2002        2003      2004        2005       2006       2007      2008        2009            2010

         Arrivals - Tourists (thousands)            1.302      1.003      1.456      1.685      1.746      1.815     1.829           ...             ...        Arrivées - touristes (milliers)

         Rooms in hotels and similar                                                                                                                     Chambres d'hotels et établissements
         establishments (thousands)                     ...       ...         4      3.729      3.718      3.724     3.724           ...             ...                  assimilés (milliers)

         Paved Road (% of total)                       38        38          38         38         38        38        38           38               ...     Routes asphaltées (% du total)
         Total Network (Railways-km)                2 755      2 755      2 755      2 755      2 755      2 755     2 755       2 755               ...      Réseau total voies ferrées-Km
         Main Telephone Lines (per 1,000                                                                                                                    Lignes téléphoniques fixes (pour
                                                         1         8           1          1          1         1         1           ...             ...
         inhabitants)                                                                                                                                                        1000 habitants)
         Mobile Cellular Subscribers (per                                                                                                                   Abonnés aux téléphones mobiles
                                                        ...        1           5          6        22        29        29            ...             ...
         1,000 inhabitants)                                                                                                                                            (pour 1000 habitants)


                                        VII FINANCIAL AND MONETARY STATISTICS - FINANCES ET STATISTIQUES MONETAIRES

                                                  2002        2003      2004        2005       2006       2007      2008        2009            2010

         VII-1 Monetary Statistics                                                                                                                    VII-1 Statistiques monétaires
         CFA Franc(Millions)                                                                                                                                      Franc CFA (Millions)
         Money supply (M1)                         85 074     29 922     42 964     51 679     53 260     63 509    80 688      87 483         108 348                Masse monétaire (M1)
         Quasi-money                                1 282       564         577      1 138      1 892      5 367     8 481       7 807          13 544                        Quasi-monnaie
           of which Demand Deposit                      ...       ...         ...        ...        ...       ...       ...          ...             ...            dont Monnaie scripturale
         Net foreign assets                        53 681     11 510     32 331     35 158     43 303     51 911    66 373      82 270          80 862                 Avoirs extérieurs nets
         Domestic credit                           22 777     17 777     11 977     14 519     16 732     20 693    27 750      19 378          46 533                        Crédit intérieur

         of which claims on private sector          4 211      2 651      2 251      3 326      6 329     10 469    18 621      22 070          31 351     dont créances sur le secteur privé

         of which Claims on government                                                                                                                          dont créances nettes sur le
                                                   18 566     15 126      9 726     11 193     10 403     10 224     9 129      - 2 692         15 182
         sector, net                                                                                                                                                         gouvernement
         International reserves (millions of US                                                                                                        Réserves internationales (millions de
                                                      103        33          73         80         82       113       125          169            148
         $)                                                                                                                                                                            $ EU)
         Average Exchange Rate (National                                                                                                                Taux de change (moyen) (monnaie
                                                   696.99     581.20     528.29     527.47     522.89     479.27    447.81      472.19          495.28
         Currency per us $)                                                                                                                                           nationale par dollars)


         VII-2 Public Finance                                                                                                                               VII-2 Finances publiques
         CFA Franc(Millions)                                                                                                                                      Franc CFA (Millions)
         Total Revenues and Grants                 31 947     41 354     57 654     43 021     48 978     57 097    57 097      66 800          74 500              Recettes totales et dons
           Tax Revenue                             11 858     20 915     20 915     20 915     20 915     20 915    20 915      18 800          29 300                       Recettes fiscales
           Non Tax Revenue                          9 789     12 239     12 239     12 239     12 239     12 239    12 239    1 010 800         15 100                  Recettes non fiscales
           Grants                                  10 300      8 200     24 500      9 867     15 824     23 943    23 943      37 200          30 100                                    Dons
198
         Total Expenditures and Net Lending        46 409     41 000     70 416     51 845     52 243     54 474    54 474      78 300         116 200        Dépenses totales et prêts nets

           Current expenditure                     33 720     27 800     42 074     39 364     40 065     41 125    41 125      59 100          49 500                   Dépenses courantes
           Of which Wages and Salaries             10 527     10 500     16 168     20 031     18 901     19 729    19 729      23 353          25 003        Dont rémunérations et salaires
           Capital expenditure                     12 689      9 600     28 342     12 481     12 178     13 349    13 349       5 529           3 336               Dépenses d'équipement
           Net Lending                                   0     3 600          ...        ...        ...       ...       ...          ...             ...                            Prêts nets
         Fiscal Balance                           - 14 462      354     - 12 762    - 8 824    - 3 265     2 623     2 623     - 11 500        - 47 500      Solde global y compris les dons


         VII-3 Balance of Payments                                                                                                                     VII-3 Balance des paiements
         CFA Franc(Millions)                                                                                                                                      Franc CFA (Millions)
         Trade balance                                - 3          0        - 4        - 9       - 28       - 29      - 32        - 38            - 39                  Balance commerciale
         Services Balance                            - 15       - 18       - 19       - 19       - 19       - 17      - 19        - 19            - 20                  Balance des services
         Net Income                                   - 6        - 5        - 5        - 5        - 5        - 5       - 7          - 6            - 6                          Revenus nets
         Current transfers, net total                  23        23          36         27         30        36        44           45              44                   Transferts courants
         Current account balance                      - 1          0           7       - 6       - 21       - 15      - 13        - 18            - 20             Solde du compte courant


         VII-4 External Debt and Financial Flows                                                                                           VII-4 Dette extérieure et flux financiers
         US $(Millions)                                                                                                                                                  $ E.U(Millions)
         Total external debt                          941      1 013      1 024      1 029      1 025      1 031     1 040       1 064             160                Dette extérieure totale
           Private                                       1         1           1          1          1         1         1            0               0                                 Privée
           Public                                     941      1 013      1 023      1 028      1 024      1 031     1 039       1 064             160                                Publique
         Total external debt service                     3         6           6          4          5         6         4          11             930         Service de la dette extérieure
         Net Foreign Direct Investment                                                                                                                       Investissements étranger direct
                                                         4         3           9          8        17        19          6          14               ...
         Inflows                                                                                                                                                         (flux nets entrants)
         Net Total Official Development                                                                                                                     Aide publique au développement
                                                       60       150          76         66         87       122       132          146               ...
         assistance                                                                                                                                                             (nette totale)


      African Statistical Yearbook 2011 / Annuaire Statistique pour l'Afrique 2011
Guinea-Bissau                                                                                                                                  Guinée-Bissau

                              2002        2003        2004        2005        2006             2007        2008        2009        2010

CFA Franc(Millions)                                                                                                                                            Franc CFA
Exports, fob                                                                                                                                         Exportations, fàb


Exports - Total                    ...    37 784      40 026      47 271      38 766           51 299      57 421      56 418      57 021               Exportations - Total


Main Products                                                                                                                                        Principaux produits


Cashew nut                         ...    33 863      38 193      44 706      34 712           39 340      46 213      45 863      46 812                     Noix de cajou


Cotton                             ...       132            0          ...        18                ...         ...         ...         ...                           Coton


Woods                              ...       134            1         31         103               67          70         703         712                               Bois


                                   ...         ...         ...         ...         ...              ...         ...         ...         ...


                                   ...         ...         ...         ...         ...              ...         ...         ...         ...

Main Destinations                                                                                                                               Principales destinations

India                              ...   19 051.0    33 025.0    29 085.0    20 002.0         34 183.0    35 351.0    34 213.0    33 512.0                              Inde


Singapore                          ...   13 201.0     5 169.0     7 057.0     8 827.0          1 204.0     1 123.0          ...    1 216.0                        Singapour


China                              ...     426.0           ...      57.0           ...           20.0        38.0      1 093.0       42.0                              Chine


                                   ...         ...         ...         ...         ...              ...         ...         ...         ...


                                   ...         ...         ...         ...         ...              ...         ...         ...         ...


                              2002        2003        2004        2005        2006             2007        2008        2009        2010
Imports, cif                                                                                                                                          Importations, cif

Imports - Total               49 423      46 006      50 795      64 970      75 731           91 736      89 010      93 916      96 121     Importations - Total (millions)
                                                                                                                                                                                199
                                                                                                                                                     Principaux produits
Main Products


Rice                               ...     9 033       6 719       8 849      11 024            9 395       9 769       9 876       8 963                                Riz


Wheat flour                        ...     2 640       2 494       4 059       3 616            4 214       2 251       2 376       1 731                      Farine de ble


Beverages                          ...     2 966       2 913       3 457       3 475            3 510       4 451       4 546       3 731                           Boissons


Petroleum products, refined        ...     8 314      15 838      15 282      18 611           19 278      20 000      18 531      20 000        Produits petroliers raffines


Construction Materials             ...     4 168       3 322       3 986       4 218            3 296       3 400       3 516       4 013         Materiaux de construction


Main Origin                                                                                                                                     Principales provenances

Senegal                       8 436.0     3 860.9     6 677.8    12 440.7    15 744.8         10 815.1    11 351.0     9 321.0    11 821.0                          Sénégal

Portugal                      3 959.3     2 606.7     3 265.4     2 320.5     2 428.3          2 369.2     3 251.0     2 132.0     3 031.0                          Portugal

China                         1 805.9     5 440.6     3 246.2     1 208.4     1 075.1          1 294.9     1 278.0     1 233.0      900.0                              Chine

France                        1 149.5     1 946.4      183.3       132.7      1 025.3           987.3           ...         ...         ...                          France

India                         1 127.2     1 062.3      985.3       271.1      1 314.0          1 425.2       70.0      1 426.0     1 236.0                              Inde


                                                                                         African Statistical Yearbook 2011 / Annuaire Statistique pour l'Afrique 2011
Kenya                                                                                                                                                                                Kenya

         AREA (KM 2)                                                                                        592 909                                                                SUPERFICIE (KM 2)
         CAPITAL CITY                             Nairobi                                                                                              Nairobi                                 CAPITALE
         CURRENCY                                 Kenyan Shilling                                                                             Shilling Kenyan                                  MONNAIE


                                 I SOCIAL AND DEMOGRAPHIC INDICATORS — INDICATEURS DEMOGRAPHIQUES ET SOCIAUX

                                                     2002         2003         2004         2005         2006         2007         2008         2009       2010
         Population                                                                                                                                                                         Population
                                                                                                                                                                        Population au milieu de l'année -
         Mid-year population - Total (Million)          32.2         33.2         34.2         35.1         36.1         37.2         38.3         39.4       ...
                                                                                                                                                                                           Total (million)
                                                                                                                                                                        Population au milieu de l'année -
         Mid-year population - Urban (%)                  ...          ...        20.0         21.0         21.0         21.0         21.0         21.9       ...
                                                                                                                                                                                           Urbaine (%)

         Female (%)                                     51.2         51.1         51.1         51.1         51.1         51.0         51.0         51.0       ...                             Femme (%)


         Population by Age Group                                                                                                                                            Population par groupe d'âge


            0-14                                   13913 049    14264 820    14621 692    15102 744    15583 450    16068 793    16560 630    17060 465       ...                                     0-14


            15-64                                  17339 878    17905 339    18524 048    18969 778    19456 658    19984 087    20553 986    21167 534       ...                                    15-64


            65+                                      969 607     1001 329     1033 604     1066 122     1098 636     1131 044     1163 240     1195 265       ...                                     65+


         Active Population (000)                          ...          ...          ...          ...    14 600.0           ...          ...          ...      ...                 Population active (000)

            Female (%)                                    ...          ...          ...          ...        49.3         46.4         46.4         46.4       ...                             Femme (%)

                                                                                                                                                                       Taux brut de natalité - Total (par
         Crude birth rate - Total (per 1000)            38.7         37.5         39.1         39.2         39.2         39.0         34.8         38.4       ...
                                                                                                                                                                                                   1000)
                                                                                                                                                                     Taux brut de mortalité - Total (par
         Crude death rate - Total (per 1000)            12.7         12.8         12.7         12.5         12.3         12.0         11.6         11.3       ...
                                                                                                                                                                                                  1000)
         Life expectancy at birth - Total                                                                                                                              Espérance de vie à la naissance -
                                                        52.0         51.9         52.1         52.5         53.0         53.6         54.3         54.9       ...
         (years)                                                                                                                                                                         Total (années)
         Net reproduction rate - (per                                                                                                                                   Taux net de reproduction - (par
                                                          ...          ...          ...         1.9           ...          ...          ...          ...      ...
         woman)                                                                                                                                                                                 femme)
                                                                                                                                                                       Indice synthétique de fécondité -
         Total fertility rate - (p woman)
                       y        (per    )                5.0          4.9          5.0          5.0          5.0          5.0          4.6          4.9       ...
                                                                                                                                                                                           (par femme)

         Education                                                                                                                                                                     Enseignement

         Teaching staff at first level - Total                                                                                                                       Personnel enseignant - 1er degré -
                                                      178.04        178.6        178.2        171.0        163.0        173.2        170.1        171.3       ...
         (thousands)                                                                                                                                                                    Total (milliers)
         Teaching staff at second level - Total                                                                                                                     Personnel enseignant - 2ème degré -
200                                                    45.99         46.4         47.6         47.4         42.4         44.3         43.0         48.1       ...
         (thousands)                                                                                                                                                                     Total (milliers)
         Teaching staff at third level - Total                                                                                                                      Personnel enseignant - 3ème degré -
                                                         2.0          1.9          1.9          2.0          2.1          2.7          2.8           ...      ...
         (thousands)                                                                                                                                                                     Total (milliers)
         First level student enrollment - Total                                                                                                                        Elèves inscrits - 1er degré - Total
                                                       6 063        7 160        7 395        7 597        7 632        8 330        8 564        8 831       ...
         (thousands)                                                                                                                                                                             (milliers)
         First level student enrollment -                                                                                                                           Elèves inscrits - 1er degré - Femmes
                                                       2 375        2 820        2 861        3 689        3 736        4 069        4 201        4 322       ...
         Female (thousands)                                                                                                                                                                       (milliers)
         Second level student enrollment -                                                                                                                           Elèves inscrits - 2ème degré - Total
                                                        779          869          926          934         1 030        1 180        1 382        1 508       ...
         Total (thousands)                                                                                                                                                                      (milliers)
         Second level student enrollment -                                                                                                                                 Elèves inscrits - 2ème degré -
                                                        367          411          439          440          484          541          636          699        ...
         Female (thousands)                                                                                                                                                            Femmes (milliers)
         Third level student enrollment - Total                                                                                                                      Elèves inscrits - 3ème degré - Total
                                                        98.1           ...       108.4         92.0        112.0        118.0        123.0        178.0       ...
         (thousands)                                                                                                                                                                            (milliers)
         Third level student enrollment -                                                                                                                                  Elèves inscrits - 3ème degré -
                                                        34.2           ...        40.6         33.5         43.9         47.5         49.3         67.4       ...
         Female (thousands)                                                                                                                                                            Femmes (milliers)
         Public expenditure on education (%                                                                                                                            Dépenses publiques consacrées à
                                                          ...        22.1         29.2         17.9         21.5         19.2         21.4         18.9       ...
         of budget)                                                                                                                                                      l'enseignement (% du budget)

         Health                                                                                                                                                                                    Santé

         Hospital beds - Total (per 10 000                                                                                                                             Nombre de lits d'hôpitaux - Total
                                                         19           19           19           19            ...          ...          ...          ...      ...
         population)                                                                                                                                                                      (pour 10 000)
         Nurses - Total (per 10 000                                                                                                                                   Nombre d'infirmières - Total (pour
                                                         12           12           12           12           12            ...          ...          ...      ...
         population)                                                                                                                                                                            10 000)
         Physicians - Total (per 10 000                                                                                                                               Nombre de médecins - Total (pour
                                                           2            2            2            2            2            2            3            4       ...
         population)                                                                                                                                                                          10 000)
         Public expenditure on Health (% of                                                                                                                         Dépenses publiques consacrées à la
                                                           9            8            9          10           10            ...          ...          ...      ...
         budget)                                                                                                                                                                 santé (% du budget)


      African Statistical Yearbook 2011 / Annuaire Statistique pour l'Afrique 2011
Kenya                                                                                                                                                                           Kenya
                                                          II NATIONAL ACCOUNTS — COMPTES NATIONAUX

                                          2002           2003        2004        2005        2006         2007        2008        2009        2010

Gross domestic product by kind of economic activity at current prices
                                                                                                 Produit intérieur brut par branche d'activité économique aux prix courants


Kenyan Shilling (Millions)                                                                                                                                 Shilling Kenyan (Millions)

Agriculture                              266 622        292 050     317 677     343 212     386 401      404 184     480 205     565 293           ...                            Agriculture

Mining and quarrying                          4 545       5 936       6 174       6 803       7 884       12 904      14 930      12 426           ...                 Industries extractives

Manufacturing                            101 710        109 884     127 441     149 162     166 777      190 497     203 999     216 833           ...            Industries manufacturières

Electricity, gas & water                     20 812      23 330      24 810      28 766      28 477       26 173      44 992      54 037           ...                 Electricité, gaz et eau

Construction                                 32 373      37 669      48 079      56 121      63 928       69 556      80 407      99 013           ...          Bâtiments et travaux publics
Wholesale & retail trade,                                                                                                                                    Commerce de gros et de détail,
                                         103 437        109 294     133 438     149 830     175 781      207 221     235 200     267 490           ...
restaurants, hotels                                                                                                                                                   restaurants et hôtels
                                                                                                                                                              Banques, assurances, affaires
Finance, insurance, real estate, etc.        99 343     116 237     125 727     145 524     171 993      194 093     216 959     223 807           ...
                                                                                                                                                                              immobilières
Transport and communications                 99 306     104 684     117 045     128 879     152 267      184 291     205 128     246 551           ...      Transport(s) et communications
                                                                                                                                                                Administrations publiques et
Public administration and defense            45 730      46 433      53 672      64 178      86 973      106 862     106 110     103 184           ...
                                                                                                                                                                                    défense
Other services                           150 576        170 652     187 834     200 666     219 033      239 508     263 949     288 084           ...                        Autres services
                                                                                                                                                             Moins Services d’intermédiation
Less Imputed Service Charges                 - 9 070    - 10 111     - 9 052    - 11 514    - 15 376     - 20 074    - 18 231    - 28 232          ...
                                                                                                                                                                                   financière
Gross domestic product at factor                                                                                                                         Produit intérieur brut aux couts des
                                         915 384       1 006 057   1 132 844   1 261 625   1 444 139    1 615 214   1 833 646   2 048 485          ...
cost / basic prices                                                                                                                                                    facteurs / prix de base

Plus: Indirect Taxes / taxes on                                                                                                                          Plus taxes indirectes/impôts sur les
                                         116 460        125 721     141 478     154 197     178 453      213 574     243 787     225 200           ...
products, less subsidies                                                                                                                                     produits, moins les subventions


Expenditure on Gross domestic product at current purchaser's values
                                                                                                             Emploi du produit intérieur brut aux prix courants d'acquisition

Kenyan Shilling (Millions)                                                                                                                                 Shilling Kenyan (Millions)
                                                                                                                                                                   Consommation finale des
Government final consumption             176 821        205 207     227 596     246 056     285 056      327 918     346 769     369 741           ...
                                                                                                                                                                   administrations publiques

Private final consumption                768 686        809 196     929 065    1 059 083   1 220 276    1 352 253   1 603 362   1 715 602          ...           Consommation finale privée

Gross fixed capital formation            178 466        179 254     207 196     264 728     309 592      355 090     409 597     456 771           ...        Formation brute de capital fixe

Increase in inventories                  - 21 713         7 305      10 565     - 25 282    - 18 383      - 6 240     13 022      18 105           ...                   Variation des stocks

Exports of goods and services            244 468        270 118     335 743     395 208     439 906      490 987     584 504     575 253           ...     Exportations de biens et services
                                                                                                                                                              Moins importations de biens et
                                                                                                                                                                                                 201
Less imports of goods and services       314 884        339 301     435 844     523 970     613 856      691 220     879 821     861 788           ...
                                                                                                                                                                                    services
GDP at purchasers' values               1 031 844      1 131 778   1 274 322   1 415 823   1 622 591    1 828 788   2 077 433   2 273 685          ...             PIB aux prix d'acquisition


Gross domestic product by kind of economic activity at constant
                                                                                               Produit intérieur brut par branche d'activité economique aux prix constants
prices
Annual Growth Rates (%)                                                                                                                          Taux de croissance annuel (%)
Agriculture                                     -3.5         2.4         1.7         6.9         4.4          2.1        -5.0        -1.4        5.6                              Agriculture

Mining and quarrying                            2.5          3.5        -0.4         2.7         4.1         12.9         3.2        -4.5       11.5                   Industries extractives

Manufacturing                                   0.1          6.0         4.5         4.7         6.3          6.5         3.8         1.6        7.8              Industries manufacturières

Electricity, gas & water                       20.7         14.0         3.0        -0.1        -1.4          9.1         5.2        -2.9       12.6                   Electricité, gaz et eau

Construction                                    -1.9         1.0         4.4         7.5         6.3          6.9         8.3        14.5       12.5            Bâtiments et travaux publics
Wholesale & retail trade,                                                                                                                                           Commerce de gros et de
                                                -1.7        -1.1        11.4         6.5        12.0         12.1        -0.5         4.7        4.4
restaurants, hotels                                                                                                                                               détail,restaurants et hôtels
                                                                                                                                                               Banques, assurances, affaires
Finance, insurance, real estate, etc.           1.1          2.0         2.4         4.2         4.2          4.8         3.4         3.5        6.9
                                                                                                                                                                               immobilières
Transport and communications                    9.0          3.5         7.0         9.0        11.4         15.1         3.1         6.4        3.2        Transport(s) et communications
                                                                                                                                                                Administrations publiques et
Public administartion and defense               -0.1         0.6         0.2        -1.3        -1.6         -2.0         0.6         1.6        0.7
                                                                                                                                                                                    défense
Other services                                  2.8          5.2         2.8         1.9         2.1          3.5         4.5         4.5        3.3                          Autres services
                                                                                                                                                             Moins Services d’intérmediation
Less Imputed Service Charges                    -9.4        -3.3         4.7         4.3         5.1          2.7        -7.5        13.4       25.5
                                                                                                                                                                                   financière
Gross domestic product at factor                                                                                                                         Produit intérieur brut aux couts des
                                                0.7          3.1         3.9         5.2         5.6          6.2         0.9         2.7        5.2
cost / basic prices                                                                                                                                                    facteurs / prix de base

Plus: Indirect Taxes / taxes on                                                                                                                          Plus taxes indirectes/impôts sur les
                                                -0.7         1.3        14.8        11.0        11.2         13.4         6.7         1.0        6.3
products, less subsidies                                                                                                                                     produits, moins les subventions

Gross domestic product at market                                                                                                                           Produit intérieur brut aux prix du
                                                0.5          2.9         5.1         5.9         6.3          7.1         1.7         2.5        5.4
prices                                                                                                                                                                                marché


2009: semi-final            2010:Estimated                                                                                             2009: semi-définitif                  2010:Estimée


                                                                                                   African Statistical Yearbook 2011 / Annuaire Statistique pour l'Afrique 2011
Kenya                                                                                                                                                         Kenya

         Expenditure on Gross domestic product at constant purchasers'
                                                                                                      Emplois du produit intérieur brut aux prix constants d'acquisition
         values

         Annual Growth Rates (%)                                                                                                        Taux de croissance annuel (%)
                                                                                                                                                          Consommation finale des
         Government final consumption                  1.7       6.0       0.6       -0.8       2.2       3.6       2.3       5.5        ...
                                                                                                                                                          administrations publiques

         Private final consumption                    -1.7      -1.6       5.9        8.3       9.8       7.5      -0.6       3.5        ...            Consommation finale privée

         Gross fixed capital formation                -6.1      -8.0       7.3      27.8      18.5      13.6        9.5       0.6        ...        Formation brute de capital fixe

         Exports of goods and services                 7.1       7.2     12.6         9.4       3.1       6.6       7.5      -7.0        ...      Exportations de biens et services

                                                                                                                                                    Moins importations de biens et
         Less imports of goods and services          -11.4      -0.1     12.3       14.9      17.8      11.1        6.6      -0.2        ...
                                                                                                                                                                          services


                                                                                     III INFLATION

                                                   2002      2003      2004       2005      2006      2007      2008      2009       2010
         Annual Growth Rates (%)                                                                                                        Taux de croissance annuel (%)
         All Item                                      2.0       9.8     11.6       10.3      14.5        9.8     26.2      19.6        5.4                               Ensemble

         Food                                          1.4     15.5      15.5       12.5      20.9      12.3      35.2      26.4        8.5                            Alimentation

         Health                                        5.3       7.4       3.5        4.8       4.2       4.3     10.7      14.7        4.5                                   Santé

         Energy                                        3.3       5.7     14.7       21.4      12.9        8.4     21.5       -1.5       4.4                                  Energie

         Transport                                     0.8       6.5     21.5         6.1       7.4       5.5     18.1        2.6       8.4                               Transport


                                                         IV AGRICULTURAL PRODUCTION - PRODUCTION AGRICOLE

                                                   2002      2003      2004       2005      2006      2007      2008      2009       2010
         Tons (Thousand)                                                                                                                                     Tonnes (milliers)
         Maize, Tons (thousands)                    2 340     2 520     2 610      2 907     3 114     2 925     2 340     2 439         ...                  Maïs, tonnes (milliers)

         Tea, Tons (thousands)                        287       294       325        329       311       370       346       314         ...                  Thé, tonnes (milliers)

         Sugar cane, Tons (thousands)               4 501     4 204     4 661      4 801     4 933     5 204     5 112     5 611         ...       Canne à sucre, tonnes (milliers)

         Coffee green, Tons (thousands)                46        61        50         48        51        52        39        49         ...                  Café, tonnes (milliers)

         Wheat, Tons (thousands)                       60        76        88        129       106       113        86       129         ...                   Blé, tonnes (milliers)


                                                              V MINING PRODUCTION - PRODUCTION MINIERE
202
                                                   2002      2003      2004       2005      2006      2007      2008      2009       2010

                                                                                                                                                       Carbonate de soude, tonnes
         Soda Ash, Tons (thousands)                 304.1     352.6     353.8      360.2     374.2     386.6     502.8         ...       ...
                                                                                                                                                                         (milliers)
         Flourspar, Tons (thousands)                 85.0      80.2     118.0      109.6     132.0      85.1     130.1         ...       ...           Spath fluor, tonnes (milliers)

                                                                                                                                                         Minerai d'or et concentrés
         Gold (Kilograms)                          1 477.0   1 543.0    567.0      616.0     432.0    3 023.0    343.0         ...       ...
                                                                                                                                                                     (Kilogrammes)


                                                                                 VI ENERGY - ENERGIE

                                                   2002      2003      2004       2005      2006      2007      2008      2009       2010

         Electricity - total hydro production,                                                                                                  Électricité - production hydraulique
                                                   1 477.0   1 543.0    567.0      616.0     432.0    3 023.0    343.0    1 100.0        ...
         kilowatt hours (millions)                                                                                                                 totale, kilowatt-heures (millions)

         Electricity - total thermal production,                                                                                                  Électricité - production thermique
                                                   2 490.0   1 900.0   2 000.0    2 720.0   3 090.0   2 740.0   3 320.0   4 630.0        ...
         kilowatt hours (millions)                                                                                                                 totale, kilowatt-heures (millions)

         Electricity - total production, self-                                                                                                 Electricité - Production totale privée
                                                    4 685     4 851     5 194      5 547     5 895     6 325     6 456     6 469         ...
         producer (Million Kilowatt Hours)                                                                                                               (million de kilowatt heures)

         Electricity - total production, public                                                                                                       Electricité - Production totale
                                                    6 550     7 080     6 100      5 480     5 130     5 680     5 060     3 260         ...
         (Million Kilowatt Hours)                                                                                                              publique (million de kilowatt heures)


      African Statistical Yearbook 2011 / Annuaire Statistique pour l'Afrique 2011
Kenya                                                                                                                                                                                  Kenya
                                         VII TOURISM AND INFRASTRUCTURE - TOURISME ET INFRASTUCTURE

                                          2002        2003          2004         2005         2006         2007         2008          2009         2010

Arrivals - Tourists (thousands)          1.00128     1.146102       1.3607        1.479     1.600541     1.816957     1.203224          1.49            ...           Arrivées - touristes (milliers)

Rooms in hotels and similar                                                                                                                                 Chambres d'hotels et établissements
establishments (thousands)                 4.416        4.336        5.568        6.063        7.202        8.289        8.148     10.335385            ...                  assimilés (milliers)

Paved Road (% of total)                       14           14           14           14           14           14           14            14            ...        Routes asphaltées (% du total)
Total Network (Railways-km)               65 878       65 878       66 169       66 169       66 169       66 172       66 172        66 945            ...         Réseau total voies ferrées-Km
Main Telephone Lines (per 1,000                                                                                                                                   Lignes téléphoniques fixes (pour
                                              10           10            9            9            9            7            6              6           ...
inhabitants)                                                                                                                                                                      1000 habitants)
Mobile Cellular Subscribers (per                                                                                                                                  Abonnés aux téléphones mobiles
                                              36           47           73          129          200          301          421             ...          ...
1,000 inhabitants)                                                                                                                                                         (pour 1000 habitants)


                          VII FINANCIAL AND MONETARY STATISTICS - FINANCES ET STATISTIQUES MONETAIRES

                                          2002        2003          2004         2005         2006         2007         2008          2009         2010

VII-1 Monetary Statistics                                                                                                                                VII-1 Statistiques monétaires
Kenyan Shilling (Millions)                                                                                                                                       Shilling Kenyan (Millions)
Money supply (M1)                        170 331      219 515      253 322      274 901      344 958      444 662      523 836       528 382      654 964                   Masse monétaire (M1)
Quasi-money                              224 743      222 092      247 786      275 731      299 258      331 042      372 685       515 682      594 234                           Quasi-monnaie
  of which Demand Deposit                      ...          ...          ...          ...          ...          ...          ...           ...          ...              dont Monnaie scripturale
Net foreign assets                       103 316      123 019      140 580      182 836      206 968      255 265      257 587       242 660      276 124                    Avoirs extérieurs nets
Domestic credit                          403 574      441 100      501 826      528 927      595 905      668 920      841 819     1 018 810     1 258 190                          Crédit intérieur

of which claims on private sector        267 692      284 707      347 733      372 008      426 190      495 778      630 215       716 541      848 802       dont créances sur le secteur privé

of which Claims on government                                                                                                                                          dont créances nettes sur le
                                         106 229      124 613      114 655      111 478      123 999      129 199      154 368       228 125      336 053
sector, net                                                                                                                                                                        gouvernement
International reserves (millions of US                                                                                                                        Réserves internationales (millions de
                                           1 068        1 482        1 519        1 799        2 416        3 355        2 879         3 849        4 326
$)                                                                                                                                                                                            $ EU)
Average Exchange Rate (National                                                                                                                                Taux de change (moyen) (monnaie
                                           78.75        75.94        79.17        75.55        72.10        67.32        69.18         77.35        79.23
Currency per us $)                                                                                                                                                         nationale par dollars)


VII-2 Public Finance                                                                                                                                              VII-2 Finances publiques
Kenyan Shilling (Millions)                                                                                                                                       Shilling Kenyan (Millions)
Total Revenues and Grants                210 785      228 163      270 920      303 845      329 486      387 483      468 234       531 472      612 561                 Recettes totales et dons
  Tax Revenue                            175 215      196 061      217 776      264 763      288 669      346 563      408 445       459 368      532 540                         Recettes fiscales
  Non Tax Revenue                         13 211       14 009       23 894       21 060       20 747       25 426       33 085        42 728       44 714                    Recettes non fiscales
  Grants                                  22 360       18 093       29 250       18 022       20 070       15 494       26 704        29 375       35 308                                     Dons      203
Total Expenditures and Net Lending       224 250      262 303      295 588      298 382      355 199      415 221      569 392       594 940      787 174           Dépenses totales et prêts nets

  Current expenditure                    200 990      229 718      268 749      259 848      303 180      339 779      417 381       461 298      561 664                     Dépenses courantes
  Of which Wages and Salaries            110 418      105 961      131 673      116 542      135 924      145 590      167 746       183 122      208 763           Dont rémunérations et salaires
  Capital expenditure                     22 236       31 946       25 984       38 278       50 626       73 527      105 767       124 608      218 785                 Dépenses d'équipement
  Net Lending                              1 024          639          856          256        1 392        1 915       46 244         9 035        6 725                                Prêts nets
Fiscal Balance                           - 13 464     - 34 140     - 24 668       5 463      - 25 713     - 27 738    - 101 158      - 63 468    - 174 613         Solde global y compris les dons


VII-3 Balance of Payments                                                                                                                                     VII-3 Balance des paiements
Kenyan Shilling (Millions)                                                                                                                                       Shilling Kenyan (Millions)
Trade balance                            - 78 514     - 86 764    - 128 633    - 161 651    - 234 562    - 286 506    - 390 783     - 386 055           ...                  Balance commerciale
Services Balance                          27 197       38 502       48 880       56 135       74 119       84 805       95 498        88 982            ...                   Balance des services
Net Income                               - 11 275      - 6 728     - 10 017      - 8 194      - 5 053      - 9 706      - 3 127       - 5 041           ...                           Revenus nets
Current transfers, net total              53 325       66 091       79 374       94 646      128 693      141 931      161 265       177 667            ...                    Transferts courants
Current account balance                   - 9 266      11 100      - 10 396     - 19 064     - 36 803     - 69 476    - 137 147     - 124 447           ...              Solde du compte courant


VII-4 External Debt and Financial Flows                                                                                                     VII-4 Dette extérieure et flux financiers
US $ (Millions)                                                                                                                                                                $ E.U (Millions)
Total external debt                        5 245        5 824        6 071        5 797        6 145        6 312        7 195         7 831        8 671                   Dette extérieure totale
  Private                                    315          407          360          312          322           91          257           223          357                                    Privée
  Public                                   4 929        5 417        5 711        5 486        5 823        6 221        6 938         7 608        8 314                                 Publique
Total external debt service                  375          456          410          374          485          355          376           387          455            Service de la dette extérieure
Net Foreign Direct Investment                                                                                                                                 Investissements étranger direct (flux
                                              28           82           46           21           51          729           96           141            ...
Inflows                                                                                                                                                                             nets entrants)
Net Total Official Development                                                                                                                                   Aide publique au développement
                                             392          522          658          752          943        1 323        1 363         1 778            ...
assistance                                                                                                                                                                          (nette totale)


                                                                                                     African Statistical Yearbook 2011 / Annuaire Statistique pour l'Afrique 2011
Kenya                                                                                                                                                            Kenya

                                                    2002       2003       2004       2005       2006       2007        2008       2009      2010

         Kenyan Shilling (Millions)                                                                                                                               Shilling Kenyan
         Exports, fob                                                                                                                                           Exportations, fàb


         Exports - Total                           170 252    184 218    215 825    261 578    253 524    278 174     348 629    348 228       ...                 Exportations - Total


         Main Products                                                                                                                                          Principaux produits


         Tea                                        34 376     33 005     36 072     42 373     47 349     46 784      63 812     68 766       ...                                 Thé


         Cutflowers                                 10 382     12 866     17 668     18 338     19 547     21 094      30 698     32 574       ...                      Fleurs coupées


         Beverages and tobacco                       3 545      3 312      3 177      5 533      9 160     10 760      11 118     12 919       ...                   Boissons et tabac


         Coffee, not roasted                         6 541      6 287      6 944      9 061      9 138     10 425      10 126     15 309       ...                    Café non torréfié


         Sodium carbonate                            2 127      2 392      5 359      5 889      3 976      5 419      13 185      8 305       ...               Carbonate de sodium

         Main Destinations                                                                                                                                 Principales destinations

         United Kingdom                            19 500.4   21 232.6   21 588.2   23 459.2   26 696.2   28 667.4    37 880.0   38 251.0      ...                       Royaume-Uni


         Uganda                                    14 272.3   12 334.1   15 695.0   23 436.0   23 159.6   30 162.9    37 821.0   40 563.0      ...                            Ouganda


         Netherlands                               11 013.8   14 124.4   17 088.4   18 304.2   19 602.4   21 898.1    26 072.0   26 299.0      ...                            Pays-Bas


         Tanzania                                   9 219.8    8 138.9   11 165.7   14 527.8   15 816.1   20 859.9    25 999.0   27 324.0      ...                            Tanzanie


         USA                                        3 345.3    2 738.6    4 182.3   11 980.0   20 253.5   18 775.6    20 557.0   17 368.0      ...                           États-Unis


                                                    2002       2003       2004       2005       2006       2007        2008       2009      2010
         Imports, cif                                                                                                                                            Importations, cif

204      Imports - Total                           257 710    281 844    364 557    443 093    521 483    605 112     770 651    788 097       ...      Importations - Total (millions)


                                                                                                                                                                Principaux produits
         Main Products


         Crude petroleum                            23 940     25 415     45 954     51 529     55 016     49 241      81 453     54 495       ...                         Pétrole brut


                                                                                                                                                     Gazole, carburant diesel et autres
         Gas oil, diesel oil and other fuel oils     7 820     16 525     19 575     20 370     30 928     37 508      63 581     52 304       ...
                                                                                                                                                                               fuel-oils

                                                                                                                                                        Kérosène, huile d'éclairage, de
         Kerosene, illuminating oil, jet fuel        7 336     12 228     16 385     16 737     15 382     22 548      33 992     25 508       ...
                                                                                                                                                                        carburéacteur

         Vegetables oils and fats                   13 751     12 817      7 625     13 416     16 592     22 424      33 855     26 935       ...         Huiles végétales et graisses


         Medicinal and pharmaceutical                                                                                                                         Médicaments et produits
                                                     8 678      9 728     11 652     12 536     15 413     15 948      20 776     22 994       ...
         products                                                                                                                                                   pharmaceutiques


         Main Origin                                                                                                                                       Principales provenances

         United Arab Kingdom                       29 059.6   31 917.8   45 044.0   62 112.0   77 529.1   89 464.3   113 810.0   89 709.0      ...                 Émirats Arabes Unis

         India                                     13 809.8   14 811.4   22 629.5   24 621.3   37 780.8   56 817.4    90 531.1   83 243.0      ...                                 Inde

         China                                      6 051.7    8 022.6   12 784.7   22 967.4   29 721.3   45 672.0    63 473.6   74 524.0      ...                                Chine

         South Africa                               6 863.2   23 308.6   34 653.7   42 648.3   33 933.1   35 355.4    46 691.0   70 561.0      ...                      Afrique du Sud

         Japan                                     17 242.1   18 610.8   24 138.1   23 067.3   29 406.8   41 128.5    44 839.6   48 857.0      ...                               Japon


      African Statistical Yearbook 2011 / Annuaire Statistique pour l'Afrique 2011
Lesotho                                                                                                                                                                       Lesotho

AREA (KM 2)                                                                                    30 355                                                                  SUPERFICIE (KM 2)
CAPITAL CITY                             Maseru                                                                                            Maseru                                  CAPITALE
CURRENCY                                 Loti                                                                                                 Loti                                 MONNAIE


                        I SOCIAL AND DEMOGRAPHIC INDICATORS — INDICATEURS DEMOGRAPHIQUES ET SOCIAUX

                                           2002        2003        2004        2005        2006         2007        2008        2009         2010
Population                                                                                                                                                                      Population
                                                                                                                                                            Population au milieu de l'année -
Mid-year population - Total (Million)          1.9         2.0         2.0         2.0         1.9          1.9         1.9         1.9           ...
                                                                                                                                                                               Total (million)
                                                                                                                                                            Population au milieu de l'année -
Mid-year population - Urban (%)                 ...         ...       23.0        23.0        22.8         23.4        23.9        24.4           ...
                                                                                                                                                                               Urbaine (%)

Female (%)                                    53.2        53.1        53.1        53.0        51.4         51.4        51.5        51.6           ...                             Femme (%)


Population by Age Group                                                                                                                                         Population par groupe d'âge


   0-14                                    797 946     799 226     800 093     800 816     638 808      634 236     647 870     653 184      659 093                                      0-14


   15-64                                  1047 662    1065 350    1082 328    1099 256    1129 861    1129 972     1130 111    1130 102     1129 840                                     15-64


   65+                                      91 766      93 015      94 111      95 087     109 220      107 231     105 614     104 193      102 987                                      65+


Active Population (000)                      825.0       835.0       844.0       853.0       862.0        866.0       875.0       885.0           ...                 Population active (000)

   Female (%)                                 52.6        53.5        52.7        52.8        41.1         52.4        44.6        52.4           ...                             Femme (%)

                                                                                                                                                           Taux brut de natalité - Total (par
Crude birth rate - Total (per 1000)           31.6        36.9        36.7        30.1        30.7         30.7        30.7        30.6         30.5
                                                                                                                                                                                       1000)
                                                                                                                                                         Taux brut de mortalité - Total (par
Crude death rate - Total (per 1000)           15.9        16.5        16.9        17.1        23.3         23.1        22.7        22.3         22.0
                                                                                                                                                                                      1000)
Life expectancy at birth - Total                                                                                                                           Espérance de vie à la naissance -
                                              47.2        46.0        45.2        44.8        41.0         41.3        41.6        41.8         41.8
(years)                                                                                                                                                                      Total (années)
Net reproduction rate - (per                                                                                                                                Taux net de reproduction - (par
                                                ...         ...         ...        1.2          ...          ...         ...         ...          ...
woman)                                                                                                                                                                              femme)
                                                                                                                                                           Indice synthétique de fécondité -
Total fertility rate - (p woman)
              y        (per    )               3.9         3.8         3.7         3.6         3.5          3.5         3.4         3.4          3.4
                                                                                                                                                                               (par femme)

Education                                                                                                                                                                  Enseignement

Teaching staff at first level - Total                                                                                                                    Personnel enseignant - 1er degré -
                                              8.91         9.3         9.7        10.2        10.4         10.8        11.3          ...          ...
(thousands)                                                                                                                                                                 Total (milliers)
Teaching staff at second level - Total                                                                                                                  Personnel enseignant - 2ème degré -
                                                ...        3.5         3.5         3.5         3.7          4.0         4.1          ...          ...                                              205
(thousands)                                                                                                                                                                  Total (milliers)
Teaching staff at third level - Total                                                                                                                 Personnel enseignant - 3ème degré -
                                               0.3         0.2         0.1         0.3          ...          ...         ...         ...          ...
(thousands)                                                                                                                                                                Total (milliers)
First level student enrollment - Total                                                                                                                     Elèves inscrits - 1er degré - Total
                                              419         430         427         422         425          401         395           ...          ...
(thousands)                                                                                                                                                                          (milliers)
First level student enrollment -                                                                                                                        Elèves inscrits - 1er degré - Femmes
                                              210         215         212         210         211          198         195           ...          ...
Female (thousands)                                                                                                                                                                    (milliers)
Second level student enrollment -                                                                                                                        Elèves inscrits - 2ème degré - Total
                                               81          83          88          93          95           98          99           ...          ...
Total (thousands)                                                                                                                                                                   (milliers)
Second level student enrollment -                                                                                                                              Elèves inscrits - 2ème degré -
                                               46          46          49          52          53           56          56           ...          ...
Female (thousands)                                                                                                                                                         Femmes (milliers)
Third level student enrollment - Total                                                                                                                   Elèves inscrits - 3ème degré - Total
                                               5.0         6.1          ...        7.9         8.5           ...         ...         ...          ...
(thousands)                                                                                                                                                                         (milliers)
Third level student enrollment -                                                                                                                               Elèves inscrits - 3ème degré -
                                               2.9         3.7          ...        4.5         4.7           ...         ...         ...          ...
Female (thousands)                                                                                                                                                         Femmes (milliers)
Public expenditure on education (%                                                                                                                         Dépenses publiques consacrées à
                                                ...         ...       29.9        20.8        20.0         17.8        16.6        19.1           ...
of budget)                                                                                                                                                   l'enseignement (% du budget)

Health                                                                                                                                                                                 Santé

Hospital beds - Total (per 10 000                                                                                                                          Nombre de lits d'hôpitaux - Total
                                                ...        58           ...         ...         ...          ...         ...         ...          ...
population)                                                                                                                                                                   (pour 10 000)
Nurses - Total (per 10 000                                                                                                                                Nombre d'infirmières - Total (pour
                                              920        1 014       1 020       1 201       1 185        1 223          ...         ...          ...
population)                                                                                                                                                                         10 000)
Physicians - Total (per 10 000                                                                                                                            Nombre de médecins - Total (pour
                                                ...          5          ...         ...         ...          ...         ...         ...          ...
population)                                                                                                                                                                       10 000)
Public expenditure on Health (% of                                                                                                                      Dépenses publiques consacrées à la
                                                 7          8          14           8           8           11          11          13            ...
budget)                                                                                                                                                              santé (% du budget)


                                                                                                  African Statistical Yearbook 2011 / Annuaire Statistique pour l'Afrique 2011
Lesotho                                                                                                                                              Lesotho
                                                           II NATIONAL ACCOUNTS — COMPTES NATIONAUX

                                                  2002     2003     2004     2005     2006       2007      2008       2009       2010

          Gross domestic product by kind of economic activity at current prices
                                                                                         Produit intérieur brut par branche d'activité économique aux prix courants


          Loti (Millions)                                                                                                                                    Loti(Millions)

          Agriculture                               650      671      702      721      709         791       952      1 131      1 217                             Agriculture

          Mining and quarrying                       13       44       68      301      420         820      1 152       960        956                  Industries extractives

          Manufacturing                           1 452     1 432    1 603    1 550    1 888       1 948     2 356     2 150      2 180             Industries manufacturières

          Electricity, gas & water                  304      315      336      413      459         477       516        561        601                  Electricité, gaz et eau

          Construction                              420      438      365      383      410         451       527        637        704           Bâtiments et travaux publics
          Wholesale & retail trade,                                                                                                            Commerce de gros et de détail,
                                                    540      584      630      706      817         922      1 122     1 107      1 143
          restaurants, hotels                                                                                                                           restaurants et hôtels
                                                                                                                                                Banques, assurances, affaires
          Finance, insurance, real estate, etc.   1 358     1 444    1 490    1 571    1 759       2 068     2 460     2 731      2 911
                                                                                                                                                                immobilières
          Transport and communications              337      343      425      520      580         656       747        832        885       Transport(s) et communications
                                                                                                                                                  Administrations publiques et
          Public administration and defense         690      759      866      936     1 015       1 136     1 354     1 817       1 950
                                                                                                                                                                      défense
          Other services                            765      812      883      959     1 028       1 200     1 410     1 881      2 021                         Autres services
                                                                                                                                               Moins Services d’intermédiation
          Less Imputed Service Charges             - 85      - 90     - 67     - 59     - 90      - 170      - 270     - 304      - 324
                                                                                                                                                                     financière
          Gross domestic product at factor                                                                                                 Produit intérieur brut aux couts des
                                                  6 445     6 751    7 301    8 001    8 995      10 298    12 325    13 502     14 244
          cost / basic prices                                                                                                                            facteurs / prix de base

          Plus: Indirect Taxes / taxes on                                                                                                  Plus taxes indirectes/impôts sur les
                                                    478      581      675      617      586         842       898      1 075      1 154
          products, less subsidies                                                                                                             produits, moins les subventions


          Expenditure on Gross domestic product at current purchaser's values
                                                                                                    Emploi du produit intérieur brut aux prix courants d'acquisition

          Loti (Millions)                                                                                                                                    Loti(Millions)
                                                                                                                                                     Consommation finale des
          Government final consumption            2 548     2 725    2 840    3 193    3 431       4 038     5 017     5 927      5 901
                                                                                                                                                     administrations publiques

          Private final consumption               7 653     8 305    8 832    9 571   10 185      11 133    12 385    14 165     15 315            Consommation finale privée

          Gross fixed capital formation           2 164     2 254    2 144    2 018    2 322       2 972     3 773     4 058      4 669         Formation brute de capital fixe

          Increase in inventories                  - 75    - 137       13      100      - 15        140        29        176          0                    Variation des stocks

          Exports of goods and services           4 581     4 404    4 494    4 253    5 181       6 138     7 547     6 739      6 873      Exportations de biens et services
206                                                                                                                                             Moins importations de biens et
          Less imports of goods and services      9 949    10 218   10 347   10 518   11 523      13 281    15 529    16 488     17 361
                                                                                                                                                                      services
          GDP at purchasers' values               6 923     7 331    7 975    8 618    9 581      11 140    13 223    14 577     15 398              PIB aux prix d'acquisition


          Gross domestic product by kind of economic activity at constant
                                                                                        Produit intérieur brut par branche d'activité economique aux prix constants
          prices
          Annual Growth Rates (%)                                                                                                    Taux de croissance annuel (%)
          Agriculture                              -29.4      3.4     -0.9      1.4    -10.3        -0.9      12.1       6.4         1.7                            Agriculture

          Mining and quarrying                     16.5     223.8     53.3    196.5     19.6        50.0       0.8       0.0        10.6                 Industries extractives

          Manufacturing                            29.5      13.1      5.9    -12.0      8.5         1.5       3.1       -5.2        3.1            Industries manufacturières

          Electricity, gas & water                  2.4       6.1      4.0     13.9      5.1         3.5       1.7       3.2         2.9                 Electricité, gaz et eau

          Construction                             -19.9     -3.9    -19.3      3.9     -1.4         3.0       7.7      10.0         5.0          Bâtiments et travaux publics
          Wholesale & retail trade,                                                                                                                   Commerce de gros et de
                                                    3.1       5.8      2.1      5.4      4.7         2.7       4.0       -2.2        0.0
          restaurants, hotels                                                                                                                       détail,restaurants et hôtels
                                                                                                                                                 Banques, assurances, affaires
          Finance, insurance, real estate, etc.     3.3       0.5      2.9      0.1      6.0         5.1       4.6       6.9         2.6
                                                                                                                                                                 immobilières
          Transport and communications             11.2       4.5      8.6     13.3     11.0        11.5      10.9      11.3         3.2      Transport(s) et communications
                                                                                                                                                  Administrations publiques et
          Public administartion and defense        10.3       8.3      2.6      0.9      4.8         3.4       2.9       4.2        -1.6
                                                                                                                                                                      défense
          Other services                            1.1      -2.1     -1.2      0.6      3.3        -2.3      -0.9       0.2        -2.2                        Autres services
                                                                                                                                               Moins Services d’intérmediation
          Less Imputed Service Charges             17.3      -2.2    -13.7    -16.5     39.5        36.2      28.3      18.5         4.6
                                                                                                                                                                     financière
          Gross domestic product at factor                                                                                                 Produit intérieur brut aux couts des
                                                    1.3       4.9      2.0      1.8      4.4         3.9       4.0       2.5         1.9
          cost / basic prices                                                                                                                            facteurs / prix de base

          Plus: Indirect Taxes / taxes on                                                                                                  Plus taxes indirectes/impôts sur les
                                                    -6.8      2.6      5.9      9.8      8.4         9.5      10.7       7.4         2.6
          products, less subsidies                                                                                                             produits, moins les subventions

          Gross domestic product at market                                                                                                   Produit intérieur brut aux prix du
                                                    0.5       4.7      2.3      2.4      4.7         4.5       4.7       3.0         2.0
          prices                                                                                                                                                        marché


          2010 Estimates are projections                                                                                   Les estimations de 2010 sont des projections


      African Statistical Yearbook 2011 / Annuaire Statistique pour l'Afrique 2011
Lesotho                                                                                                                                                    Lesotho

Expenditure on Gross domestic product at constant purchasers'
                                                                                             Emplois du produit intérieur brut aux prix constants d'acquisition
values

Annual Growth Rates (%)                                                                                                        Taux de croissance annuel (%)
                                                                                                                                                 Consommation finale des
Government final consumption               11.7       1.0     -6.1        4.4      2.8         5.7       11.7      11.3       -4.1
                                                                                                                                                 administrations publiques

Private final consumption                   -5.1      0.5      5.4        6.6     -1.4         0.3        3.5       3.1        0.8             Consommation finale privée

Gross fixed capital formation              -13.7     -2.2     -8.5       -7.6     12.2        23.0        5.9      13.9        2.5         Formation brute de capital fixe

Exports of goods and services              35.1      16.8      5.4       -9.6     12.0         3.5       10.3       -5.7       4.5       Exportations de biens et services

                                                                                                                                           Moins importations de biens et
Less imports of goods and services          4.3       2.1      1.9       -0.4      2.5         5.4        7.0       4.5        0.2
                                                                                                                                                                 services


                                                                         III INFLATION

                                          2002      2003     2004      2005      2006       2007       2008      2009       2010
Annual Growth Rates (%)                                                                                                        Taux de croissance annuel (%)
All Item                                   11.0       7.5      5.0        3.5      6.1         8.0       10.7       7.2        3.1                               Ensemble

Food                                       25.1       4.7      4.3        2.6      9.0        14.2       15.9       4.1        3.9                            Alimentation

Health                                      1.3       3.5      3.5        1.8      1.6         -1.3       1.1       3.1        2.2                                   Santé

Energy                                      9.3       9.1      5.5        6.9      9.1         8.1        7.1       7.2        6.5                                  Energie

Transport                                   8.2       7.0      6.4        7.4      4.2         3.5       10.4       6.6        1.2                               Transport


                                               IV AGRICULTURAL PRODUCTION - PRODUCTION AGRICOLE

                                          2002      2003     2004      2005      2006       2007       2008      2009       2010
Tons (Thousand)                                                                                                                                     Tonnes (milliers)
Maize, Tons (thousands)                      85        81       79        77        60          60        57          ...       ...                  Maïs, tonnes (milliers)

Sorghum, Tons (thousands)                    12        11       19        17         8          10          9         ...       ...               Sorgho, tonnes (milliers)

Wheat, Tons (thousands)                      22        16       14         8         4           4          7         ...       ...                   Blé, tonnes (milliers)

Beans, Tons (thousands)                       4         5        2         5         6           3          3         ...       ...              Haricots, tonnes (milliers)

Peas, Tons (thousands)                        3         1        2         1         1           1          1         ...       ...                  Pois, tonnes (milliers)


                                                    V MINING PRODUCTION - PRODUCTION MINIERE
                                                                                                                                                                               207
                                          2002      2003     2004      2005      2006       2007       2008      2009       2010

Diamonds and other precious stones,                                                                                                            Diamants et autres pierres
                                            0.7       1.9     26.6       52.0    112.4           ...       ...        ...       ...
unworked, carat (thousands)                                                                                                              précieuses, bruts, carat (milliers)
                                              ...      ...      ...        ...      ...          ...       ...        ...       ...


                                              ...      ...      ...        ...      ...          ...       ...        ...       ...


                                                                      VI ENERGY - ENERGIE

                                          2002      2003     2004      2005      2006       2007       2008      2009       2010

Electricity - total hydro production,                                                                                                  Électricité - production hydraulique
                                          397.7     408.0    403.9      457.2    481.6       507.3      503.4         ...       ...
kilowatt hours (millions)                                                                                                                 totale, kilowatt-heures (millions)

Electricity - total thermal production,                                                                                                  Électricité - production thermique
                                              ...      ...      ...        ...      ...          ...       ...        ...       ...
kilowatt hours (millions)                                                                                                                 totale, kilowatt-heures (millions)

Electricity - total production, self-                                                                                                 Electricité - Production totale privée
                                              ...      ...      ...        ...      ...          ...       ...        ...       ...
producer (Million Kilowatt Hours)                                                                                                               (million de kilowatt heures)

Electricity - total production, public                                                                                                       Electricité - Production totale
                                            310       330      300       350       200         200         ...        ...       ...
(Million Kilowatt Hours)                                                                                                              publique (million de kilowatt heures)


                                                                                      African Statistical Yearbook 2011 / Annuaire Statistique pour l'Afrique 2011
Lesotho                                                                                                                                                                Lesotho
                                                  VII TOURISM AND INFRASTRUCTURE - TOURISME ET INFRASTUCTURE

                                                   2002       2003        2004       2005        2006        2007       2008        2009        2010

         Arrivals - Tourists (thousands)          287.281     360.955     303.53     303.578     356.913     300.35     293.073     343.743          ...           Arrivées - touristes (milliers)

         Rooms in hotels and similar                                                                                                                     Chambres d'hotels et établissements
         establishments (thousands)                     ...         ...        1       2.261           ...    2.105       2.254       2.429          ...                  assimilés (milliers)

         Paved Road (% of total)                        ...         ...        ...         ...        25          ...         ...        20          ...        Routes asphaltées (% du total)
         Total Network (Railways-km)                    ...         ...        ...         ...     5 020          ...         ...     7 091          ...         Réseau total voies ferrées-Km
         Main Telephone Lines (per 1,000                                                                                                                       Lignes téléphoniques fixes (pour
                                                       29          35         38          39          63         53          48          41          ...
         inhabitants)                                                                                                                                                          1000 habitants)
         Mobile Cellular Subscribers (per                                                                                                                      Abonnés aux téléphones mobiles
                                                       57         101        159         245         276        358         482         593          ...
         1,000 inhabitants)                                                                                                                                             (pour 1000 habitants)


                                   VII FINANCIAL AND MONETARY STATISTICS - FINANCES ET STATISTIQUES MONETAIRES

                                                   2002       2003        2004       2005        2006        2007       2008        2009        2010

         VII-1 Monetary Statistics                                                                                                                    VII-1 Statistiques monétaires
         Loti (Millions)                                                                                                                                                      Loti(Millions)
         Money supply (M1)                          1 441       1 538      1 592       1 832       2 689      2 991       3 877       4 179      4 989                   Masse monétaire (M1)
         Quasi-money                                  727         760        784         761         819      1 091       1 006       1 568      1 589                           Quasi-monnaie
           of which Demand Deposit                      ...         ...        ...         ...         ...        ...         ...         ...        ...              dont Monnaie scripturale
         Net foreign assets                         3 847       3 458      3 980       4 273       6 166      8 480      11 237      10 841     10 104                    Avoirs extérieurs nets
         Domestic credit                              747         340      - 147       - 100       - 577     - 2 071     - 2 466     - 2 136    - 1 001                          Crédit intérieur

         of which claims on private sector          1 022         469        513         774         897      1 184       1 463       1 860      2 194       dont créances sur le secteur privé

         of which Claims on government                                                                                                                              dont créances nettes sur le
                                                    - 318       - 167      - 712       - 910      - 1 499    - 3 324     - 3 973     - 3 996    - 3 198
         sector, net                                                                                                                                                            gouvernement
         International reserves (millions of US                                                                                                            Réserves internationales (millions de
                                                      406         460        502         519         658          ...         ...         ...        ...
         $)                                                                                                                                                                                $ EU)
         Average Exchange Rate (National                                                                                                                    Taux de change (moyen) (monnaie
                                                    10.54        7.56       6.46        6.36        6.77       7.05        8.26        8.47       7.32
         Currency per us $)                                                                                                                                             nationale par dollars)


         VII-2 Public Finance                                                                                                                                  VII-2 Finances publiques
         Loti (Millions)                                                                                                                                                      Loti(Millions)
         Total Revenues and Grants                  2 976       3 331      3 608       4 248       4 661      6 465       7 258       8 889      9 377                 Recettes totales et dons
           Tax Revenue                              2 325       2 576      2 993       3 643       4 061      5 852       6 444       7 759      8 068                         Recettes fiscales
           Non Tax Revenue                            462         459        509         423         429        520         622         841        682                    Recettes non fiscales
208        Grants                                     189         296        106         183         171         92         192         289        627                                     Dons

         Total Expenditures and Net Lending         3 019       3 656      3 519       3 588       4 210      4 988       5 911       7 698     10 068           Dépenses totales et prêts nets

           Current expenditure                      1 794       2 147      2 139       2 287       2 455      2 878       3 151       4 078      5 007                     Dépenses courantes
           Of which Wages and Salaries                992       1 082      1 206       1 364       1 432      1 521       1 820       2 204      2 834           Dont rémunérations et salaires
           Capital expenditure                        626         780        625         522         689        756       1 261       1 970      2 740                 Dépenses d'équipement
           Net Lending                                   0           0         0           0            0         0           0         204         11                                Prêts nets
         Fiscal Balance                              - 43       - 325         88         661         451      1 476       1 347       1 190      - 691          Solde global y compris les dons


         VII-3 Balance of Payments                                                                                                                         VII-3 Balance des paiements
         Loti (Millions)                                                                                                                                                      Loti(Millions)
         Trade balance                             - 4 250     - 3 917    - 3 827     - 4 176     - 4 192    - 5 440     - 6 281     - 7 095    - 8 597                   Balance commerciale
         Services Balance                           - 215       - 262      - 155       - 323       - 239      - 232       - 360       - 320      - 213                     Balance des services
         Net Income                                 1 698       1 874      1 950       1 926       2 574      3 000       4 141       3 560      2 974                             Revenus nets
         Current transfers, net total               1 278       1 284      1 597       1 910       2 634      4 424       4 219       4 589      3 098                      Transferts courants
         Current account balance                   - 1 489     - 1 022     - 436       - 663         778      1 753       1 720         734     - 2 739               Solde du compte courant


         VII-4 External Debt and Financial Flows                                                                                           VII-4 Dette extérieure et flux financiers
         US $ (Millions)                                                                                                                                                    $ E.U (Millions)
         Total external debt                          606         669        716         614         633        673         683         702        724                   Dette extérieure totale
           Private                                       0           0         0           0            0         0           0           0           0                                   Privée
           Public                                     606         669        716         614         633        673         683         702        724                                 Publique
         Total external debt service                   47          50         51          80          41         98          34          33         39            Service de la dette extérieure
         Net Foreign Direct Investment                                                                                                                     Investissements étranger direct (flux
                                                       27          42         53          57          89         97          56          48         39
         Inflows                                                                                                                                                                 nets entrants)
         Net Total Official Development                                                                                                                       Aide publique au développement
                                                       77          79         98          67          71        129         144         123         39
         assistance                                                                                                                                                              (nette totale)


      African Statistical Yearbook 2011 / Annuaire Statistique pour l'Afrique 2011
Lesotho                                                                                                                                                   Lesotho

                                            2002    2003    2004      2005       2006         2007       2008       2009      2010

Loti (Millions)                                                                                                                                                      Loti
Exports, fob                                                                                                                                        Exportations, fàb


Exports - Total                             3 740   3 557    4 533     4 138      4 737        5 664      7 184      6 455        ...                  Exportations - Total


Main Products                                                                                                                                       Principaux produits


Clothing                                    3 339   3 116    3 238     2 708      3 223        3 385      3 521      2 971        ...                          Vêttements


Diamonds                                        4      43      171       417        594        1 125      1 545      1 196        ...                            Diamants


Television Sets                               292     290      194       144        191          406        602       601         ...               Ensembles Televisions


Eletrical Components                            1       2        2         2         90           76        389       315         ...               Composants életriques


Water                                         206     208      210       245        263          296        327       333         ...                                  Eau

Main Destinations                                                                                                                              Principales destinations

United States                               159.0   371.0    663.6        6.8    4 293.6      2 141.3    3 217.0        ...       ...                           Etats-Unis


South Africa                                152.0    93.0    170.4    3 049.4     835.4       1 786.0    2 395.5        ...       ...                      Afrique du Sud


Belgium                                       3.0     5.0     96.4         ...        ...          ...        ...       ...       ...                             Belgique


Canada                                       25.0     8.0       5.5        ...       3.1          0.0      29.2         ...       ...                              Canada


Switzerland                                   0.0     0.0     27.1         ...        ...          ...        ...       ...       ...                               Suisse


                                            2002    2003    2004      2005       2006         2007       2008       2009      2010
Imports, cif                                                                                                                                        Importations, cif

Imports - Total                             7 840   8 000    8 197     8 429      9 430       10 905     12 911     13 618        ...       Importations - Total (millions)   209

                                                                                                                                                    Principaux produits
Main Products


Commodities not specified according
                                               41     112      421         ...        ...          ...        ...       ...       ...     Produits non spécifiés selon type
to kind


Mineral fuels,oils,distillation products,                                                                                                  Combustibles minéraux, huiles;
                                               62      72       89         ...        ...          ...        ...       ...       ...
etc                                                                                                                                       matières bitumineuses; cires etc

                                                                                                                                         Véhicules autres que ferroviaires,
Vehicles other than railway,tramway            29      48       69         ...        ...          ...        ...       ...       ...
                                                                                                                                                                 tramway

                                                                                                                                        Matières plastiques et ouvrages en
Plastics and articles thereof                  42      51       57         ...        ...          ...        ...       ...       ...
                                                                                                                                                               ces matières


Cotton                                         41      47       50         ...        ...          ...        ...       ...       ...                                Coton


Main Origin                                                                                                                                    Principales provenances

South Africa                                616.7   915.5   1 094.4   5 064.7     554.2       6 568.2    6 360.0        ...       ...                      Afrique du Sud

China                                        30.5    29.2     56.0         ...        ...          ...        ...       ...       ...                                Chine

Singapore                                    15.2     6.4       9.3        ...        ...          ...        ...       ...       ...                           Singapour

United States                                13.8     1.8     11.7        1.2      49.5         19.1       64.4         ...       ...                           Etats-Unis

Germany                                       0.8     2.5     21.7        8.7      34.5         45.9          ...       ...       ...                           Allemagne


                                                                                        African Statistical Yearbook 2011 / Annuaire Statistique pour l'Afrique 2011
Liberia                                                                                                                                                                      Libéria

         AREA (KM 2)                                                                                    111 369                                                              SUPERFICIE (KM 2)
         CAPITAL CITY                             Monrovia                                                                                    Monrovia                                   CAPITALE
         CURRENCY                                 Liberian Dollar                                                                        Dollar Liberien                                 MONNAIE


                                 I SOCIAL AND DEMOGRAPHIC INDICATORS — INDICATEURS DEMOGRAPHIQUES ET SOCIAUX

                                                     2002        2003        2004        2005        2006         2007        2008        2009       2010
         Population                                                                                                                                                                   Population
                                                                                                                                                                  Population au milieu de l'année -
         Mid-year population - Total (Million)           3.1         3.1         3.2         3.3         3.5          3.6         3.7         4.0      4.0
                                                                                                                                                                                     Total (million)
                                                                                                                                                                  Population au milieu de l'année -
         Mid-year population - Urban (%)                  ...         ...       57.0        58.0        58.0        59.0         60.0        60.8       ...
                                                                                                                                                                                     Urbaine (%)

         Female (%)                                    50.5         50.4        50.4        50.4        50.4        50.4         50.3        50.3       ...                             Femme (%)


         Population by Age Group                                                                                                                                      Population par groupe d'âge


            0-14                                   1344 648     1375 763    1408 660    1450 759    1503 941    1564 724     1628 813    1689 814       ...                                     0-14


            15-64                                  1621 414     1668 430    1719 187    1782 749    1861 522    1951 472     2047 583    2142 349       ...                                    15-64


            65+                                      90 798       93 661      96 799     100 714     105 556     111 090      116 998     122 814       ...                                     65+


         Active Population (000)                     1 131.0     1 161.0     1 192.0     1 233.0     1 283.0      1 135.0     1 397.0     1 455.0       ...                 Population active (000)

            Female (%)                                 40.0         40.0        40.0        40.1        40.1        37.0         40.2        40.2       ...                             Femme (%)

                                                                                                                                                                 Taux brut de natalité - Total (par
         Crude birth rate - Total (per 1000)           41.4         40.8        40.3        39.8        39.3        38.8         38.3        37.8       ...
                                                                                                                                                                                             1000)
                                                                                                                                                               Taux brut de mortalité - Total (par
         Crude death rate - Total (per 1000)           12.2         11.9        11.5        11.2        11.0        10.7         10.5        10.2       ...
                                                                                                                                                                                            1000)
         Life expectancy at birth - Total                                                                                                                        Espérance de vie à la naissance -
                                                       55.6         56.1        56.6        57.0        57.5        57.9         58.3        58.7       ...
         (years)                                                                                                                                                                   Total (années)
         Net reproduction rate - (per                                                                                                                             Taux net de reproduction - (par
                                                          ...         ...         ...        2.3          ...          ...         ...         ...      ...
         woman)                                                                                                                                                                           femme)
                                                                                                                                                                 Indice synthétique de fécondité -
         Total fertility rate - (p woman)
                       y        (per    )                5.7         5.6         5.5         5.4         5.3          5.2         5.1         5.0       ...
                                                                                                                                                                                     (par femme)

         Education                                                                                                                                                               Enseignement

         Teaching staff at first level - Total                                                                                                                 Personnel enseignant - 1er degré -
                                                          ...         ...         ...         ...         ...          ...         ...         ...      ...
         (thousands)                                                                                                                                                              Total (milliers)
         Teaching staff at second level - Total                                                                                                               Personnel enseignant - 2ème degré -
210                                                       ...         ...         ...         ...         ...          ...         ...         ...      ...
         (thousands)                                                                                                                                                               Total (milliers)
         Teaching staff at third level - Total                                                                                                                Personnel enseignant - 3ème degré -
                                                          ...         ...         ...         ...         ...          ...         ...         ...      ...
         (thousands)                                                                                                                                                               Total (milliers)
         First level student enrollment - Total                                                                                                                  Elèves inscrits - 1er degré - Total
                                                          ...         ...         ...         ...         ...          ...         ...         ...      ...
         (thousands)                                                                                                                                                                       (milliers)
         First level student enrollment -                                                                                                                     Elèves inscrits - 1er degré - Femmes
                                                          ...         ...         ...         ...       254            ...       253           ...      ...
         Female (thousands)                                                                                                                                                                 (milliers)
         Second level student enrollment -                                                                                                                     Elèves inscrits - 2ème degré - Total
                                                          ...         ...         ...         ...       131            ...       158           ...      ...
         Total (thousands)                                                                                                                                                                (milliers)
         Second level student enrollment -                                                                                                                           Elèves inscrits - 2ème degré -
                                                          ...         ...         ...         ...        55            ...        68           ...      ...
         Female (thousands)                                                                                                                                                      Femmes (milliers)
         Third level student enrollment - Total                                                                                                                Elèves inscrits - 3ème degré - Total
                                                          ...         ...         ...         ...         ...          ...         ...         ...      ...
         (thousands)                                                                                                                                                                      (milliers)
         Third level student enrollment -                                                                                                                            Elèves inscrits - 3ème degré -
                                                          ...         ...         ...         ...         ...          ...         ...         ...      ...
         Female (thousands)                                                                                                                                                      Femmes (milliers)
         Public expenditure on education (%                                                                                                                      Dépenses publiques consacrées à
                                                          ...         ...         ...         ...         ...          ...         ...         ...      ...
         of budget)                                                                                                                                                l'enseignement (% du budget)

         Health                                                                                                                                                                              Santé

         Hospital beds - Total (per 10 000                                                                                                                       Nombre de lits d'hôpitaux - Total
                                                          ...         ...        18           ...         ...          ...         ...         ...      ...
         population)                                                                                                                                                                (pour 10 000)
         Nurses - Total (per 10 000                                                                                                                             Nombre d'infirmières - Total (pour
                                                          ...         ...         ...         ...         ...          ...         ...         ...      ...
         population)                                                                                                                                                                      10 000)
         Physicians - Total (per 10 000                                                                                                                         Nombre de médecins - Total (pour
                                                          ...         ...          3          ...         ...          ...         ...         ...      ...
         population)                                                                                                                                                                    10 000)
         Public expenditure on Health (% of                                                                                                                   Dépenses publiques consacrées à la
                                                           4          5          10          15          10            ...         ...         ...      ...
         budget)                                                                                                                                                           santé (% du budget)


      African Statistical Yearbook 2011 / Annuaire Statistique pour l'Afrique 2011
Liberia                                                                                                                                                   Libéria
                                                  II NATIONAL ACCOUNTS — COMPTES NATIONAUX

                                        2002      2003      2004     2005     2006        2007       2008      2009       2010

Gross domestic product by kind of economic activity at current prices
                                                                                Produit intérieur brut par branche d'activité économique aux prix courants


Liberian Dollar (Millions)                                                                                                              Dollar Liberien(Millions)

Agriculture                               364       281       298      316      448          363       519        546         ...                            Agriculture

Mining and quarrying                        2         2         4        5        5            7        10         10         ...                 Industries extractives

Manufacturing                              27        15        26       32       44           49        59         62         ...            Industries manufacturières

Electricity, gas & water                    ...       ...      ...      ...       ...          ...       ...       ...        ...                 Electricité, gaz et eau

Construction                               11         8        17       19       20           21        35         37         ...          Bâtiments et travaux publics
Wholesale & retail trade,                                                                                                               Commerce de gros et de détail,
                                           54        42        61       67       77           89        67         70         ...
restaurants, hotels                                                                                                                              restaurants et hôtels
                                                                                                                                         Banques, assurances, affaires
Finance, insurance, real estate, etc.       ...       ...      ...      ...       ...          ...       ...       ...        ...
                                                                                                                                                         immobilières
Transport and communications               30        28        33       39       41           43        50         52         ...      Transport(s) et communications
                                                                                                                                           Administrations publiques et
Public administration and defense          15        11        15       17       18           61        91         80         ...
                                                                                                                                                               défense
Other services                              ...       ...      ...      ...       ...          ...       ...       ...        ...                        Autres services
                                                                                                                                        Moins Services d’intermédiation
Less Imputed Service Charges                ...       ...      ...      ...       ...          ...       ...       ...        ...
                                                                                                                                                              financière
Gross domestic product at factor                                                                                                    Produit intérieur brut aux couts des
                                          503       387       454      495      653          632       830        857         ...
cost / basic prices                                                                                                                               facteurs / prix de base

Plus: Indirect Taxes / taxes on                                                                                                     Plus taxes indirectes/impôts sur les
                                            ...       ...      ...      ...       ...          ...       ...       ...        ...
products, less subsidies                                                                                                                produits, moins les subventions


Expenditure on Gross domestic product at current purchaser's values
                                                                                             Emploi du produit intérieur brut aux prix courants d'acquisition

Liberian Dollar (Millions)                                                                                                              Dollar Liberien(Millions)
                                                                                                                                              Consommation finale des
Government final consumption               71        34        49       57       77           95       160        129         ...
                                                                                                                                              administrations publiques

Private final consumption                 466       383       421      442      826        1 488      1 678     1 579         ...           Consommation finale privée

Gross fixed capital formation              25        38        62       84      134          131       166        171         ...        Formation brute de capital fixe

Increase in inventories                     ...       ...      ...      ...       ...          ...       ...       ...        ...                   Variation des stocks

Exports of goods and services             103       131       174      194      192          185       258        251         ...     Exportations de biens et services
                                                                                                                                                                            211
                                                                                                                                         Moins importations de biens et
Less imports of goods and services        145       181       239      265      559        1 246      1 432     1 274         ...
                                                                                                                                                               services
GDP at purchasers' values                 519       404       467      511      671          653       830        856         ...             PIB aux prix d'acquisition


Gross domestic product by kind of economic activity at constant
                                                                               Produit intérieur brut par branche d'activité economique aux prix constants
prices
Annual Growth Rates (%)                                                                                                      Taux de croissance annuel (%)
Agriculture                               0.8      -31.8     -5.8      2.0     16.3          -8.8      20.5       6.6         ...                            Agriculture

Mining and quarrying                     -22.5     -11.7     74.9     20.3     -17.5        45.4       26.6       6.5         ...                 Industries extractives

Manufacturing                            17.5      -51.0     53.9     18.4     12.8         25.0        1.7       6.5         ...            Industries manufacturières

Electricity, gas & water                    ...       ...      ...      ...       ...          ...       ...       ...        ...                 Electricité, gaz et eau

Construction                             33.0      -35.8     88.7      7.5     -13.6        18.1       40.5       6.9         ...          Bâtiments et travaux publics
Wholesale & retail trade,                                                                                                                      Commerce de gros et de
                                         13.0      -31.3     29.0      5.7      -5.7        30.0      -36.5       6.5         ...
restaurants, hotels                                                                                                                          détail,restaurants et hôtels
                                                                                                                                          Banques, assurances, affaires
Finance, insurance, real estate, etc.       ...       ...      ...      ...       ...          ...       ...       ...        ...
                                                                                                                                                          immobilières
Transport and communications             16.6      -17.6      4.6     13.7     -13.8        18.0       -2.2       6.5         ...      Transport(s) et communications
                                                                                                                                           Administrations publiques et
Public administartion and defense         -9.8     -35.5     15.5     10.6     -11.6       205.0       35.9       6.7         ...
                                                                                                                                                               défense
Other services                              ...       ...      ...      ...       ...          ...       ...       ...        ...                        Autres services
                                                                                                                                        Moins Services d’intérmediation
Less Imputed Service Charges                ...       ...      ...      ...       ...          ...       ...       ...        ...
                                                                                                                                                              financière
Gross domestic product at factor                                                                                                    Produit intérieur brut aux couts des
                                          3.7      -32.1      4.0      4.9      8.3          6.9       11.2       6.6         ...
cost / basic prices                                                                                                                               facteurs / prix de base

Plus: Indirect Taxes / taxes on                                                                                                     Plus taxes indirectes/impôts sur les
                                            ...       ...      ...      ...       ...          ...       ...       ...        ...
products, less subsidies                                                                                                                produits, moins les subventions

Gross domestic product at market                                                                                                      Produit intérieur brut aux prix du
                                          3.7      -31.3      2.6      5.3      7.8          9.4        7.1       4.6         ...
prices                                                                                                                                                           marché


                                                                                    African Statistical Yearbook 2011 / Annuaire Statistique pour l'Afrique 2011
Liberia                                                                                                                                                     Libéria

         Expenditure on Gross domestic product at constant purchasers'
                                                                                                     Emplois du produit intérieur brut aux prix constants d'acquisition
         values

         Annual Growth Rates (%)                                                                                                       Taux de croissance annuel (%)
                                                                                                                                                         Consommation finale des
         Government final consumption                -1.2     -57.4     25.7       12.7     11.6      38.2       41.6      -17.9        ...
                                                                                                                                                         administrations publiques

         Private final consumption                   4.4      -27.5     -2.2        0.8     53.5     102.7       -5.0       -4.6        ...            Consommation finale privée

         Gross fixed capital formation               -0.7     35.9      44.3       31.2     31.1       9.4        7.1       4.6         ...        Formation brute de capital fixe

         Exports of goods and services              -11.2     11.9      18.2        7.0     -18.6      8.2       17.7       -1.3        ...      Exportations de biens et services

                                                                                                                                                   Moins importations de biens et
         Less imports of goods and services          -8.2     10.4      16.8        6.8     72.8     150.9       -3.1       -9.8        ...
                                                                                                                                                                         services


                                                                                   III INFLATION

                                                   2002      2003      2004      2005      2006      2007     2008       2009       2010
         Annual Growth Rates (%)                                                                                                       Taux de croissance annuel (%)
         All Item                                   14.2      10.3       3.6        6.9      7.2      11.4       17.5       7.8        7.7                               Ensemble

         Food                                          ...       ...      ...        ...       ...      ...        ...        ...       ...                           Alimentation

         Health                                        ...       ...      ...        ...       ...      ...        ...        ...       ...                                  Santé

         Energy                                        ...       ...      ...        ...       ...      ...        ...        ...       ...                                 Energie

         Transport                                     ...       ...      ...        ...       ...      ...        ...        ...       ...                              Transport


                                                        IV AGRICULTURAL PRODUCTION - PRODUCTION AGRICOLE

                                                   2002      2003      2004      2005      2006      2007     2008       2009       2010
         Tons (Thousand)                                                                                                                                    Tonnes (milliers)
         Cassava, Tons (tousands)                    480       490       490       490       635       550         ...        ...       ...               Manioc, tonnes (milliers)

         Rice, Tons (thousands)                      110       100       110       155       107       155         ...        ...       ...                   Riz, tonnes (milliers)

         Banana, Tons (thousands)                    110       110       110       110       116       120         ...        ...       ...              Bananes, tonnes (milliers)

         Plantains, Tons (thousands)                  40        42        42        42        42        43         ...        ...       ...             Plantains, tonnes (milliers)

         Taro, Tons (thousands)                       26        26        26        26        26        25         ...        ...       ...                Taros, tonnes (milliers)


                                                             V MINING PRODUCTION - PRODUCTION MINIERE
212
                                                   2002      2003      2004      2005      2006      2007     2008       2009       2010

         Gold ores and concentrates                                                                                                                    Minerais d'or et concentrés
                                                    42.0      20.0     110.0       16.0     20.0        ...        ...        ...       ...
         (Kilograms)                                                                                                                                                (Kilogrammes)
         Diamonds and other precious stones,        48.0      36.0      30.0       30.0     30.0      13.0         ...        ...       ...            Diamants et autres pierres
         unworked carat (thousands)                                                                                                              précieuses bruts carat (milliers)
         Diamonds, industrial, carat
                                                    32.0      24.0      12.0        4.0      4.0       9.0         ...        ...       ... Diamants industriels, carat (milliers)
         (thousands)


                                                                                VI ENERGY - ENERGIE

                                                   2002      2003      2004      2005      2006      2007     2008       2009       2010

         Electricity - total hydro production,                                                                                                 Électricité - production hydraulique
                                                       ...       ...      ...        ...       ...      ...        ...        ...       ...
         kilowatt hours (millions)                                                                                                                totale, kilowatt-heures (millions)

         Electricity - total thermal production,                                                                                                 Électricité - production thermique
                                                   320.0     320.0     330.0      338.0    351.0     353.0         ...        ...       ...
         kilowatt hours (millions)                                                                                                                totale, kilowatt-heures (millions)

         Electricity - total production, self-                                                                                                Electricité - Production totale privée
                                                       ...       ...      ...        ...       ...      ...        ...        ...       ...
         producer (Million Kilowatt Hours)                                                                                                              (million de kilowatt heures)

         Electricity - total production, public                                                                                                      Electricité - Production totale
                                                     320       320       330       338       351       353         ...        ...       ...
         (Million Kilowatt Hours)                                                                                                             publique (million de kilowatt heures)


      African Statistical Yearbook 2011 / Annuaire Statistique pour l'Afrique 2011
Liberia                                                                                                                                                                        Libéria
                                         VII TOURISM AND INFRASTRUCTURE - TOURISME ET INFRASTUCTURE

                                          2002        2003         2004         2005         2006          2007       2008        2009        2010

Arrivals - Tourists (thousands)             5.192       6.045        8.104        8.608        9.083            ...         ...         ...       ...           Arrivées - touristes (milliers)

Rooms in hotels and similar                                                                                                                           Chambres d'hotels et établissements
establishments (thousands)               0.132109     0.13651     0.148039     0.170776     0.177613            ...         ...         ...       ...                  assimilés (milliers)

Paved Road (% of total)                         ...         ...          ...          ...          ...          ...         ...         ...       ...        Routes asphaltées (% du total)
Total Network (Railways-km)                     ...         ...          ...          ...          ...          ...         ...         ...       ...         Réseau total voies ferrées-Km
Main Telephone Lines (per 1,000                                                                                                                             Lignes téléphoniques fixes (pour
                                                 2          0            2            2            2             1           1          ...       ...
inhabitants)                                                                                                                                                                1000 habitants)
Mobile Cellular Subscribers (per                                                                                                                            Abonnés aux téléphones mobiles
                                                 1         15           29           48           81          112         140           ...       ...
1,000 inhabitants)                                                                                                                                                   (pour 1000 habitants)


                          VII FINANCIAL AND MONETARY STATISTICS - FINANCES ET STATISTIQUES MONETAIRES

                                          2002        2003         2004         2005         2006          2007       2008        2009        2010

VII-1 Monetary Statistics                                                                                                                          VII-1 Statistiques monétaires
Liberian Dollar (Millions)                                                                                                                                   Dollar Liberien(Millions)
Money supply (M1)                           2 364       2 756        3 728        4 872        6 635        9 100      13 244      19 114     21 648                  Masse monétaire (M1)
Quasi-money                                   619         510        1 030        1 507        1 947        3 118       4 183       5 884      7 366                          Quasi-monnaie
  of which Demand Deposit                       ...         ...          ...          ...          ...          ...         ...         ...       ...              dont Monnaie scripturale
Net foreign assets                        - 46 083    - 39 102     - 43 504     - 41 171     - 43 519     - 45 252    - 41 400    - 44 804    20 521                   Avoirs extérieurs nets
Domestic credit                            61 656      52 071       59 369       59 153       65 100       72 323      76 953      89 441     30 289                          Crédit intérieur

of which claims on private sector           1 176       1 136        1 651        2 064        3 080        4 503       6 646       9 626     12 718      dont créances sur le secteur privé

of which Claims on government                                                                                                                                    dont créances nettes sur le
                                           60 289      50 790       57 425       56 896       61 784       67 607      70 242      78 551     16 735
sector, net                                                                                                                                                                  gouvernement
International reserves (millions of US                                                                                                                  Réserves internationales (millions de
                                                3           7           19           25           72          119         161         372        419
$)                                                                                                                                                                                      $ EU)
Average Exchange Rate (National                                                                                                                          Taux de change (moyen) (monnaie
                                            61.75       59.38        54.91        57.10        58.01        61.27       63.21       68.29      71.53
Currency per us $)                                                                                                                                                   nationale par dollars)


VII-2 Public Finance                                                                                                                                        VII-2 Finances publiques
Liberian Dollar (Millions)                                                                                                                                   Dollar Liberien(Millions)
Total Revenues and Grants                   4 490       2 820        3 794        4 591        4 966        9 099      13 071      16 041     21 052                Recettes totales et dons
  Tax Revenue                               4 341       2 547        3 514        4 328        4 699        8 572      10 663      12 974     14 865                        Recettes fiscales
  Non Tax Revenue                             148          95          225          206          209          435       2 023       1 455      5 258                   Recettes non fiscales
  Grants                                        0         178           55           57           58           92         386       1 612        930                                    Dons      213
Total Expenditures and Net Lending          4 947       2 660        3 893        4 356        4 258        7 530      12 465      16 997     20 187          Dépenses totales et prêts nets

  Current expenditure                       1 192       1 063        2 905        3 329        3 162        5 312       8 166      11 383     13 634                    Dépenses courantes
  Of which Wages and Salaries                 828         659        1 493        2 415        1 885        2 488       4 298       6 241      8 148          Dont rémunérations et salaires
  Capital expenditure                       3 341       1 211          538          605          365        1 017       1 511       2 308      2 268                Dépenses d'équipement
  Net Lending                                   0           0            0            0            0             0           0           0         0                               Prêts nets
Fiscal Balance                              - 457         160         - 99          234          708        1 569         607       - 956        866         Solde global y compris les dons


VII-3 Balance of Payments                                                                                                                               VII-3 Balance des paiements
Liberian Dollar (Millions)                                                                                                                                   Dollar Liberien(Millions)
Trade balance                                  21        - 31        - 132        - 183        - 243        - 291       - 370       - 383         ...                  Balance commerciale
Services Balance                                3        - 17         - 49         - 65         - 91         - 89       - 100        - 82         ...                   Balance des services
Net Income                                  - 107        - 78         - 87        - 113        - 168        - 154       - 156       - 167         ...                           Revenus nets
Current transfers, net total                   63          47          243          311          274          288         296         308         ...                    Transferts courants
Current account balance                      - 19        - 79         - 26         - 50        - 228        - 246       - 329       - 324         ...              Solde du compte courant


VII-4 External Debt and Financial Flows                                                                                                  VII-4 Dette extérieure et flux financiers
US $ (Millions)                                                                                                                                                          $ E.U (Millions)
Total external debt                         4 332       4 432        4 532        4 632        4 732        3 160       1 970       1 660        150                  Dette extérieure totale
  Private                                       0           0            0            0            0             0           0           0         0                                   Privée
  Public                                    4 332       4 432        4 532        4 632        4 732        3 160       1 970       1 660        150                                Publique
Total external debt service                   166         167          170          160          147          148       1 301       1 648        781           Service de la dette extérieure
Net Foreign Direct Investment                                                                                                                           Investissements étranger direct (flux
                                                3         372           75           83          108          132         200         378         ...
Inflows                                                                                                                                                                       nets entrants)
Net Total Official Development                                                                                                                             Aide publique au développement
                                               55         107          213          222          260          701       1 249         505         ...
assistance                                                                                                                                                                    (nette totale)


                                                                                                     African Statistical Yearbook 2011 / Annuaire Statistique pour l'Afrique 2011
Liberia                                                                                                                                                       Libéria

                                                  2002       2003      2004       2005       2006       2007      2008       2009       2010

         US $ (Millions)                                                                                                                                          Dollar Liberien
         Exports, fob                                                                                                                                         Exportations, fàb


         Exports - Total                             166        109       104        110        158        208       254        160        ...                   Exportations - Total


         Main Products                                                                                                                                        Principaux produits


         Rubber                                        0         44        83        131        153        191       258          ...      ...                           Caoutchouc


         Coffee                                      285        521       463        594          0          0       254          ...      ...                                   Café


         Iron Ore                                     49          0         5          1          1          1       143          ...      ...                         Minerai de fer


         Scrap Metal                                 138          1         1          1          2        471       125          ...      ...                               Mitraille


         Cocoa Beans                                  14          1         2          0          0          1        80          ...      ...                        Cacao en fèves

         Main Destinations                                                                                                                               Principales destinations

         Germany                                   161.4      446.6     189.4      362.8      605.9      129.0      84.3      385.4        ...                             Allemagne


         Bangladesh                               1 062.1        6.4       7.2        0.3        0.0        0.0        ...        ...      ...                            Bangladesh


         Poland                                     80.1      112.7     143.3       99.2      198.3      205.5     134.6      348.0        ...                               Pologne


         United States                              47.6       62.0      89.3       97.1      144.4      118.4     147.6       84.7        ...                             États-Unis


         Belgium                                      0.9        1.9     68.3      453.0       25.6       20.6      60.5       11.9        ...                               Belgique


                                                  2002       2003      2004       2005       2006       2007      2008       2009       2010
         Imports, cif                                                                                                                                          Importations, cif

214      Imports - Total                           5 033      4 285     4 913      5 716      7 579      8 811    11 668     12 893        ...        Importations - Total (millions)


                                                                                                                                                              Principaux produits
         Main Products


         Tankers                                   1 739      1 661     1 891      1 847      1 777      2 825     3 593      4 561        ...                               Tankers


                                                                                                                                                Cargo navires nda & autres navires
         Cargo vessels nes&oth vessels for
                                                   1 292      1 250     1 410      2 031      3 341      2 463     2 866      4 153        ... pour le transport de deux personnes
         the transport of both persons&goods
                                                                                                                                                                           et biens
         Floating or submersible drilling or                                                                                                         Flottantes ou submersibles de
                                                       ...      303         ...        ...        ...      310     1 138          ...      ... forage ou de production des plates-
         production platforms
                                                                                                                                                                              formes
         Petroleum oils&oils obtained from                                                                                                          Huiles de pétrole, bitumineux,
         bituminous minerals,o/than crude             27         39        81        135        185        177       444        395        ...
                                                                                                                                                                 distilles, sauf brut
         etc
                                                                                                                                                 Structures et pièces de structures, i
         Structures&parts of structures,i/s (ex
                                                      15          4        13          3         12         13       152        216        ...       / s (ex Prefab BLDGS de headg
         prefab bldgs of headg no.9406)
                                                                                                                                                                            no.9406)

         Main Origin                                                                                                                                     Principales provenances

         Korea, Rep.                              1 426.6    1 525.7   1 708.1    1 987.1    3 206.9    2 511.0   2 801.5    4 884.6       ...                           Corée, Rép.

         Singapore                                 371.4      481.9     538.8      743.5      976.8     1 768.1   2 627.7    1 643.0       ...                             Singapour

         Japan                                     897.7      633.2     925.3     1 087.8     871.6     1 190.1   1 223.0    1 486.5       ...                                 Japon

         China                                      30.1       26.2     181.8      149.6      529.8      803.1    1 137.1    1 881.5       ...                                  Chine

         Germany                                   261.0      385.2     186.8      101.7      107.8      269.3     270.6      100.2        ...                             Allemagne


      African Statistical Yearbook 2011 / Annuaire Statistique pour l'Afrique 2011
Libyan Arab Jamahiriya                                                                                                               Jamahiriya Arabe Libyenne

AREA (KM 2)                                                                                  1 759 540                                                                SUPERFICIE (KM 2)
CAPITAL CITY                             Tripoli                                                                                       Tripoli                                    CAPITALE
CURRENCY                                 Libyan Dinar                                                                            Dinar Libyen                                     MONNAIE


                        I SOCIAL AND DEMOGRAPHIC INDICATORS — INDICATEURS DEMOGRAPHIQUES ET SOCIAUX

                                            2002       2003        2004        2005        2006         2007        2008        2009        2010
Population                                                                                                                                                                     Population
                                                                                                                                                           Population au milieu de l'année -
Mid-year population - Total (Million)          5.6         5.7         5.8         5.9         6.0          6.2         6.3         6.4         6.5
                                                                                                                                                                              Total (million)
                                                                                                                                                           Population au milieu de l'année -
Mid-year population - Urban (%)               76.6        76.7        76.9        77.0        77.2        77.3         77.5        77.7        77.9
                                                                                                                                                                              Urbaine (%)

Female (%)                                    48.0        48.0        48.1        48.1        48.2        48.2         48.3        48.3        48.3                              Femme (%)


Population by Age Group                                                                                                                                        Population par groupe d'âge


   0-14                                   1728 245    1745 692    1769 086    1796 434    1827 302    1861 568     1897 799    1934 319    1969 702                                      0-14


   15-64                                  3644 958    3733 945    3818 908    3901 467    3981 777    4059 730     4136 419    4213 164    4290 969                                     15-64


   65+                                     196 169     205 173     214 706     224 931     235 954     247 699      259 963     272 442     284 948                                      65+


Active Population (000)                    1 965.8     2 043.8     2 103.4     2 156.9     2 209.1      2 254.1     2 295.3     2 369.5     2 418.5                  Population active (000)

   Female (%)                                 21.9        22.2        22.3        22.3        22.2        22.1         21.9        22.5        22.5                              Femme (%)

                                                                                                                                                          Taux brut de natalité - Total (par
Crude birth rate - Total (per 1000)           22.2        22.1        23.5        23.3        23.3        23.7         23.3        23.0          ...
                                                                                                                                                                                      1000)
                                                                                                                                                        Taux brut de mortalité - Total (par
Crude death rate - Total (per 1000)            3.8         4.1         3.1         3.2         3.4          3.7         3.4         4.1          ...
                                                                                                                                                                                     1000)
Life expectancy at birth - Total                                                                                                                          Espérance de vie à la naissance -
                                              70.0        70.0        71.0        71.0        72.0        72.0         72.0        72.0          ...
(years)                                                                                                                                                                     Total (années)
Net reproduction rate - (per                                                                                                                               Taux net de reproduction - (par
                                                ...         ...         ...        1.3          ...          ...         ...         ...         ...
woman)                                                                                                                                                                             femme)
                                                                                                                                                          Indice synthétique de fécondité -
Total fertility rate - (p woman)
              y        (per    )               3.1         3.0         2.9         2.9         2.8          2.7         2.7         2.6          ...
                                                                                                                                                                              (par femme)

Education                                                                                                                                                                 Enseignement

Teaching staff at first level - Total                                                                                                                   Personnel enseignant - 1er degré -
                                                ...         ...         ...      231.0       255.0       186.0        184.0          ...         ...
(thousands)                                                                                                                                                                Total (milliers)
Teaching staff at second level - Total                                                                                                                 Personnel enseignant - 2ème degré -
                                                ...         ...         ...       69.0        76.0        56.0         55.0          ...         ...                                              215
(thousands)                                                                                                                                                                 Total (milliers)
Teaching staff at third level - Total                                                                                                                Personnel enseignant - 3ème degré -
                                                ...         ...         ...        6.0         8.0          9.0        10.0          ...         ...
(thousands)                                                                                                                                                               Total (milliers)
First level student enrollment - Total                                                                                                                    Elèves inscrits - 1er degré - Total
                                                ...         ...         ...         ...         ...      1 047        1 031          ...         ...
(thousands)                                                                                                                                                                         (milliers)
First level student enrollment -                                                                                                                       Elèves inscrits - 1er degré - Femmes
                                              366         355         358         346         360          513         510           ...         ...
Female (thousands)                                                                                                                                                                   (milliers)
Second level student enrollment -                                                                                                                       Elèves inscrits - 2ème degré - Total
                                              825         798           ...       702         733            ...       207           ...         ...
Total (thousands)                                                                                                                                                                  (milliers)
Second level student enrollment -                                                                                                                             Elèves inscrits - 2ème degré -
                                              417         403           ...       374         388            ...       113           ...         ...
Female (thousands)                                                                                                                                                        Femmes (milliers)
Third level student enrollment - Total                                                                                                                  Elèves inscrits - 3ème degré - Total
                                             359.1       375.0          ...         ...         ...          ...         ...         ...         ...
(thousands)                                                                                                                                                                        (milliers)
Third level student enrollment -                                                                                                                              Elèves inscrits - 3ème degré -
                                             184.6       192.7          ...         ...         ...          ...         ...         ...         ...
Female (thousands)                                                                                                                                                        Femmes (milliers)
Public expenditure on education (%                                                                                                                        Dépenses publiques consacrées à
                                                ...         ...         ...         ...         ...          ...         ...         ...         ...
of budget)                                                                                                                                                  l'enseignement (% du budget)

Health                                                                                                                                                                                Santé

Hospital beds - Total (per 10 000                                                                                                                         Nombre de lits d'hôpitaux - Total
                                                ...         ...         ...         ...         ...          ...         ...         ...         ...
population)                                                                                                                                                                  (pour 10 000)
Nurses - Total (per 10 000                                                                                                                               Nombre d'infirmières - Total (pour
                                               37          37          37          37          37           37          38          38           ...
population)                                                                                                                                                                        10 000)
Physicians - Total (per 10 000                                                                                                                           Nombre de médecins - Total (pour
                                               46          60          59          62          61           60          69          68           ...
population)                                                                                                                                                                      10 000)
Public expenditure on Health (% of                                                                                                                     Dépenses publiques consacrées à la
                                               15            9           5          5           5            ...         ...         ...         ...
budget)                                                                                                                                                             santé (% du budget)


                                                                                                  African Statistical Yearbook 2011 / Annuaire Statistique pour l'Afrique 2011
Libyan Arab Jamahiriya                                                                                               Jamahiriya Arabe Libyenne
                                                            II NATIONAL ACCOUNTS — COMPTES NATIONAUX

                                                  2002      2003      2004      2005      2006       2007       2008       2009      2010

          Gross domestic product by kind of economic activity at current prices
                                                                                             Produit intérieur brut par branche d'activité économique aux prix courants


          Libyan Dinar (Millions)                                                                                                                     Dinar Libyen(Millions)

          Agriculture                              1 295     1 333     1 329     1 448     1 643       1 905      2 248     2 383        ...                            Agriculture

          Mining and quarrying                    14 384    20 218    29 278    44 122    53 953      62 397     81 277    47 231        ...                 Industries extractives

          Manufacturing                            1 479     1 992     2 452     3 125     3 603       4 032      4 889     5 448        ...            Industries manufacturières

          Electricity, gas & water                  662       755       734       877       973        1 019      1 205     1 335        ...                 Electricité, gaz et eau

          Construction                             1 935     1 787     2 159     2 684     3 129       4 198      5 995     7 578        ...          Bâtiments et travaux publics
          Wholesale & retail trade,                                                                                                                Commerce de gros et de détail,
                                                   1 771     1 876     2 195     2 658     2 863       3 396      3 950     4 298        ...
          restaurants, hotels                                                                                                                               restaurants et hôtels
                                                                                                                                                    Banques, assurances, affaires
          Finance, insurance, real estate, etc.    4 443     4 456     4 625     5 041     5 460       6 200      6 805     7 337        ...
                                                                                                                                                                    immobilières
          Transport and communications             1 550     1 812     1 944     2 413     2 724       3 300      3 884     4 126        ...      Transport(s) et communications
                                                                                                                                                      Administrations publiques et
          Public administration and defense        2 905     3 279     3 659     4 482     4 935       6 507      6 671     6 871        ...
                                                                                                                                                                          défense
          Other services                            218       218       226       241       279         322        360       390         ...                        Autres services
                                                                                                                                                   Moins Services d’intermédiation
          Less Imputed Service Charges            - 311     - 364     - 441     - 470     - 533       - 364       - 643    - 706         ...
                                                                                                                                                                         financière
          Gross domestic product at factor                                                                                                     Produit intérieur brut aux couts des
                                                  30 331    37 361    48 159    66 619    79 030      92 913    116 640    86 289        ...
          cost / basic prices                                                                                                                                facteurs / prix de base

          Plus: Indirect Taxes / taxes on                                                                                                      Plus taxes indirectes/impôts sur les
                                                      ...       ...       ...       ...       ...         ...        ...       ...       ...
          products, less subsidies                                                                                                                 produits, moins les subventions


          Expenditure on Gross domestic product at current purchaser's values
                                                                                                        Emploi du produit intérieur brut aux prix courants d'acquisition

          Libyan Dinar (Millions)                                                                                                                     Dinar Libyen(Millions)
                                                                                                                                                         Consommation finale des
          Government final consumption             4 633     4 964     5 375     7 125     9 402       9 851     12 421     9 311        ...
                                                                                                                                                         administrations publiques

          Private final consumption               15 868    15 032    16 409    19 264    27 607      28 571     35 400    26 965        ...           Consommation finale privée

          Gross fixed capital formation            3 846     3 561     4 176     5 102     6 918       7 320      9 092     6 862        ...        Formation brute de capital fixe

          Increase in inventories                   161       148       175       215       289         307        381       287         ...                   Variation des stocks

          Exports of goods and services           13 444    20 065    29 247    43 109    47 981      54 368     68 875    50 139        ...     Exportations de biens et services
216                                                                                                                                                 Moins importations de biens et
          Less imports of goods and services      10 109     9 848    11 936    15 346    19 850      21 290     26 601    19 903        ...
                                                                                                                                                                          services
          GDP at purchasers' values               27 844    33 922    43 446    59 468    72 347      79 127     99 569    73 660        ...             PIB aux prix d'acquisition


          Gross domestic product by kind of economic activity at constant
                                                                                            Produit intérieur brut par branche d'activité economique aux prix constants
          prices
          Annual Growth Rates (%)                                                                                                       Taux de croissance annuel (%)
          Agriculture                                3.7       3.5       4.7       7.6       9.8         4.0        2.4       2.5        ...                            Agriculture

          Mining and quarrying                      -5.9      19.4       6.0       9.4       3.9         1.0       -0.4      -7.6        ...                 Industries extractives

          Manufacturing                              4.9      14.9       6.3       6.4       4.7         7.6       -1.7       3.5        ...            Industries manufacturières

          Electricity, gas & water                  -5.9      19.4       4.3      17.4       8.4        13.9       10.0       7.0        ...                 Electricité, gaz et eau

          Construction                              17.3     -12.0       9.1      17.5       7.6        20.9       12.0       9.0        ...          Bâtiments et travaux publics
          Wholesale & retail trade,                                                                                                                       Commerce de gros et de
                                                    21.7       5.8       8.1      21.3       8.4        11.0        8.1       6.5        ...
          restaurants, hotels                                                                                                                           détail,restaurants et hôtels
                                                                                                                                                     Banques, assurances, affaires
          Finance, insurance, real estate, etc.     21.7       5.8       3.5       4.7       4.7         8.9        7.8       7.3        ...
                                                                                                                                                                     immobilières
          Transport and communications              19.6       7.5      10.0      24.2      12.6        12.3        9.0       7.0        ...      Transport(s) et communications
                                                                                                                                                      Administrations publiques et
          Public administartion and defense          0.7       6.9       6.8      13.6       7.8         2.0        0.1       2.0        ...
                                                                                                                                                                          défense
          Other services                             0.7       6.9       3.7       3.1       7.1         7.0        4.8       6.4        ...                        Autres services
                                                                                                                                                   Moins Services d’intérmediation
          Less Imputed Service Charges              21.7     -15.4      -0.3     -15.2      -1.1         8.0        5.0       8.0        ...
                                                                                                                                                                         financière
          Gross domestic product at factor                                                                                                     Produit intérieur brut aux couts des
                                                     1.9      12.8       6.2      11.1       5.7         5.0        2.7      -0.8        ...
          cost / basic prices                                                                                                                                facteurs / prix de base

          Plus: Indirect Taxes / taxes on                                                                                                      Plus taxes indirectes/impôts sur les
                                                      ...       ...       ...       ...       ...         ...        ...       ...
          products, less subsidies                                                                                                                 produits, moins les subventions

          Gross domestic product at market                                                                                                       Produit intérieur brut aux prix du
                                                    -1.3      13.0       4.4      10.3       6.7         5.1        2.7      -0.7        ...
          prices                                                                                                                                                            marché


          Break in the serie from 2003                                                                                                    Rupture de la série à partir 2003


      African Statistical Yearbook 2011 / Annuaire Statistique pour l'Afrique 2011
Libyan Arab Jamahiriya                                                                                                                 Jamahiriya Arabe Libyenne

Expenditure on Gross domestic product at constant purchasers'
                                                                                                              Emplois du produit intérieur brut aux prix constants d'acquisition
values

Annual Growth Rates (%)                                                                                                                         Taux de croissance annuel (%)
                                                                                                                                                                  Consommation finale des
Government final consumption                  -24.4          7.0          5.0          2.9         11.6          4.4         1.7      0.2        ...
                                                                                                                                                                  administrations publiques

Private final consumption                       6.7          5.8         -3.0         18.8          4.2          4.2         4.1     -1.4        ...            Consommation finale privée

Gross fixed capital formation                  17.1         -7.7          8.8         17.6          1.0          6.8         3.6     -1.8        ...        Formation brute de capital fixe

Exports of goods and services                  15.6         19.7          7.9          3.3         10.3          5.1         1.6      0.0        ...      Exportations de biens et services

                                                                                                                                                            Moins importations de biens et
Less imports of goods and services             37.4          2.6          2.1          6.6         10.0          4.2         2.3     -0.2        ...
                                                                                                                                                                                  services


                                                                                      III INFLATION

                                            2002         2003         2004         2005         2006         2007        2008       2009     2010
Annual Growth Rates (%)                                                                                                                         Taux de croissance annuel (%)
All Item                                       -9.8         -2.1         -2.2          2.9          1.4          6.2       10.4       2.5       4.7                               Ensemble

Food                                          -12.3          1.4         -2.5          6.6          1.2         15.1       19.7       3.0       2.8                            Alimentation

Health                                         -4.9        -22.9          9.2          2.9          6.0         12.2         0.2     -0.1       0.0                                   Santé

Energy                                         -3.3        -15.5          0.0          1.6          1.2          0.1         0.5      3.8        ...                                 Energie

Transport                                       3.2        -21.3         26.2          1.7          1.5         -0.5         3.5      2.2      -0.4                               Transport


                                                  IV AGRICULTURAL PRODUCTION - PRODUCTION AGRICOLE

                                            2002         2003         2004         2005         2006         2007        2008       2009     2010
Tons (Thousand)                                                                                                                                                      Tonnes (milliers)
Potato, Tons (thousands)                       195          195          195          310          300          290         290        ...       ...     Pomme de terre, tonnes (milliers)

Tomato, Tons (thousands)                       190          190          190          190          160          213         213       200        ...             Tomates, tonnes (milliers)

Dates, Tons (thousands)                        200          200          150          150          150          150         150       150        ...                Dattes, tonnes (milliers)

Olives, Tons (thousands)                       150          150          180          180          180          180         180       180        ...                 Olive, tonnes (milliers)

Wheat, Tons (thousands)                        125          125          125          125          104          104         104        ...       ...                   Blé, tonnes (milliers)


                                                          V MINING PRODUCTION - PRODUCTION MINIERE
                                                                                                                                                                                                217
                                            2002         2003         2004         2005         2006         2007        2008       2009     2010

Crude petroleum, metric tons                                                                                                                                 Pétrole brut, tonnes métriques
                                           60 584.0     68 736.0     75 287.0     80 252.0     83 310.0     81 114.0          ...      ...       ...
(thousands)                                                                                                                                                                        (milliers)
Natural gas (terajoules)                  235 980.0    243 200.0    306 281.0    429 400.0    562 400.0    625 480.0          ...      ...       ...                Gaz naturel (térajoules)

Salt and sodium chloride, metric tons                                                                                                                        Sel et chlorure de sodium pur,
                                               40.0         40.0         40.0         40.0         40.0         40.0          ...      ...       ...
(thousands)                                                                                                                                                      tonnes métriques (milliers)


                                                                                 VI ENERGY - ENERGIE

                                            2002         2003         2004         2005         2006         2007        2008       2009     2010

Electricity - total hydro production,                                                                                                                   Électricité - production hydraulique
                                           17 351.0     18 943.0     20 202.0     22 317.0     23 992.0     25 694.0    28 666.0       ...       ...
kilowatt hours (millions)                                                                                                                                  totale, kilowatt-heures (millions)

Electricity - total thermal production,                                                                                                                   Électricité - production thermique
                                                 ...          ...          ...          ...          ...          ...         ...      ...       ...
kilowatt hours (millions)                                                                                                                                  totale, kilowatt-heures (millions)

Electricity - total production, self-                                                                                                                  Electricité - Production totale privée
                                                 ...          ...          ...          ...          ...          ...         ...      ...       ...
producer (Million Kilowatt Hours)                                                                                                                                (million de kilowatt heures)

Electricity - total production, public                                                                                                                        Electricité - Production totale
                                            17 351       18 943       20 202       22 317       23 992       25 694           ...      ...       ...
(Million Kilowatt Hours)                                                                                                                               publique (million de kilowatt heures)


                                                                                                       African Statistical Yearbook 2011 / Annuaire Statistique pour l'Afrique 2011
Libyan Arab Jamahiriya                                                                                                            Jamahiriya Arabe Libyenne
                                                  VII TOURISM AND INFRASTRUCTURE - TOURISME ET INFRASTUCTURE

                                                   2002       2003       2004        2005        2006        2007        2008        2009        2010

         Arrivals - Tourists (thousands)              135        142      42.638      81.319      125.48     105.997     759.771           ...         ...           Arrivées - touristes (milliers)

         Rooms in hotels and similar                                                                                                                       Chambres d'hotels et établissements
         establishments (thousands)                     4          4           6           6           7           8           8           ...         ...                  assimilés (milliers)

         Paved Road (% of total)                        ...        ...         ...         ...         ...        57          50          44           ...        Routes asphaltées (% du total)
         Total Network (Railways-km)                    ...        ...         ...         ...         ...    27 355      30 000      34 000           ...         Réseau total voies ferrées-Km
         Main Telephone Lines (per 1,000                                                                                                                         Lignes téléphoniques fixes (pour
                                                      130        130         140         140         150         160         160         170           ...
         inhabitants)                                                                                                                                                            1000 habitants)
         Mobile Cellular Subscribers (per                                                                                                                        Abonnés aux téléphones mobiles
                                                       10         20          90         340         650         730         770         780           ...
         1,000 inhabitants)                                                                                                                                               (pour 1000 habitants)


                                   VII FINANCIAL AND MONETARY STATISTICS - FINANCES ET STATISTIQUES MONETAIRES

                                                   2002       2003       2004        2005        2006        2007        2008        2009        2010

         VII-1 Monetary Statistics                                                                                                                      VII-1 Statistiques monétaires
         Libyan Dinar (Millions)                                                                                                                                     Dinar Libyen(Millions)
         Money supply (M1)                          8 360      8 681      10 154      13 384      15 455      22 014      33 323      37 392      36 615                   Masse monétaire (M1)
         Quasi-money                                2 165      2 529       2 599       3 068       3 313       3 894       5 330       7 992       6 964                           Quasi-monnaie
           of which Demand Deposit                      ...        ...         ...         ...         ...         ...         ...         ...         ...              dont Monnaie scripturale
         Net foreign assets                        19 034     27 016      34 125      56 308      79 318     100 484     124 714     128 810     131 681                    Avoirs extérieurs nets
         Domestic credit                            7 989      4 560     - 10 168    - 25 706    - 42 891    - 48 728    - 56 989    - 51 560    - 58 207                          Crédit intérieur

         of which claims on private sector          4 476      4 298       4 452       4 573       4 742       5 286       7 744       8 521       8 593       dont créances sur le secteur privé

         of which Claims on government                                                                                                                                dont créances nettes sur le
                                                      275     - 4 055    - 18 701    - 35 137    - 53 668    - 60 961    - 70 642    - 69 953    - 79 240
         sector, net                                                                                                                                                              gouvernement
         International reserves (millions of US                                                                                                              Réserves internationales (millions de
                                                   14 307     19 584      25 689      39 508      59 289      79 405      92 313      98 725     101 882
         $)                                                                                                                                                                                  $ EU)
         Average Exchange Rate (National                                                                                                                      Taux de change (moyen) (monnaie
                                                     1.27       1.29        1.30        1.31        1.31        1.26        1.22        1.25        1.27
         Currency per us $)                                                                                                                                               nationale par dollars)


         VII-2 Public Finance                                                                                                                                    VII-2 Finances publiques
         Libyan Dinar (Millions)                                                                                                                                     Dinar Libyen(Millions)
         Total Revenues and Grants                 12 850     16 614      23 272      37 413      46 390      57 754      78 923      44 653      64 561                 Recettes totales et dons
           Tax Revenue                             11 301     15 231      21 757      36 289      44 654      54 810      74 921      43 767           ...                       Recettes fiscales
           Non Tax Revenue                          1 549      1 383       1 515       1 124       1 736       1 506       1 981         886           ...                  Recettes non fiscales
218        Grants                                       0          0           0           0           0       1 438       2 021            0          ...                                   Dons

         Total Expenditures and Net Lending        10 063     13 396      17 230      19 930      22 449      32 695      44 836      39 406      44 776           Dépenses totales et prêts nets

           Current expenditure                      6 225      9 836       9 231       6 748       8 129      10 278      10 593      10 422           ...                   Dépenses courantes
           Of which Wages and Salaries              2 546      2 812       3 675       4 258       4 772       7 316       7 764       8 118           ...         Dont rémunérations et salaires
           Capital expenditure                      3 339      2 832       6 933       9 265      12 176      16 271      25 907      20 187           ...               Dépenses d'équipement
           Net Lending                                  0          0         102       2 420         580       4 049       1 350         800           ...                              Prêts nets
         Fiscal Balance                             2 787      3 218       6 042      17 483      23 941      25 059      34 087       5 247      19 785          Solde global y compris les dons


         VII-3 Balance of Payments                                                                                                                           VII-3 Balance des paiements
         Libyan Dinar (Millions)                                                                                                                                     Dinar Libyen(Millions)
         Trade balance                              2 734      4 591       9 209      12 593      35 878      36 811      50 011      19 008      31 276                    Balance commerciale
         Services Balance                          - 1 445    - 1 493     - 1 927     - 2 376     - 2 489     - 2 420     - 3 104     - 4 085     - 2 907                    Balance des services
         Net Income                                   337        698       - 321       - 368        - 50       1 053         852         723         377                             Revenus nets
         Current transfers, net total              - 1 108    - 2 163     - 3 274      - 830         436       - 275      - 1 273     - 1 895     - 1 728                     Transferts courants
         Current account balance                      827      6 670       9 670      22 823      33 775      35 168      46 486      13 751      27 018                Solde du compte courant


         VII-4 External Debt and Financial Flows                                                                                            VII-4 Dette extérieure et flux financiers
         US $ (Millions)                                                                                                                                                      $ E.U (Millions)
         Total external debt                        5 574      5 574       5 574       5 574       5 574       5 574       5 574       5 574       5 574                   Dette extérieure totale
           Private                                  2 374      2 374       2 374       2 374       2 374       2 374       2 374       2 374       2 374                                    Privée
           Public                                   3 200      3 200       3 200       3 200       3 200       3 200       3 200       3 200       3 200                                 Publique
         Total external debt service                    ...        ...         ...         ...         ...         ...         ...         ...         ...          Service de la dette extérieure
         Net Foreign Direct Investment                                                                                                                       Investissements étranger direct (flux
                                                      145        143         357       1 038       2 013       4 689       4 111       2 674           ...
         Inflows                                                                                                                                                                   nets entrants)
         Net Total Official Development                                                                                                                         Aide publique au développement
                                                        0          0           0          24          38          19          60          39           ...
         assistance                                                                                                                                                                (nette totale)


      African Statistical Yearbook 2011 / Annuaire Statistique pour l'Afrique 2011
Libyan Arab Jamahiriya                                                                                           Jamahiriya Arabe Libyenne

                           2002       2003       2004        2005        2006         2007        2008       2009      2010

Libyan Dinar (Millions)                                                                                                                        Dinar Libyen
Exports, fob                                                                                                                             Exportations, fàb


Exports - Total             5 394     10 177     14 807      20 848      31 148       36 336      40 972     54 732       ...               Exportations - Total


Main Products                                                                                                                            Principaux produits


Crude Petroleum             9 519     14 916     22 197      31 617      35 831       40 561      54 468         ...      ...                       Pétrole brut


                                ...        ...        ...         ...         ...          ...         ...       ...      ...


                                ...        ...        ...         ...         ...          ...         ...       ...      ...


                                ...        ...        ...         ...         ...          ...         ...       ...      ...


                                ...        ...        ...         ...         ...          ...         ...       ...      ...

Main Destinations                                                                                                                   Principales destinations

Italy                      4 176.3    5 868.1    8 187.8    12 930.7    15 456.4     16 805.6    24 428.4        ...      ...                              Italie


Germany                    1 356.7    2 174.2    3 815.2     3 031.5     3 560.2      4 659.1     4 503.7        ...      ...                         Allemagne


Spain                      1 739.0    2 179.0    2 782.8     3 102.8     3 079.1      2 379.2     3 042.5        ...      ...                           Espagne


Turkey                      591.8     1 144.1    1 726.2     2 347.6          ...          ...         ...       ...      ...                            Turquie


France                          ...        ...        ...    1 733.1     1 747.6      2 616.2     5 409.7        ...      ...                            France


                           2002       2003       2004        2005        2006         2007        2008       2009      2010
Imports, cif                                                                                                                              Importations, cif

Imports - Total             2 660      5 586      5 598       8 255       7 954        7 935       8 501     11 196       ...     Importations - Total (millions)   219

                                                                                                                                         Principaux produits
Main Products


Flour or wheat or meslin      248        240        628         404         291          398         373         ...      ...                  Blé nda et méteil


                                ...        ...        ...         ...         ...          ...         ...       ...      ...


                                ...        ...        ...         ...         ...          ...         ...       ...      ...


                                ...        ...        ...         ...         ...          ...         ...       ...      ...


                                ...        ...        ...         ...         ...          ...         ...       ...      ...


Main Origin                                                                                                                         Principales provenances

Italy                      1 360.0    1 027.2    1 511.5      946.9       784.1        690.4           ...       ...      ...                              Italie

Germany                     626.4      499.1      994.1       742.6       673.8            ...         ...       ...      ...                         Allemagne

Korea, South                288.6          ...    615.8       568.2       518.7            ...         ...       ...      ...                     Corée du Sud

United Kingdom              392.7      300.3          ...         ...         ...          ...         ...       ...      ...                      Royaume-Uni

France                          ...        ...        ...     414.1           ...          ...         ...       ...      ...                            France


                                                                                African Statistical Yearbook 2011 / Annuaire Statistique pour l'Afrique 2011
Madagascar                                                                                                                                                             Madagascar

         AREA (KM 2)                                                                                   587 041                                                                    SUPERFICIE (KM 2)
         CAPITAL CITY                             Antananarivo                                                                                Tananarive                                      CAPITALE
         CURRENCY                                 Ariary                                                                                          Ariary                                      MONNAIE


                                 I SOCIAL AND DEMOGRAPHIC INDICATORS — INDICATEURS DEMOGRAPHIQUES ET SOCIAUX

                                                    2002        2003        2004        2005        2006         2007         2008         2009         2010
         Population                                                                                                                                                                        Population
                                                                                                                                                                       Population au milieu de l'année -
         Mid-year population - Total (Million)         16.2        16.7        17.1        17.6        18.1        18.6          19.1         19.6         20.1
                                                                                                                                                                                          Total (million)
                                                                                                                                                                       Population au milieu de l'année -
         Mid-year population - Urban (%)                 ...         ...       28.0        29.0        29.0        29.0          29.0         29.8           ...
                                                                                                                                                                                          Urbaine (%)

         Female (%)                                    50.5        50.5        50.5        50.6        50.5        50.5          50.5         50.5           ...                             Femme (%)


         Population by Age Group                                                                                                                                           Population par groupe d'âge


            0-14                                   7279 840    7457 496    7629 035    7796 480    7959 884    8118 275      8271 594     8419 688     8562 573                                      0-14


            15-64                                  8406 728    8682 472    8972 115    9274 295    9588 720    9915 738     10255 212    10607 051    10970 858                                     15-64


            65+                                     503 228     516 759     530 167     543 486     556 835     570 352       584 135      598 291      613 011                                      65+


         Active Population (000)                    7 750.7     7 986.7     8 240.2     8 505.2     8 780.2      9 063.8      9 356.7      9 682.8     10 006.9                  Population active (000)

            Female (%)                                 48.8        48.8        48.9        49.0        49.0        49.1          49.2         49.2         49.2                              Femme (%)

                                                                                                                                                                      Taux brut de natalité - Total (par
         Crude birth rate - Total (per 1000)           39.7        39.0        38.3        37.7        37.1        36.5          35.9         35.3           ...
                                                                                                                                                                                                  1000)
                                                                                                                                                                    Taux brut de mortalité - Total (par
         Crude death rate - Total (per 1000)           10.9        10.6        10.3        10.0         9.7          9.4          9.2          8.9           ...
                                                                                                                                                                                                 1000)
         Life expectancy at birth - Total                                                                                                                             Espérance de vie à la naissance -
                                                       57.5        58.0        58.4        58.9        59.4        59.9          60.4         60.8           ...
         (years)                                                                                                                                                                        Total (années)
         Net reproduction rate - (per                                                                                                                                  Taux net de reproduction - (par
                                                         ...         ...         ...        2.1          ...          ...          ...          ...          ...
         woman)                                                                                                                                                                                femme)
                                                                                                                                                                      Indice synthétique de fécondité -
         Total fertility rate - (p woman)
                       y        (per    )               5.3         5.2         5.1         5.0         4.9          4.8          4.7          4.6           ...
                                                                                                                                                                                          (par femme)

         Education                                                                                                                                                                    Enseignement

         Teaching staff at first level - Total                                                                                                                      Personnel enseignant - 1er degré -
                                                         ...         ...         ...         ...         ...          ...          ...          ...          ...
         (thousands)                                                                                                                                                                   Total (milliers)
         Teaching staff at second level - Total                                                                                                                    Personnel enseignant - 2ème degré -
220                                                      ...         ...         ...         ...         ...          ...          ...          ...          ...
         (thousands)                                                                                                                                                                    Total (milliers)
         Teaching staff at third level - Total                                                                                                                     Personnel enseignant - 3ème degré -
                                                         ...         ...         ...         ...         ...          ...          ...          ...          ...
         (thousands)                                                                                                                                                                    Total (milliers)
         First level student enrollment - Total                                                                                                                       Elèves inscrits - 1er degré - Total
                                                         ...         ...         ...         ...         ...          ...          ...          ...          ...
         (thousands)                                                                                                                                                                            (milliers)
         First level student enrollment -                                                                                                                          Elèves inscrits - 1er degré - Femmes
                                                      1 180       1 398       1 648       1 759       1 813       1 887         1 979           ...          ...
         Female (thousands)                                                                                                                                                                      (milliers)
         Second level student enrollment -                                                                                                                          Elèves inscrits - 2ème degré - Total
                                                         ...         ...         ...       621         727          834          945            ...          ...
         Total (thousands)                                                                                                                                                                     (milliers)
         Second level student enrollment -                                                                                                                                Elèves inscrits - 2ème degré -
                                                         ...         ...         ...       304         354          407          459            ...          ...
         Female (thousands)                                                                                                                                                           Femmes (milliers)
         Third level student enrollment - Total                                                                                                                     Elèves inscrits - 3ème degré - Total
                                                       31.9        35.5        42.1        44.9        49.7        58.3          62.1           ...          ...
         (thousands)                                                                                                                                                                           (milliers)
         Third level student enrollment -                                                                                                                                 Elèves inscrits - 3ème degré -
                                                       14.5        16.1        19.9        21.1        23.1        27.4          29.3           ...          ...
         Female (thousands)                                                                                                                                                           Femmes (milliers)
         Public expenditure on education (%                                                                                                                           Dépenses publiques consacrées à
                                                         ...         ...       18.2        25.3        13.9        16.4            ...          ...          ...
         of budget)                                                                                                                                                     l'enseignement (% du budget)

         Health                                                                                                                                                                                   Santé

         Hospital beds - Total (per 10 000                                                                                                                            Nombre de lits d'hôpitaux - Total
                                                        40          40          38          40          33           34            ...          ...          ...
         population)                                                                                                                                                                     (pour 10 000)
         Nurses - Total (per 10 000                                                                                                                                  Nombre d'infirmières - Total (pour
                                                         ...         ...        31           ...         ...          ...          ...          ...          ...
         population)                                                                                                                                                                           10 000)
         Physicians - Total (per 10 000                                                                                                                              Nombre de médecins - Total (pour
                                                          1          ...         3           ...          3            3            4           ...          ...
         population)                                                                                                                                                                         10 000)
         Public expenditure on Health (% of                                                                                                                        Dépenses publiques consacrées à la
                                                        17          11           8          10           9            ...          ...          ...          ...
         budget)                                                                                                                                                                santé (% du budget)


      African Statistical Yearbook 2011 / Annuaire Statistique pour l'Afrique 2011
Madagascar                                                                                                                                       Madagascar
                                                  II NATIONAL ACCOUNTS — COMPTES NATIONAUX

                                        2002      2003     2004     2005      2006         2007       2008      2009       2010

Gross domestic product by kind of economic activity at current prices
                                                                                 Produit intérieur brut par branche d'activité économique aux prix courants


Ariary (Billions)                                                                                                                                  Ariary(Milliards)

Agriculture                             1 793     1 815    2 135     2 592     2 969        3 219      3 589     4 393         ...                            Agriculture

Mining and quarrying                        8        10       12       16        19            16        17         27         ...                 Industries extractives

Manufacturing                             735       878    1 087     1 330     1 579        1 877      2 131     2 250         ...            Industries manufacturières

Electricity, gas & water                   72        68       84       99       128           144       192        191         ...                 Electricité, gaz et eau

Construction                              110       130      190      276       403           547       709        647         ...          Bâtiments et travaux publics
Wholesale & retail trade,                                                                                                                Commerce de gros et de détail,
                                          880       955    1 105     1 282     1 435        1 636      1 909     2 060         ...
restaurants, hotels                                                                                                                               restaurants et hôtels
                                                                                                                                          Banques, assurances, affaires
Finance, insurance, real estate, etc.      49        56       74      103       122           150       203        208         ...
                                                                                                                                                          immobilières
Transport and communications              963     1 029    1 314     1 748     2 111        2 595      3 100     3 063         ...      Transport(s) et communications
                                                                                                                                            Administrations publiques et
Public administration and defense         220       316      338      396       521           606       669        671         ...
                                                                                                                                                                défense
Other services                            861     1 013    1 138     1 386     1 623        1 875      2 136     2 096         ...                        Autres services
                                                                                                                                         Moins Services d’intermédiation
Less Imputed Service Charges             - 39      - 45     - 63      - 67    - 108         - 135      - 187     - 182         ...
                                                                                                                                                               financière
Gross domestic product at factor                                                                                                     Produit intérieur brut aux couts des
                                        5 653     6 224    7 414     9 162    10 803       12 531     14 469    15 424         ...
cost / basic prices                                                                                                                                facteurs / prix de base

Plus: Indirect Taxes / taxes on                                                                                                      Plus taxes indirectes/impôts sur les
                                          355       554      742      931      1 012        1 229      1 630     1 379         ...
products, less subsidies                                                                                                                 produits, moins les subventions


Expenditure on Gross domestic product at current purchaser's values
                                                                                              Emploi du produit intérieur brut aux prix courants d'acquisition

Ariary( Billions)                                                                                                                                  Ariary(Milliards)
                                                                                                                                               Consommation finale des
Government final consumption              502       710      745      904      1 034        1 691      1 809     1 927         ...
                                                                                                                                               administrations publiques

Private final consumption               5 244     5 921    6 966     8 698     9 688       10 986     12 080    13 136         ...           Consommation finale privée

Gross fixed capital formation             804     1 098    1 907     2 240     2 989        4 456      7 094     5 987         ...        Formation brute de capital fixe

Increase in inventories                     ...      ...      ...       ...       ...       - 382         ...    - 263         ...                   Variation des stocks

Exports of goods and services             959     1 456    2 855     2 848     3 513        4 172      4 268     4 786         ...     Exportations de biens et services
                                                                                                                                                                             221
                                                                                                                                          Moins importations de biens et
Less imports of goods and services      1 500     2 406    4 317     4 598     5 408        7 164      9 151     8 771         ...
                                                                                                                                                                services
GDP at purchasers' values               6 008     6 779    8 156    10 092    11 815       13 760     16 099    16 803         ...             PIB aux prix d'acquisition


Gross domestic product by kind of economic activity at constant
                                                                                Produit intérieur brut par branche d'activité economique aux prix constants
prices
Annual Growth Rates (%)                                                                                                       Taux de croissance annuel (%)
Agriculture                               -1.3      1.3      3.1       2.5       2.1          2.2        2.9       5.9         ...                            Agriculture

Mining and quarrying                     -34.0     10.0      7.7       4.4       9.1          -7.2       9.0      14.3         ...                 Industries extractives

Manufacturing                            -18.5     15.6      6.6       3.0       3.3         10.8        4.3       -8.9        ...            Industries manufacturières

Electricity, gas & water                 -31.1      8.8      6.0       2.5       4.4          5.6        6.9       -0.4        ...                 Electricité, gaz et eau

Construction                             -15.1     30.0     29.0      18.8      27.6         21.8       27.6      -17.7        ...          Bâtiments et travaux publics
Wholesale & retail trade,                                                                                                                       Commerce de gros et de
                                          -9.5      5.1      3.9       4.9       4.5          4.6        4.2       -0.7        ...
restaurants, hotels                                                                                                                           détail,restaurants et hôtels
                                                                                                                                           Banques, assurances, affaires
Finance, insurance, real estate, etc.     4.5      12.4      5.0       6.6      14.1          8.8        4.2      16.5         ...
                                                                                                                                                           immobilières
Transport and communications             -22.6     14.5      5.6       5.3       7.8          8.2        8.1       -9.7        ...      Transport(s) et communications
                                                                                                                                            Administrations publiques et
Public administartion and defense         2.0       6.0      1.6       3.0       2.1          3.0        3.0       0.0         ...
                                                                                                                                                                défense
Other services                           -16.6      9.4      5.8       6.4       5.0          7.2        6.4       -4.5        ...                        Autres services
                                                                                                                                         Moins Services d’intérmediation
Less Imputed Service Charges              5.0      12.5      5.0       6.6      14.2          8.9        4.0      16.7         ...
                                                                                                                                                               financière
Gross domestic product at factor                                                                                                     Produit intérieur brut aux couts des
                                         -11.5      7.4      5.0       4.4       4.9          6.1        6.0       -2.8        ...
cost / basic prices                                                                                                                                facteurs / prix de base

Plus: Indirect Taxes / taxes on                                                                                                      Plus taxes indirectes/impôts sur les
                                         -23.5     35.0      7.3       6.4       6.2          7.2       16.2       -9.9        ...
products, less subsidies                                                                                                                 produits, moins les subventions

Gross domestic product at market                                                                                                       Produit intérieur brut aux prix du
                                         -12.7      9.8      5.3       4.6       5.0          6.2        7.1       -3.7        ...
prices                                                                                                                                                            marché


                                                                                     African Statistical Yearbook 2011 / Annuaire Statistique pour l'Afrique 2011
Madagascar                                                                                                                                       Madagascar

         Expenditure on Gross domestic product at constant purchasers'
                                                                                                   Emplois du produit intérieur brut aux prix constants d'acquisition
         values

         Annual Growth Rates (%)                                                                                                      Taux de croissance annuel (%)
                                                                                                                                                        Consommation finale des
         Government final consumption               -13.6    29.4     -11.4        8.7     -11.5     44.7        -1.6        3.9       ...
                                                                                                                                                        administrations publiques

         Private final consumption                   -3.0      8.9     3.4         1.6       1.4       0.1        0.3        0.1       ...            Consommation finale privée

         Gross fixed capital formation              -37.5    48.9     27.9        -1.3     19.3      30.8       54.3       -21.8       ...        Formation brute de capital fixe

         Exports of goods and services              -45.9    39.1      9.8         2.2     17.2      32.7        -3.3        9.3       ...      Exportations de biens et services

                                                                                                                                                  Moins importations de biens et
         Less imports of goods and services         -25.0    56.7      8.9        -8.8       4.9     28.3       26.1       -10.5       ...
                                                                                                                                                                        services


                                                                                  III INFLATION

                                                   2002     2003     2004       2005     2006      2007       2008       2009       2010
         Annual Growth Rates (%)                                                                                                      Taux de croissance annuel (%)
         All Item                                   16.7      -1.9    14.0        18.4     10.8      10.4         9.2        9.0      9.2                               Ensemble

         Food                                       15.7      -3.7    20.0        25.6       4.2     28.4        -2.0        8.3      7.1                            Alimentation

         Health                                      7.6      -0.7     7.7         8.8       8.4      -4.0      25.9         8.4     17.0                                   Santé

         Energy                                     17.1      1.6     14.2        16.0     23.0      -25.3      54.5       11.6      11.7                                  Energie

         Transport                                  42.9     -13.5    11.6        13.8     19.6       -7.8      25.8         2.2      3.4                               Transport


                                                       IV AGRICULTURAL PRODUCTION - PRODUCTION AGRICOLE

                                                   2002     2003     2004       2005     2006      2007       2008       2009       2010
         Tons (Thousand)                                                                                                                                   Tonnes (milliers)
         Rice, Tons (thousands)                    2 604    2 800    3 030       3 392    3 485     3 596          ...        ...      ...                   Riz, tonnes (milliers)

         Cassava, Tons (thousands)                 2 366    1 992    1 949       2 964    2 359     2 994          ...        ...      ...               Manioc, tonnes (milliers)

         Sweet potato, Tons (thousands)              493      493      488        879       590         ...        ...        ...      ...       Patates douces, tonnes (milliers)

         Maize, Tons (thousands)                     172      318      309        391       373       391          ...        ...      ...                  Maïs, tonnes (milliers)

         Potato, Tons (thousands)                    296      255      246        215       298         ...        ...        ...      ...    Pommes de terre, tonnes (milliers)


                                                            V MINING PRODUCTION - PRODUCTION MINIERE
222
                                                   2002     2003     2004       2005     2006      2007       2008       2009       2010

         Gold ores and concentrates                                                                                                              Minerais d'or et leurs concentrés
                                                    38.0     10.0    200.0       169.8    184.6         ...        ...        ...      ...
         (Kilograms)                                                                                                                                                (Kilogrammes)
         Chromium ores and concentrates,            28.0     40.0     46.0        38.6     42.0     122.0          ...        ...      ...      Minerai de chrome et concentrés,
         metric tons (thousands)                                                                                                                      tonnes métriques (milliers)
         Marble, travertines, etc., metric tons                                                                                                  Marbres, travertins, etc., tonnes
                                                     5.6       5.0       ...       4.2       4.6        ...        ...        ...      ...
         (thousands)                                                                                                                                          métriques (milliers)


                                                                               VI ENERGY - ENERGIE

                                                   2002     2003     2004       2005     2006      2007       2008       2009       2010

         Electricity - total hydro production,                                                                                                Électricité - production hydraulique
                                                   779.2    897.8    983.4       988.4   1 003.6   1 051.8    1 296.0    1 410.4       ...
         kilowatt hours (millions)                                                                                                               totale, kilowatt-heures (millions)

         Electricity - total thermal production,                                                                                                Électricité - production thermique
                                                    68.7     68.1     64.8        65.6     63.6      68.4       53.0       47.7        ...
         kilowatt hours (millions)                                                                                                               totale, kilowatt-heures (millions)

         Electricity - total production, self-                                                                                               Electricité - Production totale privée
                                                      31       32       35         34        36        32         47         52        ...
         producer (Million Kilowatt Hours)                                                                                                             (million de kilowatt heures)

         Electricity - total production, public                                                                                                     Electricité - Production totale
                                                     682      775      840        875       820       765          ...        ...      ...
         (Million Kilowatt Hours)                                                                                                            publique (million de kilowatt heures)


      African Statistical Yearbook 2011 / Annuaire Statistique pour l'Afrique 2011
Madagascar                                                                                                                                                         Madagascar
                                         VII TOURISM AND INFRASTRUCTURE - TOURISME ET INFRASTUCTURE

                                          2002        2003        2004        2005        2006         2007        2008        2009        2010

Arrivals - Tourists (thousands)          170.208      61.674      139.23     228.784      288.04      311.448     340.185     148.387           ...           Arrivées - touristes (milliers)

Rooms in hotels and similar                                                                                                                         Chambres d'hotels et établissements
establishments (thousands)                  8.78       9.325       10.23      10.879      11.872       14.435      16.145      18.066           ...                  assimilés (milliers)

Paved Road (% of total)                        ...         ...        20           ...         ...          ...         ...         ...         ...        Routes asphaltées (% du total)
Total Network (Railways-km)                    ...         ...    30 004           ...         ...          ...         ...         ...         ...         Réseau total voies ferrées-Km
Main Telephone Lines (per 1,000                                                                                                                           Lignes téléphoniques fixes (pour
                                                3          3           3           3           6            7           9           ...         ...
inhabitants)                                                                                                                                                              1000 habitants)
Mobile Cellular Subscribers (per                                                                                                                          Abonnés aux téléphones mobiles
                                              10          17          20          30          60          120         261           ...         ...
1,000 inhabitants)                                                                                                                                                 (pour 1000 habitants)


                          VII FINANCIAL AND MONETARY STATISTICS - FINANCES ET STATISTIQUES MONETAIRES

                                          2002        2003        2004        2005        2006         2007        2008        2009        2010

VII-1 Monetary Statistics                                                                                                                        VII-1 Statistiques monétaires
Ariary (Billions)                                                                                                                                                    Ariary(Milliards)
Money supply (M1)                          1 126       1 172       1 399       1 415       1 751        2 075       2 263       2 403       2 615                   Masse monétaire (M1)
Quasi-money                                  333         414         588         617         818        1 032       1 241       1 498       1 662                           Quasi-monnaie
  of which Demand Deposit                      ...         ...         ...         ...         ...          ...         ...         ...         ...              dont Monnaie scripturale
Net foreign assets                           372         438         776         845       1 526        1 846       2 098       1 925       2 308                    Avoirs extérieurs nets
Domestic credit                            1 101       1 214       1 224       1 296       1 138        1 371       1 508       1 952       1 908                           Crédit intérieur

of which claims on private sector            487         595         815         997       1 191        1 398       1 796       1 926       2 134       dont créances sur le secteur privé

of which Claims on government                                                                                                                                  dont créances nettes sur le
                                             541         616         406         294        - 58         - 31       - 294          20       - 232
sector, net                                                                                                                                                                gouvernement
International reserves (millions of US                                                                                                                Réserves internationales (millions de
                                             363         414         504         481         583          847         982       1 135       1 134
$)                                                                                                                                                                                    $ EU)
Average Exchange Rate (National                                                                                                                        Taux de change (moyen) (monnaie
                                         1 366.39    1 238.33    1 868.86    2 003.03    2 142.30     1 873.88    1 708.37    1 956.21    2 089.95
Currency per us $)                                                                                                                                                 nationale par dollars)


VII-2 Public Finance                                                                                                                                      VII-2 Finances publiques
Ariary (Billions)                                                                                                                                                    Ariary(Milliards)
Total Revenues and Grants                    499         832       1 302       1 244       1 496        1 697       2 685       2 054       2 534                 Recettes totales et dons
  Tax Revenue                                461         678         887       1 020       1 261        1 573       2 087       1 862       2 175                         Recettes fiscales
  Non Tax Revenue                             20          20          96          83          62           35          50          80         271                    Recettes non fiscales
  Grants                                      18         134         319         141         173           89         548         192         358                                     Dons      223
Total Expenditures and Net Lending           925       1 339       2 118       2 122       3 277        2 594       2 998       2 478       2 887           Dépenses totales et prêts nets

  Current expenditure                        594         741       1 017       1 100       2 012        1 497       1 754       1 752       1 938                     Dépenses courantes
  Of which Wages and Salaries                276         365         400         456         285          711         759         802       1 003           Dont rémunérations et salaires
  Capital expenditure                        289         494         985         959       1 165        1 011       1 244         726         949                 Dépenses d'équipement
  Net Lending                                 41         104         116          63          99           87           0            0           0                               Prêts nets
Fiscal Balance                             - 345       - 333       - 464       - 439       4 457        - 393       - 313       - 424       - 353          Solde global y compris les dons


VII-3 Balance of Payments                                                                                                                             VII-3 Balance des paiements
Ariary (Billions)                                                                                                                                                    Ariary(Milliards)
Trade balance                               - 64       - 314       - 816      - 1 185     - 1 148      - 1 873     - 3 193     - 3 280     - 2 918                   Balance commerciale
Services Balance                           - 236       - 368       - 512       - 236       - 150        - 379       - 652       - 697       - 219                     Balance des services
Net Income                                  - 93        - 95       - 124       - 161       - 171        - 118        - 84       - 179       - 262                             Revenus nets
Current transfers, net total                 130         377         610         472         455          422         679         599         558                      Transferts courants
Current account balance                    - 262       - 400       - 843      - 1 110     - 1 013      - 1 948     - 3 250     - 3 557     - 2 841               Solde du compte courant


VII-4 External Debt and Financial Flows                                                                                              VII-4 Dette extérieure et flux financiers
US $ (Millions)                                                                                                                                                        $ E.U (Millions)
Total external debt                        4 303       4 835       3 829       3 716       1 587        1 837       1 875       2 113       2 214                   Dette extérieure totale
  Private                                     61          67          57          42          39           34          23          17          14                                    Privée
  Public                                   4 242       4 768       3 772       3 674       1 549        1 803       1 852       2 096       2 199                                 Publique
Total external debt service                   58          74         103          85          68           43          44          42          40            Service de la dette extérieure
Net Foreign Direct Investment                                                                                                                         Investissements étranger direct (flux
                                              61          95          95          86         294          777       1 180         543           ...
Inflows                                                                                                                                                                     nets entrants)
Net Total Official Development                                                                                                                           Aide publique au développement
                                             374         546       1 263         913         757          894         843         445           ...
assistance                                                                                                                                                                  (nette totale)


                                                                                                 African Statistical Yearbook 2011 / Annuaire Statistique pour l'Afrique 2011
Madagascar                                                                                                                                              Madagascar

                                           2002        2003         2004         2005         2006           2007         2008         2009       2010

         Ariary (Millions)                                                                                                                                                       Ariary
         Exports, fob                                                                                                                                             Exportations, fàb


         Exports - Total                  658 050    1 057 579    1 855 080    1 674 698    2 093 053     2 312 024     2 196 577    2 056 695       ...             Exportations - Total


         Main Products                                                                                                                                            Principaux produits


         Shrimps and prawns               166 835     152 302      197 611      203 072      256 468        232 648      187 068      153 093        ...                        Crevettes


         Shirts, blouses                   15 381      15 036       35 845       35 670       47 865         68 804      155 182       65 687        ...          Chemises, chemisettes


         Petroleum products                35 799      48 867       70 177       88 679      166 954        104 042      154 941       95 035        ...               Produits pétroliers


         Vanilla                          224 684     281 547      232 234       94 114      100 652        104 134       85 742       86 688        ...                           Vanille


         Chrome ore                         3 822       3 751       15 383       21 193       27 967         22 396       55 742       33 420        ...              Minerai de chrome

         Main Destinations                                                                                                                                   Principales destinations

         France                         348 673.5    500 459.3    640 360.5    551 779.5    800 209.5    1 037 485.0 1 239 475.3     674 016.0       ...                          France


         United States                  175 108.4    311 226.6    615 031.5    376 730.0    317 681.4     436 438.4     624 028.6    383 436.0       ...                       Etats-Unis


         Germany                         42 579.0     59 063.7    103 888.9    109 832.8    127 410.2     126 962.9     184 849.3    136 733.0       ...                       Allemagne


         China                            8 909.6      9 017.7     18 964.1     69 667.3     47 127.8      50 372.8      89 541.9    103 208.0       ...                            Chine


         Italy                           26 778.8     18 233.3     52 291.0     47 286.4     87 472.7      87 681.2      69 079.9     54 610.0       ...                            Italie


                                           2002        2003         2004         2005         2006           2007         2008         2009       2010
         Imports, cif                                                                                                                                              Importations, cif

224      Imports - Total                       ...          ...          ...          ...          ...            ...          ...          ...      ...   Importations - Total (millions)


                                                                                                                                                                  Principaux produits
         Main Products


         Petroleum Products               279 553     252 697      425 678      532 111      684 469        731 548      840 087      628 149        ...               Produits pétroliers


         Cotton Fabrics                     5 667      72 518      146 763      135 156      143 024        179 185      243 672      107 720        ...                 Tissus de coton


         Rebars and laminates              20 314      45 929       85 501       74 540       94 266         91 079      206 509      135 830        ...         Fers à béton et laminés


         Plastics                          20 341      45 629       84 009       94 762      116 705        129 205      170 697      114 913        ...              Matières plastiques


         Trucks                            17 204      36 615      106 395      135 430       74 813         94 993      159 418       85 810        ...                         Camions


         Main Origin                                                                                                                                         Principales provenances

         China                           45 331.3    239 504.6    542 059.5    476 997.3    661 991.5     864 273.0 1 371 594.0      694 817.0       ...                            Chine

         France                         120 520.5    245 994.3    406 788.2    486 005.4    484 810.4     474 378.3     575 346.0    595 837.0       ...                          France

         Bahreïn                         95 886.8     28 977.1    198 002.9    446 535.2    615 710.0     688 884.6     518 898.2    214 881.0       ...                          Bahreïn

         South Africa                    50 806.8    115 203.3    185 513.3    200 461.5    216 032.4     240 198.3     396 956.0    277 943.0       ...                  Afrique du Sud

         United States                   25 369.6     59 020.5    216 628.3     80 871.7    133 891.0     160 487.2     326 130.2    211 048.0       ...                       Etats-Unis


      African Statistical Yearbook 2011 / Annuaire Statistique pour l'Afrique 2011
Malawi                                                                                                                                                                           Malawi

AREA (KM 2)                                                                                  118 484                                                                    SUPERFICIE (KM 2)
CAPITAL CITY                             Lilongwe                                                                                       Lilongwe                                    CAPITALE
CURRENCY                                 Kwacha                                                                                          Kwacha                                     MONNAIE


                        I SOCIAL AND DEMOGRAPHIC INDICATORS — INDICATEURS DEMOGRAPHIQUES ET SOCIAUX

                                           2002        2003        2004        2005       2006            2007        2008        2009        2010
Population                                                                                                                                                                       Population
                                                                                                                                                             Population au milieu de l'année -
Mid-year population - Total (Million)         11.2        11.5        11.9        12.3       12.8           12.9         13.1        13.3        13.9
                                                                                                                                                                                Total (million)
                                                                                                                                                             Population au milieu de l'année -
Mid-year population - Urban (%)               14.0        13.0        13.0        14.0       14.0           14.0         15.0        15.0        15.0
                                                                                                                                                                                Urbaine (%)

Female (%)                                    51.0        51.0        51.0        51.0       51.0           51.0         51.0        51.0        51.0                              Femme (%)


Population by Age Group                                                                                                                                          Population par groupe d'âge


   0-14                                   5134 534    5306 477    5485 249    5670 528   5861 999       5908 920     5989 173    6213 116    6435 192                                      0-14


   15-64                                  5612 312    5800 255    5995 662    6198 181   6407 470       6458 756     6612 740    6809 635    7016 430                                     15-64


   65+                                     427 803     442 129     457 024     472 461    488 414        492 323      500 163     497 347     495 970                                      65+


Active Population (000)                    6 034.1     6 191.9     6 360.9     6 540.6    6 729.5         6 783.3     6 897.9     7 035.8     7 172.5                  Population active (000)

   Female (%)                                 49.0        49.0        49.0        49.0       49.0           49.0         49.0        49.0        49.0                              Femme (%)

                                                                                                                                                            Taux brut de natalité - Total (par
Crude birth rate - Total (per 1000)           45.0        50.1        40.5        48.8       48.2           41.0         46.5        45.8        45.1
                                                                                                                                                                                        1000)
                                                                                                                                                          Taux brut de mortalité - Total (par
Crude death rate - Total (per 1000)           25.0        18.5        17.7        16.6       16.3           15.2         14.8        14.6        14.1
                                                                                                                                                                                       1000)
Life expectancy at birth - Total                                                                                                                            Espérance de vie à la naissance -
                                              43.8        43.8        43.8        45.9       46.4           48.0         51.0        51.7        52.5
(years)                                                                                                                                                                       Total (années)
Net reproduction rate - (per                                                                                                                                 Taux net de reproduction - (par
                                                ...         ...         ...        2.1         ...             ...         ...         ...         ...
woman)                                                                                                                                                                               femme)
                                                                                                                                                            Indice synthétique de fécondité -
Total fertility rate - (p woman)
              y        (per    )               6.5         6.5         6.4         6.3        6.3             6.3         5.2         5.2         5.2
                                                                                                                                                                                (par femme)

Education                                                                                                                                                                   Enseignement

Teaching staff at first level - Total                                                                                                                     Personnel enseignant - 1er degré -
                                             46.03        45.1        44.0        45.1       43.2           42.3         45.9        46.4        46.8
(thousands)                                                                                                                                                                  Total (milliers)
Teaching staff at second level - Total                                                                                                                   Personnel enseignant - 2ème degré -
                                             10.81         7.1         9.0         9.0       10.4           10.3         11.4        11.5        11.6
(thousands)                                                                                                                                                                   Total (milliers)      225
Teaching staff at third level - Total                                                                                                                 Personnel enseignant - 3ème degré -
                                               0.7         0.8         0.8         0.8        0.8             0.8         0.8         0.8         0.8
(thousands)                                                                                                                                                                Total (milliers)
First level student enrollment - Total                                                                                                                      Elèves inscrits - 1er degré - Total
                                             3 113       3 117       3 167       3 201      3 281          3 307        3 601       3 637       3 673
(thousands)                                                                                                                                                                           (milliers)
First level student enrollment -                                                                                                                         Elèves inscrits - 1er degré - Femmes
                                             1 552       1 533       1 577       1 594      1 641          1 653        1 794       1 812       1 831
Female (thousands)                                                                                                                                                                     (milliers)
Second level student enrollment -                                                                                                                         Elèves inscrits - 2ème degré - Total
                                              116         131         180         184        218             210         234         236         238
Total (thousands)                                                                                                                                                                    (milliers)
Second level student enrollment -                                                                                                                               Elèves inscrits - 2ème degré -
                                               49          56          77          78         96              91         102         103         103
Female (thousands)                                                                                                                                                          Femmes (milliers)
Third level student enrollment - Total                                                                                                                    Elèves inscrits - 3ème degré - Total
                                               4.5         4.8         5.8         5.8        6.3             6.5         6.5         6.5         7.2
(thousands)                                                                                                                                                                          (milliers)
Third level student enrollment -                                                                                                                                Elèves inscrits - 3ème degré -
                                               1.3         1.4         2.0         2.1        2.1             2.2         2.8         3.2         3.0
Female (thousands)                                                                                                                                                          Femmes (milliers)
Public expenditure on education (%                                                                                                                          Dépenses publiques consacrées à
                                               9.0        19.4        20.2        11.3       10.7           10.7         10.2        11.0        12.0
of budget)                                                                                                                                                    l'enseignement (% du budget)

Health                                                                                                                                                                                  Santé

Hospital beds - Total (per 10 000                                                                                                                           Nombre de lits d'hôpitaux - Total
                                                 1          1           1           1          1               1            1           1          ...
population)                                                                                                                                                                    (pour 10 000)
Nurses - Total (per 10 000                                                                                                                                 Nombre d'infirmières - Total (pour
                                                 7          7           7           7          7               7            7           8          ...
population)                                                                                                                                                                          10 000)
Physicians - Total (per 10 000                                                                                                                             Nombre de médecins - Total (pour
                                                 2          2           2           2          2               2            2           2          ...
population)                                                                                                                                                                        10 000)
Public expenditure on Health (% of                                                                                                                       Dépenses publiques consacrées à la
                                                 5          7           5           5         10              12          12          14           ...
budget)                                                                                                                                                               santé (% du budget)


                                                                                                    African Statistical Yearbook 2011 / Annuaire Statistique pour l'Afrique 2011
Malawi                                                                                                                                                                       Malawi
                                                                     II NATIONAL ACCOUNTS — COMPTES NATIONAUX

                                                      2002          2003       2004       2005       2006        2007       2008       2009           2010

          Gross domestic product by kind of economic activity at current prices
                                                                                                         Produit intérieur brut par branche d'activité économique aux prix courants


          Kwacha(Millions)                                                                                                                                                    Kwacha(Millions)

          Agriculture                                 82 922        105 408    126 711    137 762    139 648     153 063    176 258    202 969             ...                            Agriculture

          Mining and quarrying                         7 763          8 974     10 731     11 468     11 827      19 384     22 321     25 704             ...                 Industries extractives

          Manufacturing                                9 488         10 969     13 116     14 017     14 455      23 691     27 281     31 415             ...            Industries manufacturières

          Electricity, gas & water                     4 890          5 966      7 124      8 742      7 851      12 868     14 818     17 063             ...                 Electricité, gaz et eau

          Construction                                 6 721          7 494      8 985      9 632      9 902      16 229     18 688     21 520             ...          Bâtiments et travaux publics
          Wholesale & retail trade,                   17 882         20 919     24 895     28 019     27 437      44 967     51 782     59 629             ...
                                                                                                                                                                     Commerce de gros et de détail,
          restaurants, hotels                                                                                                                                                 restaurants et hôtels
                                                                                                                                                                      Banques, assurances, affaires
          Finance, insurance, real estate, etc.       19 162         22 131     26 445     27 030     29 145      47 767     55 005     63 341             ...
                                                                                                                                                                                      immobilières
          Transport and communications                11 747         12 031     14 443     15 090     15 917      26 087     30 041     34 593             ...      Transport(s) et communications
                                                                                                                                                                        Administrations publiques et
          Public administration and defense           21 682         23 250     27 041     30 416     29 802      48 843     56 244     64 768             ...
                                                                                                                                                                                            défense
          Other services                              11 206         13 605     15 715     17 079     17 319      28 385     32 687     45 849             ...                        Autres services
                                                                                                                                                                     Moins Services d’intermédiation
          Less Imputed Service Charges                        ...        ...        ...        ...        ...         ...        ...        ...            ...
                                                                                                                                                                                           financière
          Gross domestic product at factor                                                                                                                       Produit intérieur brut aux couts des
                                                     193 464        230 747    275 207    299 256    303 305     421 283    485 125    566 852             ...
          cost / basic prices                                                                                                                                                  facteurs / prix de base

          Plus: Indirect Taxes / taxes on                                                                                                                        Plus taxes indirectes/impôts sur les
                                                      10 918          5 493     10 663      2 164     13 665      75 809     87 298    100 527             ...
          products, less subsidies                                                                                                                                   produits, moins les subventions


          Expenditure on Gross domestic product at current purchaser's values
                                                                                                                    Emploi du produit intérieur brut aux prix courants d'acquisition

          Kwacha(Millions)                                                                                                                                                    Kwacha(Millions)
                                                                                                                                                                           Consommation finale des
          Government final consumption                17 507         20 544     29 773     97 328    164 884     163 227    108 524    126 526             ...
                                                                                                                                                                           administrations publiques

          Private final consumption                  181 181        208 128    256 154    246 623    237 092     317 938    458 284    534 304             ...           Consommation finale privée

          Gross fixed capital formation               27 637         33 402     46 376     31 866     17 356      70 285    134 027    156 262             ...        Formation brute de capital fixe

          Increase in inventories                      5 345          7 003      5 695      6 589      7 483      14 735     15 933     18 576             ...                   Variation des stocks

          Exports of goods and services               42 517         63 068     71 353     68 750     66 148     132 707    133 320    155 435             ...     Exportations de biens et services
226                                                                                                                                                                   Moins importations de biens et
          Less imports of goods and services          69 805         95 904    123 480    149 737    175 993     201 800    277 665    323 724             ...
                                                                                                                                                                                            services
          GDP at purchasers' values                  204 382        236 240    285 870    301 420    316 970     497 092    572 423    667 379             ...             PIB aux prix d'acquisition


          Gross domestic product by kind of economic activity at constant
                                                                                                        Produit intérieur brut par branche d'activité economique aux prix constants
          prices
          Annual Growth Rates (%)                                                                                                                         Taux de croissance annuel (%)
          Agriculture                                    -2.1           3.9        2.8       -7.8       -2.5        12.3       11.3         ...            ...                            Agriculture

          Mining and quarrying                          -25.2          35.1       18.9       46.5        0.4         4.7        6.8         ...            ...                 Industries extractives

          Manufacturing                                  -0.1          16.9        3.0        4.3       42.2         3.6       12.2         ...            ...            Industries manufacturières

          Electricity, gas & water                        5.8           3.0       13.4        3.1        7.2         5.4        3.9         ...            ...                 Electricité, gaz et eau

          Construction                                    8.3           1.1        3.0       12.2      -24.2         9.2        8.1         ...            ...          Bâtiments et travaux publics
          Wholesale & retail trade,                                                                                                                                         Commerce de gros et de
                                                          1.6           3.2       14.4       13.7       11.1         4.6        8.2         ...            ...
          restaurants, hotels                                                                                                                                             détail,restaurants et hôtels
                                                                                                                                                                       Banques, assurances, affaires
          Finance, insurance, real estate, etc.           6.3           1.9        4.4        5.8       15.3         6.3        7.9         ...            ...
                                                                                                                                                                                       immobilières
          Transport and communications                   28.5           6.2        5.1       -6.2       11.0         5.8       22.5         ...            ...      Transport(s) et communications
                                                                                                                                                                        Administrations publiques et
          Public administartion and defense              13.5          -0.6       12.2        4.8       14.6         3.2        9.5         ...            ...
                                                                                                                                                                                            défense
          Other services                                  1.0           5.2        1.5       10.9       70.3       -25.2       -2.3         ...            ...                        Autres services
                                                                                                                                                                     Moins Services d’intérmediation
          Less Imputed Service Charges                    6.3          30.0       18.2       16.5        2.7         8.0        8.1         ...            ...
                                                                                                                                                                                           financière
          Gross domestic product at factor                                                                                                                       Produit intérieur brut aux couts des
                                                          2.9           3.8        4.8        1.6       15.3         1.8        9.5         ...            ...
          cost / basic prices                                                                                                                                                  facteurs / prix de base

          Plus: Indirect Taxes / taxes on                                                                                                                        Plus taxes indirectes/impôts sur les
                                                          2.8          34.4       12.7       21.6       13.7        16.7        5.3         ...            ...
          products, less subsidies                                                                                                                                   produits, moins les subventions

          Gross domestic product at market                                                                                                                         Produit intérieur brut aux prix du
                                                          2.9           5.7        5.4        3.3       15.2         3.3        9.0         ...            ...
          prices                                                                                                                                                                              marché


          2008: semi-final                2009: Provisional                                                                                       2008: semi-définitif            2009: provisoire


      African Statistical Yearbook 2011 / Annuaire Statistique pour l'Afrique 2011
Malawi                                                                                                                                                                  Malawi

Expenditure on Gross domestic product at constant purchasers'
                                                                                                        Emplois du produit intérieur brut aux prix constants d'acquisition
values

Annual Growth Rates (%)                                                                                                                    Taux de croissance annuel (%)
                                                                                                                                                             Consommation finale des
Government final consumption                29.3         6.0      22.2          4.1      21.7               5.4        7.7         ...      ...
                                                                                                                                                             administrations publiques

Private final consumption                     8.1        2.4        4.6         5.7        8.1              3.1        4.0         ...      ...            Consommation finale privée

Gross fixed capital formation               -20.5      21.2       34.5        38.3       50.0               0.5      23.6          ...      ...        Formation brute de capital fixe

Exports of goods and services                -1.0      37.0         4.2         0.6      28.0               0.0      21.2          ...      ...      Exportations de biens et services

                                                                                                                                                       Moins importations de biens et
Less imports of goods and services          28.3       21.5       11.4        22.1       22.1               0.0      13.1          ...      ...
                                                                                                                                                                             services


                                                                               III INFLATION

                                          2002       2003       2004        2005       2006             2007       2008       2009       2010
Annual Growth Rates (%)                                                                                                                    Taux de croissance annuel (%)
All Item                                    17.3         9.6      11.4        15.5       13.9               7.9        8.7        8.4      7.4                               Ensemble

Food                                        16.0         5.3        7.5       17.2       15.5               7.4        7.0        7.4      5.1                            Alimentation

Health                                         ...        ...        ...         ...        ...              ...        ...        ...      ...                                   Santé

Energy                                         ...        ...        ...         ...        ...              ...        ...        ...      ...                                 Energie

Transport                                   11.1       19.6       17.8        13.5       13.7             10.5       17.2       12.1      12.7                               Transport


                                                IV AGRICULTURAL PRODUCTION - PRODUCTION AGRICOLE

                                          2002       2003       2004        2005       2006             2007       2008       2009       2010
Tons (Thousand)                                                                                                                                                 Tonnes (milliers)
Maize, Tons (thousands)                    1 557      1 983      1 733       1 259      2 611            3 226      2 634      3 582        ...                  Maïs, tonnes (milliers)

Tobacco, Tons (thousands)                    137        117        180         145        155              117        195          ...      ...                Tabac, tonnes (milliers)

Tea, Tons (thousands)                         39         42         50          38         39               48         42         53        ...                  Thé, tonnes (milliers)

Sugar cane, Tons (thousands)                 261        194        259         267        273              216        149        209        ...         Cane à sucre, tonnes (milliers)

Rice, Tons (thousands)                        92         88         49          45         92              113        115        136        ...                   Riz, tonnes (milliers)


                                                      V MINING PRODUCTION - PRODUCTION MINIERE
                                                                                                                                                                                           227
                                          2002       2003       2004        2005       2006             2007       2008       2009       2010


Coal, metric tons (thousands)               62.9       81.4       51.8        51.9       60.4             58.6       60.6          ...      ... Houilles, tonnes métriques (milliers)

Gemstones, Kilograms                       174.0      190.0      190.0      1 994.0    2 171.0          3 710.0    3 718.0         ...      ...      Pierres précieuses (kilogrammes)


Cement, metric tons (thousands)            109.3      161.0      119.5       166.0      187.6            133.4      240.3      148.6        ... Ciments, tonnes métriques (milliers)


                                                                           VI ENERGY - ENERGIE

                                          2002       2003       2004        2005       2006             2007       2008       2009       2010

Electricity - total hydro production,                                                                                                              Électricité - production hydraulique
                                          1 177.5    1 203.0    1 329.3     1 390.1    1 421.7          1 473.0    1 621.3    1 577.9       ...
kilowatt hours (millions)                                                                                                                             totale, kilowatt-heures (millions)

Electricity - total thermal production,                                                                                                              Électricité - production thermique
                                              7.0        2.0        5.0         5.0        5.0              5.0        5.0        5.0       ...
kilowatt hours (millions)                                                                                                                             totale, kilowatt-heures (millions)

Electricity - total production, self-                                                                                                             Electricité - Production totale privée
                                              93         98         95          95         95               95         95         95        ...
producer (Million Kilowatt Hours)                                                                                                                           (million de kilowatt heures)

Electricity - total production, public                                                                                                                   Electricité - Production totale
                                           1 156      1 189      1 306       1 383      1 422            1 473      1 621      1 578        ...
(Million Kilowatt Hours)                                                                                                                          publique (million de kilowatt heures)


                                                                                                  African Statistical Yearbook 2011 / Annuaire Statistique pour l'Afrique 2011
Malawi                                                                                                                                                                       Malawi
                                                  VII TOURISM AND INFRASTRUCTURE - TOURISME ET INFRASTUCTURE

                                                   2002       2003        2004        2005        2006          2007       2008          2009       2010

         Arrivals - Tourists (thousands)           382.64         424     427.356     437.718     637.772          735         742            ...        ...           Arrivées - touristes (milliers)

         Rooms in hotels and similar                                                                                                                           Chambres d'hotels et établissements
         establishments (thousands)                                                                                                                                             assimilés (milliers)
                                                       59          21          21           ...         ...          ...         ...          ...        ...
         Paved Road (% of total)                       21          21          21          22          23           23          25           26          ...        Routes asphaltées (% du total)
         Total Network (Railways-km)               15 451      15 451      15 451      15 451      15 451       15 451      15 451       15 451          ...         Réseau total voies ferrées-Km
         Main Telephone Lines (per 1,000                                                                                                                           Lignes téléphoniques fixes (pour
                                                         7          9           9          10          10           12          12            ...        ...
         inhabitants)                                                                                                                                                              1000 habitants)
         Mobile Cellular Subscribers (per                                                                                                                          Abonnés aux téléphones mobiles
                                                        9          12          22          43          43           73         120            ...        ...
         1,000 inhabitants)                                                                                                                                                 (pour 1000 habitants)


                                   VII FINANCIAL AND MONETARY STATISTICS - FINANCES ET STATISTIQUES MONETAIRES

                                                   2002       2003        2004        2005        2006          2007       2008          2009       2010

         VII-1 Monetary Statistics                                                                                                                        VII-1 Statistiques monétaires
         Kwacha(Millions)                                                                                                                                                    Kwacha(Millions)
         Money supply (M1)                         13 979      17 763      25 723      31 303      35 689       50 730      70 597       81 900          ...                 Masse monétaire (M1)
         Quasi-money                               14 114      18 048      20 725      22 691      27 170       35 130      69 047       92 132          ...                         Quasi-monnaie
           of which Demand Deposit                      ...         ...         ...         ...         ...          ...         ...          ...        ...              dont Monnaie scripturale
         Net foreign assets                         3 397       4 454       6 107      11 460      19 300       28 034      19 667       - 2 279         ...                  Avoirs extérieurs nets
         Domestic credit                           23 755      28 783      36 550      41 210      47 100       56 997     157 107      213 802          ...                         Crédit intérieur

         of which claims on private sector          7 363       9 809      13 926      17 502      27 747       33 988      68 144       95 044          ...     dont créances sur le secteur privé

         of which Claims on government                                                                                                                                  dont créances nettes sur le
                                                   15 711      18 694      22 322      23 399      18 121       19 164      82 919      112 517          ...
         sector, net                                                                                                                                                                gouvernement
         International reserves (millions of US                                                                                                                Réserves internationales (millions de
                                                      161         122         128         159         134          217         243          149          ...
         $)                                                                                                                                                                                    $ EU)
         Average Exchange Rate (National                                                                                                                        Taux de change (moyen) (monnaie
                                                    76.69       97.43      108.90      118.42      136.01       139.96      140.52       141.17          ...
         Currency per us $)                                                                                                                                                 nationale par dollars)


         VII-2 Public Finance                                                                                                                                      VII-2 Finances publiques
         Kwacha(Millions)                                                                                                                                                    Kwacha(Millions)
         Total Revenues and Grants                 31 997      42 684      65 817      84 926     119 965      147 632     164 554      208 072     257 661                Recettes totales et dons
           Tax Revenue                             20 382      27 251      36 902      49 798      59 884       77 321      96 387      107 300     143 400                        Recettes fiscales
           Non Tax Revenue                          2 471       4 758       5 852       7 011       7 431        6 974       8 567       10 867      25 373                   Recettes non fiscales

228        Grants                                   9 144      10 675      23 063      28 117      52 650       63 337      59 600       89 905      88 888                                    Dons

         Total Expenditures and Net Lending        42 491      61 321      80 535      97 216     120 009      153 580     179 288      231 219     266 357          Dépenses totales et prêts nets

           Current expenditure                     20 312      31 057      32 102      38 491      56 354       60 076      73 146      115 246     123 317                    Dépenses courantes
           Of which Wages and Salaries              9 201      10 930      12 337      17 056      20 209       23 778      30 018       37 256      43 540          Dont rémunérations et salaires
           Capital expenditure                      9 816      11 787      20 999      24 969      26 263       53 665      63 775       57 219      77 447                Dépenses d'équipement
           Net Lending                                  0          61           0         589            0         452       - 108             0      1 000                               Prêts nets
         Fiscal Balance                           - 10 494    - 18 637    - 14 718    - 12 290       - 44       - 5 948    - 14 734     - 23 147    - 8 696         Solde global y compris les dons


         VII-3 Balance of Payments                                                                                                                             VII-3 Balance des paiements
         Kwacha(Millions)                                                                                                                                                    Kwacha(Millions)
         Trade balance                            - 13 895    - 24 400    - 33 889    - 59 369    - 67 499     - 75 753    - 67 316     - 88 566         ...                  Balance commerciale
         Services Balance                         - 12 680    - 14 545    - 18 522    - 25 384    - 28 120     - 32 230    - 33 579     - 33 666         ...                   Balance des services
         Net Income                                - 2 794     - 3 268     - 4 993     - 5 162     - 4 561      - 2 974     - 3 048      - 5 407         ...                           Revenus nets
         Current transfers, net total                 623         611       1 889       9 227      10 600       10 908      11 226       10 738          ...                    Transferts courants
         Current account balance                  - 28 746    - 41 603    - 55 514    - 80 689    - 89 580    - 100 049    - 92 717    - 116 901         ...              Solde du compte courant


         VII-4 External Debt and Financial Flows                                                                                               VII-4 Dette extérieure et flux financiers
         US $(Millions)                                                                                                                                                         $ E.U(Millions)
         Total external debt                        2 857       2 904       2 956       2 969         452          518         683          900       1 010                  Dette extérieure totale
           Private                                      0           0           0            0           0            0           0            0          0                                   Privée
           Public                                   2 857       2 904       2 956       2 969         452          518         683          900       1 010                                Publique
         Total external debt service                   85          95         103         103          86           16          13           12         13            Service de la dette extérieure
         Net Foreign Direct Investment                                                                                                                         Investissements étranger direct (flux
                                                       17          66         108          52          72           92         170           60         13
         Inflows                                                                                                                                                                     nets entrants)
         Net Total Official Development                                                                                                                           Aide publique au développement
                                                      378         518         506         573         698          744         924          772         13
         assistance                                                                                                                                                                  (nette totale)


      African Statistical Yearbook 2011 / Annuaire Statistique pour l'Afrique 2011
Malawi                                                                                                                                      Malawi

                     2002       2003       2004       2005       2006            2007       2008        2009      2010

Kwacha(Millions)                                                                                                                                Kwacha
Exports, fob                                                                                                                       Exportations, fàb


Exports - Total      31 713     42 252     54 420     59 733     73 804          99 804    123 399     166 551       ...              Exportations - Total


Main Products                                                                                                                      Principaux produits


Tobacco              17 893     24 191     22 303     31 621     55 839          59 224     82 095     106 149       ...                            Tabac


Tea                   2 828      3 481      5 132      5 914      6 737           7 811      5 157       9 837       ...                              Thé


Sugar                 2 684     10 571      7 881      5 409      6 153           8 480      7 341       9 779       ...                             Sucre


Cotton                  261        582      2 224      1 847      1 832           3 091      3 070       3 320       ...                            Coton


Nuts                    378      1 132      1 581      1 489      3 189           3 347      1 503       3 915       ...                              Noix

Main Destinations                                                                                                             Principales destinations

South Africa        48 847.3    7 864.8    7 787.6   11 349.9   20 216.8        18 019.4   11 379.8    15 359.2      ...                   Afrique du Sud


USA                  4 665.7    6 393.4    5 946.3    6 540.1    7 386.1        85 072.1   87 934.5   118 684.6      ...                        Etats-Unis


Germany              3 321.0    3 654.7    3 973.7    4 502.8    9 525.4         6 980.9    7 215.8     9 739.1      ...                        Allemagne


UK                   2 905.0    3 821.6    5 205.9    6 834.1   12 136.9         8 000.5    8 269.7    11 161.5      ...                     Royaume-Uni


Japan                1 238.0    2 879.9    1 134.2    1 015.8     464.1           631.0      750.3      1 012.6      ...                            Japon


                     2002       2003       2004       2005       2006            2007       2008        2009      2010
Imports, cif                                                                                                                        Importations, cif

Imports - Total      53 657     76 650    101 555    140 179    162 505         156 387    278 477     255 118       ...    Importations - Total (millions)   229

                                                                                                                                   Principaux produits
Main Products


Fertilizer            3 710      4 556      6 980     15 386      8 550          26 509     51 288      23 795       ...                           Engrais


Diesel and other      2 574      4 211      5 954      7 868      9 742          11 427     16 412      14 170       ...                  Diesel et autres


Petrol                1 828      2 761      3 500      3 389      4 389           6 011      8 198       7 957       ...                          Essence


Paraffin                434        664        859      1 137        942           1 317      1 521       1 149       ...                         Paraffine


Coal                     91         86        221        235        163             120        102       1 248       ...                          Charbon


Main Origin                                                                                                                   Principales provenances

South Africa        22 272.3   30 621.4   32 047.5   45 224.4   59 304.7        55 537.9   78 484.1    71 900.7      ...                   Afrique du Sud

Zimbabwe             3 117.6    4 996.3    4 807.2   10 704.3    5 529.4         7 168.2    5 050.1     4 626.5      ...                        Zimbabwe

UK                   2 805.7    4 078.6    5 249.5    6 571.8    9 623.3         9 010.9   30 447.3    27 893.3      ...                     Royaume-Uni

Japan                1 596.6    3 202.4    3 914.0    1 570.9    1 476.5         2 080.1    4 049.8     3 710.1      ...                            Japon

Germany               504.1     1 099.1    1 112.3    3 903.3    2 592.8         3 419.1    6 656.7     6 098.3      ...                        Allemagne


                                                                           African Statistical Yearbook 2011 / Annuaire Statistique pour l'Afrique 2011
Mali                                                                                                                                                                             Mali

         AREA (KM 2)                                                                                  1 240 192                                                            SUPERFICIE (KM 2)
         CAPITAL CITY                             Bamako                                                                                      Bamako                                   CAPITALE
         CURRENCY                                 CFA Franc                                                                                 Franc CFA                                  MONNAIE


                                 I SOCIAL AND DEMOGRAPHIC INDICATORS — INDICATEURS DEMOGRAPHIQUES ET SOCIAUX

                                                    2002        2003        2004        2005        2006        2007        2008        2009       2010
         Population                                                                                                                                                                 Population
                                                                                                                                                                Population au milieu de l'année -
         Mid-year population - Total (Million)         10.8        11.1        11.4        11.7        12.1        12.4        12.7        14.5       ...
                                                                                                                                                                                   Total (million)
                                                                                                                                                                Population au milieu de l'année -
         Mid-year population - Urban (%)               29.4        30.1        30.8        31.6        32.4        33.1        33.9        33.9       ...
                                                                                                                                                                                   Urbaine (%)

         Female (%)                                    50.5        50.5        50.5        50.5        50.5        50.5        50.5        50.5       ...                             Femme (%)


         Population by Age Group                                                                                                                                    Population par groupe d'âge


            0-14                                   5298 604    5444 498    5595 546    5748 885    5905 000    6064 730    6228 780    7113 402       ...                                     0-14


            15-64                                  5136 402    5277 830    5424 254    5572 899    5724 235    5879 075    6038 103    6895 660       ...                                    15-64


            65+                                     378 472     388 893     399 682     410 635     421 786     433 195     444 913     508 101       ...                                     65+


         Active Population (000)                    4 287.3     4 405.4     4 527.6     4 651.7     4 778.0     4 907.2     5 040.0     5 176.3       ...                 Population active (000)

            Female (%)                                   ...         ...         ...       34.4        34.4        34.4        34.4        34.4       ...                             Femme (%)

                                                                                                                                                               Taux brut de natalité - Total (par
         Crude birth rate - Total (per 1000)             ...         ...         ...       42.5        42.1        41.9        41.7        44.4       ...
                                                                                                                                                                                           1000)
                                                                                                                                                             Taux brut de mortalité - Total (par
         Crude death rate - Total (per 1000)             ...         ...         ...       11.6        11.3        10.9        10.6        10.4       ...
                                                                                                                                                                                          1000)
         Life expectancy at birth - Total                                                                                                                      Espérance de vie à la naissance -
                                                         ...         ...         ...       57.8        58.3        58.8        59.3        59.8       ...
         (years)                                                                                                                                                                 Total (années)
         Net reproduction rate - (per                                                                                                                           Taux net de reproduction - (par
                                                         ...         ...         ...        2.4          ...         ...         ...         ...      ...
         woman)                                                                                                                                                                         femme)
                                                                                                                                                               Indice synthétique de fécondité -
         Total fertility rate - (p woman)
                       y        (per    )               6.8         6.8         6.8         6.8         6.6         6.6         6.6         6.6       ...
                                                                                                                                                                                   (par femme)

         Education                                                                                                                                                             Enseignement

         Teaching staff at first level - Total                                                                                                               Personnel enseignant - 1er degré -
                                                      29.65        30.3        31.6        40.6        40.6        44.0        46.9        50.5       ...
         (thousands)                                                                                                                                                            Total (milliers)
         Teaching staff at second level - Total                                                                                                             Personnel enseignant - 2ème degré -
                                                       2.37         2.9         3.0         2.6         2.7         4.2         5.7         7.2       ...
230      (thousands)                                                                                                                                                             Total (milliers)
         Teaching staff at third level - Total                                                                                                              Personnel enseignant - 3ème degré -
                                                        0.9         1.0         1.0         0.8         0.6         0.6         0.5         1.3       ...
         (thousands)                                                                                                                                                             Total (milliers)
         First level student enrollment - Total                                                                                                                Elèves inscrits - 1er degré - Total
                                                      1 452       1 532       1 665       1 823       1 963       2 105       2 245       2 388       ...
         (thousands)                                                                                                                                                                     (milliers)
         First level student enrollment -                                                                                                                   Elèves inscrits - 1er degré - Femmes
                                                       520         553         602         654         709         763         977        1 039       ...
         Female (thousands)                                                                                                                                                               (milliers)
         Second level student enrollment -                                                                                                                   Elèves inscrits - 2ème degré - Total
                                                        96          69          64         116         125         146         155         148        ...
         Total (thousands)                                                                                                                                                              (milliers)
         Second level student enrollment -                                                                                                                         Elèves inscrits - 2ème degré -
                                                         ...         ...         ...         ...         ...         ...         ...         ...      ...
         Female (thousands)                                                                                                                                                    Femmes (milliers)
         Third level student enrollment - Total                                                                                                              Elèves inscrits - 3ème degré - Total
                                                       27.4        30.9        28.3        28.5        38.6        50.7        56.8        63.6       ...
         (thousands)                                                                                                                                                                    (milliers)
         Third level student enrollment -                                                                                                                          Elèves inscrits - 3ème degré -
                                                        7.5         8.7         7.9         8.0         9.5        12.5        14.5        16.0       ...
         Female (thousands)                                                                                                                                                    Femmes (milliers)
         Public expenditure on education (%                                                                                                                    Dépenses publiques consacrées à
                                                       11.6        13.9        15.1        15.4        16.9        16.8        16.8          ...      ...
         of budget)                                                                                                                                              l'enseignement (% du budget)

         Health                                                                                                                                                                            Santé

         Hospital beds - Total (per 10 000                                                                                                                     Nombre de lits d'hôpitaux - Total
                                                        15          15          14          13          14          13          13          13        ...
         population)                                                                                                                                                              (pour 10 000)
         Nurses - Total (per 10 000                                                                                                                           Nombre d'infirmières - Total (pour
                                                        12          11          11          11          20          20          20          20        ...
         population)                                                                                                                                                                    10 000)
         Physicians - Total (per 10 000                                                                                                                       Nombre de médecins - Total (pour
                                                          1          1           1           1           1            1           1           1       ...
         population)                                                                                                                                                                  10 000)
         Public expenditure on Health (% of                                                                                                                 Dépenses publiques consacrées à la
                                                          7          7           7           7          10          11          11          11        ...
         budget)                                                                                                                                                         santé (% du budget)


      African Statistical Yearbook 2011 / Annuaire Statistique pour l'Afrique 2011
Mali                                                                                                                                                                     Mali
                                                        II NATIONAL ACCOUNTS — COMPTES NATIONAUX

                                           2002         2003      2004     2005    2006       2007         2008        2009         2010

Gross domestic product by kind of economic activity at current prices
                                                                                     Produit intérieur brut par branche d'activité économique aux prix courants


CFA Franc (Billions)                                                                                                                                 Franc CFA (Milliards)

Agriculture                                     666       865       901    1 001   1 064        1 115        1 412       1 486       1 642                            Agriculture

Mining and quarrying                            239       182       162      205     240         229           242         284         256                 Industries extractives

Manufacturing                                   171       155       248      262     259         236           207         219         230            Industries manufacturières

Electricity, gas & water                         37        40        43       50      60          66            75             83       91                 Electricité, gaz et eau

Construction                                    119       118       116      125     145         169           191         216         238          Bâtiments et travaux publics
Wholesale & retail trade,                                                                                                                        Commerce de gros et de détail,
                                                274       315       323      364     421         490           560         611         658
restaurants, hotels                                                                                                                                       restaurants et hôtels
                                                                                                                                                  Banques, assurances, affaires
Finance, insurance, real estate, etc.            17        18        19       25      27          27            30             32       33
                                                                                                                                                                  immobilières
Transport and communications                     97       105       115      131     156         192           221         233         247      Transport(s) et communications
                                                                                                                                                    Administrations publiques et
Public administration and defense               249       275       289      309     325         332           359         378         399
                                                                                                                                                                        défense
Other services                                  157       162       168      201     216         237           263         284         300                        Autres services
                                                                                                                                                 Moins Services d’intermédiation
Less Imputed Service Charges                    - 12      - 12     - 13     - 14    - 14         - 13         - 15        - 15        - 16
                                                                                                                                                                       financière
Gross domestic product at factor                                                                                                             Produit intérieur brut aux couts des
                                               2 012     2 223    2 372    2 660   2 899        3 079        3 545       3 810       4 078
cost / basic prices                                                                                                                                        facteurs / prix de base

Plus: Indirect Taxes / taxes on                                                                                                              Plus taxes indirectes/impôts sur les
                                                211       231       260      234     303         345           368         423         480
products, less subsidies                                                                                                                         produits, moins les subventions


Expenditure on Gross domestic product at current purchaser's values
                                                                                                 Emploi du produit intérieur brut aux prix courants d'acquisition

CFA Franc( Billions)                                                                                                                                 Franc CFA (Milliards)
                                                                                                                                                       Consommation finale des
Government final consumption                    368       445       473      490     553         597           688         734         788
                                                                                                                                                       administrations publiques

Private final consumption                      1 510     1 554    1 797    1 995   2 091        2 215        2 495       2 633       2 812           Consommation finale privée

Gross fixed capital formation                   440       443       447      447     529         664           716         862         968        Formation brute de capital fixe

Increase in inventories                         - 74      197       131      190     123          74            75             37       58                   Variation des stocks

Exports of goods and services                   660       670       643      724     958         996           896         914       1 037     Exportations de biens et services
                                                                                                                                                  Moins importations de biens et     231
Less imports of goods and services              681       855       858      953   1 053        1 122          957         947       1 104
                                                                                                                                                                        services
GDP at purchasers' values                      2 223     2 454    2 632    2 894   3 201        3 425        3 913       4 233       4 558             PIB aux prix d'acquisition


Gross domestic product by kind of economic activity at constant
                                                                                    Produit intérieur brut par branche d'activité economique aux prix constants
prices
Annual Growth Rates (%)                                                                                                                Taux de croissance annuel (%)
Agriculture                                     -3.2      19.5      -4.1     6.6     4.3          2.5         13.2         5.6         7.7                            Agriculture

Mining and quarrying                            22.5     -18.8     -15.2    19.3    17.8         -8.4         -6.4         1.5       -16.2                 Industries extractives

Manufacturing                                   24.2      -5.6     19.0      0.3     0.9        -12.0        -14.4         1.0         2.6            Industries manufacturières

Electricity, gas & water                        15.1      11.0     11.6     10.2    10.0          9.7         10.0        10.0        10.0                 Electricité, gaz et eau

Construction                                     4.4       4.4      8.0      4.0     3.0          8.7          4.5         6.0         7.0          Bâtiments et travaux publics
Wholesale & retail trade,                                                                                                                               Commerce de gros et de
                                                -1.6       9.2      6.1      1.4    14.0         12.0          4.4         4.5         5.4
restaurants, hotels                                                                                                                                   détail,restaurants et hôtels
                                                                                                                                                   Banques, assurances, affaires
Finance, insurance, real estate, etc.            0.3       7.7     10.7     -0.5     6.0          5.0          2.0         3.5         3.5
                                                                                                                                                                   immobilières
Transport and communications                    -2.7      10.6     14.7     14.8    16.0         20.9         10.0         1.9         5.0      Transport(s) et communications
                                                                                                                                                    Administrations publiques et
Public administartion and defense                4.1       3.5      3.9      7.3     2.5          1.2          2.0         1.9         3.0
                                                                                                                                                                        défense
Other services                                   3.3       4.9      7.8     -0.3     4.0          8.0          1.0         5.3         4.0                        Autres services
                                                                                                                                                 Moins Services d’intérmediation
Less Imputed Service Charges                     1.3       7.8     11.2      0.0     4.3        -12.3          5.5         4.0         5.0
                                                                                                                                                                       financière
Gross domestic product at factor                                                                                                             Produit intérieur brut aux couts des
                                                 3.5       7.2      1.7      6.2     7.2          3.9          5.5         4.4         4.5
cost / basic prices                                                                                                                                        facteurs / prix de base

Plus: Indirect Taxes / taxes on                                                                                                              Plus taxes indirectes/impôts sur les
                                                14.5      12.5      8.8      5.6    -15.0         9.5         -2.0         5.9         4.3
products, less subsidies                                                                                                                         produits, moins les subventions

Gross domestic product at market                                                                                                               Produit intérieur brut aux prix du
                                                 4.3       7.6      2.3      6.1     5.3          4.3          5.0         4.5         4.5
prices                                                                                                                                                                    marché


2008: semi-final           2009: Provisional     2010:Estimated                                         2008: semi-définitif        2009: provisoire             2010:Estimée


                                                                                        African Statistical Yearbook 2011 / Annuaire Statistique pour l'Afrique 2011
Mali                                                                                                                                                                        Mali

         Expenditure on Gross domestic product at constant purchasers'
                                                                                                              Emplois du produit intérieur brut aux prix constants d'acquisition
         values

         Annual Growth Rates (%)                                                                                                                  Taux de croissance annuel (%)
                                                                                                                                                                    Consommation finale des
         Government final consumption                   2.4       18.5        7.8        2.8         9.7         4.3         8.0         3.0      5.0
                                                                                                                                                                    administrations publiques

         Private final consumption                     -0.8       -3.4       15.5       -4.6         3.2         4.5         1.9         3.1      4.0             Consommation finale privée

         Gross fixed capital formation                  0.3        7.0        7.9        6.4         4.0        15.2        -0.8        13.3      7.7         Formation brute de capital fixe

         Exports of goods and services                 20.3        1.0       -6.2       12.3         1.3         0.5       -13.0         1.0      5.0       Exportations de biens et services

                                                                                                                                                              Moins importations de biens et
         Less imports of goods and services            -8.3        3.4       -0.9        1.4         1.8         1.2       -19.1        -3.4      6.0
                                                                                                                                                                                    services


                                                                                        III INFLATION

                                                    2002       2003       2004       2005        2006        2007        2008        2009       2010
         Annual Growth Rates (%)                                                                                                                  Taux de croissance annuel (%)
         All Item                                       5.1       -1.3       -3.1        6.3         1.6         1.4         9.2         2.2      1.2                               Ensemble

         Food                                           7.1       -4.1       -7.0      11.4          0.0         1.9       13.0          4.3      3.4                            Alimentation

         Health                                         5.0      10.1         8.5       -2.9         0.6         0.7         1.0         5.8     -0.9                                   Santé

         Energy                                         6.8       -0.2       -1.6       -2.3         2.4         2.0         5.2         0.6     -2.8                                  Energie

         Transport                                      2.1        4.2        3.1        7.7         6.5         2.1         4.6        -2.1      2.1                               Transport


                                                          IV AGRICULTURAL PRODUCTION - PRODUCTION AGRICOLE

                                                    2002       2003       2004       2005        2006        2007        2008        2009       2010
         Tons (Thousand)                                                                                                                                               Tonnes (milliers)
         Cotton seed, Tons (thousands)                 571        440        621        590         417         242         210         246        ...     Graines de coton, tonnes (milliers)

         Rice, Tons (thousands)                        940        710        967        851         946       1 003       1 608       1 704        ...            Riz paddy, tonnes (milliers)

         Millet, Tons (thousands)                      793        795      1 123        975       1 158       1 217       1 364       1 441        ...                   Mil, tonnes (milliers)

         Sorghum, Tons (thousands)                     518        642        764        673         629         661       1 049       1 107        ...               Sorgho, tonnes (milliers)

         Maize, Tons (thousands)                       365        455        460        635         707         690         740         839        ...                  Maïs, tonnes (milliers)


                                                                V MINING PRODUCTION - PRODUCTION MINIERE
232
                                                    2002       2003       2004       2005        2006        2007        2008        2009       2010

         Gold ores and concentrates                                                                                                                               Minerais d'or et concentrés
                                                   66 068.0   53 597.0   44 311.7   52 120.4    61 346.0    55 600.0    51 900.0    49 500.0       ...
         (Kilograms)                                                                                                                                                           (Kilogrammes)
         Silver ores and concentrates               3 000.0    3 000.0    3 000.0         ...         ...         ...         ...         ...      ...        Minerais d'argent et concentrés
         (Kilograms)                                                                                                                                                           (Kilogrammes)
         Salt and pure sodium chloride,                                                                                                                        Sel et chlorure de sodium pur,
                                                        6.0        6.0        6.0        6.0         6.0         6.0          ...         ...      ...
         metric tons (thousands)                                                                                                                                   tonnes métriques (milliers)


                                                                                    VI ENERGY - ENERGIE

                                                    2002       2003       2004       2005        2006        2007        2008        2009       2010

         Electricity - total hydro production,                                                                                                            Électricité - production hydraulique
                                                     238.0      236.0      250.0      258.0       266.0       271.0           ...         ...      ...
         kilowatt hours (millions)                                                                                                                           totale, kilowatt-heures (millions)

         Electricity - total thermal production,                                                                                                            Électricité - production thermique
                                                     179.0      213.0      215.0      217.0       211.0       211.0       211.0       211.0        ...
         kilowatt hours (millions)                                                                                                                           totale, kilowatt-heures (millions)

         Electricity - total production, self-                                                                                                           Electricité - Production totale privée
                                                        45         45         45         45          33          33          33          33        ...
         producer (Million Kilowatt Hours)                                                                                                                         (million de kilowatt heures)

         Electricity - total production, public                                                                                                                 Electricité - Production totale
                                                       372        404        420        430         444         449           ...         ...      ...
         (Million Kilowatt Hours)                                                                                                                        publique (million de kilowatt heures)


      African Statistical Yearbook 2011 / Annuaire Statistique pour l'Afrique 2011
Mali                                                                                                                                                                                          Mali
                                         VII TOURISM AND INFRASTRUCTURE - TOURISME ET INFRASTUCTURE

                                           2002         2003         2004         2005         2006            2007         2008         2009         2010

Arrivals - Tourists (thousands)            95.851      110.365      120.141      139.448       152.66         163.826      189.508       65.957            ...           Arrivées - touristes (milliers)

Rooms in hotels and similar                                                                                                                                      Chambres d'hotels et établissements
establishments (thousands)                                                                                                                                                        assimilés (milliers)
                                                3            4            5            5            6               ...          ...          ...          ...
Paved Road (% of total)                        17           22           30           26           25              20           30           32            ...        Routes asphaltées (% du total)
Total Network (Railways-km)                19 342       15 519       11 043       13 027       14 784          18 515       12 729       12 229            ...         Réseau total voies ferrées-Km
Main Telephone Lines (per 1,000                                                                                                                                      Lignes téléphoniques fixes (pour
                                                 5           6            6            7            8                8            7            7           ...
inhabitants)                                                                                                                                                                         1000 habitants)
Mobile Cellular Subscribers (per                                                                                                                                     Abonnés aux téléphones mobiles
                                                 4          23           39           72          143             240          327          365            ...
1,000 inhabitants)                                                                                                                                                            (pour 1000 habitants)


                          VII FINANCIAL AND MONETARY STATISTICS - FINANCES ET STATISTIQUES MONETAIRES

                                           2002         2003         2004         2005         2006            2007         2008         2009         2010

VII-1 Monetary Statistics                                                                                                                                   VII-1 Statistiques monétaires
CFA Franc (Millions)                                                                                                                                                       Franc CFA (Millions)
Money supply (M1)                         486 060      614 191      569 671      642 376      694 478         704 150      734 908      800 453      863 049                   Masse monétaire (M1)
Quasi-money                               136 997      173 357      197 103      199 543      197 850         310 612      264 404      344 368      341 325                           Quasi-monnaie
  of which Demand Deposit                       ...          ...          ...          ...          ...             ...          ...          ...          ...              dont Monnaie scripturale
Net foreign assets                        310 313      444 542      393 944      439 769      548 176         565 170      524 423      769 405      730 517                    Avoirs extérieurs nets
Domestic credit                           384 446      409 802      455 845      489 589      418 424         489 914      516 194      453 007      545 632                           Crédit intérieur

of which claims on private sector         412 223      482 943      515 550      515 983      527 756         619 161      671 225      740 711      782 677       dont créances sur le secteur privé

of which Claims on government                                                                                                                                             dont créances nettes sur le
                                          - 27 776     - 73 141     - 59 705     - 26 394    - 109 333       - 129 247    - 155 031    - 287 704    - 237 045
sector, net                                                                                                                                                                           gouvernement
International reserves (millions of US                                                                                                                           Réserves internationales (millions de
                                              594          952          861          855          970           1 087        1 072        1 604        1 295
$)                                                                                                                                                                                               $ EU)
Average Exchange Rate (National                                                                                                                                   Taux de change (moyen) (monnaie
                                           696.99       581.20       528.29       527.47       522.89          479.27       447.81       472.19       495.28
Currency per us $)                                                                                                                                                            nationale par dollars)


VII-2 Public Finance                                                                                                                                                 VII-2 Finances publiques
CFA Franc (Millions)                                                                                                                                                       Franc CFA (Millions)
Total Revenues and Grants                 423 000      496 700      515 300      576 300     1 740 600        668 300      741 500      901 200      951 800                 Recettes totales et dons
  Tax Revenue                             306 000      349 100      393 300      446 200      470 200         487 200      586 100      603 400      674 400                         Recettes fiscales
  Non Tax Revenue                          31 200       35 200       18 700       15 100       25 900          22 200       21 200       26 000       26 900                    Recettes non fiscales
  Grants                                   85 800      112 400      103 300      115 000     1 244 500        158 900      134 200      200 300      179 000                                     Dons      233
Total Expenditures and Net Lending        540 500      551 500      625 700      712 700      768 600         845 500      828 200     1 099 100    1 126 500          Dépenses totales et prêts nets

  Current expenditure                     236 200      251 300      300 800      324 020      340 700         384 600      417 300      626 100      672 000                     Dépenses courantes
  Of which Wages and Salaries              93 500      106 200      121 700      137 800      147 900         162 800      186 000      217 100      235 700           Dont rémunérations et salaires
  Capital expenditure                     203 000      201 600      242 200      268 100      329 400         395 600      294 900      462 000      443 200                 Dépenses d'équipement
  Net Lending                              - 4 900      - 3 900      - 9 000      22 700       - 6 000        - 47 600       7 600       11 000       11 300                                Prêts nets
Fiscal Balance                           - 117 500     - 54 800    - 110 400    - 136 400     972 000        - 177 200     - 86 700    - 197 900    - 174 700         Solde global y compris les dons


VII-3 Balance of Payments                                                                                                                                        VII-3 Balance des paiements
CFA Franc (Millions)                                                                                                                                                       Franc CFA (Millions)
Trade balance                             113 370      - 35 160     - 61 515     - 76 265      39 201        - 138 860    - 284 672    - 121 400    - 207 600                   Balance commerciale
Services Balance                         - 151 667    - 149 936    - 153 552    - 165 492    - 188 863       - 191 654    - 255 227    - 212 400    - 285 700                    Balance des services
Net Income                               - 167 410     - 92 948    - 102 931    - 109 159    - 134 643       - 139 679    - 139 986    - 170 700    - 169 400                            Revenus nets
Current transfers, net total              101 987      120 554      101 946      120 033      169 999         191 680      203 697      194 600      203 100                      Transferts courants
Current account balance                  - 103 720    - 157 490    - 216 052    - 230 883    - 114 306       - 278 513    - 476 188    - 309 900    - 459 600               Solde du compte courant


VII-4 External Debt and Financial Flows                                                                                                        VII-4 Dette extérieure et flux financiers
US $ (Millions)                                                                                                                                                                   $ E.U (Millions)
Total external debt                         1 746        1 556        1 639        1 617          629             851          810          932            ...                 Dette extérieure totale
  Private                                       0            0            0            0            0                0            0            0           ...                                  Privée
  Public                                    1 746        1 556        1 639        1 617          629             851          810          932            ...                               Publique
Total external debt service                    16           15           16           16           14              11           13           13           15            Service de la dette extérieure
Net Foreign Direct Investment                                                                                                                                    Investissements étranger direct (flux
                                              258           94           99          167           95             133          218          310          212
Inflows                                                                                                                                                                                nets entrants)
Net Total Official Development                                                                                                                                      Aide publique au développement
                                              480          559          588          704          824           1 020          964            ...          ...
assistance                                                                                                                                                                             (nette totale)


                                                                                                         African Statistical Yearbook 2011 / Annuaire Statistique pour l'Afrique 2011
Mali                                                                                                                                                                    Mali

                                           2002        2003         2004         2005         2006         2007         2008         2009       2010

         CFA Franc (Millions)                                                                                                                                               Franc CFA
         Exports, fob                                                                                                                                             Exportations, fàb


         Exports - Total                  609 944     539 262      515 835      580 673      810 671      745 860      939 129      918 200          ...             Exportations - Total


         Main Products                                                                                                                                            Principaux produits


         Gold                             402 563     330 073      270 567      355 504      587 486      515 178      645 871      637 400     724 700                                Or


         Cotton                           130 946     194 850      181 355      139 656      141 027      110 889       91 921       62 750      81 200                            Coton


         Live Animals                      27 327      24 533       22 905       27 829       30 204       37 601       51 800       41 200      44 200                  Animaux vivants


                                               ...          ...          ...          ...          ...          ...          ...          ...        ...


                                               ...          ...          ...          ...          ...          ...          ...          ...        ...

         Main Destinations                                                                                                                                   Principales destinations

         Switzerland                    354 646.0    339 808.0    110 692.0    173 400.0     11 767.0     31 200.0     22 120.0     62 460.7         ...                           Suisse


         South Africa                     1 258.0     10 164.0    164 564.0    199 497.0    563 451.0    459 740.0    624 733.0    573 085.2         ...                  Afrique du Sud


         Senegal                         21 912.0     16 735.0     32 573.0     39 225.0     21 103.0     29 085.0     58 914.0     47 988.6         ...                         Sénégal


         Ivory Coast                     18 290.0     13 345.0     24 567.0      7 433.0      9 794.0     17 122.0     22 084.0     16 346.8         ...                    Côte d'Ivoire


         China                            1 354.0      6 447.0     24 743.0     33 191.0     49 124.0     15 255.0     15 947.0     14 987.2         ...                            Chine


                                           2002        2003         2004         2005         2006         2007         2008         2009       2010
         Imports, cif                                                                                                                                              Importations, cif

234      Imports - Total                  639 873     727 980      732 777      825 063      950 997     1 088 051    1 489 974    1 176 904         ...   Importations - Total (millions)


                                                                                                                                                                  Principaux produits
         Main Products


         Petroleum Products               112 893     130 275      152 155      196 047      232 987      241 533      318 041      256 700     359 000                Produits petroliers


         Building Materials                79 694      98 669      107 483      109 593      132 298      157 468      232 510      207 600     243 400       Matériaux de constructions


         Chemical products
                                          129 146     127 010      111 935      116 006      116 848      149 272      190 709      152 600     176 500               Produits chimiques


         Vehicles and machinery           153 091     196 727      157 876      148 856      209 204      263 311      376 608      261 000     328 400            Véhicules et machines


         Food                              82 740     124 346       98 125      130 771      171 959      161 105      186 302      181 900     198 200             Produits alimentaires


         Main Origin                                                                                                                                         Principales provenances

         France                         119 676.0    133 286.0    114 440.0    102 337.0    102 822.0    156 292.0    207 107.0    133 561.2         ...                          France

         Senegal                         61 709.0     73 330.0     88 016.0     93 365.0    115 366.0    207 269.0    256 691.0    162 307.2         ...                         Sénégal

         Ivory Coast                    138 530.0     64 566.0     67 473.0     83 398.0    103 352.0    132 872.0    154 689.0    142 778.2         ...                    Côte-d'Ivoire

         Togo                            32 270.0     86 970.0     61 273.0     53 215.0     47 155.0     41 886.0     20 114.0     30 520.7         ...                            Togo

         Benin                            6 370.0     35 489.0     53 413.0     75 528.0     85 666.0     46 779.0     33 269.0     63 820.2         ...                            Bénin


      African Statistical Yearbook 2011 / Annuaire Statistique pour l'Afrique 2011
Mauritania                                                                                                                                                            Mauritanie

AREA (KM 2)                                                                                  1 025 520                                                               SUPERFICIE (KM 2)
CAPITAL CITY                             Nouakchott                                                                               Nouakchott                                     CAPITALE
CURRENCY                                 Ouguiya                                                                                    Ouguiya                                      MONNAIE


                        I SOCIAL AND DEMOGRAPHIC INDICATORS — INDICATEURS DEMOGRAPHIQUES ET SOCIAUX

                                           2002        2003        2004        2005        2006        2007        2008        2009        2010
Population                                                                                                                                                                    Population
                                                                                                                                                          Population au milieu de l'année -
Mid-year population - Total (Million)          2.7         2.7         2.8         2.9         3.0         3.1         3.2         3.3         3.3
                                                                                                                                                                             Total (million)
                                                                                                                                                          Population au milieu de l'année -
Mid-year population - Urban (%)               42.7        44.0        45.3        46.7        48.0        49.3        50.7        52.0        53.3
                                                                                                                                                                             Urbaine (%)

Female (%)                                    50.3        50.2        50.2        50.1        50.0        49.9        49.9        49.8        49.8                              Femme (%)


Population by Age Group                                                                                                                                       Population par groupe d'âge


   0-14                                   1155 214    1187 750    1219 869    1251 267    1281 509    1310 618    1339 005    1366 618    1393 609                                      0-14


   15-64                                  1367 421    1414 515    1463 193    1513 519    1565 649    1619 589    1675 012    1731 551    1789 045                                     15-64


   65+                                     139 835     139 765     140 000     140 941     142 659     145 060     148 321     152 599     157 973                                      65+


Active Population (000)                         ...         ...      825.6          ...         ...         ...      902.2          ...         ...                 Population active (000)

   Female (%)                                   ...         ...       39.1          ...         ...         ...       34.4          ...         ...                             Femme (%)

                                                                                                                                                         Taux brut de natalité - Total (par
Crude birth rate - Total (per 1000)           35.4        35.4        35.3        35.0        34.7        34.3        34.1        33.7        33.4
                                                                                                                                                                                     1000)
                                                                                                                                                       Taux brut de mortalité - Total (par
Crude death rate - Total (per 1000)           10.9        10.6        10.4        10.2         9.6         9.7         9.5         9.3         9.1
                                                                                                                                                                                    1000)
Life expectancy at birth - Total                                                                                                                         Espérance de vie à la naissance -
                                              58.3        58.7        59.1        59.5        59.9        60.3        60.7        61.1        61.5
(years)                                                                                                                                                                    Total (années)
                                                                                                                                                          Taux net de reproduction - (par
Net reproduction rate - (per woman)             ...         ...         ...        1.8          ...         ...         ...         ...         ...
                                                                                                                                                                                  femme)
                                                                                                                                                         Indice synthétique de fécondité -
Total fertility rate - (p woman)
              y        (per    )               4.7         4.7         4.8         4.7         4.6         4.6         4.5         4.4          ...
                                                                                                                                                                             (par femme)

Education                                                                                                                                                                Enseignement

Teaching staff at first level - Total                                                                                                                  Personnel enseignant - 1er degré -
                                              9.60         9.6        10.7        11.0        11.3        11.4        12.7          ...         ...
(thousands)                                                                                                                                                               Total (milliers)
Teaching staff at second level - Total                                                                                                                Personnel enseignant - 2ème degré -
                                              3.13         3.2         3.2         3.4         3.6         4.1         4.6          ...         ...
(thousands)                                                                                                                                                                Total (milliers)      235
Teaching staff at third level - Total                                                                                                               Personnel enseignant - 3ème degré -
                                               0.3          ...         ...        0.3          ...         ...         ...         ...         ...
(thousands)                                                                                                                                                              Total (milliers)
First level student enrollment - Total                                                                                                                   Elèves inscrits - 1er degré - Total
                                              376         394         434         444         466         484         474           ...         ...
(thousands)                                                                                                                                                                        (milliers)
First level student enrollment -                                                                                                                      Elèves inscrits - 1er degré - Femmes
                                              183         194         215         222         232         242         238           ...         ...
Female (thousands)                                                                                                                                                                  (milliers)
Second level student enrollment -                                                                                                                      Elèves inscrits - 2ème degré - Total
                                               80          81          89          93          97          99          97           ...         ...
Total (thousands)                                                                                                                                                                 (milliers)
Second level student enrollment -                                                                                                                            Elèves inscrits - 2ème degré -
                                               34          36          40          43          44          46          45           ...         ...
Female (thousands)                                                                                                                                                       Femmes (milliers)
Third level student enrollment - Total                                                                                                                 Elèves inscrits - 3ème degré - Total
                                               8.5        11.2         9.4        12.4        13.7        15.0          ...         ...         ...
(thousands)                                                                                                                                                                       (milliers)
Third level student enrollment -                                                                                                                             Elèves inscrits - 3ème degré -
                                                ...         ...         ...         ...         ...         ...         ...         ...         ...
Female (thousands)                                                                                                                                                       Femmes (milliers)
Public expenditure on education (%                                                                                                                       Dépenses publiques consacrées à
                                                ...         ...         ...         ...         ...         ...         ...         ...         ...
of budget)                                                                                                                                                 l'enseignement (% du budget)

Health                                                                                                                                                                               Santé

Hospital beds - Total (per 10 000                                                                                                                        Nombre de lits d'hôpitaux - Total
                                                ...         ...        14          13          12          14          14           ...         ...
population)                                                                                                                                                                 (pour 10 000)
Nurses - Total (per 10 000                                                                                                                              Nombre d'infirmières - Total (pour
                                                ...        29          44          56          58          59          53           ...         ...
population)                                                                                                                                                                       10 000)
Physicians - Total (per 10 000                                                                                                                          Nombre de médecins - Total (pour
                                                ...          6         15           ...        14          14          14           ...         ...
population)                                                                                                                                                                     10 000)
Public expenditure on Health (% of                                                                                                                    Dépenses publiques consacrées à la
                                                 6          4           4           5           5           ...         ...         ...         ...
budget)                                                                                                                                                            santé (% du budget)


                                                                                                 African Statistical Yearbook 2011 / Annuaire Statistique pour l'Afrique 2011
Mauritania                                                                                                                                                               Mauritanie
                                                                     II NATIONAL ACCOUNTS — COMPTES NATIONAUX

                                                         2002       2003        2004        2005        2006        2007        2008       2009           2010

          Gross domestic product by kind of economic activity at current prices
                                                                                                            Produit intérieur brut par branche d'activité économique aux prix courants


          Ouguiya(Millions)                                                                                                                                                      Ouguiya(Millions)

          Agriculture                                    73 689      84 724      85 433     196 465     223 053     263 626     146 990    149 328             ...                            Agriculture

          Mining and quarrying                           36 208      28 111      47 264      77 134      97 252     140 917     187 159    145 562             ...                 Industries extractives

          Manufacturing                                  15 016      15 097       6 933      28 432      40 123      49 865      29 615     30 082             ...            Industries manufacturières

          Electricity, gas & water                        2 600       3 419       3 192       7 477     150 628      69 496      57 219     34 940             ...                 Electricité, gaz et eau

          Construction                                   24 237      25 978      35 528      35 081      49 235      55 544      42 180     41 181             ...          Bâtiments et travaux publics
          Wholesale & retail trade, restaurants,                                                                                                                         Commerce de gros et de détail,
                                                         39 678      43 888      47 134      55 405      69 888      95 088      85 293     81 113             ...
          hotels                                                                                                                                                                  restaurants et hôtels
                                                                                                                                                                          Banques, assurances, affaires
          Finance, insurance, real estate, etc.               ...         ...         ...         ...         ...         ...        ...        ...            ...
                                                                                                                                                                                          immobilières
          Transport and communications                   17 595      19 783      23 129      31 631      36 071      44 641      36 309     35 334             ...      Transport(s) et communications
                                                                                                                                                                            Administrations publiques et
          Public administration and defense              38 005      41 479      47 728      48 720      60 090      61 061     111 969    116 834             ...
                                                                                                                                                                                                défense
          Other services                                 48 796      57 052      54 552      68 967      77 794      80 108      82 535     92 171             ...                        Autres services
                                                                                                                                                                         Moins Services d’intermédiation
          Less Imputed Service Charges                   - 9 925    - 11 733     - 9 062    - 12 501    - 10 888    - 11 992         ...        ...            ...
                                                                                                                                                                                               financière
          Gross domestic product at factor cost                                                                                                                      Produit intérieur brut aux couts des
                                                     285 899        307 798     341 831     536 811     793 246     848 354     779 269    726 545             ...
          / basic prices                                                                                                                                                           facteurs / prix de base

          Plus: Indirect Taxes / taxes on                                                                                                                            Plus taxes indirectes/impôts sur les
                                                         25 188      29 020      40 454      45 049      54 704      66 380      75 549     66 925             ...
          products, less subsidies                                                                                                                                       produits, moins les subventions


          Expenditure on Gross domestic product at current purchaser's values
                                                                                                                        Emploi du produit intérieur brut aux prix courants d'acquisition

          Ouguiya(Millions)                                                                                                                                                      Ouguiya(Millions)
                                                                                                                                                                               Consommation finale des
          Government final consumption                   69 976     101 126      75 814     146 082     171 349     165 275     125 218    127 497             ...
                                                                                                                                                                               administrations publiques

          Private final consumption                  229 812        244 881     291 296     282 598     380 652     414 789     667 897    589 487             ...           Consommation finale privée

          Gross fixed capital formation                  68 892      92 945     198 790     320 150     224 000     257 340     251 136    219 495             ...        Formation brute de capital fixe

          Increase in inventories                           602       - 598     - 23 602    128 431     128 288     278 460          ...        ...            ...                   Variation des stocks

          Exports of goods and services              101 066         86 960     152 411     185 008     408 593     326 663     465 067    388 691             ...     Exportations de biens et services
236                                                                                                                                                                       Moins importations de biens et
          Less imports of goods and services         159 261        188 496     312 424     480 409     464 932     527 793     654 500    531 700             ...
                                                                                                                                                                                                services
          GDP at purchasers' values                  311 087        336 818     382 285     581 860     847 950     914 734     854 818    793 470             ...             PIB aux prix d'acquisition


          Gross domestic product by kind of economic activity at constant prices                           Produit intérieur brut par branche d'activité economique aux prix constants

          Annual Growth Rates (%)                                                                                                                             Taux de croissance annuel (%)
          Agriculture                                       -9.4         4.5        -4.5         4.5         0.0         4.6        8.1        1.5             ...                            Agriculture

          Mining and quarrying                              -3.3         6.3       18.2         -7.7         6.5       14.7         7.7       -2.0             ...                 Industries extractives

          Manufacturing                                     -4.5        -1.0       10.4        -11.7         0.3         6.6        0.8       -0.9             ...            Industries manufacturières

          Electricity, gas & water                            ...         ...         ...         ...         ...      -67.3      -14.5      -11.3             ...                 Electricité, gaz et eau

          Construction                                     14.6          5.5         2.1       17.7          1.0         2.5      -10.7      -10.0             ...          Bâtiments et travaux publics
          Wholesale & retail trade, restaurants,                                                                                                                                Commerce de gros et de
                                                            2.0          5.2         6.6         3.4         6.2         4.4        3.3       -7.2             ...
          hotels                                                                                                                                                              détail,restaurants et hôtels
                                                                                                                                                                           Banques, assurances, affaires
          Finance, insurance, real estate, etc.               ...         ...         ...         ...         ...         ...        ...        ...            ...
                                                                                                                                                                                           immobilières
          Transport and communications                     29.5          3.4       30.0         -3.6         7.4         9.1        9.8       -3.4             ...      Transport(s) et communications
                                                                                                                                                                            Administrations publiques et
          Public administartion and defense                 5.0          7.9        -2.8       13.9          3.4         2.9        3.0       -0.7             ...
                                                                                                                                                                                                défense
          Other services                                    5.5          5.7        -1.6        -8.1         4.7         4.4        4.1        9.0             ...                        Autres services
                                                                                                                                                                         Moins Services d’intérmediation
          Less Imputed Service Charges                      5.4          5.2       -12.8          ...         ...         ...        ...        ...            ...
                                                                                                                                                                                               financière
          Gross domestic product at factor cost                                                                                                                      Produit intérieur brut aux couts des
                                                            1.4          5.1         4.7         3.8       11.8          0.5        3.6       -1.1             ...
          / basic prices                                                                                                                                                           facteurs / prix de base

          Plus: Indirect Taxes / taxes on                                                                                                                            Plus taxes indirectes/impôts sur les
                                                            -2.5       11.1        30.9          4.9         8.6         6.4        4.2       -0.9             ...
          products, less subsidies                                                                                                                                       produits, moins les subventions

          Gross domestic product at market                                                                                                                             Produit intérieur brut aux prix du
                                                            1.1          5.6         6.7         3.9       11.4          1.0        3.7       -1.1             ...
          prices                                                                                                                                                                                  marché


          2008: semi-final           2009: Provisional                                                                                                2008: semi-définitif            2009: provisoire


      African Statistical Yearbook 2011 / Annuaire Statistique pour l'Afrique 2011
Mauritania                                                                                                                                                       Mauritanie

Expenditure on Gross domestic product at constant purchasers' values                                    Emplois du produit intérieur brut aux prix constants d'acquisition


Annual Growth Rates (%)                                                                                                                    Taux de croissance annuel (%)
                                                                                                                                                             Consommation finale des
Government final consumption                15.1         51.9       -17.9          1.7        18.4        -1.9       -4.9        -1.2       ...
                                                                                                                                                             administrations publiques

Private final consumption                   -13.7        -1.0        23.5         17.2        10.3        13.3       17.1       -11.0       ...            Consommation finale privée

Gross fixed capital formation               16.6         19.1         4.1        -11.1       -21.5       128.8       -7.2        59.8       ...        Formation brute de capital fixe

Exports of goods and services                -1.8       -17.3        15.2         10.1        28.6        -0.1        4.3        -7.9       ...      Exportations de biens et services

                                                                                                                                                       Moins importations de biens et
Less imports of goods and services           -8.4         6.0        13.7         14.8        10.1        51.6        9.2         8.9       ...
                                                                                                                                                                             services


                                                                                 III INFLATION

                                          2002        2003        2004         2005        2006        2007       2008        2009       2010
Annual Growth Rates (%)                                                                                                                    Taux de croissance annuel (%)
All Item                                      5.4         5.3       10.5         12.1          6.3         7.3        7.3         2.2      5.0                               Ensemble

Food                                           ...         ...      10.4         13.9          5.4         9.7        9.6         2.6      5.9                            Alimentation

Health                                         ...         ...        6.6        18.7        11.6          7.5        0.6         3.3      1.1                                   Santé

Energy                                         ...         ...        0.7        10.6        12.0         11.6      14.2         -9.4      3.2                                  Energie

Transport                                      ...         ...        1.9          5.5         8.5         0.6        1.9        -0.9      2.2                               Transport


                                               IV AGRICULTURAL PRODUCTION - PRODUCTION AGRICOLE

                                          2002        2003        2004         2005        2006        2007       2008        2009       2010
Tons (Thousand)                                                                                                                                                 Tonnes (milliers)
Millet and sorghum, Tons                      58          79          84           20          86          79         81           ...      ...         Mil et sorgho, tonnes (milliers)
(thousands)
Rice, Tons (thousands)                        59          85          79           86          90          50         82           ...      ...            Riz paddy, tonnes (milliers)

Maize, Tons (thousands)                         8           4         19            9          23           9         17           ...      ...                  Maïs, tonnes (milliers)

Vegetables, Tons (thousands)                  53          53          55           48          53          75          ...         ...      ...             Légumes, tonnes (milliers)

Dates, Tons (thousands)                       22          22          22           20          20          20         20           ...      ...         Dattes ( en milliers de tonnes)


                                                      V MINING PRODUCTION - PRODUCTION MINIERE
                                                                                                                                                                                           237
                                          2002        2003        2004         2005        2006        2007       2008        2009       2010

Iron ores and concentrates, metric
                                          9 424.0    10 377.0    10 782.0     10 752.0    11 155.0    11 233.0   11 296.0    10 448.0       ...       Minerais de fer, tonnes (milliers)
tons (thousands)
Gold ores and concentrates                     ...         ...         ...          ...       10.0        82.8     200.2           ...      ...           Minerais d'or (Kilogrammes)
(Kilograms)

Copper, Tons (thousands)                      6.0         6.0         6.0          0.0         5.0        28.9       32.9          ...      ...                Cuivre, tonnes (milliers)


                                                                             VI ENERGY - ENERGIE

                                          2002        2003        2004         2005        2006        2007       2008        2009       2010

Electricity - total hydro production,                                                                                                              Électricité - production hydraulique
                                           276.4       318.0       342.2        383.2       401.7        423.9     486.9           ...      ...
kilowatt hours (millions)                                                                                                                             totale, kilowatt-heures (millions)

Electricity - total thermal production,                                                                                                              Électricité - production thermique
                                           276.4       318.0       342.2        383.2       401.7        423.9     486.9           ...      ...
kilowatt hours (millions)                                                                                                                             totale, kilowatt-heures (millions)

Electricity - total production, self-                                                                                                             Electricité - Production totale privée
                                               ...         ...       156          183         201         197          ...         ...      ...
producer (Million Kilowatt Hours)                                                                                                                           (million de kilowatt heures)

Electricity - total production, public                                                                                                                   Electricité - Production totale
                                             276         318         186          200         201         227          ...         ...      ...
(Million Kilowatt Hours)                                                                                                                          publique (million de kilowatt heures)


                                                                                                 African Statistical Yearbook 2011 / Annuaire Statistique pour l'Afrique 2011
Mauritania                                                                                                                                                               Mauritanie
                                                  VII TOURISM AND INFRASTRUCTURE - TOURISME ET INFRASTUCTURE

                                                   2002       2003          2004         2005       2006          2007         2008         2009       2010

         Arrivals - Tourists (thousands)                ...         ...          ...          ...      3.76       10.148            ...          ...         ...           Arrivées - touristes (milliers)

         Rooms in hotels and similar                                                                                                                             Chambres d'hotels et établissements
         establishments (thousands)                     ...         ...          ...          ...         ...          ...          ...          ...         ...                  assimilés (milliers)

         Paved Road (% of total)                       55          55           53           53          58           58            ...          ...         ...        Routes asphaltées (% du total)
         Total Network (Railways-km)                9 073       9 091        9 318        9 841      11 763       11 763            ...          ...         ...         Réseau total voies ferrées-Km
         Main Telephone Lines (per 1,000                                                                                                                               Lignes téléphoniques fixes (pour
                                                         1           1            1            1           1            1            2           ...         ...
         inhabitants)                                                                                                                                                                  1000 habitants)
         Mobile Cellular Subscribers (per                                                                                                                              Abonnés aux téléphones mobiles
                                                         9         13           19           26          35           49           64            ...         ...
         1,000 inhabitants)                                                                                                                                                     (pour 1000 habitants)


                                    VII FINANCIAL AND MONETARY STATISTICS - FINANCES ET STATISTIQUES MONETAIRES

                                                   2002       2003          2004         2005       2006          2007         2008         2009       2010

         VII-1 Monetary Statistics                                                                                                                            VII-1 Statistiques monétaires
         Ouguiya(Millions)                                                                                                                                                      Ouguiya(Millions)
         Money supply (M1)                         78 183     100 127      111 104      128 282     148 741      171 057      203 399      231 193     251 555                   Masse monétaire (M1)
         Quasi-money                               14 548      18 146       23 455       25 527      29 177       40 501       37 576       45 924      41 142                           Quasi-monnaie
           of which Demand Deposit                 49 661      55 838       68 327       79 173      82 311      102 133      133 068      148 967           ...              dont Monnaie scripturale
         Net foreign assets                        52 751      58 557      - 72 139     - 75 281     - 3 034       8 186       - 9 412      - 7 750    - 14 828                   Avoirs extérieurs nets
         Domestic credit                          157 368     198 912      264 000      303 148     266 192      305 043      379 946      420 031     446 777                           Crédit intérieur

         of which claims on private sector         95 925     116 926      134 100      143 496     153 892      183 182      238 200      247 114     280 866       dont créances sur le secteur privé

         of which Claims on government                                                                                                                                      dont créances nettes sur le
                                                   61 443      81 986      129 900      159 652     112 300      121 861      141 746      172 917     165 911
         sector, net                                                                                                                                                                    gouvernement
         International reserves (millions of US                                                                                                                    Réserves internationales (millions de
                                                       74          32           39           70         194          209          195          238           ...
         $)                                                                                                                                                                                        $ EU)
         Average Exchange Rate (National                                                                                                                            Taux de change (moyen) (monnaie
                                                   271.50      263.20       256.20       268.60      268.60       250.60       256.60       262.70      273.67
         Currency per us $)                                                                                                                                                     nationale par dollars)


         VII-2 Public Finance                                                                                                                                          VII-2 Finances publiques
         Ouguiya(Millions)                                                                                                                                                      Ouguiya(Millions)
         Total Revenues and Grants                108 571     119 675      130 415      131 301     467 656      209 420      204 270      188 600     276 600                 Recettes totales et dons
           Tax Revenue                             41 549      44 887       59 178       74 877     104 509      106 881      125 330      106 700           ...                       Recettes fiscales
           Non Tax Revenue                         53 486      59 040       58 748       46 124     110 626       86 248       75 740       75 800           ...                  Recettes non fiscales

238        Grants                                  13 536      15 748       12 489       10 300     252 521       16 291        3 200        6 100           ...                                   Dons

         Total Expenditures and Net Lending       117 581     159 481      149 569      166 100     206 324      217 320      246 890      226 400     320 588           Dépenses totales et prêts nets

           Current expenditure                     73 952     110 558      102 291      126 600     157 876      158 865      191 290      170 200           ...                   Dépenses courantes
           Of which Wages and Salaries             16 070      16 042       17 151       22 400      52 842       64 582       71 300       77 000           ...         Dont rémunérations et salaires
           Capital expenditure                     43 467      47 572       47 097       36 600      44 648       58 456       55 600       51 800           ...               Dépenses d'équipement
           Net Lending                                162       1 351          182        2 900       3 800             0            0       4 400           ...                              Prêts nets
         Fiscal Balance                            - 9 010    - 39 806     - 19 154     - 34 799    261 332       - 7 900     - 42 620     - 37 800    - 43 988         Solde global y compris les dons


         VII-3 Balance of Payments                                                                                                                                 VII-3 Balance des paiements
         Ouguiya(Millions)                                                                                                                                                      Ouguiya(Millions)
         Trade balance                             - 6 807    - 18 077    - 229 594    - 191 193     74 684        9 271       27 827      - 15 949          ...                  Balance commerciale
         Services Balance                         - 22 096    - 37 493     - 55 098     - 79 221    - 85 844    - 136 664    - 152 362    - 128 828          ...                   Balance des services
         Net Income                                34 288      15 187       17 403       17 102     - 19 957     - 16 110       7 366      - 17 837          ...                           Revenus nets
         Current transfers, net total              24 305      35 068       28 851       42 625      42 600       37 597       41 582       35 873           ...                    Transferts courants
         Current account balance                   29 690      - 5 315    - 238 438    - 210 687     11 483     - 105 906     - 75 588    - 126 741          ...              Solde du compte courant


         VII-4 External Debt and Financial Flows                                                                                                  VII-4 Dette extérieure et flux financiers
         US $(Millions)                                                                                                                                                             $ E.U(Millions)
         Total external debt                        2 711       2 869        3 151        2 469       2 541        2 749        2 948        3 123       2 432                   Dette extérieure totale
           Private                                     48          60          114          181         196           67           67           67          67                                    Privée
           Public                                   2 663       2 809        3 037        2 288       2 345        2 682        2 882        3 057       2 366                                 Publique
         Total external debt service                   10          21           25           31          80           47           71           56         108            Service de la dette extérieure
         Net Foreign Direct Investment                                                                                                                             Investissements étranger direct (flux
                                                       67         102          392          814         106          138          338         - 38           ...
         Inflows                                                                                                                                                                         nets entrants)
         Net Total Official Development                                                                                                                               Aide publique au développement
                                                      363         255          194          187         208          346          320          287           ...
         assistance                                                                                                                                                                      (nette totale)


      African Statistical Yearbook 2011 / Annuaire Statistique pour l'Afrique 2011
Mauritania                                                                                                                                Mauritanie

                          2002        2003        2004        2005        2006        2007        2008       2009       2010

Ouguiya(Millions)                                                                                                                                    Ouguiya
Exports, fob                                                                                                                             Exportations, fàb


Exports - Total           90 065      83 763     116 672     165 537     367 069      379 063    422 917     357 908       ...              Exportations - Total


Main Products                                                                                                                            Principaux produits


Iron Ore                  53 833      48 855      66 967     101 306     122 209      144 403    175 837     137 024       ...                    Minerai de fer


Fishing Products          32 925      35 366      44 625      46 391      45 993       64 032     70 406      70 561       ...                    Produit Pêche


Petroleum Products             ...         ...         ...         ...   170 504       88 105     81 726      57 269       ...                Produits pétroliers


                               ...         ...         ...         ...         ...         ...         ...        ...      ...


                               ...         ...         ...         ...         ...         ...         ...        ...      ...

Main Destinations                                                                                                                   Principales destinations

France                   15 547.2    14 178.3    19 275.1    25 885.6    29 338.7    38 144.1    64 101.5         ...      ...                           France


Spain                    12 645.1    12 336.1    14 909.6    15 811.7    19 711.9    30 870.6    26 270.8         ...      ...                          Espagne


Italy                    16 826.3    12 951.8    11 534.4    24 048.0    31 776.5    27 088.8    28 557.9         ...      ...                             Italie


Belgium                  14 159.0    12 342.0    12 497.0    20 315.4    21 918.0    19 078.2    20 035.2         ...      ...                          Belgique


Japan                     8 492.2     9 948.5    23 443.1    20 364.3    21 177.1    20 661.5    21 241.7         ...      ...                            Japon


                          2002        2003        2004        2005        2006        2007        2008       2009       2010
Imports, cif                                                                                                                              Importations, cif

Imports - Total           96 872     101 840     346 266     356 730     292 385      369 792    395 090     373 857       ...    Importations - Total (millions)   239

                                                                                                                                         Principaux produits
Main Products


Equipment goods           23 092      27 420     232 580     231 727      52 526       68 126     55 807     102 847       ...              Biens d'équipement


Petroleum Products        21 415      16 725      21 926      35 939      77 825      113 300    138 549      74 029       ...                Produits pétroliers


Food                      19 795      22 569      33 767      32 329      64 963       84 015    105 271      89 070       ...             Produits alimentaires


Cars / spare parts         8 514       9 575      14 487      11 593      20 141       26 033     27 139      22 760       ...        Voitures/pieces détachées


Construction Equipment     9 612       9 382      20 607      17 601      24 326       31 293     24 068      26 620       ...             Matériel construction


Main Origin                                                                                                                         Principales provenances

France                   29 500.5    28 789.6    34 470.7    36 724.7    43 662.6    58 641.0    64 569.6         ...      ...                           France

Germany                   5 910.4     7 194.7     9 945.0      854.4     12 081.8    14 416.2    12 433.9         ...      ...                        Allemagne

USA                       6 435.5     4 417.2    11 287.7    28 697.4    15 947.2    16 578.2    12 719.9         ...      ...                        Etats-Unis

Spain                     5 283.9     5 574.1     4 510.6     5 979.3     9 686.8    13 984.4    19 208.4         ...      ...                          Espagne

Belgium                   4 723.3     5 477.4     9 982.2     9 905.3    14 017.2    16 662.5    24 060.7         ...      ...                          Belgique


                                                                                African Statistical Yearbook 2011 / Annuaire Statistique pour l'Afrique 2011
Mauritius                                                                                                                                                          Maurice

         AREA (KM 2)                                                                              2 040                                                              SUPERFICIE (KM 2)
         CAPITAL CITY                             Port Louis                                                                       Port Louis                                    CAPITALE
         CURRENCY                                 Mauritius Rupee                                                             Rupee Mauritien                                    MONNAIE


                                 I SOCIAL AND DEMOGRAPHIC INDICATORS — INDICATEURS DEMOGRAPHIQUES ET SOCIAUX

                                                    2002       2003      2004      2005      2006         2007      2008        2009       2010
         Population                                                                                                                                                           Population
                                                                                                                                                          Population au milieu de l'année -
         Mid-year population - Total (Million)          1.2        1.2       1.2       1.3       1.3          1.3       1.3         1.3        1.3
                                                                                                                                                                             Total (million)
                                                                                                                                                          Population au milieu de l'année -
         Mid-year population - Urban (%)               42.5       42.4      42.3      42.3      42.3         42.3      42.4        42.5       42.6
                                                                                                                                                                             Urbaine (%)

         Female (%)                                    50.3       50.3      50.3      50.3      50.4         50.4      50.4        50.4       50.5                              Femme (%)


         Population by Age Group                                                                                                                              Population par groupe d'âge


            0-14                                    311 959    312 154   311 484   309 580   306 269      301 780   296 648     291 638    287 305                                      0-14


            15-64                                   833 612    842 644   851 871   861 543   871 783      882 414   893 016     903 006    911 955                                     15-64


            65+                                      73 629     76 011    78 510    81 165    83 977       86 951    90 136      93 575     97 309                                      65+


         Active Population (000)                      541.7      542.7     543.4     554.4     560.6        564.1     577.2       573.1      576.6                  Population active (000)

            Female (%)                                 34.3       34.3      34.4      35.5      35.9         35.6      36.4        36.1       36.3                              Femme (%)

                                                                                                                                                         Taux brut de natalité - Total (par
         Crude birth rate - Total (per 1000)            7.0        7.0       7.0       7.0       7.0          7.0       7.0         7.0        7.0
                                                                                                                                                                                     1000)
                                                                                                                                                       Taux brut de mortalité - Total (par
         Crude death rate - Total (per 1000)            7.0        7.0       7.0       7.0       7.0          7.0       7.0         7.0         ...
                                                                                                                                                                                    1000)
         Life expectancy at birth - Total                                                                                                                Espérance de vie à la naissance -
                                                       72.0       72.0      72.0      72.0      72.0         73.0      73.0        73.0         ...
         (years)                                                                                                                                                           Total (années)
         Net reproduction rate - (per                                                                                                                     Taux net de reproduction - (par
                                                        1.0        1.0       1.0       1.0       1.0          1.0       1.0         1.0         ...
         woman)                                                                                                                                                                   femme)
                                                                                                                                                         Indice synthétique de fécondité -
         Total fertility rate - (p woman)
                       y        (per    )               2.0        2.0       2.0       2.0       2.0          2.0       2.0         2.0         ...
                                                                                                                                                                             (par femme)

         Education                                                                                                                                                       Enseignement

         Teaching staff at first level - Total                                                                                                         Personnel enseignant - 1er degré -
                                                       5.26        5.6       5.7       5.5       5.6          5.5       5.5         5.5         ...
         (thousands)                                                                                                                                                      Total (milliers)
         Teaching staff at second level - Total                                                                                                       Personnel enseignant - 2ème degré -
240                                                    5.93        6.4       7.0       7.4       7.8          8.1       8.1         8.2         ...
         (thousands)                                                                                                                                                       Total (milliers)
         Teaching staff at third level - Total                                                                                                        Personnel enseignant - 3ème degré -
                                                         ...       1.1       1.1       1.3       1.3          1.1       1.2         1.3         ...
         (thousands)                                                                                                                                                       Total (milliers)
         First level student enrollment - Total                                                                                                          Elèves inscrits - 1er degré - Total
                                                       132        130       126       124       121          119       119         118          ...
         (thousands)                                                                                                                                                               (milliers)
         First level student enrollment -                                                                                                             Elèves inscrits - 1er degré - Femmes
                                                        65         64        62        61        60           59        58          58          ...
         Female (thousands)                                                                                                                                                         (milliers)
         Second level student enrollment -                                                                                                             Elèves inscrits - 2ème degré - Total
                                                       112        118       123       128       132          133       132         131          ...
         Total (thousands)                                                                                                                                                        (milliers)
         Second level student enrollment -                                                                                                                   Elèves inscrits - 2ème degré -
                                                        55         58        60        63        65           66        65          65          ...
         Female (thousands)                                                                                                                                              Femmes (milliers)
         Third level student enrollment - Total                                                                                                        Elèves inscrits - 3ème degré - Total
                                                       16.9       17.0      17.6      20.5      22.2         23.0      25.6          ...        ...
         (thousands)                                                                                                                                                              (milliers)
         Third level student enrollment -                                                                                                                    Elèves inscrits - 3ème degré -
                                                        8.3        8.1       8.6      10.3      11.0         12.3      14.0          ...        ...
         Female (thousands)                                                                                                                                              Femmes (milliers)
         Public expenditure on education (%                                                                                                              Dépenses publiques consacrées à
                                                       13.3       13.3      13.7      14.1      13.0         12.6      12.7        13.5         ...
         of budget)                                                                                                                                        l'enseignement (% du budget)

         Health                                                                                                                                                                      Santé

         Hospital beds - Total (per 10 000                                                                                                               Nombre de lits d'hôpitaux - Total
                                                        36         34        34        34        34           33        34          35          ...
         population)                                                                                                                                                        (pour 10 000)
         Nurses - Total (per 10 000                                                                                                                     Nombre d'infirmières - Total (pour
                                                        24         24        24        23        25           26        27          28          ...
         population)                                                                                                                                                              10 000)
         Physicians - Total (per 10 000                                                                                                                 Nombre de médecins - Total (pour
                                                        10         10        11        11        11           11        11          12          ...
         population)                                                                                                                                                            10 000)
         Public expenditure on Health (% of                                                                                                           Dépenses publiques consacrées à la
                                                          9         8         9         9         9            9         9            9         ...
         budget)                                                                                                                                                   santé (% du budget)


      African Statistical Yearbook 2011 / Annuaire Statistique pour l'Afrique 2011
Mauritius                                                                                                                                                                Maurice
                                                         II NATIONAL ACCOUNTS — COMPTES NATIONAUX

                                           2002          2003      2004      2005      2006         2007         2008        2009         2010

Gross domestic product by kind of economic activity at current prices
                                                                                           Produit intérieur brut par branche d'activité économique aux prix courants


Mauritius Rupee (Millions)                                                                                                                            Rupee Mauritien(Millions)

Agriculture                                     7 909     8 727      9 830     9 790    10 130      10 071        10 352      10 406       10 369                             Agriculture

Mining and quarrying                              81         84        87        88        101          96           101             88        92                  Industries extractives

Manufacturing                                  28 227    29 581     31 942    32 187    36 356      41 076        46 929      47 396       47 888             Industries manufacturières

Electricity, gas & water                        3 012     3 409      3 546     3 355     3 521       3 668         4 893       6 089        6 569                  Electricité, gaz et eau

Construction                                    7 168     8 269      8 835     9 099    10 205      13 145        16 216      17 287       18 260           Bâtiments et travaux publics
Wholesale & retail trade,                                                                                                                                Commerce de gros et de détail,
                                               23 651    24 900     28 623    31 994    38 034      45 115        48 888      47 078       50 453
restaurants, hotels                                                                                                                                               restaurants et hôtels
                                                                                                                                                          Banques, assurances, affaires
Finance, insurance, real estate, etc.          23 326    26 855     29 554    33 375    37 921      44 222        52 461      57 396       62 484
                                                                                                                                                                          immobilières
Transport and communications                   16 944    18 496     19 682    20 447    22 169      24 517        25 062      26 153       27 308       Transport(s) et communications
                                                                                                                                                            Administrations publiques et
Public administration and defense               8 140     9 408     10 580    11 460    12 199      12 674        14 618      16 477       17 286
                                                                                                                                                                                défense
Other services                                 13 680    15 542     17 564    19 367    21 490      23 915        27 777      31 356       34 027                         Autres services
                                                                                                                                                         Moins Services d’intermédiation
Less Imputed Service Charges               - 6 712       - 7 683   - 7 818   - 8 991   - 10 117    - 11 528     - 14 000     - 16 052     - 17 700
                                                                                                                                                                               financière
Gross domestic product at factor                                                                                                                     Produit intérieur brut aux couts des
                                          125 426       137 588    152 425   162 171   182 009     206 971       233 296     243 674      257 036
cost / basic prices                                                                                                                                                facteurs / prix de base

Plus: Indirect Taxes / taxes on                                                                                                                      Plus taxes indirectes/impôts sur les
                                               17 059    19 806     23 172    23 177    24 319      28 549        31 201      30 739       32 874
products, less subsidies                                                                                                                                 produits, moins les subventions


Expenditure on Gross domestic product at current purchaser's values
                                                                                                       Emploi du produit intérieur brut aux prix courants d'acquisition

Mauritius Rupee (Millions)                                                                                                                            Rupee Mauritien(Millions)
                                                                                                                                                               Consommation finale des
Government final consumption                   19 855    22 272     25 043    27 368    29 355      30 743        34 920      40 132       42 184
                                                                                                                                                               administrations publiques

Private final consumption                      86 764    96 180    111 837   127 349   145 491     165 790       196 929     204 781      215 900            Consommation finale privée

Gross fixed capital formation                  31 075    35 554     38 003    39 731    50 048      59 170        65 176      71 848       70 800         Formation brute de capital fixe

Increase in inventories                          454      1 369      4 879     2 028     4 735       3 970         6 415     - 13 171      - 2 332                   Variation des stocks

Exports of goods and services                  88 301    88 714     94 859   110 940   127 128     138 459       140 166     132 980      143 476      Exportations de biens et services
                                                                                                                                                          Moins importations de biens et
                                                                                                                                                                                             241
Less imports of goods and services             83 964    86 694     99 024   122 067   150 429     162 612       179 108     162 156      180 118
                                                                                                                                                                                services
GDP at purchasers' values                 142 485       157 394    175 597   185 348   206 328     235 520       264 498     274 414      289 910              PIB aux prix d'acquisition


Gross domestic product by kind of economic activity at constant
                                                                                          Produit intérieur brut par branche d'activité economique aux prix constants
prices
Annual Growth Rates (%)                                                                                                                       Taux de croissance annuel (%)
Agriculture                                     -16.3       1.9        8.1      -5.4        0.6        -5.2          1.5        10.7           4.0                            Agriculture

Mining and quarrying                            -49.2       1.6        0.0      -3.1        7.9        -9.1          0.0        -15.0          0.0                 Industries extractives

Manufacturing                                    -2.4       0.0        0.5      -5.5        4.0         2.2          3.2          1.1          1.9            Industries manufacturières

Electricity, gas & water                          1.5       8.2        4.0       3.8        4.0         3.4          4.0          2.5          3.7                 Electricité, gaz et eau

Construction                                      6.3      10.2        0.5      -4.4        5.2         4.5          4.6          1.3          3.3          Bâtiments et travaux publics
Wholesale & retail trade,                                                                                                                                       Commerce de gros et de
                                                  3.2       1.7        4.7       5.6        4.9         4.5          4.6          1.3          3.3
restaurants, hotels                                                                                                                                           détail,restaurants et hôtels
                                                                                                                                                           Banques, assurances, affaires
Finance, insurance, real estate, etc.             5.8       8.8        5.6       6.0        6.7         7.5         10.8          4.9          5.6
                                                                                                                                                                           immobilières
Transport and communications                      7.7       6.6        8.1       7.7        7.4         7.7          5.8          4.9          5.5      Transport(s) et communications
                                                                                                                                                            Administrations publiques et
Public administartion and defense                 6.1       5.6        4.3       5.3        4.0         0.5          1.7          2.5          2.8
                                                                                                                                                                                défense
Other services                                    8.4       4.5        7.2       1.8       -2.5       24.3           3.0          2.4          9.1                        Autres services
                                                                                                                                                         Moins Services d’intérmediation
Less Imputed Service Charges                      9.6       7.6       -0.4       7.3        6.9         7.5         10.4          5.3          5.9
                                                                                                                                                                               financière
Gross domestic product at factor                                                                                                                     Produit intérieur brut aux couts des
                                                  1.6       4.3        4.8       1.8        4.6         5.3          5.1          3.2          4.2
cost / basic prices                                                                                                                                                facteurs / prix de base

Plus: Indirect Taxes / taxes on                                                                                                                      Plus taxes indirectes/impôts sur les
                                                  3.6       4.2       11.9      -1.9       -0.3         6.9          1.9         -4.7          1.5
products, less subsidies                                                                                                                                 produits, moins les subventions

Gross domestic product at market                                                                                                                       Produit intérieur brut aux prix du
                                                  1.9       4.3        5.8       1.2        3.9         5.5          4.6          2.1          3.9
prices                                                                                                                                                                            marché


2008: semi-final           2009: Provisional      2010:Estimated                                              2008: semi-définitif        2009: provisoire               2010:Estimée


                                                                                             African Statistical Yearbook 2011 / Annuaire Statistique pour l'Afrique 2011
Mauritius                                                                                                                                                        Maurice

         Expenditure on Gross domestic product at constant purchasers'
                                                                                                           Emplois du produit intérieur brut aux prix constants d'acquisition
         values

         Annual Growth Rates (%)                                                                                                              Taux de croissance annuel (%)
                                                                                                                                                                Consommation finale des
         Government final consumption                  5.8        3.0        4.6         6.1        3.8        0.8        0.7        5.4      2.8
                                                                                                                                                                administrations publiques

         Private final consumption                     3.3        5.1        7.8         7.3        5.9        4.5        7.0        2.1      2.5             Consommation finale privée

         Gross fixed capital formation                -0.1       10.3        2.2        -1.9       19.0        8.6        3.6        9.1     -2.8         Formation brute de capital fixe

         Exports of goods and services               -12.1       -3.9       -0.3       10.6         7.7        3.4        2.3       -4.8     13.6       Exportations de biens et services

                                                                                                                                                          Moins importations de biens et
         Less imports of goods and services           -3.2       -3.1        2.8         6.4        9.3        2.0        1.8       -4.6      5.8
                                                                                                                                                                                services


                                                                                        III INFLATION

                                                   2002       2003       2004        2005       2006       2007       2008       2009       2010
         Annual Growth Rates (%)                                                                                                              Taux de croissance annuel (%)
         All Item                                      6.4        3.9        4.7         4.9        8.9        8.8        9.7        2.5      1.1                               Ensemble

         Food                                          7.8        2.6        6.2         5.8       10.0      15.6       15.8         4.1      1.5                            Alimentation

         Health                                        6.6        6.0        6.4         4.6        7.7        5.3        6.9        5.4      2.3                                   Santé

         Energy                                        9.3       -1.5        0.2         2.7       20.5        6.4      17.9         2.0      0.1                                  Energie

         Transport                                     5.0        3.4        4.8         6.3        8.6        1.7      12.3         0.2      1.7                               Transport


                                                         IV AGRICULTURAL PRODUCTION - PRODUCTION AGRICOLE

                                                   2002       2003       2004        2005       2006       2007       2008       2009       2010
         Tons (Thousand)                                                                                                                                           Tonnes (milliers)
         Potato, Tons (thousands)                      13         12         11          13         11         15         15         20        ...    Pommes de terre, tonnes (milliers)

         Tomato, Tons (thousands)                      12         13         14          13         15         11         12         13        ...             Tomates, tonnes (milliers)
         Pumpkins, squash and gourds, Tons
                                                                                                                                               ... Citrouille, squash
                                                                                                                                                                      et gourdes, tonnes
                                                        7         16         18          14         18         15         14         17
         (thousands)                                                                                                                                                           (milliers)
         Sugar cane, Tons (thousands)                4 874      5 200      5 280      4 984       4 749     4 236      4 533          ...      ...         Cane à sucre, tonnes (milliers)

         Foodcrop, Tons (thousands)                103 876    103 455    111 633     96 782     106 902    99 130     93 021          ...      ...    Cultures vivrières, tonnes (milliers)


                                                               V MINING PRODUCTION - PRODUCTION MINIERE
242
                                                   2002       2003       2004        2005       2006       2007       2008       2009       2010

         Salt and pure sodium chloride,                                                                                                                    Sel et chlorure de sodium pur,
                                                       7.0        7.0        7.0         7.0        7.0        6.7         ...        ...      ...
         metric tons (thousands)                                                                                                                               tonnes métriques (milliers)
                                                        ...        ...        ...         ...        ...        ...        ...        ...      ...


                                                        ...        ...        ...         ...        ...        ...        ...        ...      ...


                                                                                    VI ENERGY - ENERGIE

                                                   2002       2003       2004        2005       2006       2007       2008       2009       2010

         Electricity - total hydro production,                                                                                                        Électricité - production hydraulique
                                                   1 948.9    2 081.5    2 165.2     2 272.2    2 350.2    2 464.7    2 557.2    2 577.4       ...
         kilowatt hours (millions)                                                                                                                       totale, kilowatt-heures (millions)

         Electricity - total thermal production,                                                                                                        Électricité - production thermique
                                                       4.4        5.7        5.6         5.1        3.3        3.4        4.2        4.7       ...
         kilowatt hours (millions)                                                                                                                       totale, kilowatt-heures (millions)

         Electricity - total production, self-                                                                                                       Electricité - Production totale privée
                                                      956        943        943         949        967        966        958        952        ...
         producer (Million Kilowatt Hours)                                                                                                                     (million de kilowatt heures)

         Electricity - total production, public                                                                                                             Electricité - Production totale
                                                      991       1 135      1 225      1 208       1 106     1 003          ...        ...      ...
         (Million Kilowatt Hours)                                                                                                                    publique (million de kilowatt heures)


      African Statistical Yearbook 2011 / Annuaire Statistique pour l'Afrique 2011
Mauritius                                                                                                                                                                  Maurice
                                         VII TOURISM AND INFRASTRUCTURE - TOURISME ET INFRASTUCTURE

                                          2002       2003        2004        2005        2006          2007       2008        2009        2010

Arrivals - Tourists (thousands)          681.648     702.018     718.861     761.063     788.276      906.971     930.456       871.4           ...           Arrivées - touristes (milliers)

Rooms in hotels and similar                                                                                                                         Chambres d'hotels et établissements
establishments (thousands)                 9.623       9.647       10.64      10.497      10.666       10.857      11.488        11.5           ...                  assimilés (milliers)

Paved Road (% of total)                      100         100         100         100         100          100         100         100           ...        Routes asphaltées (% du total)
Total Network (Railways-km)                2 000       2 015       2 020       2 020       2 021        2 028       2 028       2 066           ...         Réseau total voies ferrées-Km
Main Telephone Lines (per 1,000                                                                                                                           Lignes téléphoniques fixes (pour
                                             269         284         286         286         284          286         286           ...         ...
inhabitants)                                                                                                                                                              1000 habitants)
Mobile Cellular Subscribers (per                                                                                                                          Abonnés aux téléphones mobiles
                                             286         380         443         526         615          734         812         850           ...
1,000 inhabitants)                                                                                                                                                 (pour 1000 habitants)


                          VII FINANCIAL AND MONETARY STATISTICS - FINANCES ET STATISTIQUES MONETAIRES

                                          2002       2003        2004        2005        2006          2007       2008        2009        2010

VII-1 Monetary Statistics                                                                                                                        VII-1 Statistiques monétaires
Mauritius Rupee (Millions)                                                                                                                              Rupee Mauritien(Millions)
Money supply (M1)                         18 150      36 988      45 390      46 186      52 677       64 311      75 590      88 076      80 517                   Masse monétaire (M1)
Quasi-money                              101 306     109 907     128 841     141 135     153 493      173 661     197 188     207 632     217 088                           Quasi-monnaie
  of which Demand Deposit                      ...         ...         ...         ...         ...          ...         ...         ...         ...              dont Monnaie scripturale
Net foreign assets                        43 385      92 235     116 321     145 913     238 282      265 602     285 016     332 684     370 796                    Avoirs extérieurs nets
Domestic credit                          105 861     153 887     179 530     198 692     218 007      242 190     296 098     301 170     320 793                           Crédit intérieur

of which claims on private sector         83 690     114 649     128 278     139 524     153 085      183 106     232 514     233 629     257 367       dont créances sur le secteur privé

of which Claims on government                                                                                                                                  dont créances nettes sur le
                                          20 723      30 953      42 693      45 251      46 181       45 524      46 967      49 849      48 187
sector, net                                                                                                                                                                gouvernement
International reserves (millions of US                                                                                                                Réserves internationales (millions de
                                           1 227       1 577       1 606       1 340       1 270        1 780       1 743       2 179       2 442
$)                                                                                                                                                                                    $ EU)
Average Exchange Rate (National                                                                                                                        Taux de change (moyen) (monnaie
                                           29.96       27.90       27.50       29.50       31.71        31.31       28.45       31.96       30.78
Currency per us $)                                                                                                                                                 nationale par dollars)


VII-2 Public Finance                                                                                                                                      VII-2 Finances publiques
Mauritius Rupee (Millions)                                                                                                                              Rupee Mauritien(Millions)
Total Revenues and Grants                 27 735      32 810      36 693      39 320      42 406       45 641      54 594      54 581      60 428                 Recettes totales et dons
  Tax Revenue                             22 865      27 242      30 612      34 339      37 117       40 053      46 927      45 484      50 524                         Recettes fiscales
  Non Tax Revenue                          4 553       5 206       5 463       4 538       4 800        5 266       7 213       6 914       7 470                    Recettes non fiscales
  Grants                                     317         363         618         444         489          322         454       2 183       2 434                                     Dons      243
Total Expenditures and Net Lending        33 343      38 846      42 341      43 752      48 930       50 985      60 521      73 828      74 686           Dépenses totales et prêts nets

  Current expenditure                     14 658      15 827      18 240      19 809      21 571       22 050      23 755      26 241      25 258                     Dépenses courantes
  Of which Wages and Salaries             10 975      11 809      13 887      15 022      15 778       16 512      18 006      19 307      19 942           Dont rémunérations et salaires
  Capital expenditure                      5 085       7 129       7 129       6 063       6 915        6 843       8 548      19 668      19 857                 Dépenses d'équipement
  Net Lending                                500         959         439         648         689          375       4 040       2 624       4 385                                Prêts nets
Fiscal Balance                            - 5 608     - 6 036     - 5 648     - 4 432     - 6 524      - 5 343     - 5 928    - 19 247    - 14 258         Solde global y compris les dons


VII-3 Balance of Payments                                                                                                                             VII-3 Balance des paiements
Mauritius Rupee (Millions)                                                                                                                              Rupee Mauritien(Millions)
Trade balance                             - 6 329     - 8 389    - 16 006    - 23 515    - 34 532     - 43 939    - 56 597    - 49 223    - 55 693                   Balance commerciale
Services Balance                          10 666      10 409      11 841      12 388      11 231       19 786      17 655      20 047      21 914                     Balance des services
Net Income                                   396       - 833       - 390       - 239       1 633        7 023       4 900         825       4 635                             Revenus nets
Current transfers, net total               2 739       1 471       1 374       1 797       2 269        3 882       6 409       6 909       4 012                      Transferts courants
Current account balance                    7 472       2 658      - 3 181     - 9 569    - 19 399     - 13 248    - 27 633    - 21 442    - 25 132               Solde du compte courant


VII-4 External Debt and Financial Flows                                                                                              VII-4 Dette extérieure et flux financiers
US $ (Millions)                                                                                                                                                        $ E.U (Millions)
Total external debt                        1 049       1 011         934         898         850          849       1 171       1 337       1 315                   Dette extérieure totale
  Private                                     90          79          71         151         133           99         109         669         422                                    Privée
  Public                                     958         932         862         747         717          751       1 061         668         893                                 Publique
Total external debt service                  235         250         214         220         227          175         152         186         176            Service de la dette extérieure
Net Foreign Direct Investment                                                                                                                         Investissements étranger direct (flux
                                              32          62          11          42         105          339         383         257           ...
Inflows                                                                                                                                                                     nets entrants)
Net Total Official Development                                                                                                                           Aide publique au développement
                                              24        - 14          33          34          19           69         110         156           ...
assistance                                                                                                                                                                  (nette totale)


                                                                                                 African Statistical Yearbook 2011 / Annuaire Statistique pour l'Afrique 2011
Mauritius                                                                                                                                                       Maurice

                                                   2002       2003       2004       2005       2006       2007       2008       2009      2010

         Mauritius Rupee (Millions)                                                                                                                                Rupee Mauritien
         Exports, fob                                                                                                                                             Exportations, fàb


         Exports - Total                           53 893     53 022     54 905     63 219     74 037     69 708     67 970     61 784       ...                     Exportations - Total


         Main Products                                                                                                                                            Principaux produits


         Prepared or preserved tuna, skipjack                                                                                                              Prepared or preserved tuna,
                                                    8 869      8 775      9 631     10 181     11 197      9 264      6 009      6 735       ...
         and atlantic bonito                                                                                                                                skipjack and atlantic bonito


         Raw cane sugar                             2 015      1 994      2 220      3 175      4 981      6 140      8 268      6 610       ...                         Raw cane sugar


         T-shirt, singlet & other vest of other                                                                                                     T-shirt, singlet & other vest of other
                                                    9 799     10 925     12 003     11 171     12 360     12 556     10 357      9 743       ...
         textile excl cotton, knitted/crocheted                                                                                                    textile excl cotton, knitted/crocheted


         Men's or boys' shirts of cotton, not                                                                                                       Men's or boys' shirts of cotton, not
                                                    2 807      2 632      3 542      3 393      3 592      4 057      3 487      3 416       ...
         knitted or crochetd                                                                                                                                        knitted or crochetd

          Men's/boys' trouser, short etc. of                                                                                                          Men's/boys' trouser, short etc. of
                                                    3 997      3 039      1 845      1 363      1 736      2 282      2 284      2 563       ...
         cotton, not knitted/crocheted                                                                                                                   cotton, not knitted/crocheted

         Main Destinations                                                                                                                                  Principales destinations

         France                                    9 403.4    9 403.4    9 083.8    8 447.1    8 704.0    8 889.0    7 915.0    9 336.0      ...                                  France


         Italy                                     1 899.5    1 899.5    2 156.4    3 349.0    2 754.4    3 568.0    2 686.0    3 119.0      ...                                    Italie


         Madagascar                                3 184.3    3 184.3    2 689.1    3 380.7    3 288.2    3 865.0    3 451.0    3 606.0      ...                             Madagascar


         UK                                       15 679.9   15 914.7   17 356.3   18 932.7   22 362.3   21 924.0   20 134.0   15 170.0      ...                           Royaume-Uni


         USA                                       8 771.8    8 771.8    7 768.1    5 715.4    5 754.2    4 760.0    3 926.0    4 656.0      ...                               Etats-Unis


                                                   2002       2003       2004       2005       2006       2007       2008       2009      2010
         Imports, cif                                                                                                                                             Importations, cif

244      Imports - Total                           64 608     65 942     76 387     93 282    115 502    121 037    132 165    118 303       ...          Importations - Total (millions)


                                                                                                                                                                  Principaux produits
         Main Products


         Fish and fish preparation                  3 985      2 542      3 170      4 266      6 687      7 066      8 474      7 108       ...               Fish and fish preparation


         Refined petroleum products                 5 673      6 391      8 791     13 471     17 025     18 969     24 042     15 107       ...            Refined petroleum products


         Textile yarn and fabrics                     101        112        112         67         84         86         62         43       ...                 Textile yarn and fabrics

         Telecommunications and sound                                                                                                                   Telecommunications and sound
                                                       14         47         60        286        286        112         96         37       ...
         recording                                                                                                                                                          recording


         Road vehicles                              2 718      2 805      4 028      4 216      4 505      5 228      6 057      5 446       ...                           Road vehicles


         Main Origin                                                                                                                                        Principales provenances

         China                                     5 434.4    5 539.1    7 067.9    9 166.1    9 987.6   13 768.0   15 288.0   14 908.0      ...                                    China

         France                                    7 130.7    7 841.4    6 818.4    6 957.6   16 440.0   12 813.0   10 159.0   13 800.0      ...                                  France

         India                                     4 724.7    5 438.1    6 989.1    6 460.6   15 687.3   35 633.0   31 699.0   22 152.0      ...                                    India

         Japan                                     2 286.9    2 326.1    3 082.6    3 333.1    3 253.6    4 334.0    5 221.0    3 823.0      ...                                   Japan

         South Africa                              8 116.1    8 068.3    8 561.8    8 065.8    8 433.5    8 910.0   10 723.0   10 237.0      ...                             South Africa


      African Statistical Yearbook 2011 / Annuaire Statistique pour l'Afrique 2011
Morocco                                                                                                                                                                                 Maroc

AREA (KM 2)                                                                                       710 850                                                                    SUPERFICIE (KM 2)
CAPITAL CITY                             Rabat                                                                                                    Rabat                                  CAPITALE
CURRENCY                                 Dirham                                                                                                  Dirham                                  MONNAIE


                        I SOCIAL AND DEMOGRAPHIC INDICATORS — INDICATEURS DEMOGRAPHIQUES ET SOCIAUX

                                           2002         2003         2004         2005         2006         2007         2008         2009         2010
Population                                                                                                                                                                            Population
                                                                                                                                                                  Population au milieu de l'année -
Mid-year population - Total (Million)         29.5         29.8         30.2         30.5         30.9         31.2         31.6         32.0         32.4
                                                                                                                                                                                     Total (million)
                                                                                                                                                                  Population au milieu de l'année -
Mid-year population - Urban (%)               54.0         54.3         54.6         55.0         55.3         55.7         56.0         56.4         56.7
                                                                                                                                                                                     Urbaine (%)

Female (%)                                    50.6         50.7         50.7         50.8         50.8         50.8         50.9         50.9         50.9                              Femme (%)


Population by Age Group                                                                                                                                               Population par groupe d'âge


   0-14                                   9496 568     9398 493     9309 446     9233 505     9172 961     9128 149     9098 484     9082 269     9077 934                                      0-14


   15-64                                 18549 540    18919 701    19289 950    19666 178    20049 702    20436 694    20821 720    21197 106    21557 099                                     15-64


   65+                                    1449 270     1502 583     1552 393     1595 308     1630 308     1659 293     1685 412     1713 217     1746 250                                      65+


Active Population (000)                   10 239.9     10 650.9     10 987.1     11 116.9     11 319.8     11 585.4     11 803.1     11 981.8     12 189.9                  Population active (000)

   Female (%)                                 24.1         25.5         26.1         25.8         25.8         26.1         26.1         25.8         25.8                              Femme (%)

                                                                                                                                                                 Taux brut de natalité - Total (par
Crude birth rate - Total (per 1000)           21.0         20.0         20.0         20.0         20.0         20.0         19.0         19.0           ...
                                                                                                                                                                                             1000)
                                                                                                                                                               Taux brut de mortalité - Total (par
Crude death rate - Total (per 1000)            6.0          6.0          6.0          6.0          6.0          6.0          6.0          6.0           ...
                                                                                                                                                                                            1000)
Life expectancy at birth - Total                                                                                                                                 Espérance de vie à la naissance -
                                              70.0         71.0         71.0         72.0         72.0         72.0         73.0         73.0           ...
(years)                                                                                                                                                                            Total (années)
Net reproduction rate - (per                                                                                                                                      Taux net de reproduction - (par
                                                ...          ...          ...         1.1           ...          ...          ...          ...          ...
woman)                                                                                                                                                                                    femme)
                                                                                                                                                                 Indice synthétique de fécondité -
Total fertility rate - (p woman)
              y        (per    )               2.6          2.5          2.5          2.4          2.4          2.3          2.3          2.2           ...
                                                                                                                                                                                     (par femme)

Education                                                                                                                                                                        Enseignement

Teaching staff at first level - Total                                                                                                                          Personnel enseignant - 1er degré -
                                            142.34        145.6        147.7        148.4        146.3        143.8        146.2        144.7           ...
(thousands)                                                                                                                                                                       Total (milliers)
Teaching staff at second level - Total                                                                                                                        Personnel enseignant - 2ème degré -
                                                ...        97.1        100.4           ...          ...          ...          ...          ...          ...                                              245
(thousands)                                                                                                                                                                        Total (milliers)
Teaching staff at third level - Total                                                                                                                       Personnel enseignant - 3ème degré -
                                              18.0         18.0         18.6         19.4         19.3         18.5         19.1         19.6           ...
(thousands)                                                                                                                                                                      Total (milliers)
First level student enrollment - Total                                                                                                                           Elèves inscrits - 1er degré - Total
                                             4 029        4 101        4 070        4 023        3 944        3 939        3 879        3 851           ...
(thousands)                                                                                                                                                                                (milliers)
First level student enrollment -                                                                                                                              Elèves inscrits - 1er degré - Femmes
                                             1 859        1 905        1 892        1 865        1 826        1 830        1 811        1 811           ...
Female (thousands)                                                                                                                                                                          (milliers)
Second level student enrollment -                                                                                                                              Elèves inscrits - 2ème degré - Total
                                             1 685        1 758        1 879        1 952        2 061        2 173           ...          ...          ...
Total (thousands)                                                                                                                                                                         (milliers)
Second level student enrollment -                                                                                                                                    Elèves inscrits - 2ème degré -
                                              742          783          843          880            ...        989            ...          ...          ...
Female (thousands)                                                                                                                                                               Femmes (milliers)
Third level student enrollment - Total                                                                                                                         Elèves inscrits - 3ème degré - Total
                                             315.3        335.8        343.6        366.9        384.6        369.1        401.1        418.8           ...
(thousands)                                                                                                                                                                               (milliers)
Third level student enrollment -                                                                                                                                     Elèves inscrits - 3ème degré -
                                             137.9        150.7        157.0        165.6        173.7        175.6        189.6        196.3           ...
Female (thousands)                                                                                                                                                               Femmes (milliers)
Public expenditure on education (%                                                                                                                               Dépenses publiques consacrées à
                                              27.1         28.2         28.0         23.9         27.8         26.6         21.6         23.5           ...
of budget)                                                                                                                                                         l'enseignement (% du budget)

Health                                                                                                                                                                                       Santé

Hospital beds - Total (per 10 000                                                                                                                                Nombre de lits d'hôpitaux - Total
                                               88           87           87           87           87           87           87           87            ...
population)                                                                                                                                                                         (pour 10 000)
Nurses - Total (per 10 000                                                                                                                                      Nombre d'infirmières - Total (pour
                                               91           89           90           85           87           86           89           89            ...
population)                                                                                                                                                                               10 000)
Physicians - Total (per 10 000                                                                                                                                  Nombre de médecins - Total (pour
                                               48           49           56           57           60           59           62           61            ...
population)                                                                                                                                                                             10 000)
Public expenditure on Health (% of                                                                                                                            Dépenses publiques consacrées à la
                                                 5            5            6            5            5            5            5            5           ...
budget)                                                                                                                                                                    santé (% du budget)


                                                                                                      African Statistical Yearbook 2011 / Annuaire Statistique pour l'Afrique 2011
Morocco                                                                                                                                                             Maroc
                                                              II NATIONAL ACCOUNTS — COMPTES NATIONAUX

                                                  2002       2003       2004       2005       2006        2007       2008       2009        2010

          Gross domestic product by kind of economic activity at current prices
                                                                                                  Produit intérieur brut par branche d'activité économique aux prix courants


          Dirham (Millions)                                                                                                                                         Dirham(Millions)

          Agriculture                              65 457     73 933     74 131     69 565     87 482      74 928     90 690    107 183         ...                            Agriculture

          Mining and quarrying                      8 501      7 822      8 116      8 994     10 534      13 155     45 121     16 925         ...                 Industries extractives

          Manufacturing                            66 276     74 026     79 585     78 650     82 498      82 915     87 959    105 088         ...            Industries manufacturières

          Electricity, gas & water                 11 731     13 191     13 047     14 583     14 687      15 749     16 123     18 953         ...                 Electricité, gaz et eau

          Construction                             21 681     24 379     28 822     31 522     32 912      37 233     38 663     45 776         ...          Bâtiments et travaux publics
          Wholesale & retail trade,                                                                                                                       Commerce de gros et de détail,
                                                   62 759     62 617     65 285     69 417     74 221      81 352     86 875     88 829         ...
          restaurants, hotels                                                                                                                                      restaurants et hôtels
                                                                                                                                                           Banques, assurances, affaires
          Finance, insurance, real estate, etc.   103 672    113 137    120 304    133 711    146 164     167 725    179 138    189 759         ...
                                                                                                                                                                           immobilières
          Transport and communications             29 865     31 072     34 000     34 522     36 491      43 151     45 262     47 892         ...      Transport(s) et communications
                                                                                                                                                             Administrations publiques et
          Public administration and defense        38 481     39 493     44 208     47 917     50 664      51 910     54 000     58 860         ...
                                                                                                                                                                                 défense
          Other services                            6 455      6 971      7 855      7 761      8 246       8 664      9 126      9 502         ...                        Autres services
                                                                                                                                                          Moins Services d’intermédiation
          Less Imputed Service Charges            - 18 801   - 19 708   - 21 085   - 23 212   - 25 951    - 31 089   - 33 325   - 34 302        ...
                                                                                                                                                                                financière
          Gross domestic product at factor                                                                                                            Produit intérieur brut aux couts des
                                                  396 077    426 933    454 268    473 430    517 948     545 693    619 632    654 465         ...
          cost / basic prices                                                                                                                                       facteurs / prix de base

          Plus: Indirect Taxes / taxes on                                                                                                             Plus taxes indirectes/impôts sur les
                                                   49 615     49 460     50 737     53 723     59 396      70 561     69 211     81 741         ...
          products, less subsidies                                                                                                                        produits, moins les subventions


          Expenditure on Gross domestic product at current purchaser's values
                                                                                                              Emploi du produit intérieur brut aux prix courants d'acquisition

          Dirham (Millions)                                                                                                                                         Dirham(Millions)
                                                                                                                                                                Consommation finale des
          Government final consumption             81 339     86 470     94 321    102 110    107 071     112 234    118 132    132 277    135 319
                                                                                                                                                                administrations publiques

          Private final consumption               258 256    272 934    288 592    302 646    331 996     360 008    400 395    419 392    444 556            Consommation finale privée

          Gross fixed capital formation           112 320    119 802    132 719    145 256    162 456     192 573    227 465    226 054    249 338         Formation brute de capital fixe

          Increase in inventories                   3 170     10 679     14 390      6 699      7 446       7 614     35 095     38 783     47 214                    Variation des stocks

          Exports of goods and services           134 303    136 737    148 325    170 513    197 459     220 302    258 165    210 459    224 560      Exportations de biens et services
246                                                                                                                                                        Moins importations de biens et
          Less imports of goods and services      143 696    150 229    173 342    200 071    229 084     276 477    350 409    290 759    316 927
                                                                                                                                                                                 services
          GDP at purchasers' values               445 692    476 393    505 005    527 153    577 344     616 254    688 843    736 206    784 059              PIB aux prix d'acquisition


          Gross domestic product by kind of economic activity at constant
                                                                                                 Produit intérieur brut par branche d'activité economique aux prix constants
          prices
          Annual Growth Rates (%)                                                                                                              Taux de croissance annuel (%)
          Agriculture                                  4.3      20.3         4.5      -11.1      24.5        -20.4      16.4       29.6         ...                            Agriculture

          Mining and quarrying                        -0.6        1.6      15.8         7.4        1.6         9.1       -5.9      -23.8        ...                 Industries extractives

          Manufacturing                                4.6        4.3       -0.2        3.5        3.9         4.4        2.0        0.1        ...            Industries manufacturières

          Electricity, gas & water                     2.1      10.2         5.3        7.7        6.9         5.8        5.9        3.5        ...                 Electricité, gaz et eau

          Construction                                 1.0        8.0        8.0        6.1        8.7       11.7         9.4        3.4        ...          Bâtiments et travaux publics
          Wholesale & retail trade,                                                                                                                              Commerce de gros et de
                                                       3.0        2.1        5.5        4.5        5.2         2.7        3.9        2.8        ...
          restaurants, hotels                                                                                                                                  détail,restaurants et hôtels
                                                                                                                                                            Banques, assurances, affaires
          Finance, insurance, real estate, etc.        2.4        5.1        3.3      10.7       27.3        12.6         3.4       -3.6        ...
                                                                                                                                                                            immobilières
          Transport and communications                 2.9        6.0      11.7         7.3        7.9         9.4        5.9        2.8        ...      Transport(s) et communications
                                                                                                                                                             Administrations publiques et
          Public administartion and defense            1.3        2.9        4.7        4.8        3.2         2.4        3.9        7.6        ...
                                                                                                                                                                                 défense
          Other services                               3.4        4.7        8.4       -3.0        3.0         3.9        1.7        2.3        ...                        Autres services
                                                                                                                                                          Moins Services d’intérmediation
          Less Imputed Service Charges                -1.2        3.6        5.4        9.0        8.9       17.5         3.2        1.5        ...
                                                                                                                                                                                financière
          Gross domestic product at factor                                                                                                            Produit intérieur brut aux couts des
                                                       3.2        7.3        4.8        2.8      12.8          1.7        5.7        5.0        ...
          cost / basic prices                                                                                                                                       facteurs / prix de base

          Plus: Indirect Taxes / taxes on                                                                                                             Plus taxes indirectes/impôts sur les
                                                       3.8        1.2        4.5        4.2      -20.4       10.6         5.0        4.6        ...
          products, less subsidies                                                                                                                        produits, moins les subventions

          Gross domestic product at market                                                                                                              Produit intérieur brut aux prix du
                                                       3.3        6.3        4.8        3.0        7.8         2.7        5.6        4.9       4.1
          prices                                                                                                                                                                   marché


      2009: Estimated       2010: Provisional                                                                                              2009: Estimée               2010:Provisoire


      African Statistical Yearbook 2011 / Annuaire Statistique pour l'Afrique 2011
Morocco                                                                                                                                                                    Maroc

Expenditure on Gross domestic product at constant purchasers'
                                                                                                         Emplois du produit intérieur brut aux prix constants d'acquisition
values

Annual Growth Rates (%)                                                                                                                    Taux de croissance annuel (%)
                                                                                                                                                             Consommation finale des
Government final consumption                    0.6         2.2         4.3         3.5         2.9         4.3         4.8       11.2      ...
                                                                                                                                                             administrations publiques

Private final consumption                       3.6         7.3         4.9         2.3         4.9         2.9         5.4        6.5      ...            Consommation finale privée

Gross fixed capital formation                   7.3         7.7         8.4         7.4         9.7        14.3        11.0        3.0      ...        Formation brute de capital fixe

Exports of goods and services                   5.7         0.6         6.3        13.3        11.6         5.2         7.3      -13.1      ...      Exportations de biens et services

                                                                                                                                                       Moins importations de biens et
Less imports of goods and services              6.4         7.1         9.9         9.6         8.2        15.0        12.2       -6.0      ...
                                                                                                                                                                             services


                                                                                   III INFLATION

                                            2002        2003        2004        2005        2006        2007        2008       2009      2010
Annual Growth Rates (%)                                                                                                                    Taux de croissance annuel (%)
All Item                                        2.8         1.2         1.5         1.0         3.3         2.0         3.9        0.2     0.2                               Ensemble

Food                                            4.3         1.3         1.6         0.3         3.9         3.2         6.8        0.3     2.1                            Alimentation

Health                                          1.1         1.8         1.8         1.1         0.8         0.7         0.3       -0.2     0.0                                   Santé

Energy                                          1.4         1.1         2.3         1.1         3.0         4.0         0.3        0.0    -0.1                                  Energie

Transport                                       0.6         0.2         0.9         4.5         8.9        -2.8         1.4       -0.1     0.1                               Transport


                                                  IV AGRICULTURAL PRODUCTION - PRODUCTION AGRICOLE

                                            2002        2003        2004        2005        2006        2007        2008       2009      2010
Tons (Thousand)                                                                                                                                                 Tonnes (milliers)
Wheat, Tons (thousands)                     23 252      33 806      35 151      21 024      42 313      10 688      25 295     43 384       ...            Blé tendre, tonnes (milliers)

Barley, Tons (thousands)                    16 690      26 204      27 603      11 021      25 351       7 626      13 532     37 860       ...                 Orge, tonnes (milliers)
Wheat (Triticum durum), Tons
                                            10 315      17 662      20 248       9 407      20 955       5 138      12 400     20 330       ...               Blé dur, tonnes (milliers)
(thousands)
Sugar cane, Tons (thousands)                 9 491       8 986       8 722       7 823       9 966       9 339       9 126      8 130       ...       Canne à sucre, tonnes (milliers)

Maize, Tons (thousands)                      1 989       1 386       2 241         501       2 974         949       1 210      2 045       ...                  Maïs, tonnes (milliers)


                                                         V MINING PRODUCTION - PRODUCTION MINIERE
                                                                                                                                                                                           247
                                            2002        2003        2004        2005        2006        2007        2008       2009      2010


Phosphates (dry), Tons (thousands)         23 038.0    22 877.0    25 369.0    27 254.0    27 386.0    27 834.0    24 788.0   18 307.0      ...     Phosphates secs, tonnes (milliers)

Copper, Tons                               17 799.0    17 539.0    10 308.0    12 654.0    17 811.0    19 891.0    27 619.0   42 100.0      ...                         Cuivre, tonnes


Zinc, Tons                                178 476.0   136 433.0   139 309.0   151 273.0   148 690.0   111 081.0   161 493.0   88 400.0      ...                            Zinc, tonnes


                                                                              VI ENERGY - ENERGIE

                                            2002        2003        2004        2005        2006        2007        2008       2009      2010

Electricity - total hydro production,                                                                                                              Électricité - production hydraulique
                                             846.2      1 441.9     1 605.6     1 417.7     1 585.8     1 315.8     1 360.6    2 951.1      ...
kilowatt hours (millions)                                                                                                                             totale, kilowatt-heures (millions)

Electricity - total thermal production,                                                                                                              Électricité - production thermique
                                           13 073.9    13 698.3    14 581.4    17 548.7    18 058.1    18 047.4    18 641.6   21 932.9      ...
kilowatt hours (millions)                                                                                                                             totale, kilowatt-heures (millions)

Electricity - total production, self-                                                                                                             Electricité - Production totale privée
                                               282         291         279         287         278         295         284        125       ...
producer (Million Kilowatt Hours)                                                                                                                           (million de kilowatt heures)

Electricity - total production, public                                                                                                                   Electricité - Production totale
                                            13 821      15 048      16 105      18 871      19 545      19 344      20 023     24 884       ...
(Million Kilowatt Hours)                                                                                                                          publique (million de kilowatt heures)


                                                                                                  African Statistical Yearbook 2011 / Annuaire Statistique pour l'Afrique 2011
Morocco                                                                                                                                                                         Maroc
                                                  VII TOURISM AND INFRASTRUCTURE - TOURISME ET INFRASTUCTURE

                                                   2002       2003        2004        2005        2006          2007         2008         2009       2010

         Arrivals - Tourists (thousands)            4.303       4.761       5.516       5.174       5.217        5.412        5.412        6.239          ...           Arrivées - touristes (milliers)

         Rooms in hotels and similar                                                                                                                          Chambres d'hotels et établissements
         establishments (thousands)                    49          53        57.4        59.8          64           68           73           78          ...                  assimilés (milliers)

         Paved Road (% of total)                       55          55          60          60          60           62           62           62          ...        Routes asphaltées (% du total)
         Total Network (Railways-km)               57 227      57 227      58 523      58 467      58 410       58 309       58 309       58 309          ...         Réseau total voies ferrées-Km
         Main Telephone Lines (per 1,000                                                                                                                            Lignes téléphoniques fixes (pour
                                                       38          41          44          45          42           79           97          113          ...
         inhabitants)                                                                                                                                                               1000 habitants)
         Mobile Cellular Subscribers (per                                                                                                                           Abonnés aux téléphones mobiles
                                                      209         245         312         415         535          657          740          812          ...
         1,000 inhabitants)                                                                                                                                                  (pour 1000 habitants)


                                   VII FINANCIAL AND MONETARY STATISTICS - FINANCES ET STATISTIQUES MONETAIRES

                                                   2002       2003        2004        2005        2006          2007         2008         2009       2010

         VII-1 Monetary Statistics                                                                                                                         VII-1 Statistiques monétaires
         Dirham (Millions)                                                                                                                                                    Dirham(Millions)
         Money supply (M1)                        217 424     238 573     262 830     301 485     355 537      428 959      452 624      478 332     503 861                  Masse monétaire (M1)
         Quasi-money                              127 232     133 260     142 565     167 425     201 073      228 405      289 989      301 016     305 624                          Quasi-monnaie
           of which Demand Deposit                      ...         ...         ...         ...         ...          ...          ...          ...        ...              dont Monnaie scripturale
         Net foreign assets                       100 529     124 791     143 163     165 997     191 537      208 069      197 099      192 714     193 036                   Avoirs extérieurs nets
         Domestic credit                          317 162     328 070     345 466     387 113     454 910      563 125      681 168      739 719     790 957                          Crédit intérieur

         of which claims on private sector        193 248     202 289     215 161     243 538     280 858      359 834      435 630      474 159     525 443      dont créances sur le secteur privé

         of which Claims on government                                                                                                                                   dont créances nettes sur le
                                                   88 740      88 715      83 006      91 509      96 507      101 087       99 897       91 337      94 651
         sector, net                                                                                                                                                                 gouvernement
         International reserves (millions of US                                                                                                                 Réserves internationales (millions de
                                                   10 133      13 851      16 337      16 187      20 341       24 123       22 104       22 797      22 588
         $)                                                                                                                                                                                     $ EU)
         Average Exchange Rate (National                                                                                                                         Taux de change (moyen) (monnaie
                                                    11.02        9.57        8.87        8.87        8.80         8.19         7.75         8.06        8.42
         Currency per us $)                                                                                                                                                  nationale par dollars)


         VII-2 Public Finance                                                                                                                                       VII-2 Finances publiques
         Dirham (Millions)                                                                                                                                                    Dirham(Millions)
         Total Revenues and Grants                 98 883     109 386     117 482     132 223     147 104      171 707      204 675      190 525          ...               Recettes totales et dons
           Tax Revenue                             87 667      91 219      97 564     110 384     125 305      150 123      185 651      169 008          ...                       Recettes fiscales
           Non Tax Revenue                          7 862      14 939      16 427      17 807      18 870       18 400       16 269       18 302          ...                  Recettes non fiscales
248        Grants                                     500         500       1 300       2 500       2 928        3 183        9 068        2 800          ...                                   Dons

         Total Expenditures and Net Lending        93 463     101 429     113 472     119 219     138 143      166 569      194 776      198 451          ...         Dépenses totales et prêts nets

           Current expenditure                     90 491      97 545     105 098     127 229     123 919      133 869      157 036      152 090          ...                   Dépenses courantes
           Of which Wages and Salaries             48 580      53 225      56 559      61 897      63 164       65 665       70 315       75 264          ...         Dont rémunérations et salaires
           Capital expenditure                     20 253      19 818      21 403      20 519      23 846       28 212       37 740       46 361          ...               Dépenses d'équipement
           Net Lending                             17 281      15 934      13 030      28 529       9 622        4 488        6 829        8 008          ...                              Prêts nets
         Fiscal Balance                             8 392      11 841      12 384       4 994      23 184       37 838       47 639       38 435          ...        Solde global y compris les dons


         VII-3 Balance of Payments                                                                                                                              VII-3 Balance des paiements
         Dirham (Millions)                                                                                                                                                    Dirham(Millions)
         Trade balance                            - 44 020    - 41 493    - 57 546    - 72 766    - 82 639    - 115 327    - 150 963    - 133 332         ...                  Balance commerciale
         Services Balance                          21 452      25 053      30 046      37 764      47 119       55 179       51 475       45 427          ...                   Balance des services
         Net Income                                - 8 137     - 7 559     - 5 773     - 2 737     - 3 699      - 3 320      - 4 070      - 7 352         ...                           Revenus nets
         Current transfers, net total              36 700      39 237      43 106      47 760      55 544       62 897       67 622       58 449          ...                    Transferts courants
         Current account balance                    5 995      15 238       9 833      10 020      16 325        - 571      - 35 937     - 36 808         ...              Solde du compte courant


         VII-4 External Debt and Financial Flows                                                                                                VII-4 Dette extérieure et flux financiers
         US $ (Millions)                                                                                                                                                         $ E.U (Millions)
         Total external debt                       15 721      16 752      16 588      14 431      15 661       17 821       18 291       21 163      22 144                  Dette extérieure totale
           Private                                  4 262       5 092       4 962       3 770       3 776        4 039        2 987        3 243       3 394                                   Privée
           Public                                  11 459      11 660      11 626      10 661      11 885       13 781       15 305       17 919      18 750                                Publique
         Total external debt service                2 800       3 352       2 826       2 645       2 336        2 702        2 601        1 971       2 037           Service de la dette extérieure
         Net Foreign Direct Investment                                                                                                                          Investissements étranger direct (flux
                                                      481       2 314         895       1 653       2 450        2 803        2 487        1 331          ...
         Inflows                                                                                                                                                                      nets entrants)
         Net Total Official Development                                                                                                                            Aide publique au développement
                                                      353         548         705         691       1 044        1 073        1 063          912          ...
         assistance                                                                                                                                                                   (nette totale)


      African Statistical Yearbook 2011 / Annuaire Statistique pour l'Afrique 2011
Morocco                                                                                                                                                       Maroc

                                       2002       2003       2004       2005       2006        2007       2008       2009      2010

Dirham (Millions)                                                                                                                                                Dirham
Exports, fob                                                                                                                                        Exportations, fàb


Exports - Total                        86 389     83 887     86 365     94 825    104 785     123 941    155 740    111 967        ...                 Exportations - Total


Main Products                                                                                                                                       Principaux produits


Clothing finished                      18 451     18 549     18 676     17 899     20 699      20 474     18 923     17 752        ...                     Vëtements finis


Hosiery                                 7 936      8 109      7 641      6 847      7 192       7 882      6 659      6 460        ...              Articles de bonneterie


Crustaceans, molluscs and shellfish     5 926      4 260      2 657      3 945      4 266       5 165      2 108      2 028        ... Crustacés, mollusques et coquillages


Phosphoric acid                         5 128      4 856      6 320      7 641      7 891       9 069     22 830      8 042        ...                 Acide phosphorique


Phosphates                                364        363        421        518        545         712      2 306        643        ...                         Phosphates

Main Destinations                                                                                                                              Principales destinations

France                                29 084.0   28 679.0   29 521.0   29 829.0   32 518.0    34 104.0   31 384.0   27 464.0       ...                              France


Spain                                 13 520.0   14 967.0   15 358.0   19 844.0   22 620.0    25 184.0   27 862.0   23 710.0       ...                            Espagne


Italy                                  4 677.0    4 321.0    4 099.0    4 962.0    5 587.0     6 480.0   10 520.0    3 673.0       ...                                Italie


United Kingdom                         6 834.0    6 110.0    6 710.0    6 289.0    6 867.0     6 388.0    7 538.0    3 469.0       ...                   Grande Bretagne


India                                  2 851.0    2 612.0    3 001.0    3 939.0    4 456.0     4 853.0    7 260.0    5 950.0       ...                                Inde


                                       2002       2003       2004       2005       2006        2007       2008       2009      2010
Imports, cif                                                                                                                                        Importations, cif

Imports - Total                       130 409    136 070    157 921    184 380    210 554     261 288    326 042    265 188        ...      Importations - Total (millions)    249

                                                                                                                                                    Principaux produits
Main Products


Petroleum oils, crude                   1 172        965      1 641      2 702      2 866       3 217      3 983      2 139        ...              Huile brute de pétrole


Gaz-oils & fuel-oils                    1 546      4 375      3 201      4 990      7 365      10 024     17 684     15 721        ...                 Gaz-oils et fuel-oils


Machinery and apparatus, diverse        4 909      5 604      6 247      7 210      8 693       9 636     11 087     10 235        ...        Machines et appareils divers


Fabrics                                 9 025      8 735      8 179      7 897      8 223       8 426      3 379      3 260        ...                               Tissus


Passenger Cars                          2 417      2 477      3 904      5 026      6 235       7 691      9 873      8 314        ...               Voitures de tourisme


Main Origin                                                                                                                                   Principales provenances

France                                26 761.0   27 895.0   29 148.0   33 483.0   37 140.0    41 607.0   48 950.0   41 584.0       ...                              France

Spain                                 15 159.0   16 873.0   19 246.0   21 448.0   24 128.0    27 544.0   36 447.0   31 968.0       ...                            Espagne

Italy                                  7 566.0    9 693.0   10 312.0   11 103.0   13 299.0    16 695.0   21 820.0   18 850.0       ...                                Italie

USA                                    5 615.0    5 513.0    6 501.0    6 104.0    9 492.0    15 442.0   21 742.0   14 409.0       ...                          Etats-Unis

China                                  3 753.0    4 656.0    6 602.0    9 399.0   11 069.0    15 146.0   18 538.0   17 298.0       ...                               Chine


                                                                                         African Statistical Yearbook 2011 / Annuaire Statistique pour l'Afrique 2011
Mozambique                                                                                                                                                              Mozambique

         AREA (KM 2)                                                                                     801 590                                                                    SUPERFICIE (KM 2)
         CAPITAL CITY                             Maputo                                                                                                Maputo                                  CAPITALE
         CURRENCY                                 New Metical                                                                                           Metical                                 MONNAIE


                                 I SOCIAL AND DEMOGRAPHIC INDICATORS — INDICATEURS DEMOGRAPHIQUES ET SOCIAUX

                                                    2002        2003         2004         2005        2006         2007         2008         2009         2010
         Population                                                                                                                                                                          Population
                                                                                                                                                                         Population au milieu de l'année -
         Mid-year population - Total (Million)         18.1        18.5         19.0         19.4        19.9         20.4         20.9         21.4           ...
                                                                                                                                                                                            Total (million)
                                                                                                                                                                         Population au milieu de l'année -
         Mid-year population - Urban (%)               30.1        30.4         30.7         31.0        30.2         29.8         31.7         31.9           ...
                                                                                                                                                                                            Urbaine (%)

         Female (%)                                    51.9        51.8         51.8         51.8        51.7         51.7         51.6         51.6           ...                             Femme (%)


         Population by Age Group                                                                                                                                             Population par groupe d'âge


            0-14                                   8026 107    8180 899     8329 883     8476 450    8624 600     9398 100     9652 100     9909 100     1017 060                                      0-14


            15-64                                  9564 288    9837 802    10127 492    10429 508   10739 210    10589 400    10896 500    11664 771    11555 300                                     15-64


            65+                                     487 175     495 125      504 128      514 078     524 866      645 000      659 300      562 120      690 900                                      65+


         Active Population (000)                    8 963.1     9 157.3      9 341.9      9 517.9     9 691.2      9 873.2     10 049.4     12 226.9           ...                 Population active (000)

            Female (%)                                 56.0        56.0         56.1         56.1        56.1         56.0         55.9         55.9           ...                             Femme (%)

                                                                                                                                                                        Taux brut de natalité - Total (par
         Crude birth rate - Total (per 1000)           41.8        41.3         40.9         40.5        40.2         42.2         42.0         41.8         41.6
                                                                                                                                                                                                    1000)
                                                                                                                                                                      Taux brut de mortalité - Total (par
         Crude death rate - Total (per 1000)           17.8        17.2         16.8         16.4        16.2         14.6         14.3         14.0         13.7
                                                                                                                                                                                                   1000)
         Life expectancy at birth - Total                                                                                                                               Espérance de vie à la naissance -
                                                       45.6        46.3         46.7         47.1        47.4         50.9         51.3         51.7         52.1
         (years)                                                                                                                                                                          Total (années)
         Net reproduction rate - (per                                                                                                                                    Taux net de reproduction - (par
                                                         ...         ...          ...         1.7          ...          ...          ...          ...          ...
         woman)                                                                                                                                                                                  femme)
                                                                                                                                                                        Indice synthétique de fécondité -
         Total fertility rate - (p woman)
                       y        (per    )               5.5         5.5          5.4          5.4         5.3          5.7          5.7          5.6          5.6
                                                                                                                                                                                            (par femme)

         Education                                                                                                                                                                      Enseignement

         Teaching staff at first level - Total                                                                                                                        Personnel enseignant - 1er degré -
                                                      38.75        42.8         46.6         45.9        48.5         53.1         56.6           ...          ...
         (thousands)                                                                                                                                                                     Total (milliers)
         Teaching staff at second level - Total                                                                                                                      Personnel enseignant - 2ème degré -
250                                                    7.43         9.1         10.5         11.0        12.1         14.9         17.3           ...          ...
         (thousands)                                                                                                                                                                      Total (milliers)
         Teaching staff at third level - Total                                                                                                                       Personnel enseignant - 3ème degré -
                                                        3.5         4.1          5.2          5.9         6.4          8.1         10.0           ...          ...
         (thousands)                                                                                                                                                                      Total (milliers)
         First level student enrollment - Total                                                                                                                         Elèves inscrits - 1er degré - Total
                                                      3 023       3 250        3 569        3 942       4 171        4 566        4 900        5 060        5 352
         (thousands)                                                                                                                                                                              (milliers)
         First level student enrollment -                                                                                                                            Elèves inscrits - 1er degré - Femmes
                                                      1 334       1 455        1 618        1 803       1 936        2 121        2 285        2 371        2 533
         Female (thousands)                                                                                                                                                                        (milliers)
         Second level student enrollment -                                                                                                                            Elèves inscrits - 2ème degré - Total
                                                       303         351          409          453         496          616          637          735          908
         Total (thousands)                                                                                                                                                                       (milliers)
         Second level student enrollment -                                                                                                                                  Elèves inscrits - 2ème degré -
                                                       119         140          166          185         208          265          274          325          414
         Female (thousands)                                                                                                                                                             Femmes (milliers)
         Third level student enrollment - Total                                                                                                                       Elèves inscrits - 3ème degré - Total
                                                         ...       17.2         22.3         28.3          ...        63.5         75.5         81.3           ...
         (thousands)                                                                                                                                                                             (milliers)
         Third level student enrollment -                                                                                                                                   Elèves inscrits - 3ème degré -
                                                         ...        5.5          7.0          9.4          ...        24.2         29.1         30.8           ...
         Female (thousands)                                                                                                                                                             Femmes (milliers)
         Public expenditure on education (%                                                                                                                             Dépenses publiques consacrées à
                                                       22.9        19.2         20.9         20.4        21.5         19.5         20.0         19.5         20.2
         of budget)                                                                                                                                                       l'enseignement (% du budget)

         Health                                                                                                                                                                                     Santé

         Hospital beds - Total (per 10 000                                                                                                                              Nombre de lits d'hôpitaux - Total
                                                        91          89           90           87          89           78           83           86           89
         population)                                                                                                                                                                       (pour 10 000)
         Nurses - Total (per 10 000                                                                                                                                    Nombre d'infirmières - Total (pour
                                                        27          27           33           30          22           23           24           24           24
         population)                                                                                                                                                                             10 000)
         Physicians - Total (per 10 000                                                                                                                                Nombre de médecins - Total (pour
                                                          3          2             3            3           3            3            4            4            4
         population)                                                                                                                                                                           10 000)
         Public expenditure on Health (% of                                                                                                                          Dépenses publiques consacrées à la
                                                        10          10             9          13          16           15           17           17           17
         budget)                                                                                                                                                                  santé (% du budget)


      African Statistical Yearbook 2011 / Annuaire Statistique pour l'Afrique 2011
Mozambique                                                                                                                                           Mozambique
                                                     II NATIONAL ACCOUNTS — COMPTES NATIONAUX

                                        2002        2003      2004      2005      2006         2007      2008       2009        2010

Gross domestic product by kind of economic activity at current prices
                                                                                      Produit intérieur brut par branche d'activité économique aux prix courants


New Metical (Millions)                                                                                                                                   Metical(Millions)

Agriculture                             25 289       28 132    31 879    37 122    45 853      52 829     64 368     71 651          ...                            Agriculture

Mining and quarrying                         523       657      1 161     1 476     2 337       2 967      3 318      3 566          ...                 Industries extractives

Manufacturing                           12 623       16 636    20 529    21 304    26 355      29 370     33 610     34 449          ...            Industries manufacturières

Electricity, gas & water                 4 415        5 071     6 359     7 606     9 579      11 065     10 044     11 586          ...                 Electricité, gaz et eau

Construction                             3 482        3 826     3 835     4 507     5 213       5 936      6 860      7 533          ...          Bâtiments et travaux publics
Wholesale & retail trade,                                                                                                                      Commerce de gros et de détail,
                                        12 187       12 645    13 712    20 355    25 579      32 051     37 238     41 638          ...
restaurants, hotels                                                                                                                                     restaurants et hôtels
                                                                                                                                                Banques, assurances, affaires
Finance, insurance, real estate, etc.   13 979       14 320    15 720    18 056    19 318      21 313     23 016     24 762          ...
                                                                                                                                                                immobilières
Transport and communications             9 896       10 421    12 415    14 560    16 458      19 011     22 180     24 913          ...       Transport(s) et communications
                                                                                                                                                  Administrations publiques et
Public administration and defense        3 706        4 134     5 005     5 659     6 640       7 350      8 519      9 848          ...
                                                                                                                                                                      défense
Other services                           6 605        7 365     8 760    10 185    11 984      14 094     16 512     18 777          ...                        Autres services
                                                                                                                                               Moins Services d’intermédiation
Less Imputed Service Charges            - 1 806     - 2 867   - 3 085   - 3 137   - 4 732      - 5 335    - 5 688   - 6 403          ...
                                                                                                                                                                     financière
Gross domestic product at factor                                                                                                           Produit intérieur brut aux couts des
                                        90 897      100 341   116 290   137 692   164 584     190 652    219 977    242 322          ...
cost / basic prices                                                                                                                                      facteurs / prix de base

Plus: Indirect Taxes / taxes on                                                                                                            Plus taxes indirectes/impôts sur les
                                         8 582       10 632    12 379    14 015    15 658      16 991     20 380     23 891          ...
products, less subsidies                                                                                                                       produits, moins les subventions


Expenditure on Gross domestic product at current purchaser's values
                                                                                                  Emploi du produit intérieur brut aux prix courants d'acquisition

New Metical (Millions)                                                                                                                                   Metical(Millions)
                                                                                                                                                     Consommation finale des
Government final consumption            12 247       14 156    17 729    19 663    22 228      24 738     29 691     34 368          ...
                                                                                                                                                     administrations publiques

Private final consumption               87 757       98 481   109 881   126 354   143 382     166 398    192 513    214 369          ...           Consommation finale privée

Gross fixed capital formation           29 802       24 721    23 997    28 361    31 819      33 504     39 614     43 959          ...        Formation brute de capital fixe

Increase in inventories                  - 367         226      - 392   - 1 544   - 1 187      - 1 721     2 677    - 4 164          ...                   Variation des stocks

Exports of goods and services           24 816       29 137    38 341    46 213    54 861      64 146     72 638     73 799          ...     Exportations de biens et services
                                                                                                                                                Moins importations de biens et
                                                                                                                                                                                   251
Less imports of goods and services      54 776       55 747    60 888    67 340    70 861      79 423     96 775     96 119          ...
                                                                                                                                                                      services
GDP at purchasers' values               99 479      110 973   128 668   151 707   180 242     207 644    240 358    266 213          ...             PIB aux prix d'acquisition


Gross domestic product by kind of economic activity at constant
                                                                                     Produit intérieur brut par branche d'activité economique aux prix constants
prices
Annual Growth Rates (%)                                                                                                             Taux de croissance annuel (%)
Agriculture                                  11.2       5.4       4.8       6.5      10.2         8.2        9.1        6.0         5.9                             Agriculture

Mining and quarrying                         28.7      16.1      71.6       0.7      27.8        19.3        7.2        3.0         6.6                  Industries extractives

Manufacturing                                 8.7      17.0      13.2       2.1       3.0         3.1        4.9        2.4         1.8             Industries manufacturières

Electricity, gas & water                     10.4      10.1      16.3      17.2      13.1         8.6      -12.2       13.0         4.9                  Electricité, gaz et eau

Construction                                 10.8       9.7      -7.0      13.2      10.4        11.8       12.5        5.8         8.3           Bâtiments et travaux publics
Wholesale & retail trade,                                                                                                                             Commerce de gros et de
                                              4.6       6.5       6.6      12.3      19.9         9.4        7.6        5.6         5.8
restaurants, hotels                                                                                                                                 détail,restaurants et hôtels
                                                                                                                                                 Banques, assurances, affaires
Finance, insurance, real estate, etc.         4.0       3.4      10.9      15.3       1.9         3.4        1.7        5.2         7.3
                                                                                                                                                                 immobilières
Transport and communications                  8.4       2.9       9.6       7.9      10.4         9.7       13.0       10.2         7.3        Transport(s) et communications
                                                                                                                                                  Administrations publiques et
Public administartion and defense             7.4       4.8       4.6       6.9      11.2         5.1        7.2        7.5        11.8
                                                                                                                                                                      défense
Other services                                4.4       5.9       7.9       8.1       7.7        10.6        6.2        8.1         5.3                         Autres services
                                                                                                                                               Moins Services d’intérmediation
Less Imputed Service Charges                 23.7      65.5      15.0       6.6      27.7         2.9        6.5        9.3        16.1
                                                                                                                                                                     financière
Gross domestic product at factor                                                                                                           Produit intérieur brut aux couts des
                                              7.7       6.1       8.3       8.8       8.7         7.6        6.2        6.2         5.6
cost / basic prices                                                                                                                                      facteurs / prix de base

Plus: Indirect Taxes / taxes on                                                                                                            Plus taxes indirectes/impôts sur les
                                             26.3      10.3       4.2       4.6       8.6         4.5       13.0        7.6        16.7
products, less subsidies                                                                                                                       produits, moins les subventions

Gross domestic product at market                                                                                                             Produit intérieur brut aux prix du
                                              9.2       6.5       7.9       8.4       8.7         7.3        6.8        6.3         6.6
prices                                                                                                                                                                  marché


2009: semi-final            2010:Estimated                                                                              2009: semi-définitif                   2010:Estimée


                                                                                        African Statistical Yearbook 2011 / Annuaire Statistique pour l'Afrique 2011
Mozambique                                                                                                                                                       Mozambique

         Expenditure on Gross domestic product at constant purchasers'
                                                                                                                 Emplois du produit intérieur brut aux prix constants d'acquisition
         values

         Annual Growth Rates (%)                                                                                                                        Taux de croissance annuel (%)
                                                                                                                                                                          Consommation finale des
         Government final consumption                  25.4         8.7         9.1         5.3        10.2         7.2        12.4         8.7          ...
                                                                                                                                                                          administrations publiques

         Private final consumption                     34.9         5.4         4.3         7.0         4.5         7.5         8.7         4.6          ...            Consommation finale privée

         Gross fixed capital formation                 33.6        -7.8        -5.6        10.2         6.2         5.8        17.8         5.4          ...         Formation brute de capital fixe

         Exports of goods and services                 38.3        19.0        21.3         6.3        12.2        15.9         0.3         2.3          ...      Exportations de biens et services

                                                                                                                                                                     Moins importations de biens et
         Less imports of goods and services          104.6          4.6         1.7         5.5         1.2        12.8        18.0         1.0          ...
                                                                                                                                                                                           services


                                                                                           III INFLATION

                                                    2002        2003        2004        2005        2006        2007        2008        2009        2010
         Annual Growth Rates (%)                                                                                                                        Taux de croissance annuel (%)
         All Item                                       9.1       11.4          9.3       13.1          8.1       12.1        11.8          2.3       17.4                                 Ensemble

         Food                                           8.0       11.8          7.7       15.4          7.9       16.1        16.8          3.4       21.6                              Alimentation

         Health                                       18.8        10.3          2.6         4.9       11.6          5.0         7.1         5.9         6.1                                    Santé

         Energy                                       12.7        11.2        23.3        19.1        16.9        14.9          8.3        -7.0       14.6                                   Energie

         Transport                                    13.9        10.7          7.7       22.9          2.5         6.4         3.4        -0.6         7.5                                Transport


                                                          IV AGRICULTURAL PRODUCTION - PRODUCTION AGRICOLE

                                                    2002        2003        2004        2005        2006        2007        2008        2009        2010
         Tons (Thousand)                                                                                                                                                      Tonnes (milliers)
         Cassava, Tons (thousands)                   5 925       6 825       6 916       7 276       7 552       8 160       8 462       9 600       9 738                 Manioc, tonnes (milliers)

         Maize, Tons (thousands)                     1 236       1 248       1 435       1 464       1 534       1 579       1 709       1 854       2 090                    Maïs, tonnes (milliers)

         Beans, Tons (thousands)                       198         205         194         209         219         225         240         252         264                Haricots, tonnes (milliers)

         Rice, Tons (thousands)                        168         200         187         177         183         196         213         369         258                      Riz, tonnes (milliers)

         Sorghum, Tons (thousands)                     314         322         310         330         339         348         380         391         389                 Sorgho, tonnes (milliers)


                                                                 V MINING PRODUCTION - PRODUCTION MINIERE
252
                                                    2002        2003        2004        2005        2006        2007        2008        2009        2010


         Natural Gaz, terajoule (thousands)            88.6        54.8        49.7        88.9      104.2       104.5       116.6       120.9       124.8          Gaz naturel, térajoule (milliers)

         Bauxite, Tons                              9 119.0    11 793.0     8 977.3     9 518.0    11 069.0     8 650.0     5 443.0     3 612.0     8 556.2                          Bauxite, tonnes


         Natural Coal, Tons (thousands)                 9.1        11.8        16.5         3.4        41.0        23.6        37.7        25.9        38.2       Houille naturelle, tonnes (milliers)


                                                                                       VI ENERGY - ENERGIE

                                                    2002        2003        2004        2005        2006        2007        2008        2009        2010

         Electricity - total hydro production,                                                                                                                  Électricité - production hydraulique
                                                   11 583.6    10 626.6    11 559.4    13 105.0    14 490.7    16 287.1    14 767.6    16 289.7    16 526.5
         kilowatt hours (millions)                                                                                                                                 totale, kilowatt-heures (millions)

         Electricity - total thermal production,                                                                                                                  Électricité - production thermique
                                                     296.4       276.5       148.3       167.5       224.6       200.1       351.9       386.2           ...
         kilowatt hours (millions)                                                                                                                                 totale, kilowatt-heures (millions)

         Electricity - total production, self-                                                                                                                 Electricité - Production totale privée
                                                         ...         ...         ...         ...         ...         ...         ...         ...         ...
         producer (Million Kilowatt Hours)                                                                                                                               (million de kilowatt heures)

         Electricity - total production, public                                                                                                                       Electricité - Production totale
                                                    11 880      10 903      11 708      13 272      14 664      16 356      15 120      16 676           ...
         (Million Kilowatt Hours)                                                                                                                              publique (million de kilowatt heures)


      African Statistical Yearbook 2011 / Annuaire Statistique pour l'Afrique 2011
Mozambique                                                                                                                                                                      Mozambique
                                         VII TOURISM AND INFRASTRUCTURE - TOURISME ET INFRASTUCTURE

                                           2002          2003          2004          2005          2006            2007          2008        2009        2010

Arrivals - Tourists (thousands)                541           441           470           578         664.3             771       1951.49           ...         ...           Arrivées - touristes (milliers)

Rooms in hotels and similar                                                                                                                                        Chambres d'hotels et établissements
establishments (thousands)               3.7440576     3.7964601     4.9744469     5.0629439     5.1565433     5.251546988     5.3762415           ...         ...                  assimilés (milliers)

Paved Road (% of total)                         19            19            19            18            18              18            18           ...         ...        Routes asphaltées (% du total)
Total Network (Railways-km)                 28 463        28 463        28 463        29 341        29 341          29 323        29 324           ...         ...         Réseau total voies ferrées-Km
Main Telephone Lines (per 1,000                                                                                                                                          Lignes téléphoniques fixes (pour
                                                  4            4             4             3             3               3             3           ...         ...
inhabitants)                                                                                                                                                                             1000 habitants)
Mobile Cellular Subscribers (per                                                                                                                                         Abonnés aux téléphones mobiles
                                                13            22            35            73           112             154           197           ...         ...
1,000 inhabitants)                                                                                                                                                                (pour 1000 habitants)


                          VII FINANCIAL AND MONETARY STATISTICS - FINANCES ET STATISTIQUES MONETAIRES

                                           2002          2003          2004          2005          2006            2007          2008        2009        2010

VII-1 Monetary Statistics                                                                                                                                       VII-1 Statistiques monétaires
New Metical (Millions)                                                                                                                                                              Metical(Millions)
Money supply (M1)                           20 459        23 661        24 921        32 006        38 037          46 364        53 867      73 901      88 802                   Masse monétaire (M1)
Quasi-money                                  7 677         8 825         9 198        10 400        13 437          18 620        26 652      33 174      40 027                           Quasi-monnaie
  of which Demand Deposit                        ...           ...           ...           ...           ...             ...           ...         ...         ...              dont Monnaie scripturale
Net foreign assets                          11 006        14 764        26 117        34 084        47 607          54 283        56 957      63 737      76 677                    Avoirs extérieurs nets
Domestic credit                             12 161        11 370        10 475        12 596        14 558          20 895        33 520      60 111      81 144                           Crédit intérieur

of which claims on private sector           12 817        12 656        12 179        17 965        23 898          28 055        43 995      65 981      85 342       dont créances sur le secteur privé

of which Claims on government                                                                                                                                                 dont créances nettes sur le
                                            - 2 321       - 2 856       - 3 123       - 7 381      - 11 932         - 9 983      - 11 523    - 11 330    - 11 835
sector, net                                                                                                                                                                               gouvernement
International reserves (millions of US                                                                                                                               Réserves internationales (millions de
                                               802           938         1 131         1 054         1 156           1 445         1 578       2 099       1 925
$)                                                                                                                                                                                                   $ EU)
Average Exchange Rate (National                                                                                                                                       Taux de change (moyen) (monnaie
                                             23.68         23.78         22.58         23.06         25.40           25.84         24.30       27.52       33.95
Currency per us $)                                                                                                                                                                nationale par dollars)


VII-2 Public Finance                                                                                                                                                     VII-2 Finances publiques
New Metical (Millions)                                                                                                                                                              Metical(Millions)
Total Revenues and Grants                   22 003        25 304        27 865        30 320        44 954          51 841        60 903      52 762           ...               Recettes totales et dons
  Tax Revenue                               10 629        13 695        14 434        16 721        23 314          29 310        33 344      29 848           ...                       Recettes fiscales
  Non Tax Revenue                            1 427         1 019         2 128         3 662         3 683           3 748         4 924       3 956           ...                  Recettes non fiscales
  Grants                                     9 947        10 590        11 303         9 937        17 957          18 783        22 635      18 958           ...                                   Dons      253
Total Expenditures and Net Lending          28 709        33 373        32 728        35 637        46 871          56 777        67 275      58 933           ...         Dépenses totales et prêts nets

  Current expenditure                       13 469        16 342        19 006        20 365        26 602          31 838        37 634      34 367           ...                   Dépenses courantes
  Of which Wages and Salaries                6 206         7 734         9 195        10 358        12 993          16 091        19 273      18 149           ...         Dont rémunérations et salaires
  Capital expenditure                       12 073        13 369        12 880        13 101        18 635          23 298        27 742      21 740           ...               Dépenses d'équipement
  Net Lending                                3 167         3 662           842         2 171         1 634           1 641         1 899       2 826           ...                              Prêts nets
Fiscal Balance                              - 6 706       - 8 069       - 4 863       - 5 317       - 1 917         - 4 936       - 6 372     - 6 171          ...        Solde global y compris les dons


VII-3 Balance of Payments                                                                                                                                            VII-3 Balance des paiements
New Metical (Millions)                                                                                                                                                              Metical(Millions)
Trade balance                                - 667         - 604         - 346         - 497         - 268           - 399         - 990      - 1 275      - 997                    Balance commerciale
Services Balance                             - 238         - 270         - 276         - 307         - 372           - 397         - 410       - 457       - 493                     Balance des services
Net Income                                   - 603         - 166         - 300         - 360         - 388           - 592         - 631       - 251        - 85                             Revenus nets
Current transfers, net total                   638           223           314           403           501             592           852         763         671                      Transferts courants
Current account balance                      - 869         - 817         - 607         - 761         - 526           - 795        - 1 179     - 1 220      - 904                Solde du compte courant


VII-4 External Debt and Financial Flows                                                                                                             VII-4 Dette extérieure et flux financiers
US $ (Millions)                                                                                                                                                                       $ E.U (Millions)
Total external debt                          4 988         5 179         8 750         9 040         7 431           5 859         6 102       6 291       6 478                   Dette extérieure totale
  Private                                        0             0         4 334         4 391         4 149           2 542         2 418       2 173       1 983                                    Privée
  Public                                     3 606         3 939         4 416         4 649         3 282           3 317         3 684       4 118       4 495                                 Publique
Total external debt service                     49            57            59            65            62              48            50          47          67            Service de la dette extérieure
Net Foreign Direct Investment                                                                                                                                        Investissements étranger direct (flux
                                               348           337           245           108           154             427           587         893         789
Inflows                                                                                                                                                                                    nets entrants)
Net Total Official Development                                                                                                                                          Aide publique au développement
                                                 ...           ...           ...           ...           ...             ...           ...         ...         ...
assistance                                                                                                                                                                                 (nette totale)


                                                                                                           African Statistical Yearbook 2011 / Annuaire Statistique pour l'Afrique 2011
Mozambique                                                                                                                          Mozambique

                                           2002      2003       2004      2005       2006       2007       2008      2009      2010

         US $ (Millions)                                                                                                                                      Metical
         Exports, fob                                                                                                                           Exportations, fàb


         Exports - Total                     810       1 044     1 504      1 745     2 381      2 412      2 653     2 147     2 243              Exportations - Total


         Main Products                                                                                                                          Principaux produits


         Aluminium                           361        568        915      1 021     1 401      1 480      1 452       868     1 160                        Aluminium


         Electricity                         107        113        102       142        178        240        221       274       277                        Électricité


         Natural Gas                           ...        ...       31       100        110        121        152        78       153                       Gas naturel


         Prawns                              114         76         92        71         87         62         45        24        52                         Crevettes


         Cotton                               16         32         36        56         46         42         48        26         8                            Coton

         Main Destinations                                                                                                                 Principales destinations

         Escandinavian Countries             20.8       29.6     916.5    1 042.9    1 422.2    1 491.7    1 476.4    893.9    1 181.9               Pays scandinaves


         South Africa                       125.0      169.6     211.4      280.4     361.7      414.5      265.5     460.3     466.3                   Afrique du Sud


         Zimbabwe                            54.7       29.5      33.4       46.0      76.1       71.1       81.3      73.8      72.1                        Zimbabwe


         Spain                               76.0       70.0      37.9       32.9      43.5       37.1       51.0      31.4      30.6                          Espagne


         Portugal                            39.9       38.9      47.0       21.9      29.7       31.2       26.4      32.2     108.3                          Portugal


                                           2002      2003       2004      2005       2006       2007       2008      2009      2010
         Imports, cif                                                                                                                            Importations, cif

254      Imports - Total                    1 543      1 753     2 035      2 408     2 869      3 050      4 008     3 764     3 564    Importations - Total (millions)


                                                                                                                                                Principaux produits
         Main Products


         Machinery                           149        285        305       345        398        418        532       536       425                         Machines


         Vehicles                            161        113        118       150        208        217        300       301       249                         Véhicules


         Patrol                               59        114        145       171        234        256        467       324       492                            Patrol


         Row Material for Alumina            320        270        308       386        564        603        675       426       561          Materiau pour Allumine


         Cereals                             113        127        145       173        180        194        244       251       141                          Céréales


         Main Origin                                                                                                                       Principales provenances

         South Africa                       499.2      654.4     666.9    1 002.9     947.9      970.8     1 164.9   1 116.7   1 227.2                  Afrique du Sud

         Portugal                             8.4        9.2     223.2       91.6     180.8      383.9      698.0      57.5     154.3                          Portugal

         United States of America            92.6       62.4      70.6       85.4      89.5      103.6      115.8     146.8      74.3                        Etats-Unis

         India                               78.2      104.3      47.8       70.7     101.6       80.8      160.4     137.4     201.7                          Espagne

         Escandinavian Countries             79.3       72.9       0.6         ...        ...        ...    144.4     158.1     643.0                Pays scandinaves


      African Statistical Yearbook 2011 / Annuaire Statistique pour l'Afrique 2011
Namibia                                                                                                                                                                     Namibie

AREA (KM 2)                                                                                   824 292                                                                 SUPERFICIE (KM 2)
CAPITAL CITY                             Windhoek                                                                                   Windhoek                                      CAPITALE
CURRENCY                                 Namibian Dollar                                                                      Dollar Namibien                                     MONNAIE


                        I SOCIAL AND DEMOGRAPHIC INDICATORS — INDICATEURS DEMOGRAPHIQUES ET SOCIAUX

                                            2002       2003        2004        2005        2006         2007       2008         2009        2010
Population                                                                                                                                                                     Population
                                                                                                                                                           Population au milieu de l'année -
Mid-year population - Total (Million)          1.9         1.9         2.0         2.0         2.0         2.1         2.1          2.2         2.2
                                                                                                                                                                              Total (million)
                                                                                                                                                           Population au milieu de l'année -
Mid-year population - Urban (%)               33.4        34.0        34.5        35.1        35.6        36.2        36.8         37.4        38.0
                                                                                                                                                                              Urbaine (%)

Female (%)                                    51.0        50.9        50.9        50.8        50.8        50.8        50.7         50.7        50.7                              Femme (%)


Population by Age Group                                                                                                                                        Population par groupe d'âge


   0-14                                    763 948     770 965     777 205     782 771     787 664     791 978     796 000      800 103     804 560                                      0-14


   15-64                                  1069 208    1096 806    1125 559    1156 014    1188 415    1222 435    1257 355     1292 161    1326 102                                     15-64


   65+                                      65 314      66 845      68 474      70 244      72 174      74 258      76 499       78 873      81 375                                      65+


Active Population (000)                      637.1       654.6       670.5       691.0       711.6       734.9       759.7        782.7       807.0                  Population active (000)

   Female (%)                                 45.4        45.6        45.7        46.0        46.2        46.5        46.8         46.5        46.6                              Femme (%)

                                                                                                                                                          Taux brut de natalité - Total (par
Crude birth rate - Total (per 1000)           30.0        30.0        29.0        29.0        28.0        28.0        28.0         27.0        28.0
                                                                                                                                                                                      1000)
                                                                                                                                                        Taux brut de mortalité - Total (par
Crude death rate - Total (per 1000)           10.0        10.0        10.0        10.0         9.0         9.0         9.0          8.0         8.0
                                                                                                                                                                                     1000)
Life expectancy at birth - Total                                                                                                                          Espérance de vie à la naissance -
                                              58.0        58.0        58.0        59.0        59.0        60.0        61.0         62.0        61.0
(years)                                                                                                                                                                     Total (années)
Net reproduction rate - (per                                                                                                                               Taux net de reproduction - (par
                                                ...         ...         ...        1.0          ...         ...         ...          ...        1.0
woman)                                                                                                                                                                             femme)
                                                                                                                                                          Indice synthétique de fécondité -
Total fertility rate - (p woman)
              y        (per    )               4.0         4.0         4.0         4.0         4.0         3.0         3.0          3.0         3.0
                                                                                                                                                                              (par femme)

Education                                                                                                                                                                 Enseignement

Teaching staff at first level - Total                                                                                                                   Personnel enseignant - 1er degré -
                                                ...       12.9        12.2        13.1        12.8        13.7        13.9         13.5          ...
(thousands)                                                                                                                                                                Total (milliers)
Teaching staff at second level - Total                                                                                                                 Personnel enseignant - 2ème degré -
                                              5.87         5.6         6.4         5.9         6.0         6.4         6.7           ...         ...                                              255
(thousands)                                                                                                                                                                 Total (milliers)
Teaching staff at third level - Total                                                                                                                Personnel enseignant - 3ème degré -
                                               0.9         0.9          ...         ...        0.8          ...        1.2           ...         ...
(thousands)                                                                                                                                                               Total (milliers)
First level student enrollment - Total                                                                                                                    Elèves inscrits - 1er degré - Total
                                              405         409         403         404         403          410        407          407           ...
(thousands)                                                                                                                                                                         (milliers)
First level student enrollment -                                                                                                                       Elèves inscrits - 1er degré - Femmes
                                              203         204         202         201         200          203        202          201           ...
Female (thousands)                                                                                                                                                                   (milliers)
Second level student enrollment -                                                                                                                       Elèves inscrits - 2ème degré - Total
                                              138         141         144         148         153          158        164            ...         ...
Total (thousands)                                                                                                                                                                  (milliers)
Second level student enrollment -                                                                                                                             Elèves inscrits - 2ème degré -
                                               73          75          76          79          81           85         88            ...         ...
Female (thousands)                                                                                                                                                        Femmes (milliers)
Third level student enrollment - Total                                                                                                                  Elèves inscrits - 3ème degré - Total
                                              11.0        11.8          ...       13.6        13.2          ...       19.7           ...         ...
(thousands)                                                                                                                                                                        (milliers)
Third level student enrollment -                                                                                                                              Elèves inscrits - 3ème degré -
                                               6.4         6.3          ...        6.3         6.2          ...       11.2           ...         ...
Female (thousands)                                                                                                                                                        Femmes (milliers)
Public expenditure on education (%                                                                                                                        Dépenses publiques consacrées à
                                                ...         ...         ...         ...         ...         ...         ...          ...         ...
of budget)                                                                                                                                                  l'enseignement (% du budget)

Health                                                                                                                                                                                Santé

Hospital beds - Total (per 10 000                                                                                                                         Nombre de lits d'hôpitaux - Total
                                                ...         ...        30          33          33           ...         ...         27           ...
population)                                                                                                                                                                  (pour 10 000)
Nurses - Total (per 10 000                                                                                                                               Nombre d'infirmières - Total (pour
                                                ...         ...       308           ...         ...         ...         ...        310           ...
population)                                                                                                                                                                        10 000)
Physicians - Total (per 10 000                                                                                                                           Nombre de médecins - Total (pour
                                                ...         ...        30           ...         ...         ...         ...         30           ...
population)                                                                                                                                                                      10 000)
Public expenditure on Health (% of                                                                                                                     Dépenses publiques consacrées à la
                                               11          11          11          13          11           ...         ...          ...         ...
budget)                                                                                                                                                             santé (% du budget)


                                                                                                  African Statistical Yearbook 2011 / Annuaire Statistique pour l'Afrique 2011
Namibia                                                                                                                                            Namibie
                                                           II NATIONAL ACCOUNTS — COMPTES NATIONAUX

                                                  2002     2003     2004     2005     2006       2007      2008       2009      2010

          Gross domestic product by kind of economic activity at current prices
                                                                                         Produit intérieur brut par branche d'activité économique aux prix courants


          Namibian Dollar (Millions)                                                                                                         Dollar Namibien(Millions)

          Agriculture                              3 544    3 807    3 816    4 792    5 223       5 375     6 387     6 706         ...                            Agriculture

          Mining and quarrying                     4 793    2 992    4 147    4 257    6 654       6 816    11 772     7 744         ...                 Industries extractives

          Manufacturing                            4 228    5 149    5 339    5 738    7 792       9 767     9 404    10 489         ...            Industries manufacturières

          Electricity, gas & water                  731      740      900     1 091    1 012       1 558     1 663     1 934         ...                 Electricité, gaz et eau

          Construction                              716      983     1 138    1 259    1 826       2 286     3 013     2 922         ...          Bâtiments et travaux publics
          Wholesale & retail trade,                                                                                                            Commerce de gros et de détail,
                                                   4 215    4 784    5 408    6 031    6 819       7 884     8 965    10 096         ...
          restaurants, hotels                                                                                                                           restaurants et hôtels
                                                                                                                                                Banques, assurances, affaires
          Finance, insurance, real estate, etc.    9 644   10 936   12 293   12 525   13 870      16 020    17 944    20 032         ...
                                                                                                                                                                immobilières
          Transport and communications             1 462    1 955    2 403    2 662    2 535       2 955     3 400     3 717         ...      Transport(s) et communications
                                                                                                                                                  Administrations publiques et
          Public administration and defense        3 254    3 677    3 857    4 115    4 423       5 105     6 219     8 088         ...
                                                                                                                                                                      défense
          Other services                            294      322      343      358      384         424       492        559         ...                        Autres services
                                                                                                                                               Moins Services d’intermédiation
          Less Imputed Service Charges            - 488    - 546    - 469    - 517    - 644       - 765      - 855     - 907         ...
                                                                                                                                                                     financière
          Gross domestic product at factor                                                                                                 Produit intérieur brut aux couts des
                                                  32 391   34 798   39 175   42 311   49 894      57 425    68 404    71 380         ...
          cost / basic prices                                                                                                                            facteurs / prix de base

          Plus: Indirect Taxes / taxes on                                                                                                  Plus taxes indirectes/impôts sur les
                                                   3 039    2 506    3 502    3 864    4 133       4 678     5 598     6 434         ...
          products, less subsidies                                                                                                             produits, moins les subventions


          Expenditure on Gross domestic product at current purchaser's values
                                                                                                    Emploi du produit intérieur brut aux prix courants d'acquisition

          Namibian Dollar (Millions)                                                                                                         Dollar Namibien(Millions)
                                                                                                                                                     Consommation finale des
          Government final consumption             7 613    8 283    8 693    8 905   10 526      12 840    15 158    18 951         ...
                                                                                                                                                     administrations publiques

          Private final consumption               21 797   24 534   25 916   26 734   30 340      35 664    40 939    45 717         ...           Consommation finale privée

          Gross fixed capital formation            7 066    7 121    7 922    8 594   11 686      14 696    18 815    19 351         ...        Formation brute de capital fixe

          Increase in inventories                 - 504      105      216      498      342          32      1 794     1 871         ...                   Variation des stocks

          Exports of goods and services           16 299   16 185   16 991   18 678   24 566      31 496    38 777    34 581         ...     Exportations de biens et services
256                                                                                                                                             Moins importations de biens et
          Less imports of goods and services      17 032   19 574   17 959   18 615   22 454      32 310    39 080    41 488         ...
                                                                                                                                                                      services
          GDP at purchasers' values               35 430   37 304   42 677   46 175   54 027      62 103    74 002    77 814         ...             PIB aux prix d'acquisition


          Gross domestic product by kind of economic activity at constant
                                                                                        Produit intérieur brut par branche d'activité economique aux prix constants
          prices
          Annual Growth Rates (%)                                                                                                   Taux de croissance annuel (%)
          Agriculture                               10.2      4.1      1.1      5.5     -0.7        -9.3       0.4       -4.1        ...                            Agriculture

          Mining and quarrying                      36.0     -8.2     45.0    -10.9     27.6         0.5      -2.9      -45.0        ...                 Industries extractives

          Manufacturing                              4.0     13.9      0.4      7.5      2.7         8.4       2.2       6.5         ...            Industries manufacturières

          Electricity, gas & water                  -2.2      0.9      7.0     24.3      5.6         4.4       3.2       6.0         ...                 Electricité, gaz et eau

          Construction                             -31.0     27.2      5.9      2.5     37.2        14.6      15.1       -7.3        ...          Bâtiments et travaux publics
          Wholesale & retail trade,                                                                                                                   Commerce de gros et de
                                                     6.4      5.9      8.3      8.6      7.6         8.2       2.8       3.3         ...
          restaurants, hotels                                                                                                                       détail,restaurants et hôtels
                                                                                                                                                 Banques, assurances, affaires
          Finance, insurance, real estate, etc.     -3.3      6.3     11.0      0.0      3.3         6.8       6.2       4.9         ...
                                                                                                                                                                 immobilières
          Transport and communications              10.3     15.7     25.8      9.3     14.2         5.4       2.7       5.4         ...      Transport(s) et communications
                                                                                                                                                  Administrations publiques et
          Public administartion and defense          4.7      6.6      4.0     -4.8      3.9        10.4      11.7       4.1         ...
                                                                                                                                                                      défense
          Other services                             2.2      2.2      2.4      2.0      2.3         3.4       5.1       4.4         ...                        Autres services
                                                                                                                                               Moins Services d’intérmediation
          Less Imputed Service Charges              -0.8      7.5     10.6     10.7     14.3         9.9       2.8       -0.6        ...
                                                                                                                                                                     financière
          Gross domestic product at factor                                                                                                 Produit intérieur brut aux couts des
                                                     3.7      6.5     10.5      2.2      7.3         5.4       4.3       -1.2        ...
          cost / basic prices                                                                                                                            facteurs / prix de base

          Plus: Indirect Taxes / taxes on                                                                                                  Plus taxes indirectes/impôts sur les
                                                    17.8    -19.9     37.5      5.9      4.1         4.8       4.0       4.3         ...
          products, less subsidies                                                                                                             produits, moins les subventions

          Gross domestic product at market                                                                                                   Produit intérieur brut aux prix du
                                                     4.8      4.2     12.3      2.5      7.1         5.4       4.3       -0.7        ...
          prices                                                                                                                                                        marché


      Break in the serie from 2004                                                                                                    Rupture de la série à partir 2004


      African Statistical Yearbook 2011 / Annuaire Statistique pour l'Afrique 2011
Namibia                                                                                                                                                           Namibie

Expenditure on Gross domestic product at constant purchasers'
                                                                                                     Emplois du produit intérieur brut aux prix constants d'acquisition
values

Annual Growth Rates (%)                                                                                                                Taux de croissance annuel (%)
                                                                                                                                                         Consommation finale des
Government final consumption                  -2.6         3.1        5.0       -5.9       11.0        12.6        8.2        9.8       ...
                                                                                                                                                         administrations publiques

Private final consumption                      7.3         7.7        3.0        5.1        1.3        18.8        1.3        9.6       ...            Consommation finale privée

Gross fixed capital formation                 -0.8        -5.0        6.2        3.6       29.8        12.1       13.1       -1.6       ...        Formation brute de capital fixe

Exports of goods and services                 16.2         8.9        5.4       -0.8       15.3         6.4        5.2      -14.9       ...      Exportations de biens et services

                                                                                                                                                   Moins importations de biens et
Less imports of goods and services             6.2        10.5      -10.0        0.9       16.3        31.8        6.9        4.1       ...
                                                                                                                                                                         services


                                                                                III INFLATION

                                           2002        2003       2004       2005       2006        2007       2008       2009       2010
Annual Growth Rates (%)                                                                                                                Taux de croissance annuel (%)
All Item                                     11.4          7.1        4.2        2.2        5.0         6.7      10.3         8.8      3.2                                Ensemble

Food                                            ...        9.5        0.8        1.5        6.5       12.3       16.3       10.7        ...                            Alimentation

Health                                          ...        5.9        2.9        0.7       -2.2         4.7        2.2        5.6       ...                                   Santé

Energy                                          ...        7.2        6.8        1.6        3.2         3.4        3.8        7.7       ...                                 Energie

Transport                                       ...        7.6        5.3        6.8        8.1         6.0      12.9         5.9       ...                               Transport


                                                 IV AGRICULTURAL PRODUCTION - PRODUCTION AGRICOLE

                                           2002        2003       2004       2005       2006        2007       2008       2009       2010
Tons (Thousand)                                                                                                                                             Tonnes (milliers)
Millet, Tons (thousands)                       56          52         74         48         59          60         60          ...      ...                 Millet, tonnes (milliers)

Maize, Tons (thousands)                        28          29         28         41         61          60         60          ...      ...                  Maïs, tonnes (milliers)

Wheat, Tons (thousands)                        10          10          8         11         13          13         13          ...      ...                   Blé, tonnes (milliers)

Grapes, Tons (thousands)                         9         10         12         16         19          20         20          ...      ...               Raisins, tonnes (milliers)

Sorghum, Tons (thousands)                        6          6          7          8         10          10         10          ...      ...               Sorgho, tonnes (milliers)


                                                        V MINING PRODUCTION - PRODUCTION MINIERE
                                                                                                                                                                                        257
                                           2002        2003       2004       2005       2006        2007       2008       2009       2010

Uranium ores and concentrates,                                                                                                                  Minerais et concentrés d'uranium,
                                               3.0         2.0        3.0        2.0        3.0         3.0        3.0        3.0       ...
metric tons (thousands)                                                                                                                                tonnes métriques (milliers)
Silver ores and concentrates               9 000.0    20 000.0   44 000.0   45 000.0   50 000.0    34 102.0   31 307.0    8 000.0       ...       Minerais d'argent et concentrés
(Kilograms)                                                                                                                                                        (kilogrammes)
Lead ores and concentrates, metric                                                                                                               Minerais de plomb et concentrés,
                                              11.0        13.0       13.0       19.0       16.0        14.0       12.0      11.0        ...
tons (thousands)                                                                                                                                       tonnes métriques (milliers)


                                                                            VI ENERGY - ENERGIE

                                           2002        2003       2004       2005       2006        2007       2008       2009       2010

Electricity - total hydro production,                                                                                                          Électricité - production hydraulique
                                            850.0      1 456.0    1 616.0    1 426.0    1 601.0     1 331.0         ...        ...      ...
kilowatt hours (millions)                                                                                                                         totale, kilowatt-heures (millions)

Electricity - total thermal production,                                                                                                          Électricité - production thermique
                                          15 636.0    16 448.0   17 521.0   20 824.0   21 408.0    21 248.0         ...        ...      ...
kilowatt hours (millions)                                                                                                                         totale, kilowatt-heures (millions)

Electricity - total production, self-                                                                                                         Electricité - Production totale privée
                                            1 653       1 794      1 916      2 225      2 298       2 265          ...        ...      ...
producer (Million Kilowatt Hours)                                                                                                                       (million de kilowatt heures)

Electricity - total production, public                                                                                                               Electricité - Production totale
                                           15 027      16 313     17 420     20 231     20 894      20 593          ...        ...      ...
(Million Kilowatt Hours)                                                                                                                      publique (million de kilowatt heures)


                                                                                              African Statistical Yearbook 2011 / Annuaire Statistique pour l'Afrique 2011
Namibia                                                                                                                                                         Namibie
                                                  VII TOURISM AND INFRASTRUCTURE - TOURISME ET INFRASTUCTURE

                                                   2002       2003       2004       2005       2006      2007       2008       2009       2010

         Arrivals - Tourists (thousands)              757        695          ...      778       833        929          ...        ...        ...           Arrivées - touristes (milliers)

         Rooms in hotels and similar                                                                                                               Chambres d'hotels et établissements
         establishments (thousands)                     3          3          ...        ...       ...        ...        ...        ...        ...                  assimilés (milliers)

         Paved Road (% of total)                       13          ...        ...        ...       ...        ...        ...        ...        ...        Routes asphaltées (% du total)
         Total Network (Railways-km)                    ...        ...        ...        ...       ...        ...        ...        ...        ...         Réseau total voies ferrées-Km
         Main Telephone Lines (per 1,000                                                                                                                 Lignes téléphoniques fixes (pour
                                                       60         70         60         70        70         70         70         70          ...
         inhabitants)                                                                                                                                                    1000 habitants)
         Mobile Cellular Subscribers (per                                                                                                                Abonnés aux téléphones mobiles
                                                       80        120        150        220       300        380        490        560          ...
         1,000 inhabitants)                                                                                                                                       (pour 1000 habitants)


                                   VII FINANCIAL AND MONETARY STATISTICS - FINANCES ET STATISTIQUES MONETAIRES

                                                   2002       2003       2004       2005       2006      2007       2008       2009       2010

         VII-1 Monetary Statistics                                                                                                              VII-1 Statistiques monétaires
         Namibian Dollar (Millions)                                                                                                                     Dollar Namibien(Millions)
         Money supply (M1)                          6 887      8 081      9 563      9 409     13 679    14 636     18 571     20 897          ...                 Masse monétaire (M1)
         Quasi-money                                5 547      5 546      6 259      7 961      8 833    10 166     10 666     10 068          ...                         Quasi-monnaie
           of which Demand Deposit                      ...        ...        ...        ...       ...        ...        ...        ...        ...              dont Monnaie scripturale
         Net foreign assets                         2 084        684        493      - 157      4 853     6 844     13 575     15 425          ...                  Avoirs extérieurs nets
         Domestic credit                           14 933     17 347     21 170     25 670     28 454    30 275     31 930     34 042          ...                         Crédit intérieur

         of which claims on private sector         14 834     16 676     19 919     23 922     27 453    30 990     33 260     36 578          ...     dont créances sur le secteur privé

         of which Claims on government                                                                                                                        dont créances nettes sur le
                                                    - 151        507        872      1 406       121     - 2 135    - 4 643    - 5 846         ...
         sector, net                                                                                                                                                      gouvernement
         International reserves (millions of US                                                                                                      Réserves internationales (millions de
                                                      323        325        345        312       450        896      1 293      2 051          ...
         $)                                                                                                                                                                          $ EU)
         Average Exchange Rate (National                                                                                                              Taux de change (moyen) (monnaie
                                                    10.54       7.56       6.46       6.36       6.77      7.05       8.26       8.47       7.32
         Currency per us $)                                                                                                                                       nationale par dollars)


         VII-2 Public Finance                                                                                                                            VII-2 Finances publiques
         Namibian Dollar (Millions)                                                                                                                     Dollar Namibien(Millions)
         Total Revenues and Grants                  8 981     10 485      9 767     11 425     13 108    17 593     20 672     23 449     23 542                 Recettes totales et dons
           Tax Revenue                              8 166      9 330      8 763     10 468     11 963    15 843     19 026     21 106     21 595                         Recettes fiscales
           Non Tax Revenue                            757      1 121        971        886      1 105     1 701      1 568      2 260      1 671                    Recettes non fiscales
258        Grants                                      58         34         34         70        39         50         78         83        276                                     Dons

         Total Expenditures and Net Lending        10 302     11 399     12 245     12 771     13 198    15 278     17 542     21 898     25 824           Dépenses totales et prêts nets

           Current expenditure                      8 674      9 503     10 448     10 786      7 815     8 378      9 669     11 242     13 499                     Dépenses courantes
           Of which Wages and Salaries              4 326      4 709      5 117      5 527      5 889     6 214      6 805      7 559      8 920           Dont rémunérations et salaires
           Capital expenditure                      1 150      1 246      1 397      1 619      1 443     2 026      2 530      3 925      5 702                 Dépenses d'équipement
           Net Lending                                478        650        400        366       208        863      1 200      1 119        443                                Prêts nets
         Fiscal Balance                            - 1 321     - 913     - 2 478    - 1 346      - 90     2 315      3 130      1 551     - 2 282         Solde global y compris les dons


         VII-3 Balance of Payments                                                                                                                   VII-3 Balance des paiements
         US $ (Millions)                                                                                                                                              $ E.U(Millions)
         Trade balance                             - 1 220    - 4 658    - 1 558     - 243      1 438    - 1 429       189     - 6 511    - 8 119                   Balance commerciale
         Services Balance                             486      1 269        591        306       674        615      - 492      - 396        577                     Balance des services
         Net Income                                   238        500        612      - 102     - 252      - 769     - 1 291    - 2 517    - 2 938                            Revenus nets
         Current transfers, net total               3 202      3 670      4 529      4 547      6 733     7 421      9 762     10 618      7 805                      Transferts courants
         Current account balance                    2 706        781      4 174      4 508      8 593     5 838      8 168      1 194     - 2 674               Solde du compte courant


         VII-4 External Debt and Financial Flows                                                                                     VII-4 Dette extérieure et flux financiers
         US $ (Millions)                                                                                                                                              $ E.U (Millions)
         Total external debt                        1 152      1 618      2 060      1 848      2 245     2 261      2 002      2 262      2 396                   Dette extérieure totale
           Private                                    980      1 377      1 720      1 532      1 883     1 815      1 624      1 795      1 862                                    Privée
           Public                                     171        241        341        316       362        446        377        467        534                                 Publique
         Total external debt service                  319        442        609        764       891      1 085        921        565        510            Service de la dette extérieure
         Net Foreign Direct Investment                                                                                                               Investissements étranger direct (flux
                                                      181        149        226        348       387        733        720        516          ...
         Inflows                                                                                                                                                           nets entrants)
         Net Total Official Development                                                                                                                 Aide publique au développement
                                                      142        146        173        125       152        217        210        326          ...
         assistance                                                                                                                                                        (nette totale)


      African Statistical Yearbook 2011 / Annuaire Statistique pour l'Afrique 2011
Namibia                                                                                                                                           Namibie

                                     2002     2003     2004     2005     2006       2007       2008      2009       2010

US $ (Millions)                                                                                                                              Dollar Namibien
Exports, fob                                                                                                                                Exportations, fàb


Exports - Total                      1 070    1 251    1 821    2 068    2 651       2 919         ...       ...        ...                    Exportations - Total


Main Products                                                                                                                               Principaux produits


Diamonds                               532      511      823      849    1 083         911       770         ...        ...                               Diamants


Zinc                                    ...      ...      ...      ...      ...         91        57         ...        ...                                     Zinc


Lead                                    ...      ...      ...      ...      ...         17        19         ...        ...                                   Plomb


Silver                                  ...      ...      ...      ...      ...          7          4        ...        ...                                  Argent


                                        ...      ...      ...      ...      ...         ...        ...       ...        ...

Main Destinations                                                                                                                     Principales destinations

United Kingdom                       314.4    172.8    479.0    584.0    907.2       378.5       54.0     177.3         ...                           Royaume-Uni


Spain                                176.7    246.2    247.1    214.2    215.1       254.6      260.4     225.0         ...                                Espagne


United States                         58.8    127.8    250.7    133.3    118.8       222.9      302.3     329.3         ...                              États-Unis


Italy                                 25.8     38.7     68.2    129.1    267.2       413.0      117.5      48.2         ...                                    Italie


China                                 28.9     37.0     46.6     76.4    121.9       157.7      282.2     312.4         ...                                   Chine


                                     2002     2003     2004     2005     2006       2007       2008      2009       2010
Imports, cif                                                                                                                                Importations, cif

Imports - Total                        296      309      417      488      693         962      1 417     1 358         ...        Importations - Total (millions)      259

                                                                                                                                            Principaux produits
Main Products


Petroleum oils&oils obtained from
                                                                                                                                   Huiles de pétrole, bitumineux,
bituminous minerals,o/than crude         0        7        9       17        2          25       212        103         ...
                                                                                                                                               distilles, sauf brut
etc

                                                                                                                                        Minerais de cuivre et leurs
Copper ores and concentrates             1        0       ...       7       16          53        69        161         ...
                                                                                                                                                       concentrés

Diesel powered trucks with a GVW                                                                                              Diesel chariots de manutention d'un
                                         0        1        1        2        3          31        50          7         ...
not exceeding five tonnes                                                                                                        PTAC n'excédant pas cinq tonnes

Sulphuric acid; oleum                    1        1        3        5        3          13        37         14         ...                Acide sulfurique, oléum


                                                                                                                               Linge de lit, de fibres synthétiques
Bed linen, of man-made fibres, nes       0        0        0        2        4          21        34         27         ...
                                                                                                                                                ou artificielles, nda


Main Origin                                                                                                                           Principales provenances

United States                         57.8     28.0     72.9    113.7    126.9       127.9      280.3        ...        ...                              États-Unis

China                                 20.2     37.6     52.5     60.4    133.2       246.5      243.2        ...        ...                                   Chine

Germany                               42.6     32.1     49.8     48.2     76.3        70.2      106.6        ...        ...                              Allemagne

Netherlands                            3.7      7.2      8.4      5.1     12.8        27.2      125.7        ...        ...                                Pays-Bas

United Kingdom                        12.6     16.5     31.9     31.5     24.3        23.8       31.0        ...        ...                           Royaume-Uni


                                                                              African Statistical Yearbook 2011 / Annuaire Statistique pour l'Afrique 2011
Niger                                                                                                                                                                        Niger

         AREA (KM 2)                                                                                 1 267 000                                                            SUPERFICIE (KM 2)
         CAPITAL CITY                             Niamey                                                                                      Niamey                                  CAPITALE
         CURRENCY                                 CFA Franc                                                                                Franc CFA                                  MONNAIE


                                 I SOCIAL AND DEMOGRAPHIC INDICATORS — INDICATEURS DEMOGRAPHIQUES ET SOCIAUX

                                                    2002        2003        2004        2005       2006        2007        2008        2009       2010
         Population                                                                                                                                                                Population
                                                                                                                                                               Population au milieu de l'année -
         Mid-year population - Total (Million)         11.5        11.8        12.2        12.8       13.2        13.7        14.2        14.7       ...
                                                                                                                                                                                  Total (million)
                                                                                                                                                               Population au milieu de l'année -
         Mid-year population - Urban (%)               16.4        16.5        16.6        16.7       16.8        16.6        18.4        19.8       ...
                                                                                                                                                                                  Urbaine (%)

         Female (%)                                    50.1        50.1        50.1        50.1       50.1        50.1        50.1        50.1       ...                             Femme (%)


         Population by Age Group                                                                                                                                   Population par groupe d'âge


            0-14                                   5564 230    5747 850    5937 530    6385 905   6626 927    6860 460    7087 227    7308 892       ...                                     0-14


            15-64                                  5523 640    5705 920    5894 210    6060 881   6272 628    6500 957    6746 320    7008 603       ...                                    15-64


            65+                                     368 370     380 520     393 080     345 289    348 432     354 817     364 054     375 616       ...                                     65+


         Active Population (000)                    3 898.0     4 028.0     4 163.0     4 312.0    4 475.0     4 647.0     4 832.0     5 026.0       ...                 Population active (000)

            Female (%)                                 31.4        31.4        31.3        31.3       31.4        31.3        31.3        31.3       ...                             Femme (%)

                                                                                                                                                              Taux brut de natalité - Total (par
         Crude birth rate - Total (per 1000)           52.6        52.7        52.9        53.2       53.5        53.6        53.5        53.2       ...
                                                                                                                                                                                          1000)
                                                                                                                                                            Taux brut de mortalité - Total (par
         Crude death rate - Total (per 1000)           17.7        17.2        16.7        16.2       15.8        15.3        14.9        14.5       ...
                                                                                                                                                                                         1000)
         Life expectancy at birth - Total                                                                                                                     Espérance de vie à la naissance -
                                                       55.2        55.6        56.0        56.4       56.8        57.2        57.6        58.0       ...
         (years)                                                                                                                                                                Total (années)
         Net reproduction rate - (per                                                                                                                          Taux net de reproduction - (par
                                                         ...         ...         ...        2.6         ...         ...         ...         ...      ...
         woman)                                                                                                                                                                        femme)
                                                                                                                                                              Indice synthétique de fécondité -
         Total fertility rate - (p woman)
                       y        (per    )               7.4         7.4         7.3         7.3        7.1         7.2         7.1         7.1       ...
                                                                                                                                                                                  (par femme)

         Education                                                                                                                                                            Enseignement

         Teaching staff at first level - Total                                                                                                              Personnel enseignant - 1er degré -
                                                      18.44        20.6        22.4        24.1       28.2        31.1        34.1        40.0       ...
         (thousands)                                                                                                                                                           Total (milliers)
         Teaching staff at second level - Total                                                                                                            Personnel enseignant - 2ème degré -
260                                                    3.96         4.0         5.0         3.7        4.1         4.3         4.4         8.7       ...
         (thousands)                                                                                                                                                            Total (milliers)
         Teaching staff at third level - Total                                                                                                             Personnel enseignant - 3ème degré -
                                                        0.3         0.3         0.3         0.3        0.3         0.3         0.3         1.2       ...
         (thousands)                                                                                                                                                            Total (milliers)
         First level student enrollment - Total                                                                                                               Elèves inscrits - 1er degré - Total
                                                       761         858         980        1 064      1 126       1 235       1 389       1 554       ...
         (thousands)                                                                                                                                                                    (milliers)
         First level student enrollment -                                                                                                                  Elèves inscrits - 1er degré - Femmes
                                                       303         344         395         434        462         512         593         670        ...
         Female (thousands)                                                                                                                                                              (milliers)
         Second level student enrollment -                                                                                                                  Elèves inscrits - 2ème degré - Total
                                                       109         124         155         177        211         211         230         250        ...
         Total (thousands)                                                                                                                                                             (milliers)
         Second level student enrollment -                                                                                                                        Elèves inscrits - 2ème degré -
                                                        42          48          60          69         81          81          87          95        ...
         Female (thousands)                                                                                                                                                   Femmes (milliers)
         Third level student enrollment - Total                                                                                                             Elèves inscrits - 3ème degré - Total
                                                         ...        8.9         8.8        10.8       11.2        10.9        12.8        15.3       ...
         (thousands)                                                                                                                                                                   (milliers)
         Third level student enrollment -                                                                                                                         Elèves inscrits - 3ème degré -
                                                         ...        2.4         2.4         3.2        3.0         3.1         3.8         4.3       ...
         Female (thousands)                                                                                                                                                   Femmes (milliers)
         Public expenditure on education (%                                                                                                                   Dépenses publiques consacrées à
                                                        9.8         8.6        11.9        12.4       13.0        13.8        15.1        13.5       ...
         of budget)                                                                                                                                             l'enseignement (% du budget)

         Health                                                                                                                                                                           Santé

         Hospital beds - Total (per 10 000                                                                                                                    Nombre de lits d'hôpitaux - Total
                                                        25          33          20          19         30          30          30          49        ...
         population)                                                                                                                                                             (pour 10 000)
         Nurses - Total (per 10 000                                                                                                                          Nombre d'infirmières - Total (pour
                                                        23          22          22          24         23          23          30          30        ...
         population)                                                                                                                                                                   10 000)
         Physicians - Total (per 10 000                                                                                                                      Nombre de médecins - Total (pour
                                                          3          3           3           5          5            5           4           4       ...
         population)                                                                                                                                                                 10 000)
         Public expenditure on Health (% of                                                                                                                Dépenses publiques consacrées à la
                                                          8          9           6           6          7          10          11          10        ...
         budget)                                                                                                                                                        santé (% du budget)


      African Statistical Yearbook 2011 / Annuaire Statistique pour l'Afrique 2011
Niger                                                                                                                                                                               Niger
                                                          II NATIONAL ACCOUNTS — COMPTES NATIONAUX

                                          2002           2003        2004        2005        2006         2007         2008         2009        2010

Gross domestic product by kind of economic activity at current prices
                                                                                                 Produit intérieur brut par branche d'activité économique aux prix courants


CFA Franc (Millions)                                                                                                                                                Franc CFA (Millions)

Agriculture                              658 069        676 833     615 991     754 411     817 662      842 042     1 044 840    1 018 962          ...                            Agriculture

Mining and quarrying                         29 067      29 668      31 428      35 659      40 096       90 775      139 239      149 840           ...                 Industries extractives

Manufacturing                                87 467      90 753      94 107      98 349     102 635      106 578      117 676      127 776           ...            Industries manufacturières

Electricity, gas & water                     15 042      19 174      17 969      19 576      24 590       26 024       29 745       31 972           ...                 Electricité, gaz et eau

Construction                                 33 978      36 635      38 697      41 622      47 471       51 584       57 484       64 507           ...          Bâtiments et travaux publics
Wholesale & retail trade,                                                                                                                                      Commerce de gros et de détail,
                                         219 740        225 612     239 493     260 404     273 887      290 831      325 607      342 825           ...
restaurants, hotels                                                                                                                                                     restaurants et hôtels
                                                                                                                                                                Banques, assurances, affaires
Finance, insurance, real estate, etc.        73 268      75 864      83 274      93 035     102 311      115 974      122 580      127 827           ...
                                                                                                                                                                                immobilières
Transport and communications                 87 299      93 980     106 494     115 068     124 105      134 886      145 657      158 611           ...      Transport(s) et communications
                                                                                                                                                                  Administrations publiques et
Public administration and defense        120 022        125 900     122 407     153 027     166 930      184 453      191 824      213 565           ...
                                                                                                                                                                                      défense
Other services                               67 724      62 393      67 193      74 231      68 955       68 823       73 003       81 277           ...                        Autres services
                                                                                                                                                               Moins Services d’intermédiation
Less Imputed Service Charges                 - 8 025    - 10 448    - 12 719    - 14 599          ...          ...          ...          ...         ...
                                                                                                                                                                                     financière
Gross domestic product at factor                                                                                                                           Produit intérieur brut aux couts des
                                        1 383 651      1 426 364   1 404 335   1 630 783   1 768 642    1 911 970    2 247 655    2 317 162          ...
cost / basic prices                                                                                                                                                      facteurs / prix de base

Plus: Indirect Taxes / taxes on                                                                                                                            Plus taxes indirectes/impôts sur les
                                         111 135        107 942     126 108     146 660     138 196      144 737      156 549      158 836           ...
products, less subsidies                                                                                                                                       produits, moins les subventions


Expenditure on Gross domestic product at current purchaser's values
                                                                                                             Emploi du produit intérieur brut aux prix courants d'acquisition

CFA Franc (Millions)                                                                                                                                                Franc CFA (Millions)
                                                                                                                                                                     Consommation finale des
Government final consumption             245 417        247 354     263 300     280 150     286 186      321 865      363 080      425 451           ...
                                                                                                                                                                     administrations publiques

Private final consumption               1 125 078      1 170 872   1 211 092   1 307 056   1 389 307    1 517 062    1 714 569    1 840 605          ...           Consommation finale privée

Gross fixed capital formation            229 894        231 797     258 139     384 618     430 199      467 984      672 559      721 142           ...        Formation brute de capital fixe

Increase in inventories                      29 212      18 803     - 34 800     25 754      19 501        6 726       29 996            ...         ...                   Variation des stocks

Exports of goods and services            230 006        261 276     282 791     333 068     344 704      358 453      454 900      490 500           ...     Exportations de biens et services
                                                                                                                                                                Moins importations de biens et
                                                                                                                                                                                                   261
Less imports of goods and services       364 821        395 796     450 078     553 202     563 059      615 383      830 900     1 001 700          ...
                                                                                                                                                                                      services
GDP at purchasers' values               1 494 786      1 534 306   1 530 443   1 777 443   1 906 838    2 056 707    2 404 204    2 475 998          ...             PIB aux prix d'acquisition


Gross domestic product by kind of economic activity at constant
                                                                                               Produit intérieur brut par branche d'activité economique aux prix constants
prices
Annual Growth Rates (%)                                                                                                                            Taux de croissance annuel (%)
Agriculture                                     7.4          5.2        -8.1        13.6        10.3          4.6         16.2         -6.9          ...                            Agriculture

Mining and quarrying                            3.8          1.5         6.1        -3.6         0.7         -5.8         -2.1          6.0          ...                 Industries extractives

Manufacturing                                   2.5          1.6         6.3         0.4         2.4          0.3          3.9          3.2          ...            Industries manufacturières

Electricity, gas & water                        0.0          0.2        -6.9         1.3        -1.1          3.3          8.8          5.2          ...                 Electricité, gaz et eau

Construction                                    6.3         10.5         5.0         6.1         5.1          3.6          5.0          6.3          ...          Bâtiments et travaux publics
Wholesale & retail trade,                                                                                                                                             Commerce de gros et de
                                               16.5          3.5         4.7         3.8        44.9          1.2          4.4          3.8          ...
restaurants, hotels                                                                                                                                                 détail,restaurants et hôtels
                                                                                                                                                                 Banques, assurances, affaires
Finance, insurance, real estate, etc.           1.3          7.7         4.3        10.5        13.5          7.7          4.6          1.5          ...
                                                                                                                                                                                 immobilières
Transport and communications                    3.7          2.2         5.2         2.0         0.2          2.3          5.0          3.7          ...      Transport(s) et communications
                                                                                                                                                                  Administrations publiques et
Public administartion and defense               -1.1         0.9        -4.0         4.7         5.0          5.8          1.9          6.5          ...
                                                                                                                                                                                      défense
Other services                                  6.7         -5.6         5.8        -5.0       -10.4         -2.6          1.7          8.2          ...                        Autres services
                                                                                                                                                               Moins Services d’intérmediation
Less Imputed Service Charges                    5.3         -3.3        29.7        12.9          ...          ...          ...          ...         ...
                                                                                                                                                                                     financière
Gross domestic product at factor                                                                                                                           Produit intérieur brut aux couts des
                                                6.1          3.6        -2.4         7.5        12.2          3.4          9.6         -1.2          ...
cost / basic prices                                                                                                                                                      facteurs / prix de base

Plus: Indirect Taxes / taxes on                                                                                                                            Plus taxes indirectes/impôts sur les
                                                -1.0         1.7        11.8         7.0       -39.1          3.2          5.9          2.6          ...
products, less subsidies                                                                                                                                       produits, moins les subventions

Gross domestic product at market                                                                                                                             Produit intérieur brut aux prix du
                                                5.3          3.4        -0.8         7.4         5.8          3.4          9.3         -0.9          ...
prices                                                                                                                                                                                  marché


2008: semi-final            2009:Estimated                                                                                               2008: semi-définitif                  2009:Estimée


                                                                                                   African Statistical Yearbook 2011 / Annuaire Statistique pour l'Afrique 2011
Niger                                                                                                                                                                 Niger

         Expenditure on Gross domestic product at constant purchasers'
                                                                                                           Emplois du produit intérieur brut aux prix constants d'acquisition
         values

         Annual Growth Rates (%)                                                                                                              Taux de croissance annuel (%)
                                                                                                                                                                Consommation finale des
         Government final consumption                  3.0        2.3       -8.7         5.1        5.7        5.8        6.8        5.8       ...
                                                                                                                                                                administrations publiques

         Private final consumption                     5.7        5.7        3.1        -0.6        3.3        4.4        5.5        3.1       ...            Consommation finale privée

         Gross fixed capital formation                 8.5       -6.0        6.8       31.9         7.6        4.2      19.8         3.6       ...        Formation brute de capital fixe

         Exports of goods and services                -8.0        1.1        4.4         6.6        5.5        2.7      13.7         1.7       ...      Exportations de biens et services

                                                                                                                                                          Moins importations de biens et
         Less imports of goods and services            0.8        0.0        6.6         6.7       -0.8        4.9        9.7      16.1        ...
                                                                                                                                                                                services


                                                                                        III INFLATION

                                                   2002       2003       2004        2005       2006       2007       2008       2009       2010
         Annual Growth Rates (%)                                                                                                              Taux de croissance annuel (%)
         All Item                                      2.6       -1.6        0.2         7.8        0.4        0.4      11.3         4.9      3.4                               Ensemble

         Food                                          4.2       -4.8       -1.3       10.1         2.5       -0.5      20.5       10.3       0.7                            Alimentation

         Health                                       -2.4       -2.5       -4.4        -2.2       -1.8       -0.5       -3.3       -2.1      9.1                                    Santé

         Energy                                        2.1        2.5        1.2         2.5       -0.3        0.5        4.9        1.9     -0.9                                  Energie

         Transport                                    -1.3        0.9        4.8         9.2        3.2       -1.6        3.7       -9.2      2.5                               Transport


                                                         IV AGRICULTURAL PRODUCTION - PRODUCTION AGRICOLE

                                                   2002       2003       2004        2005       2006       2007       2008       2009       2010
         Tons (Thousand)                                                                                                                                           Tonnes (milliers)
         Millet, Tons (thousands)                   2 504      2 745      2 038       2 652      3 015      2 782      3 489      2 678        ...                   Mil, tonnes (milliers)

         Sorghum, Tons (thousands)                    636        758        600         944        935        975      1 311        739        ...               Sorgho, tonnes (milliers)

         Rice, Tons (thousands)                        82         69         18           3          7          7         32         20        ...            Riz paddy, tonnes (milliers)

         Cow pea, Tons (thousands)                    612        549        340         586        693      1 001      1 548        787        ...                Niébé, tonnes (milliers)
         Groundnuts in shells, Tons                   150        386        159         139        136        148        305        253        ...           Arachides en coques, tonnes
         (thousands)                                                                                                                                                           (milliers)


                                                               V MINING PRODUCTION - PRODUCTION MINIERE
262
                                                   2002       2003       2004        2005       2006       2007       2008       2009       2010


         Uranium, Tons                             3 072.0    3 143.0    3 273.0     3 093.0    3 434.0    3 153.0    2 993.0    3 245.0       ...                      Uranium (tonnes)

         Hard Coal, metric tons (thousands)         182.9      188.9      200.4       182.1      176.3      171.3      182.9      225.1        ...      Charbon minéral, tonne (milliers)


         Gold, industrial (Kilograms)                28.0       34.0      669.0      3 001.0    1 481.0    2 467.0    2 168.0    1 770.0       ...          Or industriel ( Kilogrammes )


                                                                                    VI ENERGY - ENERGIE

                                                   2002       2003       2004        2005       2006       2007       2008       2009       2010

         Electricity - total hydro production,                                                                                                        Électricité - production hydraulique
                                                        ...        ...        ...         ...        ...        ...        ...        ...      ...
         kilowatt hours (millions)                                                                                                                       totale, kilowatt-heures (millions)

         Electricity - total thermal production,                                                                                                        Électricité - production thermique
                                                        ...        ...        ...         ...        ...        ...        ...        ...      ...
         kilowatt hours (millions)                                                                                                                       totale, kilowatt-heures (millions)

         Electricity - total production, self-                                                                                                       Electricité - Production totale privée
                                                       40         43         46          43         26         43         40        153        ...
         producer (Million Kilowatt Hours)                                                                                                                     (million de kilowatt heures)

         Electricity - total production, public                                                                                                             Electricité - Production totale
                                                      204        204        204         204        204        204        204        204        ...
         (Million Kilowatt Hours)                                                                                                                    publique (million de kilowatt heures)


      African Statistical Yearbook 2011 / Annuaire Statistique pour l'Afrique 2011
Niger                                                                                                                                                                                   Niger
                                         VII TOURISM AND INFRASTRUCTURE - TOURISME ET INFRASTUCTURE

                                           2002         2003         2004         2005         2006         2007         2008         2009         2010

Arrivals - Tourists (thousands)            33.241       46.145       48.165         56.2       52.489           65        61.87       48.951            ...           Arrivées - touristes (milliers)

Rooms in hotels and similar                                                                                                                                 Chambres d'hotels et établissements
establishments (thousands)                   1.42        1.472        1.741        1.873        1.919        1.973         1.99         2.01            ...                  assimilés (milliers)

Paved Road (% of total)                         ...          ...          ...          ...          ...          ...          ...          ...          ...        Routes asphaltées (% du total)
Total Network (Railways-km)                 9 460        9 877       10 041       10 077       10 204       10 722       10 722       10 824            ...         Réseau total voies ferrées-Km
Main Telephone Lines (per 1,000                                                                                                                                   Lignes téléphoniques fixes (pour
                                                 2           2            2            2            3            3            5            ...          ...
inhabitants)                                                                                                                                                                      1000 habitants)
Mobile Cellular Subscribers (per                                                                                                                                  Abonnés aux téléphones mobiles
                                                3            5           12           24           41           59          133            ...          ...
1,000 inhabitants)                                                                                                                                                         (pour 1000 habitants)


                          VII FINANCIAL AND MONETARY STATISTICS - FINANCES ET STATISTIQUES MONETAIRES

                                           2002         2003         2004         2005         2006         2007         2008         2009         2010

VII-1 Monetary Statistics                                                                                                                                VII-1 Statistiques monétaires
CFA Franc (Millions)                                                                                                                                                    Franc CFA (Millions)
Money supply (M1)                          95 558      149 474      181 854      192 170      225 386      269 346      291 220      356 352      417 935                   Masse monétaire (M1)
Quasi-money                                40 532       44 430       50 328       56 205       59 819       86 307      106 894      116 182      127 743                           Quasi-monnaie
  of which Demand Deposit                       ...          ...          ...          ...          ...          ...          ...          ...          ...              dont Monnaie scripturale
Net foreign assets                         21 355       67 143       71 252       75 130      168 394      255 667      320 813      238 383      296 061                    Avoirs extérieurs nets
Domestic credit                           128 866      146 320      185 456      191 796      151 092      142 089      147 761      311 277      341 120                           Crédit intérieur

of which claims on private sector          75 803       83 026      101 446      121 286      159 066      191 922      262 603      310 891      346 904       dont créances sur le secteur privé

of which Claims on government                                                                                                                                          dont créances nettes sur le
                                           53 063       63 294       84 010       70 510       - 7 974     - 49 833    - 114 842         386       - 5 784
sector, net                                                                                                                                                                        gouvernement
International reserves (millions of US                                                                                                                        Réserves internationales (millions de
                                              134          260          258          250          371          593          705          656          650
$)                                                                                                                                                                                            $ EU)
Average Exchange Rate (National                                                                                                                                Taux de change (moyen) (monnaie
                                           696.99       581.20       528.29       527.47       522.89       479.27       447.81       472.19       495.28
Currency per us $)                                                                                                                                                         nationale par dollars)


VII-2 Public Finance                                                                                                                                              VII-2 Finances publiques
CFA Franc (Millions)                                                                                                                                                    Franc CFA (Millions)
Total Revenues and Grants                 235 500      232 700      262 000      323 000     1 130 300     427 500      604 000      468 000      439 412                 Recettes totales et dons
  Tax Revenue                             144 600      152 100      167 600      181 300      204 000      233 200      273 800      336 500      234 516                         Recettes fiscales
  Non Tax Revenue                          16 300        4 700        6 200        7 700       43 400       75 800      160 900       20 600       10 821                    Recettes non fiscales
  Grants                                   74 600       76 000       89 200      134 000      882 900      118 500      169 300      110 900      194 075                                     Dons      263
Total Expenditures and Net Lending        278 000      274 600      317 600      358 300      362 700      446 300      570 900      631 900      627 432           Dépenses totales et prêts nets

  Current expenditure                     161 700      159 100      170 200      165 100      125 800      173 800      183 900      201 500      140 255                     Dépenses courantes
  Of which Wages and Salaries              55 300       57 100       59 000       63 000       68 000       72 200       83 800       93 300       69 955           Dont rémunérations et salaires
  Capital expenditure                     116 300      115 500      144 000      193 100      182 700      207 100      283 400      333 800      376 877                 Dépenses d'équipement
  Net Lending                               - 200            0          800        - 200            0            0            0             0            0                               Prêts nets
Fiscal Balance                            - 37 900     - 30 900     - 32 200     - 10 900     767 600      - 18 800      33 100     - 163 900    - 188 020         Solde global y compris les dons


VII-3 Balance of Payments                                                                                                                                     VII-3 Balance des paiements
CFA Franc (Millions)                                                                                                                                                    Franc CFA (Millions)
Trade balance                             - 63 930     - 79 400     - 80 840    - 153 962    - 125 668    - 120 463    - 195 871    - 235 298           ...                  Balance commerciale
Services Balance                          - 70 885     - 75 098     - 89 187    - 101 172    - 124 432    - 136 467    - 210 512    - 295 041           ...                   Balance des services
Net Income                                - 16 871     - 15 186      - 6 810      - 5 012         634        - 211       - 8 482     - 15 790           ...                           Revenus nets
Current transfers, net total               36 801       42 608       54 877       95 834       85 421       88 791      103 147       65 371            ...                    Transferts courants
Current account balance                  - 114 885    - 127 098    - 121 960    - 164 312    - 164 045    - 168 350    - 311 718    - 480 758           ...              Solde du compte courant


VII-4 External Debt and Financial Flows                                                                                                     VII-4 Dette extérieure et flux financiers
US $ (Millions)                                                                                                                                                                $ E.U (Millions)
Total external debt                         1 843        1 848        1 707        1 743          575          682          752          832          979                   Dette extérieure totale
  Private                                       0            0            0            0            0            0            0             0            0                                   Privée
  Public                                    1 843        1 848        1 707        1 743          575          682          752          832          979                                 Publique
Total external debt service                    55           56           43           45           40           38           42           20           17            Service de la dette extérieure
Net Foreign Direct Investment                                                                                                                                 Investissements étranger direct (flux
                                                2           11           20           30           51          129          566          739            ...
Inflows                                                                                                                                                                             nets entrants)
Net Total Official Development                                                                                                                                   Aide publique au développement
                                              300          461          547          520          526          542          607          470            ...
assistance                                                                                                                                                                          (nette totale)


                                                                                                      African Statistical Yearbook 2011 / Annuaire Statistique pour l'Afrique 2011
Niger                                                                                                                                   Niger

                                           2002      2003       2004      2005       2006    2007    2008    2009    2010

         US $ (Millions)                                                                                                                       Franc CFA
         Exports, fob                                                                                                                Exportations, fàb


         Exports - Total                     195        204        231       252       266     318     409     417      ...             Exportations - Total


         Main Products                                                                                                               Principaux produits


         Uranium                              62         66         70        79        80     143     198     195      ...                         Uranium


         Gold                                  ...        ...        9        34        20      26      19      23      ...                               Or


         Cattles, live                         9         11         10        10        11       9      30       9      ...                 Bovins sur pieds


         Goats, live                           5          5          5         3         3       3      15       3      ...                Caprins sur pieds


         Onions                               13         13         15        14        12      13      13       5      ...                         Oignons

         Main Destinations                                                                                                      Principales destinations

         France                              42.4       44.3      48.3       56.5     50.0    99.6   116.4   147.7      ...                          France


         Nigeria                             37.5       34.4      28.7       23.6     24.1    19.6    79.0    19.8      ...                          Nigeria


         United States                        0.1        0.2       0.3        0.5      0.3    11.0    44.8    22.3      ...                       Etats-Unis


         Japan                               18.6       18.0      18.0       21.6     19.1    31.9    32.9    22.4      ...                           Japon


         Switzerland                          0.0        0.0       8.9       31.8     17.0    27.0    17.6    22.8      ...                           Suisse


                                           2002      2003       2004      2005       2006    2007    2008    2009    2010
         Imports, cif                                                                                                                 Importations, cif

264      Imports - Total                     314        342        376       498       496     551     760     817      ...   Importations - Total (millions)


                                                                                                                                     Principaux produits
         Main Products


         Petroleum products                   29         32         39        46        54      62      78      76      ...               Produits pétroliers


         Rice                                 33         21         29        48        31      25      46      26      ...                              Riz


         Medicaments                           6          8         17         8        16      33      50      25      ...                    Médicaments


         Hydraulic cements                     8          7         12        15        17      18      23      23      ...           Ciments hydrauliques


         Tourism cars                          8         10         12        10        11      12      12      14      ...            Voitures de tourisme


         Main Origin                                                                                                            Principales provenances

         France                              46.4       47.0      52.5       60.7     68.2    85.7    68.8   101.2      ...                          France

         China                               27.1       30.1      17.2       19.6     54.2    27.0    66.8   228.9      ...                            Chine

         United States                       14.3       15.8      32.6       13.6     29.7    34.3    37.3    33.0      ...                       Etats-Unis

         Nigeria                             20.3       22.3      24.6       21.3     27.2    21.5    24.8    38.1      ...                          Nigeria

         Cote d'Ivoire                       40.9       39.6      32.1       33.6     26.1    31.9    23.3    25.5      ...                    Côte d'Ivoire


      African Statistical Yearbook 2011 / Annuaire Statistique pour l'Afrique 2011
Nigeria                                                                                                                                                                            Nigéria

AREA (KM 2)                                                                                         923 768                                                               SUPERFICIE (KM 2)
CAPITAL CITY                             Abuja                                                                                                     Abuja                              CAPITALE
CURRENCY                                 Naira                                                                                                     Naira                              MONNAIE


                         I SOCIAL AND DEMOGRAPHIC INDICATORS — INDICATEURS DEMOGRAPHIQUES ET SOCIAUX

                                            2002          2003         2004         2005         2006         2007         2008         2009       2010
Population                                                                                                                                                                         Population
                                                                                                                                                                Population au milieu de l'année -
Mid-year population - Total (Million)         125.8         129.9        134.1        138.5        140.4        147.6        152.3        157.1       ...
                                                                                                                                                                                   Total (million)
                                                                                                                                                                Population au milieu de l'année -
Mid-year population - Urban (%)                   ...          ...        45.0         46.0         47.0         48.0         48.0         49.1       ...
                                                                                                                                                                                   Urbaine (%)

Female (%)                                     49.9          49.9         49.9         49.9         49.2         49.8         49.8         49.8       ...                             Femme (%)


Population by Age Group                                                                                                                                             Population par groupe d'âge


   0-14                                   56500 000     58300 000    60100 000    61900 000    58700 000    65800 000    67700 000    69600 000       ...                                     0-14


   15-64                                  65800 000     67900 000    70300 000    72700 000    77200 000    77600 000    80200 000    82900 000       ...                                    15-64


   65+                                     3500 000      3600 000     3800 000     3900 000     4600 000     4200 000     4300 000     4500 000       ...                                      65+


Active Population (000)                    39 631.0      40 665.0     41 735.0     42 854.0     44 002.0     45 210.0     46 472.0     47 783.0       ...                 Population active (000)

   Female (%)                                  34.3          34.8         35.2         35.2         35.4         35.8         36.2         36.5       ...                             Femme (%)

                                                                                                                                                               Taux brut de natalité - Total (par
Crude birth rate - Total (per 1000)               ...          ...          ...          ...        40.7         40.3         39.8         39.3       ...
                                                                                                                                                                                          1000)
                                                                                                                                                              Taux brut de mortalité - Total (par
Crude death rate - Total (per 1000)            16.9          15.9         19.3         17.8         16.7         16.6         16.4         16.2       ...
                                                                                                                                                                                           1000)
Life expectancy at birth - Total                                                                                                                               Espérance de vie à la naissance -
                                               57.1          57.1         57.1         58.7         58.7         58.7         58.7         58.7       ...
(years)                                                                                                                                                                          Total (années)
Net reproduction rate - (per                                                                                                                                    Taux net de reproduction - (par
                                                  ...          ...          ...         1.8           ...          ...          ...          ...      ...
woman)                                                                                                                                                                                 femme)
                                                                                                                                                               Indice synthétique de fécondité -
Total fertility rate - (per woman)               5.8          5.8          5.8          5.6          5.6          5.6          5.6          5.6       ...
                                                                                                                                                                                   (par femme)

Education                                                                                                                                                                      Enseignement

Teaching staff at first level - Total                                                                                                                        Personnel enseignant - 1er degré -
                                             492.00         591.0        598.0        599.0        535.0        468.2        586.9           ...      ...
(thousands)                                                                                                                                                                     Total (milliers)
Teaching staff at second level -                                                                                                                            Personnel enseignant - 2ème degré -
                                             133.70         180.3        154.6        144.4        199.2           ...          ...          ...      ...
Total (thousands)                                                                                                                                                                Total (milliers)     265
Teaching staff at third level - Total                                                                                                                       Personnel enseignant - 3ème degré -
                                               36.1          40.1         40.4           ...          ...          ...          ...          ...      ...
(thousands)                                                                                                                                                                      Total (milliers)
First level student enrollment - Total                                                                                                                         Elèves inscrits - 1er degré - Total
                                             19 353        21 396       23 115       23 047       22 466       21 632       21 295       21 857       ...
(thousands)                                                                                                                                                                              (milliers)
First level student enrollment -                                                                                                                            Elèves inscrits - 1er degré - Femmes
                                              8 791         9 181        9 571        9 926       10 370        9 949           ...          ...      ...
Female (thousands)                                                                                                                                                                       (milliers)
Second level student enrollment -                                                                                                                            Elèves inscrits - 2ème degré - Total
                                              4 866         6 316        6 719        6 909        6 617        6 138        6 625           ...      ...
Total (thousands)                                                                                                                                                                       (milliers)
Second level student enrollment -                                                                                                                                  Elèves inscrits - 2ème degré -
                                              2 267         2 561        2 854        2 973        2 842        2 608           ...          ...      ...
Female (thousands)                                                                                                                                                             Femmes (milliers)
Third level student enrollment -                                                                                                                             Elèves inscrits - 3ème degré - Total
                                              963.4       1 127.9      1 304.7      1 391.5           ...          ...          ...          ...      ...
Total (thousands)                                                                                                                                                                       (milliers)
Third level student enrollment -                                                                                                                                   Elèves inscrits - 3ème degré -
                                                  ...          ...          ...          ...          ...          ...          ...          ...      ...
Female (thousands)                                                                                                                                                             Femmes (milliers)
Public expenditure on education (%                                                                                                                             Dépenses publiques consacrées à
                                                 9.2          6.5          5.9          6.2          7.8          8.7          6.9           ...      ...
of budget)                                                                                                                                                       l'enseignement (% du budget)

Health                                                                                                                                                                                    Santé

Hospital beds - Total (per 10 000                                                                                                                              Nombre de lits d'hôpitaux - Total
                                                   6            6            5            6            6            7           ...          ...      ...
population)                                                                                                                                                                      (pour 10 000)
Nurses - Total (per 10 000                                                                                                                                    Nombre d'infirmières - Total (pour
                                                 10           11           12           12           16           15            ...          ...      ...
population)                                                                                                                                                                             10 000)
Physicians - Total (per 10 000                                                                                                                                Nombre de médecins - Total (pour
                                                   3            3            3            3            4            4           ...          ...      ...
population)                                                                                                                                                                           10 000)
Public expenditure on Health (% of                                                                                                                          Dépenses publiques consacrées à la
                                                   5            3            4            4            5            6            6           ...      ...
budget)                                                                                                                                                                   santé (% du budget)


                                                                                                        African Statistical Yearbook 2011 / Annuaire Statistique pour l'Afrique 2011
Nigeria                                                                                                                                                                             Nigéria
                                                                  II NATIONAL ACCOUNTS — COMPTES NATIONAUX

                                                    2002         2003          2004          2005          2006          2007          2008          2009       2010

          Gross domestic product by kind of economic activity at current prices
                                                                                                               Produit intérieur brut par branche d'activité économique aux prix courants


          Naira (Millions)                                                                                                                                                              Naira(Millions)

          Agriculture                             3 357 063    3 624 579     3 903 759     4 773 198     5 940 237     6 791 237     7 601 546     9 063 718       ...                           Agriculture

          Mining and quarrying                    1 805 891    2 749 967     4 260 767     5 682 185     7 010 219     7 564 497     9 133 941     7 359 875       ...                 Industries extractives

          Manufacturing                            223 017      270 372       326 860       383 669       441 066       479 527       537 991       558 655        ...           Industries manufacturières

          Electricity, gas & water                  32 633       39 764        49 286        58 425        80 073        87 134       100 253       116 109        ...                Electricité, gaz et eau

          Construction                              47 985       58 905       166 078       215 786       250 332       266 464       306 582       347 691        ...         Bâtiments et travaux publics
          Wholesale & retail trade,                                                                                                                                         Commerce de gros et de détail,
                                                   782 107      933 571      1 519 672     1 914 331     2 799 406     3 150 982     3 209 389     4 060 645       ...
          restaurants, hotels                                                                                                                                                        restaurants et hôtels
                                                                                                                                                                             Banques, assurances, affaires
          Finance, insurance, real estate, etc.    302 175      376 039       566 195       843 585      1 105 260     1 266 503     1 456 478     1 657 246       ...
                                                                                                                                                                                             immobilières
          Transport and communications             188 600      238 088       387 340       424 995       607 346       716 996       729 010       762 725        ...      Transport(s) et communications
                                                                                                                                                                                Administrations publiques et
          Public administration and defense         81 998       90 206       101 039       115 191       131 329       151 330       174 030       197 262        ...
                                                                                                                                                                                                    défense
          Other services                            90 912      105 539       130 071       160 874       199 325       249 385       287 408       328 477        ...                       Autres services
                                                                                                                                                                          Moins Services d’intermédiation
          Less Imputed Service Charges                   ...          ...           ...           ...           ...           ...           ...           ...      ...
                                                                                                                                                                                                   financière
          Gross domestic product at factor                                                                                                                             Produit intérieur brut aux couts des
                                                  6 912 381    8 487 032    11 411 067    14 572 239    18 564 595    20 724 056    23 536 626    24 452 403       ...
          cost / basic prices                                                                                                                                                        facteurs / prix de base

          Plus: Indirect Taxes / taxes on                                                                                                                                Plus taxes indirectes/impôts sur les
                                                   215 822      255 615       262 535       163 085       144 982       216 855      1 128 618      772 736        ...
          products, less subsidies                                                                                                                                           produits, moins les subventions


          Expenditure on Gross domestic product at current purchaser's values
                                                                                                                            Emploi du produit intérieur brut aux prix courants d'acquisition

          Naira (Millions)                                                                                                                                                              Naira(Millions)
                                                                                                                                                                                  Consommation finale des
          Government final consumption             478 293      450 490       785 819      1 003 104     1 283 403     2 608 600     3 134 150     3 213 150       ...
                                                                                                                                                                                  administrations publiques

          Private final consumption               5 540 186    7 044 545     8 637 732    11 075 059    11 834 368    15 682 906    15 756 158    18 859 553       ...          Consommation finale privée

          Gross fixed capital formation            499 682      865 876       863 073       804 401      1 546 526     1 935 040     2 050 763     3 048 023       ...       Formation brute de capital fixe

          Increase in inventories                      742          827           928         1 182         1 470         1 571         1 661         1 768        ...                  Variation des stocks

          Exports of goods and services           2 563 707    3 478 515     3 520 846     4 664 757     8 066 038     7 063 060     9 837 271     7 766 227       ...     Exportations de biens et services
266       Less imports of goods and services      1 954 407    3 097 607     2 134 796     2 813 178     4 022 227     6 350 266     6 114 759     7 663 582       ...
                                                                                                                                                                             Moins importations de biens et
                                                                                                                                                                                                   services
          GDP at purchasers' values               7 128 203    8 742 647    11 673 602    14 735 324    18 709 577    20 940 911    24 665 244    25 225 139       ...             PIB aux prix d'acquisition


          Gross domestic product by kind of economic activity at constant
                                                                                                              Produit intérieur brut par branche d'activité economique aux prix constants
          prices
          Annual Growth Rates (%)                                                                                                                                 Taux de croissance annuel (%)
          Agriculture                                  55.2          7.0           6.3           7.1           7.4           7.2           6.3           5.9       ...                           Agriculture

          Mining and quarrying                         -5.6         23.7           3.4           0.6          -4.3          -4.3          -5.9          -1.1       ...                 Industries extractives

          Manufacturing                                10.8          5.5          12.0           9.6           9.4           9.5           8.9           7.9       ...           Industries manufacturières

          Electricity, gas & water                     12.8         16.5          16.6           6.7           5.0           5.1           4.0           3.5       ...                Electricité, gaz et eau

          Construction                                  4.3          8.7          -6.8          12.1          13.0          13.0          13.1          12.3       ...         Bâtiments et travaux publics
          Wholesale & retail trade,                                                                                                                                               Commerce de gros et de
                                                        6.5          5.7          38.3          13.4          15.2          15.1          14.0          11.3       ...
          restaurants, hotels                                                                                                                                                   détail,restaurants et hôtels
                                                                                                                                                                              Banques, assurances, affaires
          Finance, insurance, real estate, etc.        22.4         -6.7           4.6           4.9           6.7           6.9           6.8           6.1       ...
                                                                                                                                                                                               immobilières
          Transport and communications                 19.8          7.1          51.7          13.6          16.4          17.9          19.5          21.1       ...      Transport(s) et communications
                                                                                                                                                                                Administrations publiques et
          Public administartion and defense            18.1          0.0          10.8           4.0           4.5           4.5           4.4           4.4       ...
                                                                                                                                                                                                    défense
          Other services                               12.4          2.6          10.8          10.3          10.5          10.5          10.6           9.8       ...                       Autres services
                                                                                                                                                                          Moins Services d’intérmediation
          Less Imputed Service Charges                   ...          ...           ...           ...           ...           ...           ...           ...      ...
                                                                                                                                                                                                   financière
          Gross domestic product at factor                                                                                                                             Produit intérieur brut aux couts des
                                                       21.3         10.2          10.5           6.5           6.0           6.4           6.0           6.7       ...
          cost / basic prices                                                                                                                                                        facteurs / prix de base

          Plus: Indirect Taxes / taxes on                                                                                                                                Plus taxes indirectes/impôts sur les
                                                       14.6         14.5          14.7         -37.0          17.7          37.1           6.0           6.7       ...
          products, less subsidies                                                                                                                                           produits, moins les subventions

          Gross domestic product at market                                                                                                                                 Produit intérieur brut aux prix du
                                                       21.2         10.3          10.6           5.4           6.2           7.0           6.0           6.7       ...
          prices                                                                                                                                                                                     marché


           2009: Provisional                                                                                                                                                             2009: provisoire


      African Statistical Yearbook 2011 / Annuaire Statistique pour l'Afrique 2011
Nigeria                                                                                                                                                                            Nigéria

Expenditure on Gross domestic product at constant purchasers' values                                                Emplois du produit intérieur brut aux prix constants d'acquisition


Annual Growth Rates (%)                                                                                                                               Taux de croissance annuel (%)
                                                                                                                                                                        Consommation finale des
Government final consumption                     5.8         -23.9        565.5           10.5          35.8          21.4      15.4      -26.1        ...
                                                                                                                                                                        administrations publiques

Private final consumption                       19.9          16.7         -25.8           6.1         -18.1          28.1       0.7       5.6         ...           Consommation finale privée

Gross fixed capital formation                   25.4          63.7        457.1           27.5          27.8         -24.4      -5.4      12.0         ...        Formation brute de capital fixe

Exports of goods and services                   11.6          31.4          -1.0          12.4          70.4          -6.7       5.5      31.0         ...      Exportations de biens et services

                                                                                                                                                                  Moins importations de biens et
Less imports of goods and services               6.4          53.4         -33.2          33.6          36.0          13.7      -2.4      -13.8        ...
                                                                                                                                                                                        services


                                                                                          III INFLATION

                                             2002          2003          2004          2005          2006          2007       2008      2009       2010
Annual Growth Rates (%)                                                                                                                               Taux de croissance annuel (%)
All Item                                       12.2          23.8          10.0          11.6            8.5           6.6      15.1      12.0       13.7                               Ensemble

Food                                             9.1         15.4          12.1          15.5            3.9           8.2      18.0      13.6       14.7                            Alimentation

Health                                         40.8          13.3          -17.5         24.4            9.9          -6.5      14.0       3.5       10.7                                   Santé

Energy                                         27.9          48.8          14.1            1.1         18.3            8.4      11.7       7.2       13.0                                  Energie

Transport                                        4.5         29.9            0.1         12.5          23.6            7.2       1.2       8.6       10.9                               Transport


                                                    IV AGRICULTURAL PRODUCTION - PRODUCTION AGRICOLE

                                             2002          2003          2004          2005          2006          2007       2008      2009       2010
Tons (Thousand)                                                                                                                                                            Tonnes (milliers)
Cassava, Tons (thousands)                    30 393        30 668        33 393        35 835        38 041        39 130     33 216         ...       ...               Manioc, tonnes (milliers)

Yam, Tons (thousands)                        23 412        26 261        26 631        32 337        28 280        26 751     27 211         ...       ...             Ignames, tonnes (milliers)

Sorghun, Tons (thousands)                     5 083         4 653         9 994         6 579         6 474         5 429      5 218         ...       ...               Sorgho, tonnes (milliers)

Maize, Tons (thousands)                       5 657         5 191         9 401         7 469         7 023         5 797      9 113         ...       ...                 Maïs, tonnes (milliers)

Millet, Tons (thousands)                      4 195         4 233         6 963         5 779         5 940         4 388      4 367         ...       ...                   Mil, tonnes (milliers)


                                                            V MINING PRODUCTION - PRODUCTION MINIERE
                                                                                                                                                                                                      267
                                             2002          2003          2004          2005          2006          2007       2008      2009       2010


Limestone, metric tons (thousands)          11 414.9      12 556.4      14 693.1       1 160.6      15 280.8            ...       ...        ...       ... Calcaire, tonnes métriques (milliers)

Shale, metric tons (thousands)            1071 883.4    1179 071.7    1203 687.0      67 229.0    1263 834.5    1268 183.0        ...        ...       ...     Schiste argileux, tonnes métriques
                                                                                                                                                                                         (milliers)

Granite, metric tons (thousands)          1551 329.1            ...           ...   2285 493.3    1635 555.6            ...       ...        ...       ... Granite, tonnes métriques (milliers)


                                                                                    VI ENERGY - ENERGIE

                                             2002          2003          2004          2005          2006          2007       2008      2009       2010

Electricity - total hydro production,                                                                                                                         Électricité - production hydraulique
                                            13 248.8     142 048.2      17 325.1      18 094.9      16 422.2      15 142.6        ...        ...       ...
kilowatt hours (millions)                                                                                                                                        totale, kilowatt-heures (millions)

Electricity - total thermal production,                                                                                                                         Électricité - production thermique
                                             6 350.0      78 181.6       5 591.7       6 128.5       8 052.0       7 835.5        ...        ...       ...
kilowatt hours (millions)                                                                                                                                        totale, kilowatt-heures (millions)

Electricity - total production, self-                                                                                                                        Electricité - Production totale privée
                                                  ...           ...           ...           ...           ...           ...       ...        ...       ...
producer (Million Kilowatt Hours)                                                                                                                                      (million de kilowatt heures)

Electricity - total production, public                                                                                                                              Electricité - Production totale
                                             19 599       220 230        22 917        24 223        24 474        22 978         ...        ...       ...
(Million Kilowatt Hours)                                                                                                                                     publique (million de kilowatt heures)


                                                                                                            African Statistical Yearbook 2011 / Annuaire Statistique pour l'Afrique 2011
Nigeria                                                                                                                                                                                Nigéria
                                                   VII TOURISM AND INFRASTRUCTURE - TOURISME ET INFRASTUCTURE

                                                    2002         2003         2004         2005          2006          2007          2008          2009          2010

         Arrivals - Tourists (thousands)                3.1       3.897        4.059        3.109         3.055         3.784             ...           ...           ...        Arrivées - touristes (milliers)

         Rooms in hotels and similar                                                                                                                                      Chambres d'hotels et établissements
         establishments (thousands)                 30.699       37.528       37.738        38.87        40.814        42.723             ...           ...           ...                  assimilés (milliers)

         Paved Road (% of total)                        81           81           81           83            69            72             ...           ...           ...     Routes asphaltées (% du total)
         Total Network (Railways-km)                34 403       34 403       34 403       34 403        40 712        40 713             ...           ...           ...      Réseau total voies ferrées-Km
         Main Telephone Lines (per 1,000                                                                                                                                     Lignes téléphoniques fixes (pour
                                                          7            9          10           12            17            16              9            ...           ...
         inhabitants)                                                                                                                                                                         1000 habitants)
         Mobile Cellular Subscribers (per                                                                                                                                    Abonnés aux téléphones mobiles
                                                        16           32           92          186           313           404           417             ...           ...
         1,000 inhabitants)                                                                                                                                                             (pour 1000 habitants)


                                    VII FINANCIAL AND MONETARY STATISTICS - FINANCES ET STATISTIQUES MONETAIRES

                                                    2002         2003         2004         2005          2006          2007          2008          2009          2010

         VII-1 Monetary Statistics                                                                                                                                     VII-1 Statistiques monétaires
         Naira (Millions)                                                                                                                                                                 Naira(Millions)
         Money supply (M1)                         902 558     1 006 378    1 198 219    1 523 436    1 823 061     3 164 427     4 678 188     4 502 736      4 985 078               Masse monétaire (M1)
         Quasi-money                               653 242      759 633      932 951     1 089 460    1 739 640     2 686 840     4 247 830     5 707 990      5 859 250                       Quasi-monnaie
           of which Demand Deposit                       ...          ...          ...          ...           ...           ...           ...           ...           ...            dont Monnaie scripturale
         Net foreign assets                       1 255 210    1 356 360    2 612 380    3 865 390    6 188 680     7 332 630     8 598 020     7 287 960      6 219 510                Avoirs extérieurs nets
         Domestic credit                          1 393 500    1 853 170    1 365 970    1 267 300      918 539     4 209 530     6 562 850     9 259 390     11 542 600                       Crédit intérieur

         of which claims on private sector         929 817     1 207 860    1 533 600    1 950 350    2 466 570     5 287 330     8 324 800     9 687 251     10 406 200    dont créances sur le secteur privé

         of which Claims on government                                                                                                                                           dont créances nettes sur le
                                                   372 684      528 344     - 272 377    - 837 353    -1 812 020    -1 668 730    -3 107 580    -1 971 830     - 438 325
         sector, net                                                                                                                                                                          gouvernement
         International reserves (millions of US                                                                                                                         Réserves internationales (millions de
                                                     7 331        7 128       16 956       28 280        42 299        51 334        53 002        44 763        34 919
         $)                                                                                                                                                                                             $ EU)
         Average Exchange Rate (National                                                                                                                                 Taux de change (moyen) (monnaie
                                                    120.58       129.22       132.89       131.27        128.65        125.81        118.55        148.90        150.30
         Currency per us $)                                                                                                                                                            nationale par dollars)


         VII-2 Public Finance                                                                                                                                                VII-2 Finances publiques
         Naira (Millions)                                                                                                                                                                 Naira(Millions)
         Total Revenues and Grants                2 052 825    2 795 000    4 127 000    5 619 300    6 061 000     5 715 500     7 866 600     4 844 600      6 197 043             Recettes totales et dons
           Tax Revenue                            1 984 691    2 740 800    4 068 000    5 407 200    6 027 700     5 446 800     7 752 600     4 771 400             ...                     Recettes fiscales
           Non Tax Revenue                          68 134       54 200       59 000      212 100        33 300       268 700       114 000        73 200             ...                Recettes non fiscales
           Grants                                         0            0            0            0             0             0             0             0            ...                                  Dons
268
         Total Expenditures and Net Lending       2 290 434    2 795 000    3 177 000    1 919 700    2 038 000     2 450 900     3 240 800     3 456 900      4 107 531       Dépenses totales et prêts nets

           Current expenditure                     507 166      515 000      571 000      809 400       983 100     1 337 700     1 700 600     1 884 600             ...                 Dépenses courantes
           Of which Wages and Salaries             368 484      367 950      443 000      527 400       629 100       867 300     1 080 700     1 148 300             ...      Dont rémunérations et salaires
           Capital expenditure                     615 453      718 000      716 000      519 500       552 400       759 300       960 900     1 152 800             ...             Dépenses d'équipement
           Net Lending                             761 887     1 190 000    1 523 000           ...           ...           ...           ...           ...           ...                            Prêts nets
         Fiscal Balance                           - 237 609            0     950 000     3 699 600    4 023 000     3 264 600     4 625 800     1 387 700      2 089 512      Solde global y compris les dons


         VII-3 Balance of Payments                                                                                                                                      VII-3 Balance des paiements
         Naira (Millions)                                                                                                                                                                 Naira(Millions)
         Trade balance                             382 752     1 215 675    2 615 736    3 832 996    4 495 928     4 749 881     5 537 792     4 507 331             ...                Balance commerciale
         Services Balance                         - 288 177    - 288 699    - 349 150    - 634 172    -1 214 702    -1 639 796    -2 547 340    -2 284 030            ...                Balance des services
         Net Income                               - 381 459    - 422 582    - 568 168    - 296 211    -1 103 385    -1 478 573    -1 463 834    -1 491 906            ...                        Revenus nets
         Current transfers, net total              169 847      200 166      357 908     1 989 132    2 179 755     2 247 714     2 221 729     2 676 713             ...                 Transferts courants
         Current account balance                  - 117 037     704 560     2 056 326    4 891 744    4 357 587     3 879 226     3 748 347     3 408 109             ...           Solde du compte courant


         VII-4 External Debt and Financial Flows                                                                                                          VII-4 Dette extérieure et flux financiers
         US $ (Millions)                                                                                                                                                                  $ E.U (Millions)
         Total external debt                      3 932 885    4 478 329    4 890 270    2 695 072      451 462       428 059       494 020       584 600             ...              Dette extérieure totale
           Private                                        0            0            0            0             0             0             0            ...           ...                                Privée
           Public                                 3 932 885    4 478 329    4 890 270    2 695 072      451 462       428 059       494 020             ...           ...                              Publique
         Total external debt service               141 342      234 227      234 261      180 000       856 900       128 700        14 000        63 400             ...       Service de la dette extérieure
         Net Foreign Direct Investment                                                                                                                                        Investissements étranger direct
                                                         ...          ...          ...          ...   1 067 974     2 479 003     3 449 512     2 484 057             ...
         Inflows                                                                                                                                                                          (flux nets entrants)
         Net Total Official Development                                                                                                                                      Aide publique au développement
                                                         ...          ...          ...          ...           ...           ...           ...           ...           ...
         assistance                                                                                                                                                                              (nette totale)


      African Statistical Yearbook 2011 / Annuaire Statistique pour l'Afrique 2011
Nigeria                                                                                                                                                       Nigéria

                             2002         2003         2004         2005         2006          2007         2008         2009       2010

Naira (Millions)                                                                                                                                                      Naira
Exports, fob                                                                                                                                          Exportations, fàb


Exports - Total            1 744 178    3 087 886    4 602 782    7 246 535    7 324 681     8 120 148    9 599 805           ...      ...               Exportations - Total


Main Products                                                                                                                                         Principaux produits


Crude Petroleum            1 925 613    2 947 549    4 473 543    6 252 882    7 006 591     6 395 167    8 751 618    6 284 406       ...                       Pétrole Brut


Natural Gas                  74 852       34 177       28 490       20 104            ...       43 314      26 261      321 096        ...                       Gaz naturel


Palm Nuts & Kernels             760           60           14            ...         24            234          16            ...      ...             Noix de palme et noix


Light Vessels etc, nes        8 359       10 759       73 658       23 238       35 478         18 914       5 972        1 319        ...         Bâtiments légers etc, nda


Sesamum Seeds                     ...          ...          ...          ...        335         15 079      17 695       28 941        ...                Graines de sésame

Main Destinations                                                                                                                                Principales destinations

U.S.A                      701 064.4 1 189 476.6 2 201 793.4 2 703 093.7 3 400 558.4        3 395 448.0 4 051 344.8 2 026 629.5        ...                         États-Unis


Brazil                     185 454.3    211 362.9    410 182.3    561 845.2    319 463.3     241 407.5    620 773.8    593 511.2       ...                              Brésil


Spain                      122 842.2    191 663.0    375 399.4    534 353.3    602 954.5     474 025.9    327 299.7    324 292.4       ...                           Espagne


France                     120 212.1    175 559.0    227 059.2    340 766.1    427 505.6     377 014.0    394 192.0    407 357.8       ...                            France


Japan                       66 103.3    124 698.8    149 851.3    201 133.1    142 026.1     131 327.9     34 480.3     34 484.7       ...                             Japon


                             2002         2003         2004         2005         2006          2007         2008         2009       2010
Imports, cif                                                                                                                                          Importations, cif

Imports - Total                   ...          ...          ...          ...          ...           ...          ...          ...      ...    Importations - Total (millions)    269
                                                                                                                                                      Principaux produits
Main Products


Spelt,Wheat & Meslin         41 711       50 148       61 878       79 988      163 189        233 061      73 553      159 894        ...            Epeautre, blé et méteil


Urea                          4 754        3 889        6 549        6 681       19 655         18 857      24 169        8 799        ...                               Urée


F/cold rolled iron steel     14 837       15 949       12 059       14 891       18 787         36 445      24 350       27 755        ...   F / acier laminé à froid en acier


Coffee Products                 336       39 707        1 036       18 766          445          1 368         480          302        ...                  Produits du café


Paper                        10 621       15 261       13 776       17 639          472              8           ...          ...      ...                             Papier


Main Origin                                                                                                                                      Principales provenances

U.S.A                      134 988.8    298 416.1    174 209.4    361 048.0    455 165.2     623 645.2    267 722.0    303 733.6       ...                         Etats-Unis

U.K                        132 032.0    183 478.6    205 957.2    151 043.4    344 609.9     218 841.0    143 627.1    229 514.9       ...                     Royaume-Uni

Germany                     64 046.3    140 572.9    148 623.4     84 781.9    163 057.3     201 228.2    223 026.7     45 393.9       ...                         Allemagne

Japan                       52 040.7     47 027.7     39 032.3     62 946.6     96 813.2      95 422.1     88 834.2    144 074.9       ...                             Japon

France                      43 574.2     61 271.1     64 431.3    125 909.8    128 683.7     158 564.7    155 688.6    292 084.1       ...                            France


                                                                                        African Statistical Yearbook 2011 / Annuaire Statistique pour l'Afrique 2011
Rwanda                                                                                                                                                                        Rwanda

         AREA (KM 2)                                                                                    26 340                                                                  SUPERFICIE (KM 2)
         CAPITAL CITY                             Kigali                                                                                         Kigali                                     CAPITALE
         CURRENCY                                 Rwandan Franc                                                                         Franc Rwandais                                      MONNAIE


                                 I SOCIAL AND DEMOGRAPHIC INDICATORS — INDICATEURS DEMOGRAPHIQUES ET SOCIAUX

                                                    2002        2003        2004        2005        2006         2007        2008         2009        2010
         Population                                                                                                                                                                      Population
                                                                                                                                                                     Population au milieu de l'année -
         Mid-year population - Total (Million)          8.5         8.7         8.8         9.0         9.2          9.5         9.7         10.0        10.3
                                                                                                                                                                                        Total (million)
                                                                                                                                                                     Population au milieu de l'année -
         Mid-year population - Urban (%)                 ...         ...       17.0        18.0        17.0         18.0        18.0         18.6          ...
                                                                                                                                                                                        Urbaine (%)

         Female (%)                                    51.9        51.8        51.8        51.7        51.7         51.6        51.6         51.6        51.5                              Femme (%)


         Population by Age Group                                                                                                                                         Population par groupe d'âge


            0-14                                   3784 402    3785 910    3789 256    3823 044    3892 538    3987 352     4101 949     4226 302    4352 668                                      0-14


            15-64                                  4526 932    4668 988    4797 639    4933 715    5078 952    5225 392     5373 388     5522 043    5670 933                                     15-64


            65+                                     227 363     230 559     232 793     235 381     238 507      241 790     245 357      249 269     253 611                                      65+


         Active Population (000)                    4 058.6     4 176.8     4 282.3     4 399.3     4 532.0      4 671.7     4 813.4      4 960.6     5 104.9                  Population active (000)

            Female (%)                                 53.1        53.1        53.1        53.1        53.0         52.9        52.8         52.9        52.9                              Femme (%)

                                                                                                                                                                    Taux brut de natalité - Total (par
         Crude birth rate - Total (per 1000)           41.0        41.0        41.0        41.0        41.0         41.0        41.0         41.0        45.0
                                                                                                                                                                                                1000)
                                                                                                                                                                  Taux brut de mortalité - Total (par
         Crude death rate - Total (per 1000)           17.0        16.0        16.0        15.0        15.0         15.0        14.0         14.0        17.0
                                                                                                                                                                                               1000)
         Life expectancy at birth - Total                                                                                                                           Espérance de vie à la naissance -
                                                       46.0        47.0        48.0        48.0        49.0         50.0        50.0         51.0        46.0
         (years)                                                                                                                                                                      Total (années)
         Net reproduction rate - (per                                                                                                                                Taux net de reproduction - (par
                                                         ...         ...         ...        2.0          ...          ...         ...          ...        2.0
         woman)                                                                                                                                                                              femme)
                                                                                                                                                                    Indice synthétique de fécondité -
         Total fertility rate - (p woman)
                       y        (per    )               6.0         6.0         6.0         6.0         6.0          5.0         5.0          5.0         6.0
                                                                                                                                                                                        (par femme)

         Education                                                                                                                                                                  Enseignement

         Teaching staff at first level - Total                                                                                                                    Personnel enseignant - 1er degré -
                                                      26.02        27.3        28.3        26.9        30.6         31.0        32.3         33.2          ...
         (thousands)                                                                                                                                                                 Total (milliers)
         Teaching staff at second level - Total                                                                                                                  Personnel enseignant - 2ème degré -
270                                                    6.33         7.1         7.8         7.6         7.8         12.1        16.1           ...         ...
         (thousands)                                                                                                                                                                  Total (milliers)
         Teaching staff at third level - Total                                                                                                                   Personnel enseignant - 3ème degré -
                                                        1.3         1.3         1.7         1.8          ...          ...         ...         1.2          ...
         (thousands)                                                                                                                                                                  Total (milliers)
         First level student enrollment - Total                                                                                                                     Elèves inscrits - 1er degré - Total
                                                      1 535       1 637       1 753       1 858       2 020        2 150       2 190        2 265          ...
         (thousands)                                                                                                                                                                          (milliers)
         First level student enrollment -                                                                                                                        Elèves inscrits - 1er degré - Femmes
                                                       771         826         890         946        1 036        1 094       1 114        1 150          ...
         Female (thousands)                                                                                                                                                                    (milliers)
         Second level student enrollment -                                                                                                                        Elèves inscrits - 2ème degré - Total
                                                       157         179         204         219         240          267         288          347           ...
         Total (thousands)                                                                                                                                                                   (milliers)
         Second level student enrollment -                                                                                                                              Elèves inscrits - 2ème degré -
                                                        78          85          97         103         115          127         138          170           ...
         Female (thousands)                                                                                                                                                         Femmes (milliers)
         Third level student enrollment - Total                                                                                                                   Elèves inscrits - 3ème degré - Total
                                                       15.9        20.4        25.2        26.4          ...          ...       45.1         55.2          ...
         (thousands)                                                                                                                                                                         (milliers)
         Third level student enrollment -                                                                                                                               Elèves inscrits - 3ème degré -
                                                        5.4         7.5         9.9        10.3          ...          ...         ...        24.0          ...
         Female (thousands)                                                                                                                                                         Femmes (milliers)
         Public expenditure on education (%                                                                                                                         Dépenses publiques consacrées à
                                                         ...         ...         ...       12.2          ...        19.0          ...          ...         ...
         of budget)                                                                                                                                                   l'enseignement (% du budget)

         Health                                                                                                                                                                                 Santé

         Hospital beds - Total (per 10 000                                                                                                                          Nombre de lits d'hôpitaux - Total
                                                         ...       170         170           ...       160          160           ...          ...         ...
         population)                                                                                                                                                                   (pour 10 000)
         Nurses - Total (per 10 000                                                                                                                                Nombre d'infirmières - Total (pour
                                                        20           ...        40          26          32           32           ...          ...         ...
         population)                                                                                                                                                                         10 000)
         Physicians - Total (per 10 000                                                                                                                            Nombre de médecins - Total (pour
                                                          2           2          2            2          2             3          ...          ...         ...
         population)                                                                                                                                                                       10 000)
         Public expenditure on Health (% of                                                                                                                      Dépenses publiques consacrées à la
                                                          9         18          17          18          19            ...         ...          ...         ...
         budget)                                                                                                                                                              santé (% du budget)


      African Statistical Yearbook 2011 / Annuaire Statistique pour l'Afrique 2011
Rwanda                                                                                                                                                                                 Rwanda
                                                          II NATIONAL ACCOUNTS — COMPTES NATIONAUX

                                           2002          2003          2004         2005         2006         2007          2008         2009           2010

Gross domestic product by kind of economic activity at current prices
                                                                                                     Produit intérieur brut par branche d'activité économique aux prix courants


Rwandan Franc (Millions)                                                                                                                                             Franc Rwandais(Millions)

Agriculture                               282 000        380 000      465 000      553 000      660 000      729 000        834 000    1 012 000      1 050 240                             Agriculture

Mining and quarrying                            2 000      3 000        8 000       10 000       11 000       21 000         25 000      16 000         32 820                   Industries extractives

Manufacturing                                  60 000     67 000       84 000      101 000      117 000      124 500        158 500     189 500        213 330              Industries manufacturières

Electricity, gas & water                        3 000      2 000        1 000        3 000        3 000        8 000          5 000       6 000         16 410                   Electricité, gaz et eau

Construction                                   45 000     55 000       74 000       88 000      105 000      131 500        193 500     218 500        229 740            Bâtiments et travaux publics
Wholesale & retail trade,                                                                                                                                              Commerce de gros et de détail,
                                               92 000    116 000      147 000      188 000      232 000      289 000        415 000     449 000        491 640
restaurants, hotels                                                                                                                                                             restaurants et hôtels
                                                                                                                                                                        Banques, assurances, affaires
Finance, insurance, real estate, etc.          97 000    118 000      131 000      145 000      162 000      230 000        301 000     351 000        361 020
                                                                                                                                                                                        immobilières
Transport and communications                   53 000     60 000       74 000       90 000      117 000      145 000        197 000     223 000        262 560        Transport(s) et communications
                                                                                                                                                                          Administrations publiques et
Public administration and defense              56 000     63 000       68 000       75 000       87 000       97 000        112 000     128 000        164 100
                                                                                                                                                                                              défense
Other services                                 54 000     64 000       77 000       98 000      122 000      152 000        174 000     214 000        262 560                          Autres services
                                                                                                                                                                       Moins Services d’intermédiation
Less Imputed Service Charges              - 11 000       - 14 000     - 17 000     - 19 000     - 24 000     - 31 000      - 40 000     - 41 000       - 65 640
                                                                                                                                                                                             financière
Gross domestic product at factor                                                                                                                                   Produit intérieur brut aux couts des
                                          733 000        914 000     1 112 000    1 332 000    1 592 000    1 896 000     2 375 000    2 766 000      3 018 780
cost / basic prices                                                                                                                                                              facteurs / prix de base

Plus: Indirect Taxes / taxes on                                                                                                                                    Plus taxes indirectes/impôts sur les
                                               64 000     79 000       94 000      108 000      123 000      150 000        204 000     226 000        262 560
products, less subsidies                                                                                                                                               produits, moins les subventions


Expenditure on Gross domestic product at current purchaser's values
                                                                                                                 Emploi du produit intérieur brut aux prix courants d'acquisition

Rwandan Franc (Millions)                                                                                                                                             Franc Rwandais(Millions)
                                                                                                                                                                             Consommation finale des
Government final consumption              156 000        191 000      221 000      262 400      312 000      338 000        378 000     457 000        507 000
                                                                                                                                                                             administrations publiques

Private final consumption                 666 000        814 000      970 000     1 149 400    1 372 500    1 633 000     2 021 000    2 466 000      2 733 340            Consommation finale privée

Gross fixed capital formation             108 000        138 000      181 000      227 000      274 500      369 000        585 000     645 000        689 000          Formation brute de capital fixe

Increase in inventories                            ...         ...          ...          ...          ...          ...           ...            ...          ...                   Variation des stocks

Exports of goods and services                  56 000     84 000      134 000      164 200      190 000      229 000        373 000     303 000        356 000       Exportations de biens et services
                                                                                                                                                                        Moins importations de biens et
                                                                                                                                                                                                           271
Less imports of goods and services        189 000        234 000      300 000      363 000      434 000      523 000        778 000     879 000       1 004 000
                                                                                                                                                                                              services
GDP at purchasers' values                 797 000        993 000     1 206 000    1 440 000    1 715 000    2 046 000     2 579 000    2 992 000      3 281 340              PIB aux prix d'acquisition


Gross domestic product by kind of economic activity at constant
                                                                                                   Produit intérieur brut par branche d'activité economique aux prix constants
prices
Annual Growth Rates (%)                                                                                                                                     Taux de croissance annuel (%)
Agriculture                                      16.8        -3.1          1.9          6.5          2.8          2.6           6.5          7.6            4.9                             Agriculture

Mining and quarrying                            -27.3       -12.5         42.9         30.0        -15.4         45.5         -18.8        -15.4           -9.1                  Industries extractives

Manufacturing                                    15.7         4.9         11.8          8.4         13.6          0.9           5.1          3.2            9.4             Industries manufacturières

Electricity, gas & water                          0.0       -14.3        -33.3          0.0        -25.0         33.3           0.0          0.0           50.0                  Electricité, gaz et eau

Construction                                      3.1         7.6         19.7          9.4         12.9         15.2          28.1          1.3            8.9           Bâtiments et travaux publics
Wholesale & retail trade,                                                                                                                                                     Commerce de gros et de
                                                 16.8         5.8         14.3         16.7         18.4         13.4          17.5          2.3            8.2
restaurants, hotels                                                                                                                                                         détail,restaurants et hôtels
                                                                                                                                                                         Banques, assurances, affaires
Finance, insurance, real estate, etc.           -47.6         6.2         17.4         17.3         23.2         14.5          23.9          9.0            8.8
                                                                                                                                                                                         immobilières
Transport and communications                     78.2       23.5          11.6          8.9          9.5         11.8          12.8          5.9            5.6       Transport(s) et communications
                                                                                                                                                                          Administrations publiques et
Public administartion and defense                 1.4         5.5          0.0          2.6         10.1          5.7           4.3          7.3           13.6
                                                                                                                                                                                              défense
Other services                                  370.6         2.5         17.1         15.6          9.9         13.9          11.5          9.0           13.6                         Autres services
                                                                                                                                                                       Moins Services d’intérmediation
Less Imputed Service Charges                     -5.6         5.9         11.1          5.0         14.3         20.8           6.9         -3.2           16.7
                                                                                                                                                                                             financière
Gross domestic product at factor                                                                                                                                   Produit intérieur brut aux couts des
                                                 16.0         2.3          7.7          9.6          8.8          7.8          11.7          6.0            7.4
cost / basic prices                                                                                                                                                              facteurs / prix de base

Plus: Indirect Taxes / taxes on                                                                                                                                    Plus taxes indirectes/impôts sur les
                                                  9.6         0.0          3.9          6.5          8.8          7.3          12.0          6.0            7.6
products, less subsidies                                                                                                                                               produits, moins les subventions

Gross domestic product at market                                                                                                                                     Produit intérieur brut aux prix du
                                                 15.5         2.1          7.4          9.4          8.8          7.8          11.7          6.0            7.4
prices                                                                                                                                                                                          marché


2008: semi-final           2009: Provisional      2010:Estimated                                                         2008: semi-définitif           2009: provisoire               2010:Estimée


                                                                                                       African Statistical Yearbook 2011 / Annuaire Statistique pour l'Afrique 2011
Rwanda                                                                                                                                                  Rwanda

         Expenditure on Gross domestic product at constant purchasers'
                                                                                                   Emplois du produit intérieur brut aux prix constants d'acquisition
         values

         Annual Growth Rates (%)                                                                                                     Taux de croissance annuel (%)
                                                                                                                                                       Consommation finale des
         Government final consumption               14.0     11.8       9.7        9.6      9.5      1.0        4.8       9.7        8.6
                                                                                                                                                       administrations publiques

         Private final consumption                  16.3      -5.9      6.1        8.8     13.7      8.3        5.5      13.5        8.4             Consommation finale privée

         Gross fixed capital formation               7.3      9.9      13.5       15.8     17.3     25.3       32.3       2.6        7.3         Formation brute de capital fixe

         Exports of goods and services               3.8     16.5      30.7       11.4      2.7     11.6       40.1      -25.3      10.4       Exportations de biens et services

                                                                                                                                                 Moins importations de biens et
         Less imports of goods and services          8.1     -12.5     20.8       13.2     29.6     17.3       15.1       9.7       11.7
                                                                                                                                                                       services


                                                                                  III INFLATION

                                                   2002     2003      2004      2005      2006     2007     2008       2009       2010
         Annual Growth Rates (%)                                                                                                     Taux de croissance annuel (%)
         All Item                                    2.0      7.4      12.0        9.1      8.9      9.1       15.5      10.3        3.1                                Ensemble

         Food                                         ...       ...      ...        ...      ...      ...        ...        ...       ...                            Alimentation

         Health                                       ...       ...      ...        ...      ...      ...        ...        ...       ...                                   Santé

         Energy                                       ...       ...      ...        ...      ...      ...        ...        ...       ...                                 Energie

         Transport                                    ...       ...      ...        ...      ...      ...        ...        ...       ...                               Transport


                                                       IV AGRICULTURAL PRODUCTION - PRODUCTION AGRICOLE

                                                   2002     2003      2004      2005      2006     2007     2008       2009       2010
         Tons (Thousand)                                                                                                                                  Tonnes (milliers)
         Plantains, Tons (thousands)               2 785    2 408     2 470      2 593    2 653    2 686      2 604     2 600         ...             Plantains, tonnes (milliers)

         Potato, Tons (thousands)                  1 039    1 100     1 073      1 314    1 285      967      1 162     1 200         ...    Pommes de terre, tonnes (milliers)

         Sweet Potato, Tons (thousands)            1 292      868       908       886       777      841       826        850         ...       Patates douces, tonnes (milliers)

         Cassava, Tons (thousands)                 1 031    1 003       766       782       765      779       979        980         ...               Manioc, tonnes (milliers)
         Pumpkins, squash and gourds, Tons                                                                                                        Citrouilles, squash et gourdes,
                                                     210      210       210       210       215      215       215          ...       ...
         (thousands)                                                                                                                                              tonnes (milliers)


                                                            V MINING PRODUCTION - PRODUCTION MINIERE
272
                                                   2002     2003      2004      2005      2006     2007     2008       2009       2010


         Natural gaz (terajoules)                   54.0     32.0       4.0       12.0     20.0     23.0       24.0      24.0         ...                Gaz naturel (térajoules)

         Gold ores and concentrates                 10.0     10.0      10.0        2.0       ...      ...        ...        ...       ...            Minerais d'or et concentrés
         (Kilogrammes)                                                                                                                                            (Kilogrammes)
         Tin ores and concentrates, metric                                                                                                        Minerais d'étain et concentrés,
                                                     0.0      0.0       0.0        0.0      0.0      5.0        4.0       5.0         ...
         tons (thousands)                                                                                                                            tonnes métriques (milliers)


                                                                               VI ENERGY - ENERGIE

                                                   2002     2003      2004      2005      2006     2007     2008       2009       2010

         Electricity - total hydro production,                                                                                               Électricité - production hydraulique
                                                    98.0    117.6      84.3       60.7     41.3     33.7         ...        ...       ...
         kilowatt hours (millions)                                                                                                              totale, kilowatt-heures (millions)

         Electricity - total thermal production,                                                                                               Électricité - production thermique
                                                     2.0      2.0       8.3       52.1    129.4    135.2         ...        ...       ...
         kilowatt hours (millions)                                                                                                              totale, kilowatt-heures (millions)

         Electricity - total production, self-                                                                                              Electricité - Production totale privée
                                                       2         2        2          2        2        2         ...        ...       ...
         producer (Million Kilowatt Hours)                                                                                                            (million de kilowatt heures)

         Electricity - total production, public                                                                                                    Electricité - Production totale
                                                      98      118        91       111       169      167         ...        ...       ...
         (Million Kilowatt Hours)                                                                                                           publique (million de kilowatt heures)


      African Statistical Yearbook 2011 / Annuaire Statistique pour l'Afrique 2011
Rwanda                                                                                                                                                                   Rwanda
                                         VII TOURISM AND INFRASTRUCTURE - TOURISME ET INFRASTUCTURE

                                          2002       2003        2004        2005        2006         2007       2008        2009        2010

Arrivals - Tourists (thousands)                ...         ...         ...         ...        ...          ...         ...         ...         ...           Arrivées - touristes (milliers)

Rooms in hotels and similar                                                                                                                        Chambres d'hotels et établissements
establishments (thousands)                     ...         ...         ...         ...        ...          ...         ...         ...         ...                  assimilés (milliers)

Paved Road (% of total)                        ...         ...        19           ...        ...          ...         ...         ...         ...        Routes asphaltées (% du total)
Total Network (Railways-km)                    ...         ...         ...         ...        ...          ...         ...         ...         ...         Réseau total voies ferrées-Km
Main Telephone Lines (per 1,000                                                                                                                          Lignes téléphoniques fixes (pour
                                                3           3           3           3          3            2           2          ...         ...
inhabitants)                                                                                                                                                             1000 habitants)
Mobile Cellular Subscribers (per                                                                                                                         Abonnés aux téléphones mobiles
                                              10          20          20          20         30           70         140         240           ...
1,000 inhabitants)                                                                                                                                                (pour 1000 habitants)


                          VII FINANCIAL AND MONETARY STATISTICS - FINANCES ET STATISTIQUES MONETAIRES

                                          2002       2003        2004        2005        2006         2007       2008        2009        2010

VII-1 Monetary Statistics                                                                                                                       VII-1 Statistiques monétaires
Rwandan Franc (Millions)                                                                                                                                Franc Rwandais(Millions)
Money supply (M1)                         70 373      82 305      99 941     129 326          ...          ...         ...         ...         ...                 Masse monétaire (M1)
Quasi-money                               72 621      82 727     114 621     123 751          ...          ...         ...         ...         ...                         Quasi-monnaie
  of which Demand Deposit                      ...         ...         ...         ...        ...          ...         ...         ...         ...              dont Monnaie scripturale
Net foreign assets                        93 745      90 680     160 423     211 253          ...          ...         ...         ...         ...                  Avoirs extérieurs nets
Domestic credit                           91 816     122 615     113 785     115 815          ...          ...         ...         ...         ...                         Crédit intérieur

of which claims on private sector         84 997      96 963     130 323     161 352          ...          ...         ...         ...         ...     dont créances sur le secteur privé

of which Claims on government                                                                                                                                 dont créances nettes sur le
                                           2 623      20 224     - 22 796    - 49 847         ...          ...         ...         ...         ...
sector, net                                                                                                                                                               gouvernement
International reserves (millions of US                                                                                                               Réserves internationales (millions de
                                             244         215         315         406        440          553         596         743         813
$)                                                                                                                                                                                   $ EU)
Average Exchange Rate (National                                                                                                                       Taux de change (moyen) (monnaie
                                          475.37      537.66      577.45      557.82      551.71      546.96      546.85      568.28      583.13
Currency per us $)                                                                                                                                                nationale par dollars)


VII-2 Public Finance                                                                                                                                     VII-2 Finances publiques
Rwandan Franc (Millions)                                                                                                                                Franc Rwandais(Millions)
Total Revenues and Grants                148 159     195 100     272 500     344 800     374 700     443 450     623 800     735 750     662 587                 Recettes totales et dons
  Tax Revenue                             79 515     114 300     134 600     162 600     191 000     237 800     328 700     368 900           ...                       Recettes fiscales
  Non Tax Revenue                          6 691       7 700      12 400      17 700      14 600      14 300      52 300      33 350           ...                  Recettes non fiscales
  Grants                                  61 953      73 100     125 500     164 500     169 100     191 350     242 800     333 500           ...                                   Dons      273
Total Expenditures and Net Lending       158 064     216 200     275 000     340 700     383 700     491 600     639 100     801 050     675 411           Dépenses totales et prêts nets

  Current expenditure                     86 043     129 900     114 500     151 000     176 400     198 700     225 400     256 750           ...                   Dépenses courantes
  Of which Wages and Salaries             38 942      44 000      48 600      51 200      62 200      73 800      84 200      98 850           ...         Dont rémunérations et salaires
  Capital expenditure                     50 024      51 100      89 500     121 400     118 700     186 300     267 800     311 650           ...               Dépenses d'équipement
  Net Lending                                628       4 000      21 600       4 400       9 600      - 8 100      2 900      74 000           ...                              Prêts nets
Fiscal Balance                            - 9 905    - 21 100     - 2 500      4 100     - 9 000     - 48 150    - 15 300    - 65 300    - 12 824         Solde global y compris les dons


VII-3 Balance of Payments                                                                                                                            VII-3 Balance des paiements
US $ (Millions)                                                                                                                                                       $ E.U(Millions)
Trade balance                              - 141       - 170       - 185       - 247       - 310       - 404       - 688       - 832       - 838                    Balance commerciale
Services Balance                           - 142       - 143       - 157       - 167       - 206       - 123        - 81       - 179            9                    Balance des services
Net Income                                  - 19        - 31        - 34        - 27        - 29        - 17        - 35        - 37        - 31                             Revenus nets
Current transfers, net total                 147         224         313         365        326          461         519         604         560                      Transferts courants
Current account balance                    - 155       - 120        - 63        - 76       - 220        - 84       - 285       - 444       - 299                Solde du compte courant


VII-4 External Debt and Financial Flows                                                                                             VII-4 Dette extérieure et flux financiers
US $ (Millions)                                                                                                                                                       $ E.U (Millions)
Total external debt                        1 477       1 572       1 683       1 511        486          574         677         749         912                   Dette extérieure totale
  Private                                       0           0           0           0          0            0           0           0           0                                   Privée
  Public                                   1 477       1 572       1 683       1 511        486          574         677         749         912                                 Publique
Total external debt service                     8         13          23          31         91           10            9         10          19            Service de la dette extérieure
Net Foreign Direct Investment                                                                                                                        Investissements étranger direct (flux
                                                2           3         11          14         31           82         103         119           ...
Inflows                                                                                                                                                                    nets entrants)
Net Total Official Development                                                                                                                          Aide publique au développement
                                             363         335         490         577        589          722         933         934           ...
assistance                                                                                                                                                                 (nette totale)


                                                                                                African Statistical Yearbook 2011 / Annuaire Statistique pour l'Afrique 2011
Rwanda                                                                                                                                   Rwanda

                                                 2002    2003    2004     2005       2006    2007    2008    2009     2010

         US $ (Millions)                                                                                                                     Franc Rwandais
         Exports, fob                                                                                                                      Exportations, fàb


         Exports - Total                            68      63      98       125       144     159     211      ...      ...                  Exportations - Total


         Main Products                                                                                                                      Principaux produits


         Coffee                                     15      15      32        38        54      37      46      ...      ...                                   Café


         Tea                                        22      23      22        24        32      32      40      ...      ...                                   Thé


         Coltan                                     14       6      13        17        11      19      50      ...      ...                                 Coltan


         Cassiterite (Tins)                          1       5      16        18        16      32      55      ...      ...               Cassitérite (conserves)


                                                     1       0       0         3        10      19      12      ...      ...

         Main Destinations                                                                                                            Principales destinations

         Indonesia                                59.0    66.1   271.7        0.0      0.1     0.0     0.1     0.0       ...                             Indonésie


         China                                     5.2     7.1    16.0       11.5     21.9    23.6    29.6    25.7       ...                                 Chine


         Germany                                   4.9     8.1    11.6       18.6     20.8    18.0    23.5    16.8       ...                            Allemagne


         United States                             3.3     2.9     5.8        6.7      9.3    13.2    14.3    19.8       ...                             États-Unis


         Hong Kong, China                         10.1     4.2     3.6        4.6      0.5    12.7     7.4    10.1       ...                    Hong Kong, Chine


                                                 2002    2003    2004     2005       2006    2007    2008    2009     2010
         Imports, cif                                                                                                                       Importations, cif

274      Imports - Total                           303     370     443       524       623     802   1 146     967       ...       Importations - Total (millions)


                                                                                                                                            Principaux produits
         Main Products


         Wheat or meslin flour                       2       1       5         3         2       7      76       2       ...                     Blé nda et méteil


         Portland cement nes                         0       1       0         0         0       4      30      35       ...                 Ciment Portland NDA


         Electrical apparatus for line                                                                                               Appareils électriques pour la
                                                     0       2       2         8         5       2       7      23       ...
         telephony/telegraphy nes                                                                                                     téléphonie/télégraphie NDA
         Transmission apparatus,for                                                                                            Appareils de transmission, pour les
         radioteleph incorporatg reception           5       2       1         6         2       7      18      18       ...    appareils de réception radioteleph
         apparatus                                                                                                                                     incorporatg

         Apparatus for carrier-current/digital                                                                                        Appareils pour systèmes de
                                                     0       0       0         1         1       6      17       8       ...
         line systems                                                                                                           canalisation carrier-current/digital


         Main Origin                                                                                                                  Principales provenances

         Kenya                                    39.9    79.8    81.8       96.4     66.1    86.2   130.4   123.4       ...                                 Kenya

         Uganda                                   12.9    20.8    24.7       36.1     30.5    83.3   136.9   135.3       ...                              Ouganda

         United Arab Emirates                      3.1     3.7     5.0       13.1    116.2    99.4   134.0    90.9       ...                  Émirats arabes unis

         Belgium                                  23.0    22.0    29.2       28.3     28.2    43.0    54.8    49.4       ...                              Belgique

         Germany                                  17.4    24.3    32.1       26.7     44.5    43.3    45.4    45.9       ...                            Allemagne


      African Statistical Yearbook 2011 / Annuaire Statistique pour l'Afrique 2011
Sao Tome and Principe                                                                                                           Sao Tomé-et-Principe

AREA (KM 2)                                                                              964                                                            SUPERFICIE (KM 2)
CAPITAL CITY                             Sao Tome                                                                       Sao Tomé                                    CAPITALE
CURRENCY                                 Dobra                                                                             Dobra                                    MONNAIE


                        I SOCIAL AND DEMOGRAPHIC INDICATORS — INDICATEURS DEMOGRAPHIQUES ET SOCIAUX

                                           2002      2003      2004      2005      2006        2007       2008      2009       2010
Population                                                                                                                                                       Population
                                                                                                                                             Population au milieu de l'année -
Mid-year population - Total (Million)         0.1       0.1       0.2       0.2       0.2         0.2        0.2       0.2        0.2
                                                                                                                                                                Total (million)
                                                                                                                                             Population au milieu de l'année -
Mid-year population - Urban (%)              55.3      56.3      57.2      58.1      58.9        59.8       60.6      61.4       62.2
                                                                                                                                                                Urbaine (%)

Female (%)                                   50.4      50.4      50.4      50.4      50.5        50.5       50.5      50.5       50.5                              Femme (%)


Population by Age Group                                                                                                                          Population par groupe d'âge


   0-14                                    60 713    61 654    62 595    63 464    64 245      64 954     65 589    66 165     66 685                                      0-14


   15-64                                   78 009    79 435    80 899    82 477    84 195      86 044     88 018    90 110     92 308                                     15-64


   65+                                      6 384     6 522     6 624     6 681     6 686       6 639      6 567     6 480      6 404                                      65+


Active Population (000)                      48.8      50.0      51.2      52.5      53.8        55.1       56.4      57.8       59.2                  Population active (000)

   Female (%)                                37.3      37.3      37.4      37.4      37.5        37.7       37.9      38.0       38.1                              Femme (%)

                                                                                                                                            Taux brut de natalité - Total (par
Crude birth rate - Total (per 1000)          35.0      35.0      34.0      34.0      33.0        33.0       32.0      32.0         ...
                                                                                                                                                                        1000)
                                                                                                                                          Taux brut de mortalité - Total (par
Crude death rate - Total (per 1000)           8.0       8.0       8.0       8.0       7.0         7.0        7.0       7.0         ...
                                                                                                                                                                       1000)
Life expectancy at birth - Total                                                                                                            Espérance de vie à la naissance -
                                             64.0      65.0      65.0      66.0      66.0        66.0       67.0      67.0         ...
(years)                                                                                                                                                       Total (années)
Net reproduction rate - (per                                                                                                                 Taux net de reproduction - (par
                                               ...       ...       ...       ...      2.0          ...        ...       ...       2.0
woman)                                                                                                                                                               femme)
                                                                                                                                            Indice synthétique de fécondité -
Total fertility rate - (p woman)
              y        (per    )              2.0       2.0       2.0       2.0       2.0         2.0        2.0       2.0         ...
                                                                                                                                                                (par femme)

Education                                                                                                                                                   Enseignement

Teaching staff at first level - Total                                                                                                     Personnel enseignant - 1er degré -
                                             0.87       0.7       1.0       1.0       1.0         1.0        0.9       0.9         ...
(thousands)                                                                                                                                                  Total (milliers)
Teaching staff at second level - Total                                                                                                   Personnel enseignant - 2ème degré -
                                               ...       ...      0.5       0.5        ...        0.6        0.2       0.2         ...                                              275
(thousands)                                                                                                                                                   Total (milliers)
Teaching staff at third level - Total                                                                                                  Personnel enseignant - 3ème degré -
                                              0.1       0.1       0.1       0.1        ...        0.1        0.0       0.0         ...
(thousands)                                                                                                                                                 Total (milliers)
First level student enrollment - Total                                                                                                      Elèves inscrits - 1er degré - Total
                                              27        27        28        29        31           31        33         34         ...
(thousands)                                                                                                                                                           (milliers)
First level student enrollment -                                                                                                         Elèves inscrits - 1er degré - Femmes
                                              14        14        15        15        15           15        16         17         ...
Female (thousands)                                                                                                                                                     (milliers)
Second level student enrollment -                                                                                                         Elèves inscrits - 2ème degré - Total
                                                6         5        6         7         8            8         7          8         ...
Total (thousands)                                                                                                                                                    (milliers)
Second level student enrollment -                                                                                                               Elèves inscrits - 2ème degré -
                                               ...        4        4         4          4           5         4          5         ...
Female (thousands)                                                                                                                                          Femmes (milliers)
Third level student enrollment - Total                                                                                                    Elèves inscrits - 3ème degré - Total
                                               ...       ...       ...       ...       ...         ...        ...      0.7         ...
(thousands)                                                                                                                                                          (milliers)
Third level student enrollment -                                                                                                                Elèves inscrits - 3ème degré -
                                               ...       ...       ...       ...       ...         ...        ...      0.3         ...
Female (thousands)                                                                                                                                          Femmes (milliers)
Public expenditure on education (%                                                                                                          Dépenses publiques consacrées à
                                              3.2       3.5       1.7       1.6       2.3         2.2        2.3        ...        ...
of budget)                                                                                                                                    l'enseignement (% du budget)

Health                                                                                                                                                                  Santé

Hospital beds - Total (per 10 000                                                                                                           Nombre de lits d'hôpitaux - Total
                                                2        2         2         2         2            2         2          2         ...
population)                                                                                                                                                    (pour 10 000)
Nurses - Total (per 10 000                                                                                                                 Nombre d'infirmières - Total (pour
                                              11        11        11        11        11           11        11         11         ...
population)                                                                                                                                                          10 000)
Physicians - Total (per 10 000                                                                                                             Nombre de médecins - Total (pour
                                                4         5        5         4         4            5         4          4         ...
population)                                                                                                                                                        10 000)
Public expenditure on Health (% of                                                                                                       Dépenses publiques consacrées à la
                                              13        14         7         7         5            5         5         ...        ...
budget)                                                                                                                                               santé (% du budget)


                                                                                         African Statistical Yearbook 2011 / Annuaire Statistique pour l'Afrique 2011
Sao Tome and Principe                                                                                                                          Sao Tomé-et-Principe
                                                               II NATIONAL ACCOUNTS — COMPTES NATIONAUX

                                                  2002        2003          2004         2005         2006         2007         2008         2009       2010

          Gross domestic product by kind of economic activity at current prices
                                                                                                          Produit intérieur brut par branche d'activité économique aux prix courants


          Dobra (Millions)                                                                                                                                                      Dobra(Millions)

          Agriculture                             162 773     193 580      210 970      235 900      274 142      334 984      463 051            ...      ...                            Agriculture

          Mining and quarrying                      2 864       4 097        5 139        5 280        8 832       11 475       14 569            ...      ...                 Industries extractives

          Manufacturing                            61 203      70 883       76 755       87 050      106 064      122 349      207 848            ...      ...            Industries manufacturières

          Electricity, gas & water                 13 841      18 133       22 347       28 968       36 887       43 271       69 317            ...      ...                 Electricité, gaz et eau

          Construction                             49 359      60 699       76 308       84 228      127 537      157 334      191 059            ...      ...          Bâtiments et travaux publics
          Wholesale & retail trade,                                                                                                                                  Commerce de gros et de détail,
                                                  200 159     241 242      261 817      318 012      399 211      473 280      651 152            ...      ...
          restaurants, hotels                                                                                                                                                 restaurants et hôtels
                                                                                                                                                                      Banques, assurances, affaires
          Finance, insurance, real estate, etc.    48 378      83 343      107 718      139 087      195 547      265 650      371 091            ...      ...
                                                                                                                                                                                      immobilières
          Transport and communications             98 354     121 356      155 352      184 993      245 955      289 813      350 550            ...      ...      Transport(s) et communications
                                                                                                                                                                        Administrations publiques et
          Public administration and defense        39 354      52 740       73 164      104 913      116 811      107 004      123 065            ...      ...
                                                                                                                                                                                            défense
          Other services                           44 754      51 110       56 801       69 158       83 999      103 879      125 719            ...      ...                        Autres services
                                                                                                                                                                     Moins Services d’intermédiation
          Less Imputed Service Charges            - 13 037    - 27 339     - 42 349     - 65 030     - 89 479    - 130 555    - 186 501           ...      ...
                                                                                                                                                                                           financière
          Gross domestic product at factor                                                                                                                       Produit intérieur brut aux couts des
                                                  708 002     869 843     1 004 023    1 192 558    1 505 506    1 778 482    2 380 920           ...      ...
          cost / basic prices                                                                                                                                                  facteurs / prix de base

          Plus: Indirect Taxes / taxes on                                                                                                                        Plus taxes indirectes/impôts sur les
                                                   66 761      79 278       96 637      121 322      184 169      213 614      283 882            ...      ...
          products, less subsidies                                                                                                                                   produits, moins les subventions


          Expenditure on Gross domestic product at current purchaser's values
                                                                                                                      Emploi du produit intérieur brut aux prix courants d'acquisition

          Dobra (Millions)                                                                                                                                                      Dobra(Millions)
                                                                                                                                                                           Consommation finale des
          Government final consumption            293 051     433 906      619 913      561 090      819 873      874 206     1 104 289    1 301 665       ...
                                                                                                                                                                           administrations publiques

          Private final consumption               622 009     703 199      738 597     1 116 334    1 288 425    1 600 056    2 231 744    2 877 626       ...           Consommation finale privée

          Gross fixed capital formation           257 775     357 851      410 375      472 832     1 132 820    1 366 350    1 812 586    2 195 910       ...        Formation brute de capital fixe

          Increase in inventories                       ...         ...          ...          ...          ...          ...          ...          ...      ...                   Variation des stocks

          Exports of goods and services           272 176     347 268      363 729      406 855      507 848      564 868      724 689      855 962        ...     Exportations de biens et services
276                                                                                                                                                                   Moins importations de biens et
          Less imports of goods and services      670 246     893 103     1 031 954    1 243 232    2 059 291    2 413 385    3 208 506    3 850 250       ...
                                                                                                                                                                                            services
          GDP at purchasers' values               774 764     949 121     1 100 660    1 313 880    1 689 675    1 992 096    2 664 801    3 380 913       ...             PIB aux prix d'acquisition


          Gross domestic product by kind of economic activity at constant
                                                                                                        Produit intérieur brut par branche d'activité economique aux prix constants
          prices
          Annual Growth Rates (%)                                                                                                                         Taux de croissance annuel (%)
          Agriculture                                  0.0         2.5          1.7          3.3          1.3          7.0          7.1           ...      ...                            Agriculture

          Mining and quarrying                       -19.2       10.5           8.8        -12.7         35.2          2.0        -14.2           ...      ...                 Industries extractives

          Manufacturing                                4.5         3.4          2.7          3.6          5.4          2.9          4.5           ...      ...            Industries manufacturières

          Electricity, gas & water                   17.0        10.0           6.2         10.5         11.8          1.7          8.5           ...      ...                 Electricité, gaz et eau

          Construction                               -23.1         9.8          8.8        -13.5         31.6         -0.5        -16.1           ...      ...          Bâtiments et travaux publics
          Wholesale & retail trade,                                                                                                                                         Commerce de gros et de
                                                       5.9         7.4          1.7          4.3          5.5          2.8          6.0           ...      ...
          restaurants, hotels                                                                                                                                             détail,restaurants et hôtels
                                                                                                                                                                       Banques, assurances, affaires
          Finance, insurance, real estate, etc.        2.5         4.9          2.4          1.1          6.6          2.0          3.3           ...      ...
                                                                                                                                                                                       immobilières
          Transport and communications               17.4        11.1          11.1         10.0          9.8          1.5          4.6           ...      ...      Transport(s) et communications
                                                                                                                                                                        Administrations publiques et
          Public administartion and defense            1.1       12.7           7.5          4.3         -0.3          8.7          4.9           ...      ...
                                                                                                                                                                                            défense
          Other services                               3.4         4.3         -0.4          7.9          4.2          6.1          5.1           ...      ...                        Autres services
                                                                                                                                                                     Moins Services d’intérmediation
          Less Imputed Service Charges                 0.2      109.9          50.1         48.5         11.8         23.1          8.2           ...      ...
                                                                                                                                                                                           financière
          Gross domestic product at factor                                                                                                                       Produit intérieur brut aux couts des
                                                       2.5         4.9          2.4          1.1          6.6          2.0          3.3                    ...
          cost / basic prices                                                                                                                                                  facteurs / prix de base

          Plus: Indirect Taxes / taxes on                                                                                                                        Plus taxes indirectes/impôts sur les
                                                     17.9        14.6          22.6         22.6         43.2         19.9         19.7           ...      ...
          products, less subsidies                                                                                                                                   produits, moins les subventions

          Gross domestic product at market                                                                                                                         Produit intérieur brut aux prix du
                                                       3.6         5.8          4.3          3.5         11.4          5.0          6.5           ...      ...
          prices                                                                                                                                                                              marché


           2009: Provisional                                                                                                                                                      2009: provisoire


      African Statistical Yearbook 2011 / Annuaire Statistique pour l'Afrique 2011
Sao Tome and Principe                                                                                                        Sao Tomé-et-Principe

Expenditure on Gross domestic product at constant purchasers'
                                                                                             Emplois du produit intérieur brut aux prix constants d'acquisition
values

Annual Growth Rates (%)                                                                                                        Taux de croissance annuel (%)
                                                                                                                                                 Consommation finale des
Government final consumption               -19.8     22.4     26.2      -19.5     23.3         -4.9       3.9       3.9         ...
                                                                                                                                                 administrations publiques

Private final consumption                   8.7      -1.1     -4.2       28.0      1.2        10.1       10.0       8.5         ...            Consommation finale privée

Gross fixed capital formation               -5.5     15.4      1.3        2.5    102.1         7.5        9.2       6.8         ...        Formation brute de capital fixe

Exports of goods and services               6.8       5.4     -7.0       -1.0      5.3         -0.8       5.6       4.1         ...      Exportations de biens et services

                                                                                                                                           Moins importations de biens et
Less imports of goods and services          -6.6     10.1      2.1        7.2     39.8         4.5        9.4       5.8         ...
                                                                                                                                                                 services


                                                                         III INFLATION

                                          2002      2003     2004      2005      2006       2007       2008      2009       2010
Annual Growth Rates (%)                                                                                                        Taux de croissance annuel (%)
All Item                                    9.0       9.9     15.2       17.2     24.6        27.6       24.8      16.1       12.3                               Ensemble

Food                                       12.0       8.9     17.3       19.9     26.9        38.3       28.9      20.6         ...                           Alimentation

Health                                      9.1      15.8      6.6        0.5      4.4         3.5       17.6       9.5         ...                                  Santé

Energy                                      -2.6     19.1     11.1       20.9      6.5        10.2       47.4       -6.2        ...                                 Energie

Transport                                   0.4      23.5     41.9       11.5     20.9        13.8       -6.8       2.1         ...                              Transport


                                               IV AGRICULTURAL PRODUCTION - PRODUCTION AGRICOLE

                                          2002      2003     2004      2005      2006       2007       2008      2009       2010
Tons (Thousand)                                                                                                                                     Tonnes (milliers)
Maize (Tons)                                  3        3        3          3        3            3         3          ...       ...                              Maïs (ton)

Cassava (Tons)                                6        6        6          6        6            7         7          ...       ...                           Manioc (ton)

Coconuts (Tons)                              26       27       27         27       28           28        28          ...       ...                             Coco (ton)

Banana (Tons)                                27       27       25         29       32           32        32          ...       ...                           Banane (ton)

Taro (Tons)                                  26       26       26         26       27           28        28          ...       ...                            Tarau (ton)


                                                    V MINING PRODUCTION - PRODUCTION MINIERE
                                                                                                                                                                               277
                                          2002      2003     2004      2005      2006       2007       2008      2009       2010


                                              ...      ...      ...        ...      ...          ...       ...        ...       ...

                                              ...      ...      ...        ...      ...          ...       ...        ...       ...


                                              ...      ...      ...        ...      ...          ...       ...        ...       ...


                                                                      VI ENERGY - ENERGIE

                                          2002      2003     2004      2005      2006       2007       2008      2009       2010

Electricity - total hydro production,                                                                                                  Électricité - production hydraulique
                                           25.4      26.6     31.1       37.2     38.8        39.2       37.2      42.2         ...
kilowatt hours (millions)                                                                                                                 totale, kilowatt-heures (millions)

Electricity - total thermal production,                                                                                                  Électricité - production thermique
                                            6.1       7.9      6.2        4.2      7.5         7.6        4.2       7.3         ...
kilowatt hours (millions)                                                                                                                 totale, kilowatt-heures (millions)

Electricity - total production, self-                                                                                                 Electricité - Production totale privée
                                              ...      ...      ...        ...      ...          ...       ...        ...       ...
producer (Million Kilowatt Hours)                                                                                                               (million de kilowatt heures)

Electricity - total production, public                                                                                                       Electricité - Production totale
                                             32       35       37         41       46           47        41         49         ...
(Million Kilowatt Hours)                                                                                                              publique (million de kilowatt heures)


                                                                                      African Statistical Yearbook 2011 / Annuaire Statistique pour l'Afrique 2011
Sao Tome and Principe                                                                                                                              Sao Tomé-et-Principe
                                                  VII TOURISM AND INFRASTRUCTURE - TOURISME ET INFRASTUCTURE

                                                   2002        2003         2004         2005         2006         2007         2008         2009         2010

         Arrivals - Tourists (thousands)                9       9.609       10.576       15.746       12.266       11.815       14.456          15.2           ...           Arrivées - touristes (milliers)

         Rooms in hotels and similar                                                                                                                               Chambres d'hotels et établissements
         establishments (thousands)                 0.495       0.492        0.492        0.413            ...          ...          ...          ...          ...                  assimilés (milliers)

         Paved Road (% of total)                       89          84           82           78           75           75           76           75            ...        Routes asphaltées (% du total)
         Total Network (Railways-km)                  350         400          430          480          530          545          555          600            ...         Réseau total voies ferrées-Km
         Main Telephone Lines (per 1,000                                                                                                                                 Lignes téléphoniques fixes (pour
                                                       40          50           50           50           50           50           50           50            ...
         inhabitants)                                                                                                                                                                    1000 habitants)
         Mobile Cellular Subscribers (per                                                                                                                                Abonnés aux téléphones mobiles
                                                       10          30           50           80          120          190          310          390            ...
         1,000 inhabitants)                                                                                                                                                       (pour 1000 habitants)


                                   VII FINANCIAL AND MONETARY STATISTICS - FINANCES ET STATISTIQUES MONETAIRES

                                                   2002        2003         2004         2005         2006         2007         2008         2009         2010

         VII-1 Monetary Statistics                                                                                                                              VII-1 Statistiques monétaires
         Dobra (Millions)                                                                                                                                                            Dobra(Millions)
         Money supply (M1)                        176 729     274 992      267 816      343 521      453 076      614 035      837 601      867 120      989 162                   Masse monétaire (M1)
         Quasi-money                               15 192      20 231       30 413       89 988      116 776      151 165      209 703      266 164      326 566                           Quasi-monnaie
           of which Demand Deposit                      ...         ...          ...          ...          ...          ...          ...          ...          ...              dont Monnaie scripturale
         Net foreign assets                       256 720     300 001      268 678      813 220      737 513     1 029 500    1 417 830    1 278 630    1 304 920                   Avoirs extérieurs nets
         Domestic credit                           31 669     114 734      210 051       56 902      353 080      459 993      333 622      809 573     1 366 310                          Crédit intérieur

         of which claims on private sector         43 958      95 777      176 103      320 246      464 243      621 697      763 303     1 063 450    1 484 120      dont créances sur le secteur privé

         of which Claims on government                                                                                                                                        dont créances nettes sur le
                                                  - 12 288     18 957       33 948     - 263 344    - 123 394    - 178 056    - 449 995    - 280 124    - 201 691
         sector, net                                                                                                                                                                      gouvernement
         International reserves (millions of US                                                                                                                      Réserves internationales (millions de
                                                       17          25           20           27           34           39            ...          ...          ...
         $)                                                                                                                                                                                          $ EU)
         Average Exchange Rate (National                                                                                                                              Taux de change (moyen) (monnaie
                                                  9 088.33    9 347.58    9 902.32     10 558.00    12 448.60    13 536.80    14 695.20    16 208.50    18 498.60
         Currency per us $)                                                                                                                                                       nationale par dollars)


         VII-2 Public Finance                                                                                                                                            VII-2 Finances publiques
         Dobra (Millions)                                                                                                                                                            Dobra(Millions)
         Total Revenues and Grants                245 052     244 727      367 520      411 766      570 100      582 421      822 565      962 810     1 278 000                Recettes totales et dons
           Tax Revenue                             94 952     114 166      147 327      180 012      266 561      319 979      411 406      472 960      578 000                         Recettes fiscales
           Non Tax Revenue                         18 449      26 224       40 327       27 356       56 949       53 561       39 666       55 906       91 000                    Recettes non fiscales
278        Grants                                 131 651     104 337      179 865      204 398      246 591      208 881      371 493      433 944      609 000                                     Dons

         Total Expenditures and Net Lending       297 317     280 376      543 578      542 619      800 912      858 119     1 148 299    1 909 053    1 638 000          Dépenses totales et prêts nets

           Current expenditure                    110 723     155 219      246 517      314 517      419 597      479 299      548 445      642 040      698 000                     Dépenses courantes
           Of which Wages and Salaries             43 569      54 963       75 743      103 203      133 028      174 344      219 099      252 090      308 000           Dont rémunérations et salaires
           Capital expenditure                    165 576     107 815      260 175      214 298      320 132      341 406      493 438      932 338      940 000                 Dépenses d'équipement
           Net Lending                             21 018      17 343       36 886       13 803       61 183       37 414      106 416      334 675            ...                              Prêts nets
         Fiscal Balance                           - 52 265    - 35 649    - 176 058    - 130 852    - 230 812    - 275 698    - 325 734    - 946 243    - 360 000         Solde global y compris les dons


         VII-3 Balance of Payments                                                                                                                                   VII-3 Balance des paiements
         US $ (Millions)                                                                                                                                                              $ E.U(Millions)
         Trade balance                               - 22        - 25         - 30         - 35         - 51         - 60         - 82         - 70          - 87                   Balance commerciale
         Services Balance                              - 9       - 10         - 10         - 10         - 20         - 18         - 14         - 13          - 22                    Balance des services
         Net Income                                    - 2         - 2         - 2           - 2            2            6            4            3            3                            Revenus nets
         Current transfers, net total                  17          23           25           35           33           17           25           31           46                      Transferts courants
         Current account balance                     - 15        - 14         - 18         - 12         - 36         - 56         - 66         - 49          - 60               Solde du compte courant


         VII-4 External Debt and Financial Flows                                                                                                   VII-4 Dette extérieure et flux financiers
         US $ (Millions)                                                                                                                                                              $ E.U (Millions)
         Total external debt                          301         314          325          316          360          150          110          124          144                   Dette extérieure totale
           Private                                      0           0            0            0           35             0            0            0            0                                   Privée
           Public                                     301         314          325          316          324          150          110          124          144                                 Publique
         Total external debt service                    9          10           11           12             5            1            1            2            6           Service de la dette extérieure
         Net Foreign Direct Investment                                                                                                                               Investissements étranger direct (flux
                                                        4           3            4           16           38           35           33           36            ...
         Inflows                                                                                                                                                                           nets entrants)
         Net Total Official Development                                                                                                                                 Aide publique au développement
                                                       26          38           34           32           23           36           47           31            ...
         assistance                                                                                                                                                                        (nette totale)


      African Statistical Yearbook 2011 / Annuaire Statistique pour l'Afrique 2011
Sao Tome and Principe                                                                                                                            Sao Tomé-et-Principe

                                         2002         2003         2004         2005         2006          2007         2008         2009       2010

Dobra (Millions)                                                                                                                                                                  Dobra
Exports, fob                                                                                                                                                       Exportations, fàb


Exports - Total                        4 623 218    6 210 607    3 204 804    3 112 016    3 410 093     5 875 297 10 135 544      7 383 834       ...                Exportations - Total


Main Products                                                                                                                                                      Principaux produits


Cocoa                                    41 845       57 737       31 590       31 918       42 190        47 741       74 715       88 976        ...                              Cacao


Coconut                                     321          380          829        1 120          441           310          377        1 407        ...                               Coco


Coconut oil                                 307          210          280        1 259          120           266          209          200        ...                       Huile de coco


Flowers and plants                          481        1 139       10 929       14 519        8 701         1 603          306          468        ...                   Fleurs et plantes


                                              ...          ...          ...          ...          ...           ...          ...          ...      ...

Main Destinations                                                                                                                                             Principales destinations

Netherlands                             27 236.2     24 006.0     18 153.2     13 844.3     12 982.5       6 993.2     23 307.2     27 078.6       ...                           Pays-Bas


Portugal                                 8 888.2     22 579.2      9 009.5     14 018.3     16 099.8      24 189.5     40 826.6     33 136.3       ...                            Portugal


Belgium                                  5 919.2      9 306.3      3 323.0      3 889.4      6 859.2       9 252.5      6 545.7     19 024.7       ...                            Belgique


Angola                                    966.0       1 016.7       631.0       1 442.2       729.6         658.6        791.4       1 125.4       ...                             Angola


France                                    369.0       2 396.9       854.2        664.6       4 562.8       9 130.7      5 666.9      2 646.2       ...                             France


                                         2002         2003         2004         2005         2006          2007         2008         2009       2010
Imports, cif                                                                                                                                                        Importations, cif

Imports - Total                       10 306 806 11 020 085 14 193 792 22 588 752 25 504 911            28 498 128 43 748 273 31 927 089           ...      Importations - Total (millions)   279

                                                                                                                                                                   Principaux produits
Main Products


Food products                            55 207       81 937       72 515      106 427      147 992       155 137      198 623      249 024        ...               Produits alimentaires


Agricultural products                    61 902       64 184       22 468       16 998      122 551       149 490       70 241       93 707        ...                  Produits agricoles


Machinery and electrical appliances      36 677       49 106       37 847       35 678       97 063       159 154      227 939      198 498        ...   Machines et appareils électriques


Freight Vehicules                        32 785       42 062       69 150       88 552       81 290        85 644      140 206      175 938        ...             Vehicules de transport


Fuel                                     34 364       41 267        3 364        3 078      179 190       220 340     1 644 438           ...      ...                          Carburant


Main Origin                                                                                                                                                   Principales provenances

Portugal                               169 654.9    241 517.0    249 193.0    299 021.0    572 445.0     742 611.1 1 027 939.3     945 502.8       ...                            Portugal

Germany                                       ...    39 382.8     64 113.2    107 078.0      3 707.4       2 607.2       377.7        847.2        ...                          Allemagne

Belgium                                 42 002.5     43 722.2     36 598.8     32 329.3     38 730.1      21 600.5     28 269.9     31 671.0       ...                            Belgique

Japan                                   19 697.9     24 129.3     24 968.9     37 408.8      6 123.0       2 805.9     13 396.5     73 236.7       ...                              Japon

Gabon                                    8 477.7      8 025.4      4 579.9      3 049.3      5 614.6      10 576.6     49 556.2     50 316.3       ...                              Gabon


                                                                                                    African Statistical Yearbook 2011 / Annuaire Statistique pour l'Afrique 2011
Senegal                                                                                                                                                                   Sénégal

         AREA (KM 2)                                                                                   196 722                                                              SUPERFICIE (KM 2)
         CAPITAL CITY                             Dakar                                                                                          Dakar                                  CAPITALE
         CURRENCY                                 CFA Franc                                                                                  Franc CFA                                  MONNAIE


                                 I SOCIAL AND DEMOGRAPHIC INDICATORS — INDICATEURS DEMOGRAPHIQUES ET SOCIAUX

                                                    2002        2003        2004        2005        2006         2007        2008        2009       2010
         Population                                                                                                                                                                  Population
                                                                                                                                                                 Population au milieu de l'année -
         Mid-year population - Total (Million)         10.0        10.3        10.6        10.9        11.2        11.5         11.8        12.2     12.5
                                                                                                                                                                                    Total (million)
                                                                                                                                                                 Population au milieu de l'année -
         Mid-year population - Urban (%)               40.8        45.7        46.0        46.2        46.4        46.6         46.8        47.0       ...
                                                                                                                                                                                    Urbaine (%)

         Female (%)                                    50.8        50.8        50.8        50.7        50.7        50.7         50.7        50.6     50.6                              Femme (%)


         Population by Age Group                                                                                                                                     Population par groupe d'âge


            0-14                                   4358 560    4455 160    4555 860    4661 340    4769 710    4879 780     4992 230    5105 876       ...                                     0-14


            15-64                                  5296 570    5477 000    5657 070    5839 990    6030 250    6230 440     6440 510    6653 480       ...                                    15-64


            65+                                     391 920     387 390     396 030     405 790     414 000     419 110      420 860     426 505       ...                                     65+


         Active Population (000)                    4 526.7     4 622.6     4 770.7     4 928.9     5 086.8      5 251.4     5 276.0     5 434.3       ...                 Population active (000)

            Female (%)                                 32.8        41.7        41.9        42.0        42.1        42.5         42.7        42.9       ...                             Femme (%)

                                                                                                                                                                Taux brut de natalité - Total (par
         Crude birth rate - Total (per 1000)           39.9        39.8        39.6        39.1        30.3        39.1         38.9        38.6       ...
                                                                                                                                                                                            1000)
                                                                                                                                                              Taux brut de mortalité - Total (par
         Crude death rate - Total (per 1000)           12.6        12.4        12.3        12.1        11.9        11.7         11.5        11.3       ...
                                                                                                                                                                                           1000)
         Life expectancy at birth - Total                                                                                                                       Espérance de vie à la naissance -
                                                       55.8        56.2        56.4        56.7        57.0        57.3         57.5        57.8       ...
         (years)                                                                                                                                                                  Total (années)
         Net reproduction rate - (per                                                                                                                            Taux net de reproduction - (par
                                                        2.1         2.1         2.1         2.0         2.0          2.0         2.0         2.0       ...
         woman)                                                                                                                                                                          femme)
                                                                                                                                                                Indice synthétique de fécondité -
         Total fertility rate - (p woman)
                       y        (per    )               5.3         5.3         5.2         5.1         5.1          5.0         5.0         4.9       ...
                                                                                                                                                                                    (par femme)

         Education                                                                                                                                                              Enseignement

         Teaching staff at first level - Total                                                                                                                Personnel enseignant - 1er degré -
                                                      28.84        29.2        31.7        34.7        37.8        46.0         46.8        47.7       ...
         (thousands)                                                                                                                                                             Total (milliers)
         Teaching staff at second level - Total                                                                                                              Personnel enseignant - 2ème degré -
                                                         ...         ...         ...         ...         ...          ...         ...         ...      ...
280      (thousands)                                                                                                                                                              Total (milliers)
         Teaching staff at third level - Total                                                                                                               Personnel enseignant - 3ème degré -
                                                         ...         ...        1.1         1.1          ...          ...         ...         ...      ...
         (thousands)                                                                                                                                                              Total (milliers)
         First level student enrollment - Total                                                                                                                 Elèves inscrits - 1er degré - Total
                                                      1 197       1 287       1 383       1 444       1 488       1 572        1 618       1 695       ...
         (thousands)                                                                                                                                                                      (milliers)
         First level student enrollment -                                                                                                                    Elèves inscrits - 1er degré - Femmes
                                                       564         612         667         702         733          780         812         863        ...
         Female (thousands)                                                                                                                                                                (milliers)
         Second level student enrollment -                                                                                                                    Elèves inscrits - 2ème degré - Total
                                                       289         311         360         401         443          499         558         688        ...
         Total (thousands)                                                                                                                                                               (milliers)
         Second level student enrollment -                                                                                                                          Elèves inscrits - 2ème degré -
                                                       115         126         150         170         190          215         244         316        ...
         Female (thousands)                                                                                                                                                     Femmes (milliers)
         Third level student enrollment - Total                                                                                                               Elèves inscrits - 3ème degré - Total
                                                         ...       31.2        37.2        42.4        62.5        78.3         91.4        94.2       ...
         (thousands)                                                                                                                                                                     (milliers)
         Third level student enrollment -                                                                                                                           Elèves inscrits - 3ème degré -
                                                         ...         ...         ...         ...       30.5        31.3         31.0        34.8       ...
         Female (thousands)                                                                                                                                                     Femmes (milliers)
         Public expenditure on education (%                                                                                                                     Dépenses publiques consacrées à
                                                       16.0        16.5        17.7        19.3        17.5        23.0         24.0        26.0       ...
         of budget)                                                                                                                                               l'enseignement (% du budget)

         Health                                                                                                                                                                             Santé

         Hospital beds - Total (per 10 000                                                                                                                      Nombre de lits d'hôpitaux - Total
                                                         ...         ...         ...         ...        13           14          15          14        ...
         population)                                                                                                                                                               (pour 10 000)
         Nurses - Total (per 10 000                                                                                                                            Nombre d'infirmières - Total (pour
                                                         ...         ...        29           1           1            1            1           1       ...
         population)                                                                                                                                                                     10 000)
         Physicians - Total (per 10 000                                                                                                                        Nombre de médecins - Total (pour
                                                         ...         ...          5           0          0            0            0           0       ...
         population)                                                                                                                                                                   10 000)
         Public expenditure on Health (% of                                                                                                                  Dépenses publiques consacrées à la
                                                          7          8           8           8           5            6           6           ...      ...
         budget)                                                                                                                                                          santé (% du budget)


      African Statistical Yearbook 2011 / Annuaire Statistique pour l'Afrique 2011
Senegal                                                                                                                                                                       Sénégal
                                                           II NATIONAL ACCOUNTS — COMPTES NATIONAUX

                                           2002           2003        2004        2005        2006         2007        2008        2009        2010

Gross domestic product by kind of economic activity at current prices
                                                                                                  Produit intérieur brut par branche d'activité économique aux prix courants


CFA Franc (Millions)                                                                                                                                               Franc CFA (Millions)

Agriculture                               506 306        602 445     581 406     671 061     633 103      642 640     818 743     886 578           ...                            Agriculture

Mining and quarrying                           44 798     47 475      45 422      44 096      52 136       51 552      47 843      94 882           ...                 Industries extractives

Manufacturing                             562 085        559 839     595 079     601 133     609 682      675 203     736 502     748 633           ...            Industries manufacturières

Electricity, gas & water                       80 157     91 008      95 512     102 599     115 124      136 315     146 618     134 084           ...                 Electricité, gaz et eau

Construction                              143 397        156 158     185 849     195 969     234 498      262 088     260 793     251 020           ...          Bâtiments et travaux publics
Wholesale & retail trade,                                                                                                                                     Commerce de gros et de détail,
                                          668 295        693 166     743 879     782 616     843 409      934 603    1 042 726   1 005 323          ...
restaurants, hotels                                                                                                                                                    restaurants et hôtels
                                                                                                                                                               Banques, assurances, affaires
Finance, insurance, real estate, etc.     335 996        352 569     367 239     386 125     414 296      458 065     524 397     529 691           ...
                                                                                                                                                                               immobilières
Transport and communications              278 318        330 050     393 968     452 735     525 684      591 577     663 305     660 899           ...      Transport(s) et communications
                                                                                                                                                                 Administrations publiques et
Public administration and defense         369 473        368 267     446 529     484 594     531 952      554 169     581 048     609 549           ...
                                                                                                                                                                                     défense
Other services                            347 028        373 750     346 824     366 181     375 383      469 275     526 497     515 000           ...                        Autres services
                                                                                                                                                              Moins Services d’intermédiation
Less Imputed Service Charges              - 75 075       - 74 108    - 86 703    - 94 672   - 103 281    - 109 903   - 132 872   - 134 467          ...
                                                                                                                                                                                    financière
Gross domestic product at factor                                                                                                                          Produit intérieur brut aux couts des
                                         3 260 778      3 500 619   3 715 004   3 992 436   4 231 986   4 665 585    5 215 598   5 301 192          ...
cost / basic prices                                                                                                                                                     facteurs / prix de base

Plus: Indirect Taxes / taxes on                                                                                                                           Plus taxes indirectes/impôts sur les
                                          456 861        486 180     527 834     600 659     661 563      742 751     734 557     722 016           ...
products, less subsidies                                                                                                                                      produits, moins les subventions


Expenditure on Gross domestic product at current purchaser's values
                                                                                                              Emploi du produit intérieur brut aux prix courants d'acquisition

CFA Franc (Millions)                                                                                                                                               Franc CFA (Millions)
                                                                                                                                                                    Consommation finale des
Government final consumption              493 198        518 293     571 046     610 645     668 120      767 098     806 982     853 134           ...
                                                                                                                                                                    administrations publiques

Private final consumption                2 973 142      3 076 341   3 290 148   3 565 035   3 871 537   4 270 600    4 776 890   4 736 991          ...           Consommation finale privée

Gross fixed capital formation             922 704        857 446     944 073    1 071 365   1 279 734   1 414 078    1 610 512   1 426 463          ...        Formation brute de capital fixe

Increase in inventories                  - 284 161        17 619     - 26 558     53 633     - 70 876     167 970     332 392     204 742           ...                   Variation des stocks

Exports of goods and services            1 061 344      1 061 300   1 151 450   1 240 821   1 254 040   1 376 220    1 566 250   1 395 180          ...     Exportations de biens et services
                                                                                                                                                               Moins importations de biens et     281
Less imports of goods and services       1 448 587      1 544 200   1 687 322   1 948 404   2 109 007   2 587 630    3 142 870   2 593 301          ...
                                                                                                                                                                                     services
GDP at purchasers' values                3 717 639      3 986 798   4 242 837   4 593 095   4 893 548   5 408 336    5 950 155   6 023 208          ...             PIB aux prix d'acquisition


Gross domestic product by kind of economic activity at constant
                                                                                                Produit intérieur brut par branche d'activité economique aux prix constants
prices
Annual Growth Rates (%)                                                                                                                            Taux de croissance annuel (%)
Agriculture                                     -22.2        17.8         2.4        11.0        -8.4         -5.8        18.6        10.0          ...                            Agriculture

Mining and quarrying                             13.2        13.9         6.2       -17.6       -16.4         -6.2        -3.8        54.9          ...                 Industries extractives

Manufacturing                                     3.4         2.2         3.6         1.6        -2.9          6.0        -2.4         6.5          ...            Industries manufacturières

Electricity, gas & water                          7.7        11.8         2.3         5.9         4.5          8.5         2.5        -0.1          ...                 Electricité, gaz et eau

Construction                                     12.0         4.0        18.0         9.8        13.1          9.4        -1.6        -4.4          ...          Bâtiments et travaux publics
Wholesale & retail trade,                                                                                                                                            Commerce de gros et de
                                                  1.5         4.7         4.1         1.8         3.8          3.9         1.7         1.8          ...
restaurants, hotels                                                                                                                                                détail,restaurants et hôtels
                                                                                                                                                                Banques, assurances, affaires
Finance, insurance, real estate, etc.             3.9         5.6         5.3         4.6         3.4          3.8         5.3         1.3          ...
                                                                                                                                                                                immobilières
Transport and communications                     12.1        15.2        16.6        14.2        15.8        11.5          6.9        -0.3          ...      Transport(s) et communications
                                                                                                                                                                 Administrations publiques et
Public administartion and defense                 0.5         1.1        12.8         5.9         6.0          2.2        -0.5         2.9          ...
                                                                                                                                                                                     défense
Other services                                   12.5         3.7         1.3         6.0         0.0        13.9          4.4        -1.7          ...                        Autres services
                                                                                                                                                              Moins Services d’intérmediation
Less Imputed Service Charges                      1.7        -2.8        13.2         8.3         7.6          4.7        18.4         0.8          ...
                                                                                                                                                                                    financière
Gross domestic product at factor                                                                                                                          Produit intérieur brut aux couts des
                                                  0.2         7.2         6.2         5.7         2.3          4.9         3.8         3.1          ...
cost / basic prices                                                                                                                                                     facteurs / prix de base

Plus: Indirect Taxes / taxes on                                                                                                                           Plus taxes indirectes/impôts sur les
                                                  3.8         3.2         4.0         4.8         3.8          5.0        -0.6        -4.3          ...
products, less subsidies                                                                                                                                      produits, moins les subventions

Gross domestic product at market                                                                                                                            Produit intérieur brut aux prix du
                                                  0.7         6.7         5.9         5.6         2.5          4.9         3.2         2.2          ...
prices                                                                                                                                                                                 marché


2008: semi-final           2009: Provisional                                                                                     2008: semi-définitif          2009: provisoire


                                                                                                    African Statistical Yearbook 2011 / Annuaire Statistique pour l'Afrique 2011
Senegal                                                                                                                                                     Sénégal

         Expenditure on Gross domestic product at constant purchasers'
                                                                                                       Emplois du produit intérieur brut aux prix constants d'acquisition
         values

         Annual Growth Rates (%)                                                                                                         Taux de croissance annuel (%)
                                                                                                                                                           Consommation finale des
         Government final consumption                  3.5       2.7       5.6        5.3       5.1       7.3       0.9        2.6        ...
                                                                                                                                                           administrations publiques

         Private final consumption                     4.3       5.3       4.3        5.1       4.7       4.9       3.4        3.2        ...            Consommation finale privée

         Gross fixed capital formation                 2.7       3.6       9.5        6.1      13.2       7.4       7.8       -7.4        ...        Formation brute de capital fixe

         Exports of goods and services                 3.6       6.6       6.8        2.0      -3.2      -0.1       1.3        2.9        ...      Exportations de biens et services

                                                                                                                                                     Moins importations de biens et
         Less imports of goods and services            3.5      11.4       0.5       11.1       1.2      14.3      -0.5        0.6        ...
                                                                                                                                                                           services


                                                                                     III INFLATION

                                                   2002      2003      2004       2005      2006      2007      2008       2009      2010
         Annual Growth Rates (%)                                                                                                         Taux de croissance annuel (%)
         All Item                                      3.0       2.3       0.5        1.5       2.3       5.9       5.8       -1.0       4.0                               Ensemble

         Food                                          4.9       4.1       0.8        3.6       1.7       7.3       9.6       -3.0       9.6                            Alimentation

         Health                                        2.4       8.4       1.9        1.3      17.3       1.8       0.0        2.9      -0.1                                    Santé

         Energy                                        4.2       4.8       3.1        3.1      13.3      12.6       3.6       -3.7       4.3                                  Energie

         Transport                                     5.7      -2.2       1.4        4.3       8.9       2.4       9.4       -1.4       3.6                               Transport


                                                         IV AGRICULTURAL PRODUCTION - PRODUCTION AGRICOLE

                                                   2002      2003      2004       2005      2006      2007      2008       2009      2010
         Tons (Thousand)                                                                                                                                      Tonnes (milliers)
         Groundnuts (Tons)                         260 733   440 709   602 621    703 373   460 481   331 195   731 210   1032 651        ...                     Arachide (Tonnes)

         Millet (Tons)                             414 820   628 426   323 752    608 551   494 345   318 822   678 171    810 121        ...                            Mil (tonnes)

         Cassava (Tons)                            106 960   181 721   401 448    281 487   120 841   308 312   920 866    265 533        ...                       Manioc (tonnes)

         Rice (Tons)                               172 395   231 805   232 692    289 424   212 377   193 379   408 840    391 271        ...                           Riz (tonnes)

         Maize (Tons)                               80 372   421 954   400 555    399 958   181 585   158 266   411 499    290 283        ...                          Maïs (tonnes)


                                                              V MINING PRODUCTION - PRODUCTION MINIERE
282
                                                   2002      2003      2004       2005      2006      2007      2008       2009      2010


         Phosphate, Tons (thousands)               1 549.1   1 499.6   1 576.0    1 451.0     584.0     691.3     644.8      948.6     976.2          Phosphate (Milliers de tonnes)

         Sea salt iodizes, Tons (thousands)          171.5     235.1     167.9      133.9     198.6     212.4     240.6      222.5     231.4      Sel marin iodé (Milliers de tonnes)


         Attapulgite, Tons (thousands)               138.4     157.1     160.4      126.6     139.6     138.3     166.9      180.9     204.3          Attapulgite (Milliers de tonnes)


                                                                                 VI ENERGY - ENERGIE

                                                   2002      2003      2004       2005      2006      2007      2008       2009      2010

         Electricity - total hydro production,                                                                                                   Électricité - production hydraulique
                                                     194.0     337.0     293.0      267.0     234.0     181.0     229.0      238.1        ...
         kilowatt hours (millions)                                                                                                                  totale, kilowatt-heures (millions)

         Electricity - total thermal production,                                                                                                   Électricité - production thermique
                                                   1 528.0   1 489.0   1 658.2    1 902.3   1 957.8   2 125.0   2 172.0    2 255.7        ...
         kilowatt hours (millions)                                                                                                                  totale, kilowatt-heures (millions)

         Electricity - total production, self-                                                                                                  Electricité - Production totale privée
                                                        0         0         1          1         0         0         1           1        ...
         producer (Million Kilowatt Hours)                                                                                                                (million de kilowatt heures)

         Electricity - total production, public                                                                                                        Electricité - Production totale
                                                     1 722     1 826     1 951      2 169     2 192     2 306     2 401      2 494        ...
         (Million Kilowatt Hours)                                                                                                               publique (million de kilowatt heures)


      African Statistical Yearbook 2011 / Annuaire Statistique pour l'Afrique 2011
Senegal                                                                                                                                                                                 Sénégal
                                         VII TOURISM AND INFRASTRUCTURE - TOURISME ET INFRASTUCTURE

                                           2002         2003         2004         2005         2006            2007          2008          2009         2010

Arrivals - Tourists (thousands)           426.825      353.539       363.49      386.565      405.826         386.793     402.82821       458.912            ...           Arrivées - touristes (milliers)

Rooms in hotels and similar                                                                                                                                        Chambres d'hotels et établissements
establishments (thousands)                                                                                                                                                          assimilés (milliers)
                                            9.905       10.268       10.884       15.842       15.842          15.842             ...           ...          ...
Paved Road (% of total)                        15           15           16           16           16              16            16             ...          ...        Routes asphaltées (% du total)
Total Network (Railways-km)                30 174       30 280       30 388       30 451       30 516          30 580        30 645             ...          ...         Réseau total voies ferrées-Km
Main Telephone Lines (per 1,000                                                                                                                                        Lignes téléphoniques fixes (pour
                                               22           22           24           26           27              26            23             ...          ...
inhabitants)                                                                                                                                                                           1000 habitants)
Mobile Cellular Subscribers (per                                                                                                                                       Abonnés aux téléphones mobiles
                                               55           76          109          168          289             400           519             ...          ...
1,000 inhabitants)                                                                                                                                                              (pour 1000 habitants)


                          VII FINANCIAL AND MONETARY STATISTICS - FINANCES ET STATISTIQUES MONETAIRES

                                           2002         2003         2004         2005         2006            2007          2008          2009         2010

VII-1 Monetary Statistics                                                                                                                                     VII-1 Statistiques monétaires
CFA Franc (Millions)                                                                                                                                                         Franc CFA (Millions)
Money supply (M1)                         563 945      832 156      887 940      962 730     1 098 680       1 266 570    1 252 720     1 366 890     1 504 140                  Masse monétaire (M1)
Quasi-money                               406 383      444 081      544 410      586 569      643 993         703 531       753 459       867 492      964 844                           Quasi-monnaie
  of which Demand Deposit                       ...          ...          ...          ...          ...             ...           ...           ...          ...              dont Monnaie scripturale
Net foreign assets                        324 612      578 077      707 031      692 753      843 224         892 270       775 051       896 442      972 696                    Avoirs extérieurs nets
Domestic credit                           792 241      848 795      879 733     1 001 980    1 116 940       1 323 440    1 467 720     1 606 810     1 762 470                          Crédit intérieur

of which claims on private sector         687 588      784 556      854 653     1 036 260    1 110 020       1 230 250    1 439 550     1 491 990     1 599 330      dont créances sur le secteur privé

of which Claims on government                                                                                                                                               dont créances nettes sur le
                                          104 653       64 239       25 080      - 34 282       6 920          93 182        28 167       114 819      163 136
sector, net                                                                                                                                                                             gouvernement
International reserves (millions of US                                                                                                                             Réserves internationales (millions de
                                              637        1 111        1 386        1 191        1 334           1 660         1 602         2 123        1 945
$)                                                                                                                                                                                                 $ EU)
Average Exchange Rate (National                                                                                                                                     Taux de change (moyen) (monnaie
                                           696.99       581.20       528.29       527.47       522.89          479.27        447.81        472.19       495.28
Currency per us $)                                                                                                                                                              nationale par dollars)


VII-2 Public Finance                                                                                                                                                   VII-2 Finances publiques
CFA Franc (Millions)                                                                                                                                                         Franc CFA (Millions)
Total Revenues and Grants                 726 700      797 753      864 800      955 800     1 036 040       1 231 339    1 291 750     1 322 400     1 392 000                Recettes totales et dons
  Tax Revenue                             629 200      676 973      738 500      850 800      921 900        1 041 400    1 087 150     1 123 400     1 242 000                        Recettes fiscales
  Non Tax Revenue                          35 400       43 080       38 300       29 400       40 740          58 600        64 900        37 000       43 000                    Recettes non fiscales
  Grants                                   62 100       77 700       88 000       75 600       73 400         131 339       139 700       162 000      107 000                                     Dons      283
Total Expenditures and Net Lending        754 100      868 000      976 500     1 100 600    1 327 993       1 435 608    1 578 520     1 591 700     1 704 000          Dépenses totales et prêts nets

  Current expenditure                     478 200      529 500      553 900      629 000      825 953         864 940       978 720       956 700      989 000                     Dépenses courantes
  Of which Wages and Salaries             199 400      203 700      217 600      254 900      286 150         328 600       347 500       370 000      397 000           Dont rémunérations et salaires
  Capital expenditure                     275 900      338 500      410 300      454 700      474 940         565 268       594 700       633 000      713 000                 Dépenses d'équipement
  Net Lending                              - 5 600      - 6 800      12 300       16 900       27 100           5 400         5 100         2 000        2 000                                Prêts nets
Fiscal Balance                            - 27 400     - 70 247    - 111 700    - 144 800    - 291 953       - 204 269     - 286 770     - 269 300    - 312 000         Solde global y compris les dons


VII-3 Balance of Payments                                                                                                                                          VII-3 Balance des paiements
CFA Franc (Millions)                                                                                                                                                         Franc CFA (Millions)
Trade balance                            - 374 553    - 469 926    - 521 047    - 691 306    - 836 466      -1 193 338    -1 234 304    -1 159 307           ...                  Balance commerciale
Services Balance                          - 19 225     - 13 016     - 14 789     - 16 258     - 18 501        - 18 072      - 54 087      - 38 815           ...                   Balance des services
Net Income                                - 90 595     - 79 132     - 69 044     - 47 230     - 33 171        - 35 388      - 21 416      - 24 544           ...                           Revenus nets
Current transfers, net total              256 927      264 129      333 909      397 575      437 466         618 022       754 355       714 052            ...                    Transferts courants
Current account balance                  - 227 446    - 297 945    - 270 971    - 357 219    - 450 672       - 628 776     - 555 452     - 508 613           ...              Solde du compte courant


VII-4 External Debt and Financial Flows                                                                                                          VII-4 Dette extérieure et flux financiers
US $ (Millions)                                                                                                                                                                     $ E.U (Millions)
Total external debt                      2 294 900    2 024 700    1 864 600    1 944 100     864 370         968 472     1 171 650     1 283 900            ...                 Dette extérieure totale
  Private                                       ...          ...          ...          ...          ...             ...           ...           ...          ...                                  Privée
  Public                                 2 294 900    2 024 700    1 864 600    1 944 100     864 370         968 472     1 171 650     1 283 900            ...                               Publique
Total external debt service                95 700       92 000       67 450       48 607       51 520          40 350        39 740        47 700            ...          Service de la dette extérieure
Net Foreign Direct Investment                                                                                                                                      Investissements étranger direct (flux
                                           65 303       70 700       86 400       96 019      183 607         187 544       151 900       145 800            ...
Inflows                                                                                                                                                                                  nets entrants)
Net Total Official Development                                                                                                                                        Aide publique au développement
                                          163 577      161 995      145 736      253 600      421 640         244 333       418 679       736 285            ...
assistance                                                                                                                                                                               (nette totale)


                                                                                                         African Statistical Yearbook 2011 / Annuaire Statistique pour l'Afrique 2011
Senegal                                                                                                                                                            Sénégal

                                              2002         2003        2004        2005        2006        2007        2008        2009        2010

         CFA Franc (Millions)                                                                                                                                                  Franc CFA
         Exports, fob                                                                                                                                                Exportations, fàb


         Exports - Total                     743 357      730 549     797 447     832 440     833 471     802 211     987 862     837 793           ...                 Exportations - Total


         Main Products                                                                                                                                               Principaux produits


         Phosphoric acid                     119 150       80 286      94 602      97 961      40 327      46 959     106 905      69 815      98 481                  Acide phosphoriques


         Gas oil                                   ...     54 806      61 967      50 933      60 167      88 426     125 280      79 062           ...                               Gaz oil


         Jet fuel                                  ...     24 696      26 859      42 641     100 863      27 983     150 040     102 643           ...                       Carburéacteur


         Frozen and fresh fish                 6 738          466      42 389      43 747      39 002      38 740      33 772      40 131           ...      Autres poissons frais/réfrigérés


                                                                                                                                                             Huiles d'arachide brutes & ses
         Groundnut oil, crude                 41 954       23 005      13 700      15 677      27 843      32 353       7 889      18 141      28 441
                                                                                                                                                                                   fractions

         Main Destinations                                                                                                                                      Principales destinations

         Mali                                58 211.5     56 923.5    83 070.8   117 274.1   137 132.0   159 965.8   213 119.0   171 465.0   249 171.0                                  Mali


         India                              137 559.2     85 640.6    96 559.3    99 945.2    41 351.2    49 699.3   121 151.7    73 157.7   103 789.0                                  Inde


         France                              84 096.6     72 813.8    66 080.6    69 401.8    60 936.5    70 878.3    56 739.4    51 666.0    48 667.0                               France


         Italy                               71 308.0     58 412.5    48 816.7    41 515.1    37 024.5    37 562.4    17 076.9    24 485.0    23 224.0                                 Italie


         Spain                               36 089.7     50 419.7    44 520.7    46 249.9    38 980.5    37 081.5    21 627.5    20 728.0    28 909.0                              Espagne


                                              2002         2003        2004        2005        2006        2007        2008        2009        2010
         Imports, cif                                                                                                                                                 Importations, cif

284      Imports - Total                    1 257 167    1 354 827   1 488 007   1 723 837   1 890 992   2 264 100   2 842 500   2 314 046          ...       Importations - Total (millions)


                                                                                                                                                                     Principaux produits
         Main Products


         Petroleum oils,crude                128 565      163 749     178 021     203 433      85 777     193 249     343 253     186 706     224 363               Huiles brutes de petrole


         Broken rice                         119 841      117 710     114 970     132 428     121 289     168 322     199 466     163 792     130 844                         Brisures de riz


         Gas oil                                   ...     32 359      30 527      45 285     131 997     130 025      55 682      59 711           ...                               Gaz oil

                                                                                                                                                          Autres médicaments pour la vente
         Medicaments for retail sale, nes     38 635       37 736      44 600      44 285      48 224      53 426      54 090      55 687           ...
                                                                                                                                                                                 au détail


         Wheat & meslin, nes                  32 320       30 658      41 378      35 818      41 145      61 889      70 444      52 600           ...                 Autres blés & méteil


         Main Origin                                                                                                                                            Principales provenances

         France                             353 202.6    343 283.1   373 157.8   387 225.8   448 864.3   498 941.7   455 502.7   425 500.0   441 412.0                               France

         Nigeria                            118 620.5    166 917.4   178 785.5   193 069.6    62 808.2   196 644.6   345 545.8   197 430.6   230 842.0                               Nigeria

         Thailand                            97 861.8     92 454.5    91 477.4    72 539.7    85 372.2   113 400.7   153 052.7   116 902.7    73 863.0                            Thaïlande

         China, Rep.                         32 361.9     37 671.9    51 660.1    64 548.2    80 218.7   128 247.2   165 260.6   191 989.0   195 142.0                     Chine, Rép. Pop.

         Spain                               57 594.5     65 915.5    62 421.5    62 643.6    72 099.5    68 289.9    73 839.1    92 255.0    85 074.0                              Espagne


      African Statistical Yearbook 2011 / Annuaire Statistique pour l'Afrique 2011
Seychelles                                                                                                                                               Seychelles

AREA (KM 2)                                                                             455                                                             SUPERFICIE (KM 2)
CAPITAL CITY                             Victoria                                                                            Victoria                               CAPITALE
CURRENCY                                 Seychelles Rupee                                                                     Rupee                                 MONNAIE


                        I SOCIAL AND DEMOGRAPHIC INDICATORS — INDICATEURS DEMOGRAPHIQUES ET SOCIAUX

                                           2002      2003     2004      2005      2006        2007       2008      2009         2010
Population                                                                                                                                                       Population
                                                                                                                                             Population au milieu de l'année -
Mid-year population - Total (Million)         0.1      0.1       0.1       0.1       0.1         0.1        0.1       0.1         0.1
                                                                                                                                                                Total (million)
                                                                                                                                             Population au milieu de l'année -
Mid-year population - Urban (%)                ...      ...     53.0      53.0      54.0        54.0       55.0      54.8          ...
                                                                                                                                                                Urbaine (%)

Female (%)                                   49.6     49.6      49.7      49.7      49.7        49.7       49.7      49.7          ...                             Femme (%)


Population by Age Group                                                                                                                          Population par groupe d'âge


   0-14                                        ...      ...   20 747    20 451    19 919      19 752     19 806        ...         ...                                     0-14


   15-64                                       ...      ...   55 193    55 790    58 134      60 348     60 649        ...         ...                                    15-64


   65+                                         ...      ...    6 534     6 611     6 979       6 856      6 843        ...         ...                                     65+


Active Population (000)                      37.0     37.0      38.0      38.0      38.0        38.0       39.0      39.0          ...                 Population active (000)

   Female (%)                                45.9     48.6      47.4      47.4      47.4        47.4       46.2      48.7          ...                             Femme (%)

                                                                                                                                            Taux brut de natalité - Total (par
Crude birth rate - Total (per 1000)          18.0     18.0      17.0      19.0      17.0        18.0         ...       ...         ...
                                                                                                                                                                        1000)
                                                                                                                                          Taux brut de mortalité - Total (par
Crude death rate - Total (per 1000)           8.0      8.0       7.0       8.0       8.0         7.0         ...       ...         ...
                                                                                                                                                                       1000)
Life expectancy at birth - Total                                                                                                            Espérance de vie à la naissance -
                                             72.0     71.0      73.0      72.0      72.0        73.0         ...       ...         ...
(years)                                                                                                                                                       Total (années)
Net reproduction rate - (per                                                                                                                 Taux net de reproduction - (par
                                               ...      ...       ...       ...       ...         ...        ...       ...         ...
woman)                                                                                                                                                               femme)
                                                                                                                                            Indice synthétique de fécondité -
Total fertility rate - (p woman)
              y        (per    )               ...     2.0       2.0       2.0       2.0         2.0         ...       ...         ...
                                                                                                                                                                (par femme)

Education                                                                                                                                                   Enseignement

Teaching staff at first level - Total                                                                                                     Personnel enseignant - 1er degré -
                                             0.69      0.7       0.7       0.7        ...        0.7        0.7       0.6          ...
(thousands)                                                                                                                                                  Total (milliers)
Teaching staff at second level - Total                                                                                                   Personnel enseignant - 2ème degré -
                                             0.54      0.6       0.6       0.6        ...        0.6        0.5       0.6          ...                                              285
(thousands)                                                                                                                                                   Total (milliers)
Teaching staff at third level - Total                                                                                                  Personnel enseignant - 3ème degré -
                                               ...      ...       ...       ...       ...         ...        ...       ...         ...
(thousands)                                                                                                                                                 Total (milliers)
First level student enrollment - Total                                                                                                      Elèves inscrits - 1er degré - Total
                                              10         9        9          9        ...          9          9         9          ...
(thousands)                                                                                                                                                           (milliers)
First level student enrollment -                                                                                                         Elèves inscrits - 1er degré - Femmes
                                                5        5        4          4        ...          4          4         4          ...
Female (thousands)                                                                                                                                                     (milliers)
Second level student enrollment -                                                                                                         Elèves inscrits - 2ème degré - Total
                                                8        8        7          8        ...          8          8         7          ...
Total (thousands)                                                                                                                                                    (milliers)
Second level student enrollment -                                                                                                               Elèves inscrits - 2ème degré -
                                                4        4        4          4        ...          4          4         4          ...
Female (thousands)                                                                                                                                          Femmes (milliers)
Third level student enrollment - Total                                                                                                    Elèves inscrits - 3ème degré - Total
                                               ...      ...       ...       ...       ...         ...        ...       ...         ...
(thousands)                                                                                                                                                          (milliers)
Third level student enrollment -                                                                                                                Elèves inscrits - 3ème degré -
                                               ...      ...       ...       ...       ...         ...        ...       ...         ...
Female (thousands)                                                                                                                                          Femmes (milliers)
Public expenditure on education (%                                                                                                          Dépenses publiques consacrées à
                                               ...      ...       ...       ...     12.6          ...        ...       ...         ...
of budget)                                                                                                                                    l'enseignement (% du budget)

Health                                                                                                                                                                  Santé

Hospital beds - Total (per 10 000                                                                                                           Nombre de lits d'hôpitaux - Total
                                             527       499      490         ...     570          478         ...       ...         ...
population)                                                                                                                                                    (pour 10 000)
Nurses - Total (per 10 000                                                                                                                 Nombre d'infirmières - Total (pour
                                             456       502      497       456       481          475         ...       ...         ...
population)                                                                                                                                                          10 000)
Physicians - Total (per 10 000                                                                                                             Nombre de médecins - Total (pour
                                             165       146      126       133       105          124         ...       ...         ...
population)                                                                                                                                                        10 000)
Public expenditure on Health (% of                                                                                                       Dépenses publiques consacrées à la
                                                7       10       11        10          9          ...        ...       ...         ...
budget)                                                                                                                                               santé (% du budget)


                                                                                        African Statistical Yearbook 2011 / Annuaire Statistique pour l'Afrique 2011
Seychelles                                                                                                                                      Seychelles
                                                           II NATIONAL ACCOUNTS — COMPTES NATIONAUX

                                                  2002     2003      2004      2005     2006      2007       2008      2009       2010

          Gross domestic product by kind of economic activity at current prices
                                                                                          Produit intérieur brut par branche d'activité économique aux prix courants


          Seychelles Rupee (Millions)                                                                                                                     Rupee (Millions)

          Agriculture                               110      101       156       160      162        185       219        250         ...                            Agriculture

          Mining and quarrying                       ...       ...       ...      ...      ...         ...       ...        ...       ...                 Industries extractives

          Manufacturing                             698      623       355       444      510        658       750        849         ...            Industries manufacturières

          Electricity, gas & water                  101       99        99        76      104         90        93        144         ...                 Electricité, gaz et eau

          Construction                              384      343       230       311      305        361       486        569         ...          Bâtiments et travaux publics
          Wholesale & retail trade,                                                                                                             Commerce de gros et de détail,
                                                    870      830       726       775      914       1 523     2 263     2 955         ...
          restaurants, hotels                                                                                                                            restaurants et hôtels
                                                                                                                                                 Banques, assurances, affaires
          Finance, insurance, real estate, etc.     417      413       797       845    1 010       1 187     1 511     2 139         ...
                                                                                                                                                                 immobilières
          Transport and communications              575      602       540       692      812        906      1 055     1 213         ...      Transport(s) et communications
                                                                                                                                                   Administrations publiques et
          Public administration and defense         370      387       539       540      646        736       799        863         ...
                                                                                                                                                                       défense
          Other services                            397      412       408       443      441        492       542        549         ...                        Autres services
                                                                                                                                                Moins Services d’intermédiation
          Less Imputed Service Charges            - 192    - 206     - 163     - 175    - 202      - 281      - 321     - 478         ...
                                                                                                                                                                      financière
          Gross domestic product at factor                                                                                                  Produit intérieur brut aux couts des
                                                  3 731    3 602     3 688     4 111    4 701       5 857     7 398     9 053         ...
          cost / basic prices                                                                                                                             facteurs / prix de base

          Plus: Indirect Taxes / taxes on                                                                                                   Plus taxes indirectes/impôts sur les
                                                    305      394     1 066       994      899        966      1 311     1 673         ...
          products, less subsidies                                                                                                              produits, moins les subventions


          Expenditure on Gross domestic product at current purchaser's values
                                                                                                     Emploi du produit intérieur brut aux prix courants d'acquisition

          Seychelles Rupee (Millions)                                                                                                                     Rupee (Millions)
                                                                                                                                                      Consommation finale des
          Government final consumption              896    1 045     1 950     2 068    2 189       2 858     1 176     1 429      1 058
                                                                                                                                                      administrations publiques

          Private final consumption               1 910    1 960     2 125     2 278    2 653       3 151     7 958     9 115      8 365            Consommation finale privée

          Gross fixed capital formation           1 740      703       872     1 668    1 500       1 984     3 493     3 140      5 092         Formation brute de capital fixe

          Increase in inventories                 - 272      117         ...      ...      ...         ...       ...        ...       ...                   Variation des stocks

          Exports of goods and services           3 014    3 330     3 452     3 958    4 733       5 851     9 390    11 089     10 255      Exportations de biens et services
286                                                                                                                                              Moins importations de biens et
          Less imports of goods and services      3 252    3 158     3 644     4 867    5 475       7 021    13 308    14 046     14 018
                                                                                                                                                                       services
          GDP at purchasers' values               4 036    3 997     4 754     5 105    5 600       6 824     8 709    10 726     10 752              PIB aux prix d'acquisition


          Gross domestic product by kind of economic activity at constant
                                                                                         Produit intérieur brut par branche d'activité economique aux prix constants
          prices
          Annual Growth Rates (%)                                                                                                    Taux de croissance annuel (%)
          Agriculture                               1.2      -5.4      -4.7      5.6     -4.8         0.5       4.8      -17.7        ...                            Agriculture

          Mining and quarrying                       ...       ...       ...      ...      ...         ...       ...        ...       ...                 Industries extractives

          Manufacturing                             1.2      -4.1      -8.0     11.6      3.2         3.1     -12.3      -11.1        ...            Industries manufacturières

          Electricity, gas & water                  1.2     10.4       5.6       4.0      5.0         6.5       0.4       3.1         ...                 Electricité, gaz et eau

          Construction                              1.2      -3.2     -17.2     32.7     15.8        10.0      11.4       -4.9        ...          Bâtiments et travaux publics
          Wholesale & retail trade,                                                                                                                    Commerce de gros et de
                                                    4.5      -4.3      -8.2      2.7     13.3        20.5     -10.6       3.3         ...
          restaurants, hotels                                                                                                                        détail,restaurants et hôtels
                                                                                                                                                  Banques, assurances, affaires
          Finance, insurance, real estate, etc.     1.2     -10.1      1.6       5.9     13.7        12.1       1.8      14.2         ...
                                                                                                                                                                  immobilières
          Transport and communications              1.2      -9.1      -7.9      7.1      7.6         6.0      10.2       5.0         ...      Transport(s) et communications
                                                                                                                                                   Administrations publiques et
          Public administartion and defense         1.2      0.6       -7.5      0.8     14.8         5.0       1.7       -8.8        ...
                                                                                                                                                                       défense
          Other services                           -3.9     -10.5     -15.9      5.8      3.5         1.8      -5.7       -0.5        ...                        Autres services
                                                                                                                                                Moins Services d’intérmediation
          Less Imputed Service Charges              1.2     -19.8      -3.2      2.9     15.3        15.0     -10.6      17.6         ...
                                                                                                                                                                      financière
          Gross domestic product at factor                                                                                                  Produit intérieur brut aux couts des
                                                    1.2      -5.4      -7.3      6.8      9.6         9.0      -0.3       0.9         ...
          cost / basic prices                                                                                                                             facteurs / prix de base

          Plus: Indirect Taxes / taxes on                                                                                                   Plus taxes indirectes/impôts sur les
                                                    1.2      -9.5     29.4       6.5      8.9        12.6      -5.9       -0.6        ...
          products, less subsidies                                                                                                              produits, moins les subventions

          Gross domestic product at market                                                                                                    Produit intérieur brut aux prix du
                                                    1.2      -5.9      -2.8      6.7      9.5         9.6      -1.3       0.7         ...
          prices                                                                                                                                                         marché


      Break in the serie from 2004                                                                                                     Rupture de la série à partir 2004


      African Statistical Yearbook 2011 / Annuaire Statistique pour l'Afrique 2011
Seychelles                                                                                                                                              Seychelles

Expenditure on Gross domestic product at constant purchasers'
                                                                                               Emplois du produit intérieur brut aux prix constants d'acquisition
values

Annual Growth Rates (%)                                                                                                          Taux de croissance annuel (%)
                                                                                                                                                   Consommation finale des
Government final consumption                -3.2     12.1      11.8        0.4     -14.3        11.3      -45.2      21.4        5.8
                                                                                                                                                   administrations publiques

Private final consumption                   -0.1     -16.3     -8.0       14.6     38.1          -0.7       2.7      13.9      -61.8             Consommation finale privée

Gross fixed capital formation              -34.0     -59.6     24.0       91.4      6.6         32.3       76.1      -10.1      62.2         Formation brute de capital fixe

Exports of goods and services               0.8      10.5       3.7       14.7     41.8         23.6       60.5      18.1       -7.5       Exportations de biens et services

                                                                                                                                             Moins importations de biens et
Less imports of goods and services         -14.9      -2.9     15.4       33.5     33.4         23.6       60.5      18.1       -7.5
                                                                                                                                                                   services


                                                                          III INFLATION

                                          2002      2003      2004      2005      2006        2007       2008      2009       2010
Annual Growth Rates (%)                                                                                                          Taux de croissance annuel (%)
All Item                                    0.2       3.6       4.1        0.6      -1.9         5.3       37.0      31.7       -2.4                               Ensemble

Food                                          ...     2.2       1.9        0.3      1.6          8.5       30.9      41.6       -5.8                            Alimentation

Health                                        ...     4.1       4.7        1.9      4.0         10.9       15.6      13.6        0.4                                   Santé

Energy                                        ...     2.1       1.3        0.7      -0.7         0.4       58.6      11.9        3.2                                  Energie

Transport                                     ...     5.4       3.0        1.0      1.1          9.4       44.0      32.8        7.2                               Transport


                                               IV AGRICULTURAL PRODUCTION - PRODUCTION AGRICOLE

                                          2002      2003      2004      2005      2006        2007       2008      2009       2010
Tons (Thousand)                                                                                                                                       Tonnes (milliers)
Coconuts, Tons (thousands)                     3        3         3         3         3            2          1         ...       ...         Noix de coco, tonnes (milliers)

Banana, Tons (thousands)                       2        2         2         2         2            2          2         ...       ...               Banane, tonnes (milliers)

Tea, Tons (thousands)                          0        0         0         0         0            0          0         ...       ...                  Thé, tonnes (milliers)

Tomato, Tons (thousands)                       0        0         0         0         0            0          0         ...       ...             Tomates, tonnes (milliers)

Pineapple, Tons (thousands)                    0        0         0         0         0            0          0         ...       ...               Ananas, tonnes (milliers)


                                                    V MINING PRODUCTION - PRODUCTION MINIERE
                                                                                                                                                                                 287
                                          2002      2003      2004      2005      2006        2007       2008      2009       2010


                                              ...       ...      ...        ...       ...          ...       ...        ...       ...

                                              ...       ...      ...        ...       ...          ...       ...        ...       ...


                                              ...       ...      ...        ...       ...          ...       ...        ...       ...


                                                                       VI ENERGY - ENERGIE

                                          2002      2003      2004      2005      2006        2007       2008      2009       2010

Electricity - total hydro production,                                                                                                    Électricité - production hydraulique
                                              ...       ...      ...        ...       ...          ...       ...        ...       ...
kilowatt hours (millions)                                                                                                                   totale, kilowatt-heures (millions)

Electricity - total thermal production,                                                                                                    Électricité - production thermique
                                          218.8     223.8     226.0      231.0    252.0        270.6         ...        ...       ...
kilowatt hours (millions)                                                                                                                   totale, kilowatt-heures (millions)

Electricity - total production, self-                                                                                                   Electricité - Production totale privée
                                              ...       ...      ...        ...       ...          ...       ...        ...       ...
producer (Million Kilowatt Hours)                                                                                                                 (million de kilowatt heures)

Electricity - total production, public                                                                                                         Electricité - Production totale
                                            219       224       226       231       252          271         ...        ...       ...
(Million Kilowatt Hours)                                                                                                                publique (million de kilowatt heures)


                                                                                        African Statistical Yearbook 2011 / Annuaire Statistique pour l'Afrique 2011
Seychelles                                                                                                                                  Seychelles
                                                  VII TOURISM AND INFRASTRUCTURE - TOURISME ET INFRASTUCTURE

                                                   2002      2003     2004     2005     2006     2007     2008     2009     2010

         Arrivals - Tourists (thousands)             132      122      121      129      141      161      159        ...       ...           Arrivées - touristes (milliers)

         Rooms in hotels and similar                                                                                                Chambres d'hotels et établissements
         establishments (thousands)                    2        2        2        ...      ...      ...      ...      ...       ...                  assimilés (milliers)

         Paved Road (% of total)                       ...      96       ...      ...      ...      ...      ...      ...       ...        Routes asphaltées (% du total)
         Total Network (Railways-km)                   ...      ...      ...      ...      ...      ...      ...      ...       ...         Réseau total voies ferrées-Km
         Main Telephone Lines (per 1,000                                                                                                  Lignes téléphoniques fixes (pour
                                                     260       260      260      260      250      270      270      260        ...
         inhabitants)                                                                                                                                     1000 habitants)
         Mobile Cellular Subscribers (per                                                                                                 Abonnés aux téléphones mobiles
                                                     550       600      660      710      850      930    1 120    1 100        ...
         1,000 inhabitants)                                                                                                                        (pour 1000 habitants)


                                   VII FINANCIAL AND MONETARY STATISTICS - FINANCES ET STATISTIQUES MONETAIRES

                                                   2002      2003     2004     2005     2006     2007     2008     2009     2010

         VII-1 Monetary Statistics                                                                                               VII-1 Statistiques monétaires
         Seychelles Rupee (Millions)                                                                                                                 Rupee (Millions)
         Money supply (M1)                          2 243    2 522    2 226    2 466    2 653    3 267    4 725    4 784     5 355                  Masse monétaire (M1)
         Quasi-money                                1 764    1 699    2 586    2 426    2 387    1 372    1 211    1 617     1 921                          Quasi-monnaie
           of which Demand Deposit                     ...      ...      ...      ...      ...      ...      ...      ...       ...              dont Monnaie scripturale
         Net foreign assets                        - 724     - 520    - 416    - 277      530      421    2 094    2 751     3 489                   Avoirs extérieurs nets
         Domestic credit                            4 937    5 172    5 101    5 191    4 799    5 282    6 037    4 966     5 832                          Crédit intérieur

         of which claims on private sector           777       997    1 168    1 257    1 277    1 717    2 550    2 315     2 861      dont créances sur le secteur privé

         of which Claims on government                                                                                                         dont créances nettes sur le
                                                    4 154    4 074    3 748    3 636    3 228    3 178    2 931    2 235     2 630
         sector, net                                                                                                                                       gouvernement
         International reserves (millions of US                                                                                       Réserves internationales (millions de
                                                      70        67       35       56      113       41       64      191       236
         $)                                                                                                                                                           $ EU)
         Average Exchange Rate (National                                                                                               Taux de change (moyen) (monnaie
                                                     5.48     5.40     5.50     5.50     5.52     6.70     9.46    13.61     12.07
         Currency per us $)                                                                                                                        nationale par dollars)


         VII-2 Public Finance                                                                                                             VII-2 Finances publiques
         Seychelles Rupee (Millions)                                                                                                                 Rupee (Millions)
         Total Revenues and Grants                  1 478    1 868    1 891    2 168    2 476    2 213    3 190    4 165     4 179                Recettes totales et dons
           Tax Revenue                              1 049    1 292    1 382    1 567    1 371    1 636    2 457    3 318     3 527                        Recettes fiscales
           Non Tax Revenue                           424       564      504      550    1 033      560      412      474       482                   Recettes non fiscales
288        Grants                                      5        11        5       50       73       17      321      373       170                                    Dons

         Total Expenditures and Net Lending         2 121    1 597    1 789    1 816    2 302    2 810    3 483    3 622     3 878          Dépenses totales et prêts nets

           Current expenditure                      1 721    1 511    1 612    1 560    1 900    2 497    2 504    3 329     3 315                    Dépenses courantes
           Of which Wages and Salaries               675       685      704      663      760      700      688      766       694          Dont rémunérations et salaires
           Capital expenditure                       358        86      177      254      404      376      183      608       948                Dépenses d'équipement
           Net Lending                                43         1        0        2      - 2     - 63      796    - 315     - 385                               Prêts nets
         Fiscal Balance                            - 643       270      102      352      174    - 597    - 293      543       301         Solde global y compris les dons


         VII-3 Balance of Payments                                                                                                    VII-3 Balance des paiements
         US $ (Millions)                                                                                                                               $ E.U(Millions)
         Trade balance                             - 143      - 89    - 155    - 299    - 290    - 426    - 507    - 321     - 336                   Balance commerciale
         Services Balance                             98       121      120      134      156      168       95       93        68                    Balance des services
         Net Income                                  - 68     - 43     - 34     - 40     - 44     - 68     - 94    - 101      - 85                            Revenus nets
         Current transfers, net total                 14        13       18       31       44       30       57       41        10                     Transferts courants
         Current account balance                     - 99        2     - 50    - 174    - 134    - 296    - 449    - 288     - 342               Solde du compte courant


         VII-4 External Debt and Financial Flows                                                                       VII-4 Dette extérieure et flux financiers
         US $ (Millions)                                                                                                                               $ E.U (Millions)
         Total external debt                         557       484      460      486      521      710      759      729       492                  Dette extérieure totale
           Private                                   280       238      183      162      295      454      467      496       264                                   Privée
           Public                                    277       246      277      324      226      256      292      233       229                                Publique
         Total external debt service                 100        56      144       45      119       94       67      116        72           Service de la dette extérieure
         Net Foreign Direct Investment                                                                                                Investissements étranger direct (flux
                                                      48        58       38       86      146      239      252      243        ...
         Inflows                                                                                                                                            nets entrants)
         Net Total Official Development                                                                                                  Aide publique au développement
                                                       8        10       10       15       14        9       13       23        ...
         assistance                                                                                                                                         (nette totale)


      African Statistical Yearbook 2011 / Annuaire Statistique pour l'Afrique 2011
Seychelles                                                                                                                                       Seychelles

                                          2002     2003     2004     2005     2006       2007       2008      2009       2010

US $ (Millions)                                                                                                                                               Rupee
Exports, fob                                                                                                                                   Exportations, fàb


Exports - Total                             237      286      301      351      420         395       502         ...        ...                  Exportations - Total


Main Products                                                                                                                                  Principaux produits


Canned tuna                                 154      189      168      176      187         184         ...       ...        ...                    Thon en conserve


Crustaceans                                   2        8        8        6        8           2         ...       ...        ...                            Crustacés


Frozen and fresh fish                         3        5        2        3        3           2         ...       ...        ...            Poissons frais et congelés


Shark Fins (Dried)                           ...       5        2        2        1           1         ...       ...        ...                  Requin Fins (Séché)


Cinnamon bark                                 0        0        0        0        0           0         ...       ...        ...                   Écorce de cannelle

Main Destinations                                                                                                                         Principales destinations

United Kingdom                             96.4     88.0    107.9    104.8     97.1        86.5       92.4     100.6         ...                         Royaume-Uni


France                                     67.8     74.3     71.7     51.0     62.9        69.0       78.4      71.8         ...                                France


Spain                                      22.3     19.9     50.8     93.6     31.7        19.3       15.6      19.4         ...                              Espagne


Italy                                      28.6     47.3     30.5     34.5     45.6        21.1       32.7      38.4         ...                                 Italie


Japan                                      22.0     17.6     34.6     45.2     33.3        30.9       33.2      28.8         ...                                Japon


                                          2002     2003     2004     2005     2006       2007       2008      2009       2010
Imports, cif                                                                                                                                    Importations, cif

Imports - Total                             415      414      552      764      842       1 048      1 379       940         ...        Importations - Total (millions)   289

                                                                                                                                               Principaux produits
Main Products


Petroleum oils&oils obtained from
                                                                                                                                       Huiles de pétrole, bitumineux,
bituminous minerals,o/than crude              5       20       17      180      161         136       100         13         ...
                                                                                                                                                   distilles, sauf brut
etc


Tankers                                      ...       0       ...      ...      ...         58        63         16         ...                              Tankers


Skipjack or stripe-bellid bonito,frozen                                                                                              Listaos ou bonites à ventre rayé,
                                             22       30       31       34       42          46        62         37         ...   congelés ex headg n ° 03.04, foies
ex headg No 03.04,livers&roes
                                                                                                                                                           et laitances
Tunas, yellowfin, frozen excluding                                                                                                        Thons, albacore, congelés à
                                             13       24       26       16       18          35        56         29         ...     l'exclusion du n ° 03.04, foies et
heading No 03.04, livers and roes
                                                                                                                                                              laitances

Floating docks and vessels which                                                                                                     Docks flottants et les navires qui
                                              0       ...      ...      ...       0           0        37          1         ...
perform special functions                                                                                                           effectuent des fonctions spéciales


Main Origin                                                                                                                               Principales provenances

Spain                                      33.3     53.0     67.2     96.7     61.2        70.0       96.8      68.1         ...                              Espagne

France                                     41.9     59.3     50.9     46.6     57.7        77.8      122.9      56.3         ...                                France

Singapore                                  24.1     26.6     35.2     48.1     54.4        52.9      152.1      45.6         ...                            Singapour

South Africa                               33.7     38.6     34.5     93.3     70.9        57.7       57.4      58.4         ...                       Afrique du Sud

Saudi Arabia                                 ...     9.7       ...   144.0    105.2        66.2         ...       ...        ...                      Arabie Saoudite


                                                                                   African Statistical Yearbook 2011 / Annuaire Statistique pour l'Afrique 2011
Sierra Leone                                                                                                                                                    Sierra Leone

         AREA (KM 2)                                                                                    71 740                                                              SUPERFICIE (KM 2)
         CAPITAL CITY                             Freetown                                                                                     Freetown                                 CAPITALE
         CURRENCY                                 Leone                                                                                           Leone                                 MONNAIE


                                 I SOCIAL AND DEMOGRAPHIC INDICATORS — INDICATEURS DEMOGRAPHIQUES ET SOCIAUX

                                                    2002        2003        2004        2005        2006         2007        2008        2009       2010
         Population                                                                                                                                                                  Population
                                                                                                                                                                 Population au milieu de l'année -
         Mid-year population - Total (Million)          4.5         4.7         5.0         5.1         5.2          5.3         5.5         5.6      5.7
                                                                                                                                                                                    Total (million)
                                                                                                                                                                 Population au milieu de l'année -
         Mid-year population - Urban (%)                 ...         ...       37.0        37.0        38.0         38.0        38.0        38.0       ...
                                                                                                                                                                                    Urbaine (%)

         Female (%)                                    51.5        51.5        51.5        51.4        51.4         51.4        51.3        51.3     51.3                              Femme (%)


         Population by Age Group                                                                                                                                     Population par groupe d'âge


            0-14                                   1916 115    2004 992    2095 649    2181 951    2261 673    2335 764     2405 126    2471 840       ...                                     0-14


            15-64                                  2529 550    2631 818    2733 260    2826 604    2909 240    2983 206     3051 635    3119 685       ...                                    15-64


            65+                                      94 656      95 718      97 013      98 422      99 887      101 430     103 091     104 946       ...                                     65+


         Active Population (000)                    1 733.0     1 801.0     1 870.0     1 934.0     1 991.0      2 046.0     2 096.0     2 146.0       ...                 Population active (000)

            Female (%)                                 50.7        50.8        51.0        51.1        51.3         50.9        51.0        51.1       ...                             Femme (%)

                                                                                                                                                                Taux brut de natalité - Total (par
         Crude birth rate - Total (per 1000)           42.1        41.8        48.2        41.3        41.0         40.7        31.5        39.9       ...
                                                                                                                                                                                            1000)
                                                                                                                                                              Taux brut de mortalité - Total (par
         Crude death rate - Total (per 1000)           19.4        18.5        17.7        17.1        16.6         16.1        15.8        15.4       ...
                                                                                                                                                                                           1000)
         Life expectancy at birth - Total                                                                                                                       Espérance de vie à la naissance -
                                                       44.0        44.9        48.4        46.4        46.9         47.3        47.6        47.9       ...
         (years)                                                                                                                                                                  Total (années)
         Net reproduction rate - (per                                                                                                                            Taux net de reproduction - (par
                                                         ...         ...         ...        2.0          ...          ...         ...         ...      ...
         woman)                                                                                                                                                                          femme)
                                                                                                                                                                Indice synthétique de fécondité -
         Total fertility rate - (p woman)
                       y        (per    )               5.3         5.3         6.1         5.3         5.3          5.2         5.1         5.2       ...
                                                                                                                                                                                    (par femme)

         Education                                                                                                                                                              Enseignement

         Teaching staff at first level - Total                                                                                                                Personnel enseignant - 1er degré -
                                                         ...         ...         ...         ...         ...          ...         ...         ...      ...
         (thousands)                                                                                                                                                             Total (milliers)
         Teaching staff at second level - Total                                                                                                              Personnel enseignant - 2ème degré -
290                                                      ...         ...         ...         ...         ...          ...         ...         ...      ...
         (thousands)                                                                                                                                                              Total (milliers)
         Teaching staff at third level - Total                                                                                                               Personnel enseignant - 3ème degré -
                                                         ...         ...         ...         ...         ...          ...         ...         ...      ...
         (thousands)                                                                                                                                                              Total (milliers)
         First level student enrollment - Total                                                                                                                 Elèves inscrits - 1er degré - Total
                                                         ...         ...         ...         ...         ...          ...         ...         ...      ...
         (thousands)                                                                                                                                                                      (milliers)
         First level student enrollment -                                                                                                                    Elèves inscrits - 1er degré - Femmes
                                                         ...         ...         ...         ...         ...          ...         ...         ...      ...
         Female (thousands)                                                                                                                                                                (milliers)
         Second level student enrollment -                                                                                                                    Elèves inscrits - 2ème degré - Total
                                                         ...         ...         ...         ...         ...          ...         ...         ...      ...
         Total (thousands)                                                                                                                                                               (milliers)
         Second level student enrollment -                                                                                                                          Elèves inscrits - 2ème degré -
                                                         ...         ...         ...         ...         ...          ...         ...         ...      ...
         Female (thousands)                                                                                                                                                     Femmes (milliers)
         Third level student enrollment - Total                                                                                                               Elèves inscrits - 3ème degré - Total
                                                         ...         ...         ...         ...         ...          ...         ...         ...      ...
         (thousands)                                                                                                                                                                     (milliers)
         Third level student enrollment -                                                                                                                           Elèves inscrits - 3ème degré -
                                                         ...         ...         ...         ...         ...          ...         ...         ...      ...
         Female (thousands)                                                                                                                                                     Femmes (milliers)
         Public expenditure on education (%                                                                                                                     Dépenses publiques consacrées à
                                                         ...         ...         ...         ...         ...          ...         ...         ...      ...
         of budget)                                                                                                                                               l'enseignement (% du budget)

         Health                                                                                                                                                                             Santé

         Hospital beds - Total (per 10 000                                                                                                                      Nombre de lits d'hôpitaux - Total
                                                         ...         ...        34           2           2             2          2            2        2
         population)                                                                                                                                                               (pour 10 000)
         Nurses - Total (per 10 000                                                                                                                            Nombre d'infirmières - Total (pour
                                                         ...          1          1           0           0             1           1           1        1
         population)                                                                                                                                                                     10 000)
         Physicians - Total (per 10 000                                                                                                                        Nombre de médecins - Total (pour
                                                         ...          0          0           0           0             0           0           0        0
         population)                                                                                                                                                                   10 000)
         Public expenditure on Health (% of                                                                                                                  Dépenses publiques consacrées à la
                                                          8           8          8           8           8            ...         ...         ...      ...
         budget)                                                                                                                                                          santé (% du budget)


      African Statistical Yearbook 2011 / Annuaire Statistique pour l'Afrique 2011
Sierra Leone                                                                                                                                                 Sierra Leone
                                                       II NATIONAL ACCOUNTS — COMPTES NATIONAUX

                                          2002        2003        2004        2005        2006        2007         2008        2009      2010

Gross domestic product by kind of economic activity at current prices
                                                                                              Produit intérieur brut par branche d'activité économique aux prix courants


Leone (Millions)                                                                                                                                                 Leone(Millions)

Agriculture                             1 121 145   1 414 479   1 737 176   2 135 323   2 488 576   3 240 402    3 721 762   4 306 282      ...                            Agriculture

Mining and quarrying                     122 079     220 501     254 128     227 392     190 144      233 442     171 161     132 382       ...                 Industries extractives

Manufacturing                             76 994      79 224      85 206      95 624     107 908      114 586     128 082     122 316       ...            Industries manufacturières

Electricity, gas & water                  17 177      23 804      19 046      14 829      15 949       15 999      16 917      19 948       ...                 Electricité, gaz et eau

Construction                              55 228      62 770      72 057      81 134      88 431       92 674      95 936      85 364       ...          Bâtiments et travaux publics
Wholesale & retail trade,                                                                                                                             Commerce de gros et de détail,
                                         397 813     451 411     416 434     415 763     465 723      545 639     583 990     584 236       ...
restaurants, hotels                                                                                                                                            restaurants et hôtels
                                                                                                                                                       Banques, assurances, affaires
Finance, insurance, real estate, etc.    166 465     191 111     230 363     287 649     279 193      291 643     317 536     348 199       ...
                                                                                                                                                                       immobilières
Transport and communications             159 141     217 898     261 670     299 202     345 198      349 866     424 827     475 009       ...      Transport(s) et communications
                                                                                                                                                         Administrations publiques et
Public administration and defense         79 467     123 161     142 147     169 458     223 474      224 005     215 951     274 554       ...
                                                                                                                                                                             défense
Other services                           429 687     417 353     429 750     432 562     460 751      492 259     609 696     728 319       ...                        Autres services
                                                                                                                                                      Moins Services d’intermédiation
Less Imputed Service Charges             - 24 057    - 33 125    - 22 124    - 65 009    - 71 068     - 78 157   - 105 210   - 126 328      ...
                                                                                                                                                                            financière
Gross domestic product at factor                                                                                                                  Produit intérieur brut aux couts des
                                        2 601 140   3 168 590   3 625 852   4 093 927   4 594 280   5 522 357    6 180 649   6 950 282      ...
cost / basic prices                                                                                                                                             facteurs / prix de base

Plus: Indirect Taxes / taxes on                                                                                                                   Plus taxes indirectes/impôts sur les
                                         150 394     180 183     205 527     213 642     280 799      302 727     357 365     420 503       ...
products, less subsidies                                                                                                                              produits, moins les subventions


Expenditure on Gross domestic product at current purchaser's values
                                                                                                          Emploi du produit intérieur brut aux prix courants d'acquisition

Leone (Millions)                                                                                                                                                 Leone(Millions)
                                                                                                                                                            Consommation finale des
Government final consumption             265 072     335 156     446 189     691 070     761 710      756 086     941 478    1 103 894      ...
                                                                                                                                                            administrations publiques

Private final consumption               3 867 639   3 909 616   4 374 878   4 392 514   4 502 740   4 545 625    4 890 660   5 891 009      ...           Consommation finale privée

Gross fixed capital formation            190 589     230 182     263 749     355 994     360 225      355 296     428 359     504 900       ...        Formation brute de capital fixe

Increase in inventories                 - 681 042     - 1 656   - 235 718   - 211 639    258 805    1 418 448    1 537 383    942 083       ...                   Variation des stocks

Exports of goods and services            298 782     483 337     665 034     870 592     918 614    1 009 612    1 082 595   1 059 017      ...     Exportations de biens et services
                                                                                                                                                                                          291
                                                                                                                                                       Moins importations de biens et
Less imports of goods and services      1 189 506   1 607 863   1 682 752   1 790 961   1 927 015   2 259 984    2 342 461   2 130 118      ...
                                                                                                                                                                             services
GDP at purchasers' values               2 751 534   3 348 773   3 831 380   4 307 570   4 875 079   5 825 084    6 538 014   7 370 785      ...             PIB aux prix d'acquisition


Gross domestic product by kind of economic activity at constant
                                                                                            Produit intérieur brut par branche d'activité economique aux prix constants
prices
Annual Growth Rates (%)                                                                                                                    Taux de croissance annuel (%)
Agriculture                                  30.3         9.5        15.3        13.3         5.0          4.2         4.2         3.8      ...                            Agriculture

Mining and quarrying                         60.6        54.4        19.3        -4.8        -5.1        20.8        -32.5       -26.4      ...                 Industries extractives

Manufacturing                                14.0        -5.1        -1.2         4.4        12.7          2.1         1.2        -1.4      ...            Industries manufacturières

Electricity, gas & water                      8.6         6.0       -23.7       -29.2        -3.1         -5.6      114.9         -6.0      ...                 Electricité, gaz et eau

Construction                                 26.8        14.6        12.6        22.3         2.0          4.0         2.4        -2.6      ...          Bâtiments et travaux publics
Wholesale & retail trade,                                                                                                                                    Commerce de gros et de
                                             22.2         2.2       -12.6         1.3        14.1        16.0          3.7         4.3      ...
restaurants, hotels                                                                                                                                        détail,restaurants et hôtels
                                                                                                                                                        Banques, assurances, affaires
Finance, insurance, real estate, etc.         9.7        17.9         8.8         8.2         5.1         -7.5         8.5        -1.0      ...
                                                                                                                                                                        immobilières
Transport and communications                 13.3        44.3       -11.4        20.0         7.0        18.5         25.9         6.5      ...      Transport(s) et communications
                                                                                                                                                         Administrations publiques et
Public administartion and defense           -11.2        44.1         0.9         6.5        20.4        -10.2       -16.0        23.4      ...
                                                                                                                                                                             défense
Other services                                5.5        -6.9        10.4         1.2         5.7          2.4        14.3         7.6      ...                        Autres services
                                                                                                                                                      Moins Services d’intérmediation
Less Imputed Service Charges                 32.3        46.4       -42.7      178.8         26.5          0.5        39.6        15.8      ...
                                                                                                                                                                            financière
Gross domestic product at factor                                                                                                                  Produit intérieur brut aux couts des
                                             20.9        11.1         7.7         7.9         6.0          6.0         4.0         3.2      ...
cost / basic prices                                                                                                                                             facteurs / prix de base

Plus: Indirect Taxes / taxes on                                                                                                                   Plus taxes indirectes/impôts sur les
                                            -24.7         4.4        60.3         0.7        34.9        13.2          9.9        23.3      ...
products, less subsidies                                                                                                                              produits, moins les subventions

Gross domestic product at market                                                                                                                    Produit intérieur brut aux prix du
                                             18.2        10.9         9.6         7.5         7.4          6.4         4.4         4.5      ...
prices                                                                                                                                                                         marché


                                                                                                African Statistical Yearbook 2011 / Annuaire Statistique pour l'Afrique 2011
Sierra Leone                                                                                                                                          Sierra Leone

         Expenditure on Gross domestic product at constant purchasers'
                                                                                                      Emplois du produit intérieur brut aux prix constants d'acquisition
         values

         Annual Growth Rates (%)                                                                                                            Taux de croissance annuel (%)
                                                                                                                                                              Consommation finale des
         Government final consumption               23.3     15.2     27.5       48.1         4.6      -11.6       15.8         8.7          ...
                                                                                                                                                              administrations publiques

         Private final consumption                   4.5     -7.9      7.2       -4.0        -5.5       -7.5        0.1        11.7          ...            Consommation finale privée

         Gross fixed capital formation              32.8     10.0      9.8       29.1        29.6      -35.0       12.1         9.3          ...        Formation brute de capital fixe

         Exports of goods and services              40.7     47.4     31.8       25.2         0.1       -2.1       -0.3        -9.3          ...      Exportations de biens et services

                                                                                                                                                        Moins importations de biens et
         Less imports of goods and services         13.4     23.1      0.3        1.8         2.1        4.4       -3.6       -15.7          ...
                                                                                                                                                                              services


                                                                                 III INFLATION

                                                   2002     2003     2004      2005       2006       2007       2008        2009        2010
         Annual Growth Rates (%)                                                                                                            Taux de croissance annuel (%)
         All Item                                   -3.2      7.6     14.2       12.0         9.7      11.6       14.6          6.4       16.5                                Ensemble

         Food                                         ...      ...      ...       9.3         7.8      13.6       23.4          6.2         8.6                            Alimentation

         Health                                       ...      ...      ...      12.6         9.2      16.6         4.7         9.0       35.4                                    Santé

         Energy                                       ...      ...      ...      18.8       14.0         9.6      17.7          7.8       16.9                                   Energie

         Transport                                    ...      ...      ...      15.0       15.2         7.0      11.9         -2.1       18.6                                Transport


                                                       IV AGRICULTURAL PRODUCTION - PRODUCTION AGRICOLE

                                                   2002     2003     2004      2005       2006       2007       2008        2009        2010
         Tons (Thousand)                                                                                                                                         Tonnes (milliers)
         Cocoa, metric tons (thousands)            1 178    2 733    6 188      6 635     13 940     13 722     17 892      18 807      21 349                  Cacao, tonnes (milliers)

         Coffe, metric tons (thousands)              113      118    1 532      1 475      2 483      1 958      1 958       2 078       2 138                    Café, tonnes (milliers)
         Oilpalm Fruit, metric tons
                                                     235      245      250       263         276        289        269         279         274         Huile de palme, tonnes (milliers)
         (thousands)
         Rice, Tons (thousands)                      422      445      542       759       1 062      1 433      1 451       2 042       2 346                     Riz, tonnes (milliers)

         Cassava, tons (thousands)                   896    1 091    1 758      2 287      2 973      3 865      3 865       4 265       4 465                 Manioc, tonnes (milliers)


                                                            V MINING PRODUCTION - PRODUCTION MINIERE
292
                                                   2002     2003     2004      2005       2006       2007       2008        2009        2010


         Diamond, carats (thousands)               351.7    506.8    691.8      668.7      582.3      604.7      330.9       400.4       525.5               Diamants, carats (milliers)

         Bauxite, metric tons (thousands)             ...      ...      ...        ...    1 071.1    1 169.0     954.4       742.8       905.1 Bauxite, tonnes métriques (milliers)


         Rutile, metric tons (thousands)              ...      ...      ...        ...   73 600.0   82 805.0   78 908.0    63 864.0    73 174.1      Rutile, tonnes métriques (milliers)


                                                                              VI ENERGY - ENERGIE

                                                   2002     2003     2004      2005       2006       2007       2008        2009        2010

         Electricity - total hydro production,                                                                                                      Électricité - production hydraulique
                                                   141.9    129.6    106.7       73.5        33.0       42.7     140.0           ...         ...
         kilowatt hours (millions)                                                                                                                     totale, kilowatt-heures (millions)

         Electricity - total thermal production,                                                                                                      Électricité - production thermique
                                                   140.7    127.6    102.9       64.8        37.0       42.0         ...         ...         ...
         kilowatt hours (millions)                                                                                                                     totale, kilowatt-heures (millions)

         Electricity - total production, self-                                                                                                     Electricité - Production totale privée
                                                      31       30       30        27          27         27          ...         ...         ...
         producer (Million Kilowatt Hours)                                                                                                                   (million de kilowatt heures)

         Electricity - total production, public                                                                                                           Electricité - Production totale
                                                     126      114       90        57          14         33          ...         ...         ...
         (Million Kilowatt Hours)                                                                                                                  publique (million de kilowatt heures)


      African Statistical Yearbook 2011 / Annuaire Statistique pour l'Afrique 2011
Sierra Leone                                                                                                                                                             Sierra Leone
                                         VII TOURISM AND INFRASTRUCTURE - TOURISME ET INFRASTUCTURE

                                           2002         2003         2004         2005         2006         2007         2008         2009         2010

Arrivals - Tourists (thousands)            28.463       37.201        43.56       40.023       33.704       32.223        35.67       36.775          38.5            Arrivées - touristes (milliers)

Rooms in hotels and similar                                                                                                                               Chambres d'hotels et établissements
establishments (thousands)                  0.993        1.718        2.331        2.519        2.642        2.814        3.002        2.997        2.997                  assimilés (milliers)

Paved Road (% of total)                          8           ...          ...          ...          ...          ...          ...          ...          ...        Routes asphaltées (% du total)
Total Network (Railways-km)                      0            0           0            0            0            0            0             0            0          Réseau total voies ferrées-Km
Main Telephone Lines (per 1,000                                                                                                                                   Lignes téléphoniques fixes (pour
                                                 5           5            5            6            6            6            6            ...          ...
inhabitants)                                                                                                                                                                      1000 habitants)
Mobile Cellular Subscribers (per                                                                                                                                  Abonnés aux téléphones mobiles
                                               15           24           23           22           21          143          181            ...          ...
1,000 inhabitants)                                                                                                                                                         (pour 1000 habitants)


                          VII FINANCIAL AND MONETARY STATISTICS - FINANCES ET STATISTIQUES MONETAIRES

                                           2002         2003         2004         2005         2006         2007         2008         2009         2010

VII-1 Monetary Statistics                                                                                                                                VII-1 Statistiques monétaires
Leone (Millions)                                                                                                                                                              Leone(Millions)
Money supply (M1)                         247 473      292 983      344 471      424 173      489 298      549 581      666 668      807 479     1 048 060                  Masse monétaire (M1)
Quasi-money                               129 360      166 181      207 057      300 005      390 210      529 121      654 564      877 499     1 188 480                          Quasi-monnaie
  of which Demand Deposit                       ...          ...          ...          ...          ...          ...          ...          ...          ...              dont Monnaie scripturale
Net foreign assets                       - 235 193    - 313 543    - 205 436     - 11 910     554 281      775 453      724 847      907 850      965 878                    Avoirs extérieurs nets
Domestic credit                           795 999      880 836      875 977      875 433      978 977       37 656      428 627      689 067     1 398 040                          Crédit intérieur

of which claims on private sector          56 719       93 317      135 486      159 647      189 181      263 750      413 439      600 982      789 983       dont créances sur le secteur privé

of which Claims on government                                                                                                                                          dont créances nettes sur le
                                          721 482      769 128      721 227      689 650      765 301     - 246 700     - 31 674      20 993      526 827
sector, net                                                                                                                                                                        gouvernement
International reserves (millions of US                                                                                                                        Réserves internationales (millions de
                                               85           67          125          171          184          217          220          405            ...
$)                                                                                                                                                                                            $ EU)
Average Exchange Rate (National                                                                                                                                Taux de change (moyen) (monnaie
                                         2 099.03     2 347.94     2 701.30     2 889.59     2 961.91      2 985.19     2 981.51     3 385.65           ...
Currency per us $)                                                                                                                                                         nationale par dollars)


VII-2 Public Finance                                                                                                                                              VII-2 Finances publiques
Leone (Millions)                                                                                                                                                              Leone(Millions)
Total Revenues and Grants                 378 282      467 000      616 342      810 199      842 195      776 156     1 073 981    1 250 547    1 360 200                Recettes totales et dons
  Tax Revenue                             223 470      267 960      319 269      392 769      416 742      454 537      567 644      632 405      852 600                         Recettes fiscales
  Non Tax Revenue                          15 218       19 697       37 697       65 560       78 903       82 327      125 056      117 805      156 770                    Recettes non fiscales
  Grants                                  139 594      179 343      259 376      351 870      346 550      239 292      381 281      500 337      350 830                                     Dons      293
Total Expenditures and Net Lending        562 268      597 997      688 092      828 303      915 457      835 454     1 240 907    1 452 247    1 686 335          Dépenses totales et prêts nets

  Current expenditure                     474 828      485 367      555 046      620 728      699 201      658 765      909 558      999 969     1 137 548                    Dépenses courantes
  Of which Wages and Salaries             142 769      160 091      178 751      229 440      271 531      296 509      356 210      401 536      472 439           Dont rémunérations et salaires
  Capital expenditure                      85 766      112 313      134 523      203 993      214 557      173 764      333 274      452 278      548 787                 Dépenses d'équipement
  Net Lending                               1 674          317       - 1 477       3 582        1 699        2 925       - 1 925           ...          ...                              Prêts nets
Fiscal Balance                           - 183 986    - 130 997     - 71 750     - 18 104     - 73 262     - 59 298    - 166 926    - 201 700    - 326 135         Solde global y compris les dons


VII-3 Balance of Payments                                                                                                                                     VII-3 Balance des paiements
Leone (Millions)                                                                                                                                                              Leone(Millions)
Trade balance                            - 409 525    - 469 367    - 324 807    - 514 449    - 264 522    - 318 135    - 589 392    - 817 778           ...                  Balance commerciale
Services Balance                          - 89 055     - 65 101     - 83 396     - 38 190    - 128 415    - 157 220    - 190 893    - 214 042           ...                   Balance des services
Net Income                                 - 6 001     - 35 254    - 181 069    - 147 113    - 117 470    - 311 282    - 222 954    - 132 107           ...                           Revenus nets
Current transfers, net total              350 870      375 267      321 766      396 525      228 969      308 607      331 074      500 007            ...                    Transferts courants
Current account balance                  - 153 711    - 194 455    - 267 506    - 303 227    - 281 438    - 478 029    - 672 166    - 663 920           ...              Solde du compte courant


VII-4 External Debt and Financial Flows                                                                                                     VII-4 Dette extérieure et flux financiers
US $ (Millions)                                                                                                                                                                $ E.U (Millions)
Total external debt                         1 573        1 679        1 882        1 781        1 583          555          647          744            ...                 Dette extérieure totale
  Private                                     123          135          153          271          256          262          273          271            ...                                  Privée
  Public                                    1 450        1 544        1 729        1 510        1 327          293          374          473            ...                               Publique
Total external debt service                    39           24           38           40           33           21           13             4           ...          Service de la dette extérieure
Net Foreign Direct Investment                                                                                                                                 Investissements étranger direct (flux
                                               10            9           61           83           59           97           53           33            ...
Inflows                                                                                                                                                                             nets entrants)
Net Total Official Development                                                                                                                                   Aide publique au développement
                                              383          337          376          340          338          545          367          437            ...
assistance                                                                                                                                                                          (nette totale)


                                                                                                      African Statistical Yearbook 2011 / Annuaire Statistique pour l'Afrique 2011
Sierra Leone                                                                                                                                                Sierra Leone

                                             2002         2003         2004         2005         2006        2007        2008        2009         2010

         Leone (Millions)                                                                                                                                                             Leone
         Exports, fob                                                                                                                                                  Exportations, fàb


         Exports - Total                    125 605      260 129      416 200      530 618      775 658     862 346     815 532     915 269            ...                Exportations - Total


         Main Products                                                                                                                                                 Principaux produits


         Diamond                             87 390      180 007      341 352      409 526      362 181     423 943     293 651     267 509            ...                            Diamant


         Rutile                                   ...          ...          ...          ...     84 654     113 846     109 127     121 704            ...                               Rutile


         Coffee                                   ...         97          146        2 511        3 230       5 539       4 419      42 727            ...                                Café


         Cocoa                                  577        5 852       14 451       15 077       34 408      33 926      44 807      66 385            ...                              Cacao


         Bauxite                                  ...          ...          ...          ...     69 952      97 597      83 647      64 258            ...                             Bauxite

         Main Destinations                                                                                                                                        Principales destinations

         Belgium                            94 548.2    220 642.6    339 724.9    410 853.0    354 620.5   436 257.7   291 015.4          ...          ...                            Belgique


         France                             78 283.4    101 756.6     67 302.4     40 049.6     59 754.0   101 826.2    96 328.2          ...          ...                             France


         United States                       8 590.1     15 776.9     29 899.6     28 672.2    129 994.1   174 698.0   168 149.9          ...          ...                          Etats-Unis


         Germany                            80 330.7     47 637.9     64 509.7     82 775.1     70 164.7    94 728.3    42 150.4          ...          ...                          Allemagne


         India                               3 245.3     18 817.3      8 269.8      9 767.6      5 970.9    10 952.3   149 813.9          ...          ...                                Inde


                                             2002         2003         2004         2005         2006        2007        2008        2009         2010
         Imports, cif                                                                                                                                                   Importations, cif

294      Imports - Total                    535 130      729 496      741 008     1 045 067    1 040 180   1 180 481   1 404 925   1 733 047           ...      Importations - Total (millions)


                                                                                                                                                                       Principaux produits
         Main Products


         Fuels, lubricants, etc.            108 649      182 304      255 943      333 907      435 639     503 093     597 095     427 422     2 297 156         Carburants, lubrifiants, etc.


         Food and live animals              148 303      174 361      154 058      153 533      166 293     202 741     345 636     353 744     1 221 947      Alimentaire et animaux vivants


         Machines, transport equipments     105 340      132 087      138 268      207 698      204 517     224 160     225 184     323 038     1 184 597 Machines, équipements de transport


         Manufactured goods                  75 549       96 713       86 376      117 473      143 990     154 872     169 474     224 850      810 659                   Biens manifacturés


                                                                                                                                                                 Produits chimiques, produits
         Chemicals, related products nes     38 506       45 161       47 476       65 591       71 100      92 545      73 035     113 426      415 697
                                                                                                                                                                               connexes nda


         Main Origin                                                                                                                                              Principales provenances

         Germany                           238 538.2    290 067.8    178 050.6    297 402.1     36 348.6    53 783.9    42 616.6          ...          ...                          Allemagne

         U.K.                              100 922.9    124 011.8    118 952.8    137 253.7    101 133.0   107 705.4   147 263.2          ...          ...                       Royaume Uni

         Cote d'Ivoire                      57 996.9     92 112.1    114 831.4    177 654.8    140 820.1   123 869.0   152 358.8          ...          ...                       Côte d'Ivoire

         United States                      53 443.6     66 250.7    109 223.4    109 249.6    116 243.5   165 403.2   176 288.8          ...          ...                          Etats-Unis

         China                              30 248.4     38 949.1     76 331.0     88 873.2    115 451.1   174 865.4   233 933.1          ...          ...                               Chine


      African Statistical Yearbook 2011 / Annuaire Statistique pour l'Afrique 2011
Somalia                                                                                                                                                                        Somalie

AREA (KM 2)                                                                                   637 660                                                                   SUPERFICIE (KM 2)
CAPITAL CITY                            Mogadishu                                                                                     Mogadiscio                                    CAPITALE
CURRENCY                                Somali Shilling                                                                        Shilling Somalien                                    MONNAIE


                      I SOCIAL AND DEMOGRAPHIC INDICATORS — INDICATEURS DEMOGRAPHIQUES ET SOCIAUX

                                           2002        2003        2004        2005        2006             2007        2008        2009        2010
Population                                                                                                                                                                       Population
                                                                                                                                                             Population au milieu de l'année -
Mid-year population - Total (Million)          7.8         8.0         8.2         8.4         8.5              8.7         8.9         9.1         9.4
                                                                                                                                                                                Total (million)
                                                                                                                                                             Population au milieu de l'année -
Mid-year population - Urban (%)              34.0         34.4        34.8        35.2        35.6            36.0         36.5        37.0        37.4
                                                                                                                                                                                Urbaine (%)

Female (%)                                   58.4         59.7        60.7        61.4        61.6            61.6         61.3        61.0        60.9                            Femme (%)


Population by Age Group                                                                                                                                           Population par groupe d'âge


   0-14                                  3457 187     3547 803    3637 735    3728 934    3820 574        3911 656     4003 922    4099 738    4200 677                                    0-14


   15-64                                 4112 153     4205 871    4299 603    4393 762    4487 369        4580 958     4678 371    4784 833    4904 036                                   15-64


   65+                                    238 041      244 390     250 460     256 112     261 236         265 948      270 605     275 725     281 698                                    65+


Active Population (000)                    3 075.0     3 153.0     3 228.0     3 305.0     3 381.0          3 462.0     3 542.0     3 631.0          ...               Population active (000)

   Female (%)                                38.5         38.6        38.7        38.8        38.9            38.9         39.0        39.1          ...                           Femme (%)

                                                                                                                                                             Taux brut de natalité - Total (par
Crude birth rate - Total (per 1000)          45.7         45.6        45.3        45.1        44.8            44.5         44.1        43.7          ...
                                                                                                                                                                                         1000)
                                                                                                                                                           Taux brut de mortalité - Total (par
Crude death rate - Total (per 1000)          16.4         16.2        16.1        16.0        16.0            15.9         15.7        15.5          ...
                                                                                                                                                                                        1000)
Life expectancy at birth - Total                                                                                                                             Espérance de vie à la naissance -
                                             49.1         49.3        49.5        49.5        49.6            49.7         49.9        50.1          ...
(years)                                                                                                                                                                        Total (années)
Net reproduction rate - (per                                                                                                                                  Taux net de reproduction - (par
                                                ...         ...         ...        2.1          ...              ...         ...         ...         ...
woman)                                                                                                                                                                                femme)
                                                                                                                                                             Indice synthétique de fécondité -
Total fertility rate - (per woman)             6.5         6.5         6.5         6.5         6.4              6.4         6.4         6.4          ...
                                                                                                                                                                                 (p
                                                                                                                                                                                 (par femme) )

Education                                                                                                                                                                   Enseignement

Teaching staff at first level - Total                                                                                                                    Personnel enseignant - 1er degré -
                                                ...         ...         ...         ...         ...           12.9           ...         ...         ...
(thousands)                                                                                                                                                                 Total (milliers)
Teaching staff at second level -                                                                                                                           Personnel enseignant - 2ème degré        295
                                                ...         ...         ...         ...         ...             4.5          ...         ...         ...
Total (thousands)                                                                                                                                                            - Total (milliers)
Teaching staff at third level - Total                                                                                                                      Personnel enseignant - 3ème degré
                                                ...         ...         ...         ...         ...              ...         ...         ...         ...
(thousands)                                                                                                                                                                  - Total (milliers)
First level student enrollment -                                                                                                                             Elèves inscrits - 1er degré - Total
                                                ...         ...         ...         ...         ...            457           ...         ...         ...
Total (thousands)                                                                                                                                                                      (milliers)
First level student enrollment -                                                                                                                                   Elèves inscrits - 1er degré -
                                                ...         ...         ...         ...         ...            162           ...         ...         ...
Female (thousands)                                                                                                                                                           Femmes (milliers)
Second level student enrollment -                                                                                                                          Elèves inscrits - 2ème degré - Total
                                                ...         ...         ...         ...         ...             87           ...         ...         ...
Total (thousands)                                                                                                                                                                     (milliers)
Second level student enrollment -                                                                                                                               Elèves inscrits - 2ème degré -
                                                ...         ...         ...         ...         ...             27           ...         ...         ...
Female (thousands)                                                                                                                                                          Femmes (milliers)
Third level student enrollment -                                                                                                                           Elèves inscrits - 3ème degré - Total
                                                ...         ...         ...         ...         ...              ...         ...         ...         ...
Total (thousands)                                                                                                                                                                     (milliers)
Third level student enrollment -                                                                                                                                Elèves inscrits - 3ème degré -
                                                ...         ...         ...         ...         ...              ...         ...         ...         ...
Female (thousands)                                                                                                                                                          Femmes (milliers)
Public expenditure on education (%                                                                                                                           Dépenses publiques consacrées à
                                                ...         ...         ...         ...         ...              ...         ...         ...         ...
of budget)                                                                                                                                                     l'enseignement (% du budget)

Health                                                                                                                                                                                  Santé

Hospital beds - Total (per 10 000                                                                                                                            Nombre de lits d'hôpitaux - Total
                                                ...         ...         ...         ...         ...              ...         ...         ...         ...
population)                                                                                                                                                                     (pour 10 000)
Nurses - Total (per 10 000                                                                                                                                  Nombre d'infirmières - Total (pour
                                                ...         ...         ...         ...         ...              ...         ...         ...         ...
population)                                                                                                                                                                           10 000)
Physicians - Total (per 10 000                                                                                                                             Nombre de médecins - Total (pour
                                                ...         ...         ...         ...         ...              ...         ...         ...         ...
population)                                                                                                                                                                        10 000)
Public expenditure on Health (% of                                                                                                                           Dépenses publiques consacrées à
                                                ...         ...         ...         ...         ...              ...         ...         ...         ...
budget)                                                                                                                                                              la santé (% du budget)


                                                                                                      African Statistical Yearbook 2011 / Annuaire Statistique pour l'Afrique 2011
Somalia                                                                                                                                                                        Somalie
                                                                 II NATIONAL ACCOUNTS — COMPTES NATIONAUX

                                                    2002         2003         2004         2005         2006          2007          2008         2009       2010

         Gross domestic product by kind of economic activity at current
         prices                                                                                           Produit intérieur brut par branche d'activité économique aux prix courants


         Somali Shilling (Millions)                                                                                                                                  Shilling Somalien(Millions)

         Agriculture                             13 006 007 14 306 662 15 745 383 18 638 987 17 784 767            18 944 523    19 795 047 20 801 577         ...                           Agriculture

         Mining and quarrying                      145 153      158 680      176 813      208 020      199 714       212 303       221 682      233 220        ...                 Industries extractives

         Manufacturing                             536 317      586 899      650 788      768 598      735 080       782 412       817 326      859 255        ...           Industries manufacturières

         Electricity, gas & water                        ...          ...          ...          ...          ...           ...           ...          ...      ...                Electricité, gaz et eau

         Construction                              909 250      996 149     1 097 202    1 303 052    1 239 314     1 321 553     1 381 385    1 450 755       ...         Bâtiments et travaux publics
         Wholesale & retail trade,                2 298 595    2 521 534    2 777 446    3 294 130    3 137 188     3 343 879     3 494 747    3 671 153       ...      Commerce de gros et de détail,
         restaurants, hotels                                                                                                                                                     restaurants et hôtels
                                                                                                                                                                         Banques, assurances, affaires
         Finance, insurance, real estate, etc.           ...          ...          ...          ...          ...           ...           ...          ...      ...
                                                                                                                                                                                         immobilières
         Transport and communications             2 090 407    2 213 964    2 418 795    2 995 774    2 732 083     2 954 969     3 103 344    3 233 784       ...      Transport(s) et communications
                                                                                                                                                                           Administrations publiques et
         Public administration and defense        2 658 579    2 996 230    3 278 370    3 810 026    3 702 993     3 920 555     4 088 170    4 310 671       ...
                                                                                                                                                                                               défense
         Other services                                  ...          ...          ...          ...          ...           ...           ...          ...      ...                       Autres services
                                                                                                                                                                       Moins Services d’intermédiation
         Less Imputed Service Charges                    ...          ...          ...          ...          ...           ...           ...          ...      ...
                                                                                                                                                                                               financière
         Gross domestic product at factor                                                                                                                          Produit intérieur brut aux couts des
                                                 21 644 308 23 780 119 26 144 796 31 018 588 29 531 140            31 480 193    32 901 701 34 560 414         ...
         cost / basic prices                                                                                                                                                     facteurs / prix de base

         Plus: Indirect Taxes / taxes on                                                                                                                             Plus taxes indirectes/impôts sur les
                                                  2 770 021    3 075 461    3 396 544    4 296 241    4 147 850     4 289 905     4 553 899    4 782 372       ...
         products, less subsidies                                                                                                                                        produits, moins les subventions


         Expenditure on Gross domestic product at current purchaser's
         values                                                                                                         Emploi du produit intérieur brut aux prix courants d'acquisition

         Somali Shilling (Millions)                                                                                                                                  Shilling Somalien(Millions)
                                                                                                                                                                              Consommation finale des
         Government final consumption             2 096 254    2 414 300    2 665 280    3 059 344    2 919 146     3 142 143     3 260 496    3 430 270       ...
                                                                                                                                                                              administrations publiques

         Private final consumption               17 654 292 19 850 637 21 846 596 25 560 510 24 377 836            26 078 132    27 176 126 28 568 546         ...          Consommation finale privée

         Gross fixed capital f
         G     fi d     it l formation
                                  ti              4 979 850    4 951 139    5 425 726    7 159 020    6 824 811     7 023 202     7 512 416    7 862 713       ...       Formation b t d capital fi
                                                                                                                                                                         F    ti brute de   it l fixe

         Increase in inventories                    18 230            ...          ...     22 946       21 816        15 471        21 600       21 730        ...                  Variation des stocks

296      Exports of goods and services              79 165       70 195       76 852      111 107      105 774       105 979       115 483      120 476        ...     Exportations de biens et services
                                                                                                                                                                         Moins importations de biens et
         Less imports of goods and services        413 462      430 691      473 114      598 098      570 393       594 829       630 522      660 949        ...
                                                                                                                                                                                               services
         GDP at purchasers' values               24 414 329 26 855 580 29 541 340 35 314 829 33 678 990            35 770 098    37 455 600 39 342 786         ...             PIB aux prix d'acquisition


         Gross domestic product by kind of economic activity at constant
                                                                                                         Produit intérieur brut par branche d'activité economique aux prix constants
         prices
         Annual Growth Rates (%)                                                                                                                             Taux de croissance annuel (%)
         Agriculture                                    0.9          1.0          2.4          2.1          3.9           1.9           2.6          2.9       ...                           Agriculture

         Mining and quarrying                          12.2         13.0          5.9          7.1         -1.0           3.6           3.1          1.9       ...                 Industries extractives

         Manufacturing                                 10.7         10.6          5.1          6.1         -0.1           3.3           3.0          2.1       ...           Industries manufacturières

         Electricity, gas & water                        ...          ...          ...          ...          ...           ...           ...          ...      ...                Electricité, gaz et eau

         Construction                                   5.8          7.3          4.0          4.3          1.7           2.7           2.8          2.4       ...         Bâtiments et travaux publics
         Wholesale & retail trade,                                                                                                                                            Commerce de gros et de
                                                        5.2          7.3          4.0          4.2          1.8           2.6           2.8          2.5       ...
         restaurants, hotels                                                                                                                                                détail,restaurants et hôtels
                                                                                                                                                                          Banques, assurances, affaires
         Finance, insurance, real estate, etc.           ...          ...          ...          ...          ...           ...           ...          ...      ...
                                                                                                                                                                                           immobilières
         Transport and communications                   8.3          3.3          3.0          4.0          2.0           2.6           2.8          2.5       ...      Transport(s) et communications
                                                                                                                                                                           Administrations publiques et
         Public administartion and defense              7.6          5.8          3.7          3.8          2.2           2.5           2.7          2.5       ...
                                                                                                                                                                                               défense
         Other services                                  ...          ...          ...          ...          ...           ...           ...          ...      ...                       Autres services
                                                                                                                                                                       Moins Services d’intérmediation
         Less Imputed Service Charges                    ...          ...          ...          ...          ...           ...           ...          ...      ...
                                                                                                                                                                                               financière
         Gross domestic product at factor                                                                                                                          Produit intérieur brut aux couts des
                                                        3.2          3.0          3.0          2.9          3.1           2.2           2.6          2.7       ...
         cost / basic prices                                                                                                                                                     facteurs / prix de base

         Plus: Indirect Taxes / taxes on                                                                                                                             Plus taxes indirectes/impôts sur les
                                                        5.7          7.6          3.4          3.9         -2.3           5.6           2.3          1.9       ...
         products, less subsidies                                                                                                                                        produits, moins les subventions

         Gross domestic product at market                                                                                                                              Produit intérieur brut aux prix du
                                                        3.5          3.5          3.0          3.0          2.4           2.6           2.6          2.6       ...
         prices                                                                                                                                                                                   marché


      African Statistical Yearbook 2011 / Annuaire Statistique pour l'Afrique 2011
Somalia                                                                                                                                                               Somalie

Expenditure on Gross domestic product at constant purchasers'
                                                                                                      Emplois du produit intérieur brut aux prix constants d'acquisition
values

Annual Growth Rates (%)                                                                                                                  Taux de croissance annuel (%)
                                                                                                                                                           Consommation finale des
Government final consumption                 2.5        0.8        0.8         0.9        4.5              1.9       2.4        3.0        ...
                                                                                                                                                           administrations publiques

Private final consumption                    6.1        4.9        4.0         4.1        1.0              3.2       2.7        2.4        ...           Consommation finale privée

Gross fixed capital formation               -3.7        0.1        0.4        -0.5        6.0              1.4       2.2        3.3        ...        Formation brute de capital fixe

Exports of goods and services                0.0        6.1        2.1         1.5        3.9              2.1       4.5        6.6        ...      Exportations de biens et services

                                                                                                                                                      Moins importations de biens et
Less imports of goods and services           1.0       -1.5       -0.9        -0.3       -5.1              9.3       2.9        5.3        ...
                                                                                                                                                                            services


                                                                              III INFLATION

                                         2002       2003       2004        2005       2006             2007       2008      2009       2010
Annual Growth Rates (%)                                                                                                                   Taux de croissance annuel (%)
All Item                                      ...        ...        ...         ...        ...              ...       ...        ...       ...                              Ensemble

Food                                          ...        ...        ...         ...        ...              ...       ...        ...       ...                           Alimentation

Health                                        ...        ...        ...         ...        ...              ...       ...        ...       ...                                  Santé

Energy                                        ...        ...        ...         ...        ...              ...       ...        ...       ...                                Energie

Transport                                     ...        ...        ...         ...        ...              ...       ...        ...       ...                              Transport


                                               IV AGRICULTURAL PRODUCTION - PRODUCTION AGRICOLE

                                         2002       2003       2004        2005       2006             2007       2008      2009       2010
Tons (Thousand)                                                                                                                                                Tonnes (milliers)
Maize, Tons (thousands)                     288        269        202         200         97               99         99         ...       ...                 Maïs, tonnes (milliers)

Sorghum, Tons (thousands)                   141        121        145         140        145               80         80         ...       ...              Sorgho, tonnes (milliers)

Cassava, Tons (thousands)                    80         80         85          85         82               82         82         ...       ...              Manioc, tonnes (milliers)

Banana, Tons (thousands)                     37         37         37          38         38               38         38         ...       ...              Banane, tonnes (milliers)
                                                                                                                                                          Graines de sésame tonnes
                                                                                                                                                                     sésame,
Sesame seed, Tons (thousands)                28         30         30          30         30               30         30         ...       ...
                                                                                                                                                                          (milliers)


                                                    V MINING PRODUCTION - PRODUCTION MINIERE                                                                                              297

                                         2002       2003       2004        2005       2006             2007       2008      2009       2010

Salt and pure sodium chloride,                                                                                                                        Sel et chlorure de sodium pur,
                                         1 000.0    1 000.0    1 000.0     1 000.0    1 000.0          1 000.0        ...        ...       ...
metric tons (thousands)                                                                                                                                   tonnes métriques (milliers)
                                              ...        ...        ...         ...        ...              ...       ...        ...       ...


                                              ...        ...        ...         ...        ...              ...       ...        ...       ...


                                                                          VI ENERGY - ENERGIE

                                         2002       2003       2004        2005       2006             2007       2008      2009       2010

Electricity - total hydro production,                                                                                                            Électricité - production hydraulique
                                              ...     10.0       11.0        11.0       12.0             15.0         ...        ...       ...
kilowatt hours (millions)                                                                                                                           totale, kilowatt-heures (millions)

Electricity - total thermal                                                                                                                        Électricité - production thermique
                                          274.0      280.0      280.0       290.0      295.0            311.0         ...        ...       ...
production, kilowatt hours (millions)                                                                                                               totale, kilowatt-heures (millions)

Electricity - total production, self-                                                                                                            Electricité - Production totale privée
                                              ...        ...        ...         ...        ...              ...       ...        ...       ...
producer (Million Kilowatt Hours)                                                                                                                          (million de kilowatt heures)

                                                                                                                                                        Electricité - Production totale
Electricity - total production, public
                                            274        290        291         301        307              326         ...        ...       ...           publique (million de kilowatt
(Million Kilowatt Hours)
                                                                                                                                                                               heures)


                                                                                                 African Statistical Yearbook 2011 / Annuaire Statistique pour l'Afrique 2011
Somalia                                                                                                                                                             Somalie
                                                  VII TOURISM AND INFRASTRUCTURE - TOURISME ET INFRASTUCTURE

                                                   2002         2003         2004        2005       2006       2007       2008       2009     2010

         Arrivals - Tourists (thousands)                 ...          ...          ...        ...        ...        ...        ...      ...       ...           Arrivées - touristes (milliers)

         Rooms in hotels and similar                                                                                                                    Chambres d'hotels et établissements
         establishments (thousands)                                                                                                                                      assimilés (milliers)
                                                         ...          ...          ...        ...        ...        ...        ...      ...       ...
         Paved Road (% of total)                         ...          ...          ...        ...        ...        ...        ...      ...       ...        Routes asphaltées (% du total)
         Total Network (Railways-km)                     ...          ...          ...        ...        ...        ...        ...      ...       ...         Réseau total voies ferrées-Km
         Main Telephone Lines (per 1,000                                                                                                                    Lignes téléphoniques fixes (pour
                                                          4          10           10         10         10         10         10        10        ...
         inhabitants)                                                                                                                                                       1000 habitants)
         Mobile Cellular Subscribers (per                                                                                                                  Abonnés aux téléphones mobiles
                                                        13           30           60         60         60         70         70        70        ...
         1,000 inhabitants)                                                                                                                                         (pour 1000 habitants)


                                   VII FINANCIAL AND MONETARY STATISTICS - FINANCES ET STATISTIQUES MONETAIRES

                                                   2002         2003         2004        2005       2006       2007       2008       2009     2010

         VII-1 Monetary Statistics                                                                                                                VII-1 Statistiques monétaires
         Somali Shilling (Millions)                                                                                                                      Shilling Somalien(Millions)
         Money supply (M1)                         247 478      292 950      344 524     424 173    489 298    549 581    580 274       ...       ...                 Masse monétaire (M1)
         Quasi-money                               129 360      166 383      207 057     300 005    390 210    529 121    560 192       ...       ...                         Quasi-monnaie
           of which Demand Deposit                       ...          ...          ...        ...        ...        ...        ...      ...       ...              dont Monnaie scripturale
         Net foreign assets                       - 183 182    - 247 119    - 127 895     61 250    632 374    907 585    843 366       ...       ...                 Avoirs extérieurs nets
         Domestic credit                           795 931      880 963      875 770     875 433    453 986    485 064    614 593       ...       ...                         Crédit intérieur

         of which claims on private sector          56 719       93 317      135 486     159 647    189 181    263 750    324 403       ...       ...     dont créances sur le secteur privé

         of which Claims on government                                                                                                                       dont créances nettes sur le
                                                         ...          ...          ...        ...        ...        ...        ...      ...       ...
         sector, net                                                                                                                                                       gouvernement
         International reserves (millions of US                                                                                                         Réserves internationales (millions
                                                        85           67          125        171        184        217        211        ...       ...
         $)                                                                                                                                                                     de $ EU)
         Average Exchange Rate (National                                                                                                              Taux de change (moyen) (monnaie
                                                         ...          ...          ...        ...        ...        ...        ...      ...       ...
         Currency per us $)                                                                                                                                         nationale par dollars)


         VII-2 Public Finance                                                                                                                              VII-2 Finances publiques
         Somali Shilling (Millions)                                                                                                                      Shilling Somalien(Millions)
         Total Revenues and Grants                       ...          ...          ...        ...        ...        ...        ...      ...       ...               Recettes totales et dons
           Tax Revenue                                   ...          ...          ...        ...        ...        ...        ...      ...       ...                       Recettes fiscales
           Non Tax Revenue                               ...          ...          ...        ...        ...        ...        ...      ...       ...                  Recettes non fiscales
298        Grants                                        ...          ...          ...        ...        ...        ...        ...      ...       ...                                   Dons

         Total Expenditures and Net Lending              ...          ...          ...        ...        ...        ...        ...      ...       ...        Dépenses totales et prêts nets

           Current expenditure                           ...          ...          ...        ...        ...        ...        ...      ...       ...                   Dépenses courantes
           Of which Wages and Salaries                   ...          ...          ...        ...        ...        ...        ...      ...       ...        Dont rémunérations et salaires
           Capital expenditure                           ...          ...          ...        ...        ...        ...        ...      ...       ...               Dépenses d'équipement
           Net Lending                                   ...          ...          ...        ...        ...        ...        ...      ...       ...                              Prêts nets
         Fiscal Balance                                  ...          ...          ...        ...        ...        ...        ...      ...       ...       Solde global y compris les dons


         VII-3 Balance of Payments                                                                                                                 VII-3 Balance des paiements
         Somali Shilling (Millions)                                                                                                                      Shilling Somalien(Millions)
         Trade balance                                   ...          ...          ...        ...        ...        ...        ...      ...       ...                  Balance commerciale
         Services Balance                                ...          ...          ...        ...        ...        ...        ...      ...       ...                   Balance des services
         Net Income                                      ...          ...          ...        ...        ...        ...        ...      ...       ...                           Revenus nets
         Current transfers, net total                    ...          ...          ...        ...        ...        ...        ...      ...       ...                    Transferts courants
         Current account balance                         ...          ...          ...        ...        ...        ...        ...      ...       ...             Solde du compte courant


         VII-4 External Debt and Financial Flows                                                                                        VII-4 Dette extérieure et flux financiers
         US $ (Millions)                                                                                                                                                $ E.U (Millions)
         Total external debt                             ...          ...          ...        ...        ...        ...        ...      ...       ...                Dette extérieure totale
           Private                                       ...          ...          ...        ...        ...        ...        ...      ...       ...                                  Privée
           Public                                        ...          ...          ...        ...        ...        ...        ...      ...       ...                               Publique
         Total external debt service                     ...          ...          ...        ...        ...        ...        ...      ...       ...         Service de la dette extérieure
         Net Foreign Direct Investment                                                                                                                      Investissements étranger direct
                                                          0         - 1          - 5         24         96        141         87       108        ...
         Inflows                                                                                                                                                        (flux nets entrants)
         Net Total Official Development                                                                                                                    Aide publique au développement
                                                       147          174          199        237        391        384        758       662        ...
         assistance                                                                                                                                                            (nette totale)


      African Statistical Yearbook 2011 / Annuaire Statistique pour l'Afrique 2011
Somalia                                                                                                                                              Somalie

                                     2002     2003     2004     2005     2006           2007       2008      2009       2010

US $ (Millions)                                                                                                                               Shilling Somalien
Exports, fob                                                                                                                                  Exportations, fàb


Exports - Total                         ...      ...      ...      ...      ...             ...        ...        ...       ...                  Exportations - Total


Main Products                                                                                                                                  Principaux produits


Goats, live                            10         0      27       39       33              44          28        48         ...                     Chèvres vivantes


Waste & scrap of Gold                   ...      ...      ...       0       ...              1         27         ...       ...                Déchets et débris d'or


Bovine, live except pure-bred
                                         5        4        4      48       20              16          16        37         ...        Bovins vivants excepté laitiers
breeding


Wood charcoal                            7        8        8      15       21              20          27        16         ...                      Charbon de bois


Sheep, live                              2        2        4      28         8               6         11        42         ...                      Moutons vivants

Main Destinations                                                                                                                         Principales destinations

Yemen                                  0.0      0.0     18.8     23.0     24.3            36.4       42.6       41.8        ...                               Yémen


United Arab Emirates                  73.7     81.9     85.8     87.2    193.0            41.3       62.7       80.6        ...                  Émirats arabes unis


Oman                                  10.1     42.3      7.8      7.9      7.3             7.8       13.8       63.4        ...                                Oman


India                                 17.0     43.9     45.2     36.2     57.9           108.6       99.3       18.6        ...                                  Inde


Nigeria                               11.1      4.8      0.0      0.0      2.9            48.1        7.0        0.1        ...                               Nigéria


                                     2002     2003     2004     2005     2006           2007       2008      2009       2010
Imports, cif                                                                                                                                  Importations, cif
                                                                                                                                                                         299
Imports - Total                        391      422      544      616      815            920       1 180      1 021        ...        Importations - Total (millions)


                                                                                                                                               Principaux produits
Main Products


                                                                                                                                    Sucre raffiné, sous forme solide,
Refined sugar, in solid form, nes      46       52       52       52       71              53          59        74         ...
                                                                                                                                                                  nsa


Vegetables, fresh or chilled nes         0        0        0        0        0               0         49       124         ...    Légumes, frais ou réfrigérés, nda

Foliage,branch,etc w/o                                                                                                            Feuillages, branches, etc w / fleurs
flowers/buds&grass for bouquet/orn       1        1        1        1      26              29          62          1        ...     o / bourgeons et d'herbe pour le
purp exc fr                                                                                                                                 bouquet / Orn purp HT fr
Wheat or meslin flour                    9        0      19       27       16              29          50        31         ...                     Blé nda et méteil


Vegetable products nes                 10       29         0        0      10              69          46        49         ...              Produits végétaux, NDA


Main Origin                                                                                                                              Principales provenances

United Arab Emirates                 174.1    132.7    243.8    216.9    226.2           300.0      193.9      255.6        ...                  Émirats arabes unis

Kenya                                 44.3     53.8     40.4     65.8    105.6           123.8      186.7      145.1        ...                                Kenya

India                                 17.0     43.9     45.2     36.2     57.9           108.6       99.3       18.6        ...                                  Inde

Ethiopia                               9.6     28.9     18.0     58.8     59.8            73.4       76.9      134.7        ...                              Ethiopie

Brazil                                27.7     21.6     44.3     44.9     61.5            18.6        9.1       58.3        ...                                 Brésil


                                                                                  African Statistical Yearbook 2011 / Annuaire Statistique pour l'Afrique 2011
South Africa                                                                                                                                                           Afrique du Sud

         AREA (KM 2)                                                                                       1 221 040                                                                    SUPERFICIE (KM 2)
         CAPITAL CITY                             Pretoria                                                                                                 Pretoria                                 CAPITALE
         CURRENCY                                 Rand                                                                                                       Rand                                   MONNAIE


                                 I SOCIAL AND DEMOGRAPHIC INDICATORS — INDICATEURS DEMOGRAPHIQUES ET SOCIAUX

                                                     2002         2003         2004         2005         2006         2007         2008         2009          2010
         Population                                                                                                                                                                              Population
                                                                                                                                                                             Population au milieu de l'année -
         Mid-year population - Total (Million)          46.2         46.8         47.5         48.1         48.6         49.2         49.7         50.1          50.5
                                                                                                                                                                                                Total (million)
                                                                                                                                                                             Population au milieu de l'année -
         Mid-year population - Urban (%)                57.8         58.3         58.8         59.3         59.8         60.2         60.7         61.2          61.7
                                                                                                                                                                                                Urbaine (%)

         Female (%)                                     58.7         58.3         57.9         57.6         57.3         57.1         56.9         56.6          56.3                              Femme (%)


         Population by Age Group                                                                                                                                                 Population par groupe d'âge


            0-14                                   15139 231    15171 497    15201 436    15227 027    15247 752    15264 519    15278 283    15290 439     15301 683                                      0-14


            15-64                                  29300 370    29858 418    30393 341    30897 260    31371 219    31815 227    32219 340    32571 139     32863 264                                     15-64


            65+                                     1757 881     1818 607     1882 299     1949 153     2019 547     2093 416     2170 005     2248 242      2327 461                                      65+


         Active Population (000)                    16 449.5     16 874.9     17 217.8     17 586.7     17 974.8     18 372.3     19 023.5     19 152.5      19 418.9                  Population active (000)

            Female (%)                                  44.0         44.3         44.1         44.0         43.8         43.6         43.7         43.7          43.6                              Femme (%)

                                                                                                                                                                            Taux brut de natalité - Total (par
         Crude birth rate - Total (per 1000)            24.0         24.0         24.0         23.0         23.0         22.0         22.0         22.0          22.0
                                                                                                                                                                                                        1000)
                                                                                                                                                                          Taux brut de mortalité - Total (par
         Crude death rate - Total (per 1000)            13.0         14.0         14.0         15.0         15.0         15.0         15.0         15.0          15.0
                                                                                                                                                                                                       1000)
         Life expectancy at birth - Total                                                                                                                                   Espérance de vie à la naissance -
                                                        54.0         53.0         52.0         52.0         52.0         51.0         52.0         52.0          52.0
         (years)                                                                                                                                                                              Total (années)
         Net reproduction rate - (per                                                                                                                                        Taux net de reproduction - (par
                                                          ...          ...          ...         1.0           ...          ...          ...          ...           ...
         woman)                                                                                                                                                                                      femme)
                                                                                                                                                                            Indice synthétique de fécondité -
         Total fertility rate - (p woman)
                       y        (per    )                3.0          3.0          3.0          3.0          3.0          3.0          3.0          3.0           3.0
                                                                                                                                                                                                (par femme)

         Education                                                                                                                                                                          Enseignement

         Teaching staff at first level - Total                                                                                                                            Personnel enseignant - 1er degré -
                                                      220.60        221.0        220.3        247.0        233.9        236.0           ...          ...           ...
         (thousands)                                                                                                                                                                         Total (milliers)
         Teaching staff at second level - Total                                                                                                                          Personnel enseignant - 2ème degré -
300                                                   146.64        149.0        149.4        141.6        158.4        164.7           ...          ...           ...
         (thousands)                                                                                                                                                                          Total (milliers)
         Teaching staff at third level - Total                                                                                                                           Personnel enseignant - 3ème degré -
                                                          ...          ...          ...          ...          ...          ...          ...          ...           ...
         (thousands)                                                                                                                                                                          Total (milliers)
         First level student enrollment - Total                                                                                                                             Elèves inscrits - 1er degré - Total
                                                       7 466        7 470        7 444        7 314        7 257        7 312           ...          ...           ...
         (thousands)                                                                                                                                                                                  (milliers)
         First level student enrollment -                                                                                                                                Elèves inscrits - 1er degré - Femmes
                                                       3 652        3 648        3 628        3 565        3 535        3 572           ...          ...           ...
         Female (thousands)                                                                                                                                                                            (milliers)
         Second level student enrollment -                                                                                                                                Elèves inscrits - 2ème degré - Total
                                                       4 354        4 447        4 593        4 658        4 772        4 780           ...          ...           ...
         Total (thousands)                                                                                                                                                                           (milliers)
         Second level student enrollment -                                                                                                                                      Elèves inscrits - 2ème degré -
                                                       2 250        2 289        2 367        2 392        2 446        2 437           ...          ...           ...
         Female (thousands)                                                                                                                                                                 Femmes (milliers)
         Third level student enrollment - Total                                                                                                                           Elèves inscrits - 3ème degré - Total
                                                          ...          ...          ...          ...          ...          ...          ...          ...           ...
         (thousands)                                                                                                                                                                                 (milliers)
         Third level student enrollment -                                                                                                                                       Elèves inscrits - 3ème degré -
                                                          ...          ...          ...          ...          ...          ...          ...          ...           ...
         Female (thousands)                                                                                                                                                                 Femmes (milliers)
         Public expenditure on education (%                                                                                                                                 Dépenses publiques consacrées à
                                                        18.5         18.5         18.1         17.9         17.6         17.4           ...          ...           ...
         of budget)                                                                                                                                                           l'enseignement (% du budget)

         Health                                                                                                                                                                                         Santé

         Hospital beds - Total (per 10 000                                                                                                                                  Nombre de lits d'hôpitaux - Total
                                                        371          377           28           28          408          329            ...          ...           ...
         population)                                                                                                                                                                           (pour 10 000)
         Nurses - Total (per 10 000                                                                                                                                        Nombre d'infirmières - Total (pour
                                                        371          377          388          399          408          329            ...          ...           ...
         population)                                                                                                                                                                                 10 000)
         Physicians - Total (per 10 000                                                                                                                                    Nombre de médecins - Total (pour
                                                          ...          ...         73            ...         86           75            ...          ...           ...
         population)                                                                                                                                                                               10 000)
         Public expenditure on Health (% of                                                                                                                              Dépenses publiques consacrées à la
                                                         12             9            9            9            9           ...          ...          ...           ...
         budget)                                                                                                                                                                      santé (% du budget)


      African Statistical Yearbook 2011 / Annuaire Statistique pour l'Afrique 2011
South Africa                                                                                                                                                              Afrique du Sud
                                                            II NATIONAL ACCOUNTS — COMPTES NATIONAUX

                                           2002            2003         2004         2005         2006         2007          2008          2009          2010

Gross domestic product by kind of economic activity at current prices
                                                                                                      Produit intérieur brut par branche d'activité économique aux prix courants


Rand (Millions)                                                                                                                                                                      Rand(Millions)

Agriculture                                    44 232      39 644       39 490       37 402       45 351       53 838         63 384       63 888        59 543                              Agriculture

Mining and quarrying                           92 730      85 770       91 198      105 992      132 301      156 970        201 381      198 180       230 402                   Industries extractives

Manufacturing                             204 219         223 917      243 967      259 101      274 502      304 437        340 623      330 310       352 176              Industries manufacturières

Electricity, gas & water                       26 489      29 553       30 176       33 010       36 946       41 783         45 803       60 280        66 812                   Electricité, gaz et eau

Construction                                   24 120      26 747       32 039       38 558       46 158       56 908         72 894       87 116        91 973            Bâtiments et travaux publics
Wholesale & retail trade,                                                                                                                                               Commerce de gros et de détail,
                                          143 192         158 786      176 445      195 012      215 831      238 910        271 237      294 260       335 562
restaurants, hotels                                                                                                                                                              restaurants et hôtels
                                                                                                                                                                         Banques, assurances, affaires
Finance, insurance, real estate, etc.     207 711         231 176      261 285      295 504      339 311      405 520        442 121      467 126       511 332
                                                                                                                                                                                         immobilières
Transport and communications              100 983         112 637      124 786      139 472      153 775      164 467        188 231      199 065       220 039        Transport(s) et communications
                                                                                                                                                                           Administrations publiques et
Public administration and defense         157 547         174 106      190 563      208 561      230 116      259 783        299 373      340 837       386 352
                                                                                                                                                                                               défense
Other services                                 64 475      72 814       80 651       88 455       98 028      109 445        119 220      135 537       152 747                          Autres services
                                                                                                                                                                        Moins Services d’intermédiation
Less Imputed Service Charges                       ...          ...          ...          ...          ...          ...            ...           ...          ...
                                                                                                                                                                                              financière
Gross domestic product at factor                                                                                                                                    Produit intérieur brut aux couts des
                                         1 065 697       1 155 150    1 270 600    1 401 066    1 572 320    1 792 057     2 044 267     2 176 599     2 406 938
cost / basic prices                                                                                                                                                               facteurs / prix de base

Plus: Indirect Taxes / taxes on                                                                                                                                     Plus taxes indirectes/impôts sur les
                                          105 389         117 387      144 673      170 015      195 103      224 109        229 872      219 370       255 819
products, less subsidies                                                                                                                                                produits, moins les subventions


Expenditure on Gross domestic product at current purchaser's values
                                                                                                                  Emploi du produit intérieur brut aux prix courants d'acquisition

Rand (Millions)                                                                                                                                                                      Rand(Millions)
                                                                                                                                                                              Consommation finale des
Government final consumption              219 705         244 485      274 034      305 733      347 928      380 214        428 852      505 469       553 277
                                                                                                                                                                              administrations publiques

Private final consumption                 724 228         790 389      890 952      990 772     1 116 316    1 264 726     1 398 236     1 456 089     1 624 969            Consommation finale privée

Gross fixed capital formation             172 151         196 999      226 180      263 754      324 083      406 257        524 678      531 957       520 451          Formation brute de capital fixe

Increase in inventories                        10 078      10 914       28 336       18 212       22 352       20 127         - 8 534     - 76 430      - 18 991                    Variation des stocks

Exports of goods and services             385 560         354 785      373 950      430 169      530 333      634 626        809 644      657 192       714 083       Exportations de biens et services
                                                                                                                                                                         Moins importations de biens et
                                                                                                                                                                                                            301
Less imports of goods and services        340 636         325 035      378 179      437 559      573 589      689 784        878 737      678 308       731 032
                                                                                                                                                                                               services
GDP at purchasers' values                1 171 086       1 272 537    1 415 273    1 571 081    1 767 423    2 016 166     2 274 139     2 395 969     2 662 757              PIB aux prix d'acquisition


Gross domestic product by kind of economic activity at constant
                                                                                                    Produit intérieur brut par branche d'activité economique aux prix constants
prices
Annual Growth Rates (%)                                                                                                                                      Taux de croissance annuel (%)
Agriculture                                       6.5          0.7          0.9          2.8         -5.5          2.7          16.1          -3.0           0.9                             Agriculture

Mining and quarrying                              1.0          3.4          1.5          1.0         -0.6          0.0           -5.6         -4.2           5.8                  Industries extractives

Manufacturing                                     2.8         -1.5          4.9          6.2          6.4          5.2           2.6         -10.4           5.0             Industries manufacturières

Electricity, gas & water                          3.5          3.0          6.8          5.3          3.4          3.4           -3.1         -1.6           2.0                  Electricité, gaz et eau

Construction                                      5.8          7.7          9.1         11.9         10.4         15.0           9.5           7.4           1.5           Bâtiments et travaux publics
Wholesale & retail trade,                                                                                                                                                      Commerce de gros et de
                                                  2.3          2.7          5.4          7.0          6.0          5.3           0.8          -2.5           2.2
restaurants, hotels                                                                                                                                                          détail,restaurants et hôtels
                                                                                                                                                                          Banques, assurances, affaires
Finance, insurance, real estate, etc.             6.3          4.8          7.1          5.7          9.6          7.9           7.3           0.9           1.9
                                                                                                                                                                                          immobilières
Transport and communications                      9.0          6.3          4.9          5.3          5.1          6.6           3.4           0.6           2.9       Transport(s) et communications
                                                                                                                                                                           Administrations publiques et
Public administartion and defense                 0.7          2.8          1.9          4.3          3.1          3.8           4.7           4.1           3.0
                                                                                                                                                                                               défense
Other services                                    2.5          5.6          1.7          3.8          5.2          5.6           3.9          -0.3           0.6                         Autres services
                                                                                                                                                                        Moins Services d’intérmediation
Less Imputed Service Charges                       ...          ...          ...          ...          ...          ...            ...           ...          ...
                                                                                                                                                                                              financière
Gross domestic product at factor                                                                                                                                    Produit intérieur brut aux couts des
                                                  3.7          3.0          4.5          5.3          5.5          5.6           3.7          -1.5           2.8
cost / basic prices                                                                                                                                                               facteurs / prix de base

Plus: Indirect Taxes / taxes on                                                                                                                                     Plus taxes indirectes/impôts sur les
                                                  3.7          2.7          5.0          5.0          6.2          5.5           2.3          -2.9           3.0
products, less subsidies                                                                                                                                                produits, moins les subventions

Gross domestic product at market                                                                                                                                      Produit intérieur brut aux prix du
                                                  3.7          2.9          4.6          5.3          5.6          5.6           3.6          -1.7           2.8
prices                                                                                                                                                                                           marché


2008: semi-final           2009: Provisional      2010:Estimated                                                          2008: semi-définitif           2009: provisoire               2010:Estimée


                                                                                                        African Statistical Yearbook 2011 / Annuaire Statistique pour l'Afrique 2011
South Africa                                                                                                                                                     Afrique du Sud

         Expenditure on Gross domestic product at constant purchasers'
                                                                                                                          Emplois du produit intérieur brut aux prix constants d'acquisition
         values

         Annual Growth Rates (%)                                                                                                                            Taux de croissance annuel (%)
                                                                                                                                                                              Consommation finale des
         Government final consumption                     3.2          6.0          6.0          4.6          4.9            4.1       4.7       4.8        4.2
                                                                                                                                                                              administrations publiques

         Private final consumption                        4.3          3.2          5.9          6.3          8.5            5.3       2.8       -1.6       4.0             Consommation finale privée

         Gross fixed capital formation                    3.7         10.2         12.9         11.0         12.1           14.0      14.1       -2.2      -3.8         Formation brute de capital fixe

         Exports of goods and services                    1.0          0.1          2.8          8.6          7.5            6.6       1.8      -19.5       3.7       Exportations de biens et services

                                                                                                                                                                        Moins importations de biens et
         Less imports of goods and services               5.3          8.1         15.5         10.9         18.3            9.0       1.5      -17.4       8.6
                                                                                                                                                                                              services


                                                                                                III INFLATION

                                                      2002         2003         2004         2005         2006           2007       2008      2009       2010
         Annual Growth Rates (%)                                                                                                                            Taux de croissance annuel (%)
         All Item                                         9.1          5.8          1.4          3.4          4.6            7.2      11.5       7.1        3.7                               Ensemble

         Food                                              ...          ...          ...          ...          ...            ...       ...        ...      3.1                            Alimentation

         Health                                            ...          ...          ...          ...          ...            ...       ...        ...      7.4                                   Santé

         Energy                                            ...          ...          ...          ...          ...            ...       ...        ...      6.3                                  Energie

         Transport                                         ...          ...          ...          ...          ...            ...       ...        ...      2.5                               Transport


                                                            IV AGRICULTURAL PRODUCTION - PRODUCTION AGRICOLE

                                                      2002         2003         2004         2005         2006           2007       2008      2009       2010
         Tons (Thousand)                                                                                                                                                         Tonnes (milliers)
         Maize, Tons (thousands)                      10 076        9 705        9 710       11 716        6 935           7 125    12 700    12 050         ...                  Maïs, tonnes (milliers)

         Wheat, Tons (thousands)                       2 438        1 547        1 687        1 905        2 105           1 905     2 130     1 958         ...                   Blé, tonnes (milliers)

         Potato, Tons (thousands)                      1 647        1 496        1 800        1 768        1 863           1 972     2 099     1 819         ...       Pomm de terre, tonnes (milliers)

         Grapes, Tons (thousands)                      1 522        1 664        1 762        1 683        1 757           1 813     1 792         ...       ...               Raisins, tonnes (milliers)

         Orange, Tons (thousands)                      1 307        1 410        1 198        1 246        1 334           1 410     1 525     1 445         ...              Oranges, tonnes (milliers)


                                                                    V MINING PRODUCTION - PRODUCTION MINIERE
302
                                                      2002         2003         2004         2005         2006           2007       2008      2009       2010


         Hard Coal, metric tons (thousands)        ######### ######### ######### ######### ######### 247666 000.0                       ...        ...       ...    Houille, tonnes métriques (milliers)

         Iron ores and concentrates, metric        ######### ######### ######### ######### #########                 42100 888.0        ...        ...       ...          Minerais de fer et concentrés,
         tons (thousands)                                                                                                                                                    tonnes métriques (milliers)
         Copper ores and concentrates,                                                                                                                                Minerais de cuivre et concentrés,
                                                    129 590.0    120 920.0     87 000.0     85 000.0     89 700.0       97 000.0        ...        ...       ...
         metric tons (thousands)                                                                                                                                            tonnes métriques (milliers)


                                                                                           VI ENERGY - ENERGIE

                                                      2002         2003         2004         2005         2006           2007       2008      2009       2010

         Electricity - total hydro production,                                                                                                                      Électricité - production hydraulique
                                                      4 394.0      3 682.0      4 625.0      4 199.0      5 581.0        3 908.0        ...        ...       ...
         kilowatt hours (millions)                                                                                                                                     totale, kilowatt-heures (millions)

         Electricity - total thermal production,                                                                                                                      Électricité - production thermique
                                                    201 274.0    217 831.0    226 564.0    229 375.0    236 384.0      248 201.0        ...        ...       ...
         kilowatt hours (millions)                                                                                                                                     totale, kilowatt-heures (millions)

         Electricity - total production, self-                                                                                                                     Electricité - Production totale privée
                                                       8 310       11 551       11 454       11 736       10 204          10 541        ...        ...       ...
         producer (Million Kilowatt Hours)                                                                                                                                   (million de kilowatt heures)

         Electricity - total production, public                                                                                                                           Electricité - Production totale
                                                     209 402      222 678      233 153      233 184      243 594        252 938         ...        ...       ...
         (Million Kilowatt Hours)                                                                                                                                  publique (million de kilowatt heures)


      African Statistical Yearbook 2011 / Annuaire Statistique pour l'Afrique 2011
South Africa                                                                                                                                                       Afrique du Sud
                                         VII TOURISM AND INFRASTRUCTURE - TOURISME ET INFRASTUCTURE

                                          2002       2003          2004         2005         2006         2007         2008         2009         2010

Arrivals - Tourists (thousands)             6430        6505         6678         7369         8396         9091         9592            ...          ...           Arrivées - touristes (milliers)

Rooms in hotels and similar                                                                                                                               Chambres d'hotels et établissements
establishments (thousands)                    52          52           52           55            ...          ...          ...          ...          ...                  assimilés (milliers)

Paved Road (% of total)                        ...         ...          ...          ...          ...          ...          ...          ...          ...        Routes asphaltées (% du total)
Total Network (Railways-km)               22 657      20 041       20 247       20 247       20 247       24 487            ...          ...          ...         Réseau total voies ferrées-Km
Main Telephone Lines (per 1,000                                                                                                                                 Lignes téléphoniques fixes (pour
                                             100         100          100          100          100           90           90           90            ...
inhabitants)                                                                                                                                                                    1000 habitants)
Mobile Cellular Subscribers (per                                                                                                                                Abonnés aux téléphones mobiles
                                             300         360          440          710          820          860          910          930            ...
1,000 inhabitants)                                                                                                                                                       (pour 1000 habitants)


                          VII FINANCIAL AND MONETARY STATISTICS - FINANCES ET STATISTIQUES MONETAIRES

                                          2002       2003          2004         2005         2006         2007         2008         2009         2010

VII-1 Monetary Statistics                                                                                                                              VII-1 Statistiques monétaires
Rand (Millions)                                                                                                                                                              Rand(Millions)
Money supply (M1)                        197 019     218 943      245 327      294 039      339 387      402 116      420 746      423 065      473 442                   Masse monétaire (M1)
Quasi-money                              428 461     499 342      536 280      643 089      796 297      962 436     1 150 860    1 154 300    1 217 420                          Quasi-monnaie
  of which Demand Deposit                      ...         ...          ...          ...          ...          ...          ...          ...          ...              dont Monnaie scripturale
Net foreign assets                        83 744     124 666      139 752      193 315      271 460      302 579      387 441      333 510      337 781                    Avoirs extérieurs nets
Domestic credit                          834 398     947 212     1 042 900    1 183 240    1 433 680    1 735 550    2 000 010    2 108 470    2 238 120                          Crédit intérieur

of which claims on private sector        682 075     805 719      922 983     1 080 330    1 354 290    1 651 660    1 816 800    1 870 690    1 933 350      dont créances sur le secteur privé

of which Claims on government                                                                                                                                        dont créances nettes sur le
                                          97 767      68 062       59 300        9 230      - 38 623     - 49 506     - 50 957      55 124       51 901
sector, net                                                                                                                                                                      gouvernement
International reserves (millions of US                                                                                                                      Réserves internationales (millions de
                                           5 904       6 496       13 141       18 579       23 057       29 589       30 584       35 237       38 175
$)                                                                                                                                                                                          $ EU)
Average Exchange Rate (National                                                                                                                              Taux de change (moyen) (monnaie
                                           10.54        7.56          6.46         6.36         6.77         7.05         8.26         8.47         7.32
Currency per us $)                                                                                                                                                       nationale par dollars)


VII-2 Public Finance                                                                                                                                            VII-2 Finances publiques
Rand (Millions)                                                                                                                                                              Rand(Millions)
Total Revenues and Grants                248 263     278 508      299 431      347 854      411 748      481 198      560 774      608 783      579 686                 Recettes totales et dons
  Tax Revenue                            244 090     273 680      292 720      341 651      403 051      470 355      549 102      595 973      570 565                         Recettes fiscales
  Non Tax Revenue                          4 172       4 828        6 711        6 203        8 697       10 843       11 672       12 810        9 121                    Recettes non fiscales
  Grants                                       0           0            0            0             0            0            0            0            0                                    Dons      303
Total Expenditures and Net Lending       262 851     299 631      328 720      366 985      416 684      470 193      541 498      635 807      747 197           Dépenses totales et prêts nets

  Current expenditure                    141 779     157 693      164 994      179 722      199 905      222 986      255 253      307 482      380 810                     Dépenses courantes
  Of which Wages and Salaries             97 362     109 941      119 888      129 728      140 202      154 687      177 012      211 322      240 610           Dont rémunérations et salaires
  Capital expenditure                     16 731      13 047       14 867       16 421       20 549       22 970       26 143       41 171       59 700                 Dépenses d'équipement
  Net Lending                             - 9 962    - 19 623     - 20 259     - 18 046     - 18 916     - 23 688     - 26 650      - 8 445     - 17 000                               Prêts nets
Fiscal Balance                           - 14 588    - 21 123     - 29 289     - 19 131      - 4 936      11 005       19 275      - 27 024    - 167 511         Solde global y compris les dons


VII-3 Balance of Payments                                                                                                                                   VII-3 Balance des paiements
US $ (Millions)                                                                                                                                                              $ E.U(Millions)
Trade balance                              4 767       3 527        - 191        - 315       - 4 323      - 5 753      - 4 304         268        2 797                    Balance commerciale
Services Balance                           - 505         406        - 464        - 847       - 2 065      - 2 644      - 4 059      - 2 760      - 3 998                    Balance des services
Net Income                                - 2 789     - 4 610      - 4 311      - 4 942      - 5 135      - 9 768      - 8 942      - 6 316      - 7 581                            Revenus nets
Current transfers, net total               - 554       - 989       - 1 683      - 2 466      - 2 329      - 2 353      - 2 289      - 2 647      - 2 784                     Transferts courants
Current account balance                      918      - 1 665      - 6 649      - 8 569     - 13 852     - 20 517     - 19 594     - 11 455     - 11 566               Solde du compte courant


VII-4 External Debt and Financial Flows                                                                                                   VII-4 Dette extérieure et flux financiers
US $ (Millions)                                                                                                                                                              $ E.U (Millions)
Total external debt                       34 002      39 309       45 014       46 157       57 058       75 275       71 811       79 031       90 037                   Dette extérieure totale
  Private                                 28 983      34 279       39 974       41 106       51 996       70 203       66 728       73 937       82 933                                    Privée
  Public                                   5 019       5 030        5 040        5 051        5 062        5 072        5 083        5 094        7 104                                 Publique
Total external debt service               17 573      17 176       21 788       23 242       25 530       26 579       38 210       36 321       35 028            Service de la dette extérieure
Net Foreign Direct Investment                                                                                                                               Investissements étranger direct (flux
                                           1 569         734          798        6 647        - 527        5 695        9 006        5 696            ...
Inflows                                                                                                                                                                           nets entrants)
Net Total Official Development                                                                                                                                 Aide publique au développement
                                             511         656          629          690          715          807        1 125        1 075            ...
assistance                                                                                                                                                                        (nette totale)


                                                                                                    African Statistical Yearbook 2011 / Annuaire Statistique pour l'Afrique 2011
South Africa                                                                                                                             Afrique du Sud

                                                 2002      2003      2004      2005      2006      2007       2008      2009      2010

         US $ (Millions)                                                                                                                                                 Rand
         Exports, fob                                                                                                                                    Exportations, fàb


         Exports - Total                         31 616    38 525    48 071    56 352    66 113    75 765     85 253    65 666       ...                    Exportations - Total


         Main Products                                                                                                                                   Principaux produits


         Platinum unwrought or in powder                                                                                                        Platine sous forme brute ou en
                                                  2 095     3 092     4 299     4 604     5 748     6 378      8 986     6 357       ...
         form                                                                                                                                                          poudre


         Diamonds non-industrial unworked                                                                                                     Diamants non-industriels bruts ou
                                                  2 147     2 742     2 868     2 993     3 591     5 150      5 317     3 006       ...
         or simply sawn, cleaved or bruted                                                                                                 simplement sciés, clivés ou débrutés


         Gold in unwrought forms non-                                                                                                         Or sous forme brute à usage non
                                                  2 517     1 978     2 778     3 679     3 545     4 968      4 762     4 399       ...
         monetary                                                                                                                                                   monétaire


         Ferro-chromium containing by                                                                                                         Ferro-chrome contenant en poids
                                                    664     1 027     1 674     1 779     1 742     2 505      4 273     2 219       ...
         weight more than 4% of carbon                                                                                                                  plus de 4% de carbone

         Bituminous coal, whether or not                                                                                                   Houille butimuneuse, qu'ils soient ou
                                                  1 202     1 348     1 984     2 075     2 134     3 150      4 087     2 800       ...
         pulverised but not agglomerated                                                                                                   non pulvérisés mais non agglomérés

         Main Destinations                                                                                                                          Principales destinations

         United States                           4 171.6   4 799.8   6 152.9   6 062.4   7 734.8   9 282.1   10 132.7   5 967.5      ...                              États-Unis


         United Kingdom                          4 067.1   4 879.5   5 568.0   6 139.3   6 727.1   8 317.0    8 906.8   5 411.9      ...                          Royaume-Uni


         Japan                                   2 892.4   3 593.9   4 608.9   5 537.6   6 628.4   7 730.5    8 983.4   4 987.8      ...                                  Japon


         Germany                                 2 968.1   3 202.5   3 994.6   4 345.3   5 283.9   6 018.6    7 658.8   5 209.8      ...                              Allemagne


         China                                   1 268.8   1 840.0   2 960.2   3 443.1   4 085.4   6 618.1    9 235.0   8 693.3      ...                                   Chine


                                                 2002      2003      2004      2005      2006      2007       2008      2009      2010
         Imports, cif                                                                                                                                     Importations, cif

304      Imports - Total                         28 545    37 354    51 885    59 653    74 781    94 132     99 561    73 781       ...         Importations - Total (millions)


                                                                                                                                                         Principaux produits
         Main Products


         Petroleum oils and oils obtained from                                                                                                   Huiles de pétrole, les huiles de
                                                    557     2 495       261     3 087     4 551     1 747      3 136     2 301       ...
         bituminous minerals, crude                                                                                                                  minéraux bitumineux, brut

         Petroleum oils&oils obtained from
                                                                                                                                                 Huiles de pétrole, bitumineux,
         bituminous minerals,o/than crude           265       422       926     2 060     5 442     4 894      5 641     3 184       ...
                                                                                                                                                             distilles, sauf brut
         etc
         Gold in unwrought forms non-                                                                                                         Or sous forme brute à usage non
                                                     47        49       387       605     1 230     1 002      2 539       803       ...
         monetary                                                                                                                                                   monétaire

         Gold, semi-manufactured forms, non-                                                                                               Or, sous formes mi-ouvrées à uasge
                                                     60        30        42     1 107     1 247     1 613      2 035       440       ...
         monetary                                                                                                                                              non monétaire


         Medicaments nes, in dosage                 705       892     1 101     1 478     2 112     3 077      2 690     1 987       ...          Médicaments nda, en dosage


         Main Origin                                                                                                                                Principales provenances

         Germany                                 4 105.0   5 712.1   7 541.0   8 292.7   9 255.8   9 765.0   10 331.9   7 922.8      ...                              Allemagne

         China                                   1 310.6   2 029.4   2 951.9   3 826.0   5 767.7   7 444.9    8 617.6   7 365.6      ...                                   Chine

         United States                           2 524.6   2 820.8   3 172.0   3 881.7   4 461.7   5 517.2    6 494.7   4 460.6      ...                              États-Unis

         United Kingdom                          2 414.1   2 906.8   3 451.4   3 786.5   4 026.5   4 325.0    4 680.0   3 343.9      ...                          Royaume-Uni

         Japan                                   1 553.8   2 031.6   2 907.6   3 273.6   4 057.2   4 610.5    4 627.7   2 606.7      ...                                  Japon


      African Statistical Yearbook 2011 / Annuaire Statistique pour l'Afrique 2011
Sudan                                                                                                                                                                             Soudan

AREA (KM 2)                                                                                     2 505 813                                                                 SUPERFICIE (KM 2)
CAPITAL CITY                            Khartoum                                                                                            Khartoum                                  CAPITALE
CURRENCY                                Sudanese Pound                                                                                 Pound Sudanais                                 MONNAIE


                        I SOCIAL AND DEMOGRAPHIC INDICATORS — INDICATEURS DEMOGRAPHIQUES ET SOCIAUX

                                           2002         2003         2004         2005         2006            2007         2008         2009       2010
Population                                                                                                                                                                         Population
                                                                                                                                                               Population au milieu de l'année -
Mid-year population - Total (Million)         32.8         33.6         34.5         35.4         36.3            37.2         39.2         40.3       ...
                                                                                                                                                                                  Total (million)
                                                                                                                                                               Population au milieu de l'année -
Mid-year population - Urban (%)               34.8         35.5         36.2         36.8         37.6            38.3         29.5         29.5       ...
                                                                                                                                                                                  Urbaine (%)

Female (%)                                    49.9         49.6         49.6         49.6         49.6            49.6         48.7         48.0       ...                           Femme (%)


Population by Age Group                                                                                                                                             Population par groupe d'âge


   0-14                                  13894 000    14145 619    14415 662    14690 000    14972 000       15230 751    16683 728    17164 000       ...                                   0-14


   15-64                                 17597 000    18176 381    17016 338    19270 000    19845 000       20455 383    20454 306    21043 000       ...                                  15-64


   65+                                    1278 000     1326 000     3080 000     1437 000     1480 000        1552 866     2016 456     2075 000       ...                                   65+


Active Population (000)                   11 174.2     11 474.0     11 768.6     12 070.4     12 377.3        12 698.5     13 351.7     13 736.0       ...               Population active (000)

   Female (%)                                 28.8         29.1         29.3         29.7         30.3            30.5         30.7         31.0       ...                           Femme (%)

                                                                                                                                                               Taux brut de natalité - Total (par
Crude birth rate - Total (per 1000)           37.8         37.8         37.8         37.8         37.8            37.8         43.5         43.5       ...
                                                                                                                                                                                           1000)
                                                                                                                                                             Taux brut de mortalité - Total (par
Crude death rate - Total (per 1000)           11.5         11.5         10.3         10.3         10.3            10.3         10.3         10.3       ...
                                                                                                                                                                                          1000)
Life expectancy at birth - Total                                                                                                                               Espérance de vie à la naissance -
                                              54.0         54.0         54.0         54.0         54.0            54.0         54.0         54.0       ...
(years)                                                                                                                                                                          Total (années)
Net reproduction rate - (per                                                                                                                                    Taux net de reproduction - (par
                                                ...          ...          ...         1.7           ...             ...          ...          ...      ...
woman)                                                                                                                                                                                  femme)
                                                                                                                                                               Indice synthétique de fécondité -
Total fertility rate - (per woman)             5.9          5.9          5.9          5.9          5.9             5.9          5.8          5.8       ...
                                                                                                                                                                                   (p
                                                                                                                                                                                   (par femme) )

Education                                                                                                                                                                     Enseignement

Teaching staff at first level - Total                                                                                                                        Personnel enseignant - 1er degré -
                                            132.04        136.4        141.3        143.3        146.0           155.0        161.0           ...      ...
(thousands)                                                                                                                                                                     Total (milliers)
Teaching staff at second level -                                                                                                                             Personnel enseignant - 2ème degré
                                             19.78         23.0         32.9         34.2         39.0            42.1         43.0           ...      ...
Total (thousands)                                                                                                                                                              - Total (milliers)     305
Teaching staff at third level - Total                                                                                                                        Personnel enseignant - 3ème degré
                                               8.2          5.8          7.4          8.0          8.5            11.0           ...          ...      ...
(thousands)                                                                                                                                                                    - Total (milliers)
First level student enrollment -                                                                                                                               Elèves inscrits - 1er degré - Total
                                             3 759        3 967        4 300        4 624        4 786           5 253        5 800           ...      ...
Total (thousands)                                                                                                                                                                        (milliers)
First level student enrollment -                                                                                                                                     Elèves inscrits - 1er degré -
                                             1 718        1 810        1 967        2 163        2 176           2 424        2 675        2 205       ...
Female (thousands)                                                                                                                                                             Femmes (milliers)
Second level student enrollment -                                                                                                                            Elèves inscrits - 2ème degré - Total
                                              487          546          637          639          636             680          720         1 837       ...
Total (thousands)                                                                                                                                                                       (milliers)
Second level student enrollment -                                                                                                                                 Elèves inscrits - 2ème degré -
                                              240          261          305          283          303             312          367          845        ...
Female (thousands)                                                                                                                                                            Femmes (milliers)
Third level student enrollment -                                                                                                                             Elèves inscrits - 3ème degré - Total
                                                ...          ...          ...          ...          ...             ...          ...          ...      ...
Total (thousands)                                                                                                                                                                       (milliers)
Third level student enrollment -                                                                                                                                  Elèves inscrits - 3ème degré -
                                                ...          ...          ...          ...          ...             ...          ...          ...      ...
Female (thousands)                                                                                                                                                            Femmes (milliers)
Public expenditure on education (%                                                                                                                             Dépenses publiques consacrées à
                                               3.8          3.0          1.9          1.4          1.0             1.7          1.3           ...      ...
of budget)                                                                                                                                                       l'enseignement (% du budget)

Health                                                                                                                                                                                    Santé

Hospital beds - Total (per 10 000                                                                                                                              Nombre de lits d'hôpitaux - Total
                                               73           71           72           74           73              74           73           72        ...
population)                                                                                                                                                                       (pour 10 000)
Nurses - Total (per 10 000                                                                                                                                    Nombre d'infirmières - Total (pour
                                               50           51           49           60           51              49           50           44        ...
population)                                                                                                                                                                             10 000)
Physicians - Total (per 10 000                                                                                                                               Nombre de médecins - Total (pour
                                               18           18           20           23           29              30           28           35        ...
population)                                                                                                                                                                          10 000)
Public expenditure on Health (% of                                                                                                                             Dépenses publiques consacrées à
                                               10             9          10           12           10              18           12           14        ...
budget)                                                                                                                                                                la santé (% du budget)


                                                                                                          African Statistical Yearbook 2011 / Annuaire Statistique pour l'Afrique 2011
Sudan                                                                                                                                                                   Soudan
                                                                 II NATIONAL ACCOUNTS — COMPTES NATIONAUX

                                                    2002        2003        2004        2005        2006         2007         2008         2009      2010

          Gross domestic product by kind of economic activity at current
          prices                                                                                        Produit intérieur brut par branche d'activité économique aux prix courants


          Sudanese Pound (Millions)                                                                                                                             Pound Sudanais(Millions)

          Agriculture                             1 787 823   2 127 410   2 321 830   2 827 390   3 099 310    3 298 550    3 748 060    4 496 960      ...                           Agriculture

          Mining and quarrying                     319 050     380 818     473 570     644 280     905 530     1 782 430    2 006 430    2 240 900      ...                 Industries extractives

          Manufacturing                            386 317     426 522     550 580     635 020     697 410      878 190      972 630     1 150 820      ...           Industries manufacturières

          Electricity, gas & water                  47 362      29 871      97 890     124 080     210 840      198 140      224 240      251 300       ...                Electricité, gaz et eau

          Construction                             186 914     210 921     257 860     376 540     417 770      465 050      523 930      617 120       ...         Bâtiments et travaux publics
          Wholesale & retail trade,                692 094     852 616    1 062 700   1 248 730   1 412 940    1 672 780    1 837 620    2 110 760      ...      Commerce de gros et de détail,
          restaurants, hotels                                                                                                                                             restaurants et hôtels
                                                                                                                                                                  Banques, assurances, affaires
          Finance, insurance, real estate, etc.    396 874     421 227     513 340     635 500     733 260      780 890      896 110     1 039 910      ...
                                                                                                                                                                                  immobilières
          Transport and communications             400 965     554 418     823 320    1 235 860   1 308 511    1 378 120    1 504 550    1 707 620      ...      Transport(s) et communications
                                                                                                                                                                    Administrations publiques et
          Public administration and defense        243 329     266 167     384 560     426 910     529 740      594 370      668 060      748 160       ...
                                                                                                                                                                                        défense
          Other services                           143 682     150 902     160 850     172 060     195 900      225 460      250 280      272 930       ...                       Autres services
                                                                                                                                                                Moins Services d’intermédiation
          Less Imputed Service Charges             - 29 342    - 37 970    - 54 670    - 88 400   - 102 610    - 109 480    - 112 550    - 124 440      ...
                                                                                                                                                                                        financière
          Gross domestic product at factor                                                                                                                  Produit intérieur brut aux couts des
                                                  4 575 067   5 382 903   6 591 830   8 237 970   9 408 601   11 164 500   12 519 360   14 512 040      ...
          cost / basic prices                                                                                                                                             facteurs / prix de base

          Plus: Indirect Taxes / taxes on                                                                                                                     Plus taxes indirectes/impôts sur les
                                                   200 544     190 476     280 309     332 743     463 280      237 255      255 330      630 740       ...
          products, less subsidies                                                                                                                                produits, moins les subventions


          Expenditure on Gross domestic product at current purchaser's values
                                                                                                                     Emploi du produit intérieur brut aux prix courants d'acquisition

          Sudanese Pound (Millions)                                                                                                                             Pound Sudanais(Millions)
                                                                                                                                                                       Consommation finale des
          Government final consumption             291 560     333 405     586 230     791 694     960 646      963 515     1 081 078    1 312 980      ...
                                                                                                                                                                       administrations publiques

          Private final consumption               3 746 670   4 546 645   5 319 025   6 999 525   7 918 033    8 578 047    9 207 296   10 734 900      ...          Consommation finale privée

          Gross fixed capital f
          G     fi d     it l formation
                                   ti              925 843     741 446    1 122 467   1 428 410   1 642 672    1 617 034    1 864 470    1 946 240      ...       Formation b t d capital fi
                                                                                                                                                                  F    ti brute de   it l fixe

          Increase in inventories                  116 797     246 568     184 496     247 225     436 680      737 339      585 191      691 850       ...                  Variation des stocks

          Exports of goods and services            536 999     670 319     986 895    1 202 844   1 271 839    1 866 478    2 540 113    3 163 520      ...     Exportations de biens et services
306                                                                                                                                                               Moins importations de biens et
          Less imports of goods and services       842 258     965 004    1 326 974   2 098 985   2 357 990    2 360 658    2 503 458    2 706 710      ...
                                                                                                                                                                                        services
          GDP at purchasers' values               4 775 611   5 573 378   6 872 139   8 570 713   9 871 881   11 401 755   12 774 690   15 142 780      ...             PIB aux prix d'acquisition


          Gross domestic product by kind of economic activity at constant
                                                                                                       Produit intérieur brut par branche d'activité economique aux prix constants
          prices
          Annual Growth Rates (%)                                                                                                                     Taux de croissance annuel (%)
          Agriculture                                  -1.0         4.0        -2.1         5.8         6.5          4.8          7.7          8.6      ...                           Agriculture

          Mining and quarrying                         12.9        14.8        15.9         9.7         6.4         50.3         10.2         10.5      ...                 Industries extractives

          Manufacturing                                 6.8         4.3         8.4         6.5         8.7          8.5          8.6          8.6      ...           Industries manufacturières

          Electricity, gas & water                     10.2       -14.0        16.3         9.9         8.4          6.4          8.0         15.8      ...                Electricité, gaz et eau

          Construction                                  5.2         7.0        25.5         8.9         9.8          8.9          8.3          8.5      ...         Bâtiments et travaux publics
          Wholesale & retail trade,                                                                                                                                    Commerce de gros et de
                                                        2.7         2.7         2.7         4.5         5.6          5.8          6.8          6.8      ...
          restaurants, hotels                                                                                                                                        détail,restaurants et hôtels
                                                                                                                                                                   Banques, assurances, affaires
          Finance, insurance, real estate, etc.        -0.9        14.5         1.4         8.5         8.9          6.5          7.9          7.9      ...
                                                                                                                                                                                    immobilières
          Transport and communications                  0.8        25.6        10.5         7.0         8.6         10.0          8.0          7.6      ...      Transport(s) et communications
                                                                                                                                                                    Administrations publiques et
          Public administartion and defense            36.6         3.8         5.5        13.5        23.0          4.5          5.8          5.9      ...
                                                                                                                                                                                        défense
          Other services                                5.3         5.9         6.3        57.3         5.3          3.6          4.3          4.3      ...                       Autres services
                                                                                                                                                                Moins Services d’intérmediation
          Less Imputed Service Charges                 36.8        29.4         3.6         3.2         3.6          2.5          2.9          2.8      ...
                                                                                                                                                                                        financière
          Gross domestic product at factor                                                                                                                  Produit intérieur brut aux couts des
                                                        5.4         6.6         4.1         8.6         9.8          9.2          7.7          8.2      ...
          cost / basic prices                                                                                                                                             facteurs / prix de base

          Plus: Indirect Taxes / taxes on                                                                                                                     Plus taxes indirectes/impôts sur les
                                                       16.3         2.1        22.0       -29.2         0.3        -19.8          9.0        -59.0      ...
          products, less subsidies                                                                                                                                produits, moins les subventions

          Gross domestic product at market                                                                                                                      Produit intérieur brut aux prix du
                                                        6.0         6.3         5.1         6.1         9.4          8.1          7.8          6.1      ...
          prices                                                                                                                                                                           marché


           2009: Provisional                                                                                                                                                  2009: provisoire


      African Statistical Yearbook 2011 / Annuaire Statistique pour l'Afrique 2011
Sudan                                                                                                                                                                       Soudan

Expenditure on Gross domestic product at constant purchasers'
                                                                                                           Emplois du produit intérieur brut aux prix constants d'acquisition
values

Annual Growth Rates (%)                                                                                                                       Taux de croissance annuel (%)
                                                                                                                                                                Consommation finale des
Government final consumption                14.6        14.8          3.3       -16.5       26.1              5.8         5.8          ...      ...
                                                                                                                                                                administrations publiques

Private final consumption                     0.7        -4.6         4.6       21.0          5.2             3.1         3.1          ...      ...           Consommation finale privée

Gross fixed capital formation               63.2        31.2        25.3        19.6          9.4            -6.3        -0.3          ...      ...        Formation brute de capital fixe

Exports of goods and services               15.5          1.9       12.0        13.6         -1.6            52.3       21.2           ...      ...      Exportations de biens et services

                                                                                                                                                           Moins importations de biens et
Less imports of goods and services          50.3        13.7        31.1        66.5          6.5            -8.0        -8.9          ...      ...
                                                                                                                                                                                 services


                                                                                  III INFLATION

                                          2002        2003        2004        2005        2006            2007        2008        2009       2010
Annual Growth Rates (%)                                                                                                                       Taux de croissance annuel (%)
All Item                                      8.3         7.7         8.5         8.5         7.2             8.1       14.3        11.2      13.0                               Ensemble

Food                                        29.0        10.3          8.8       10.3          2.1             5.4       10.4        25.4      15.6                            Alimentation

Health                                        8.9         6.7         1.2        -7.2       39.5             17.4         1.2       13.2       5.1                                   Santé

Energy                                      17.0          3.8       10.5        13.6        14.7              4.9         5.8         5.0      9.9                                 Energie

Transport                                   17.5          3.7       13.7          5.2       26.0             32.1         1.0        -6.9      2.4                               Transport


                                                 IV AGRICULTURAL PRODUCTION - PRODUCTION AGRICOLE

                                          2002        2003        2004        2005        2006            2007        2008        2009       2010
Tons (Thousand)                                                                                                                                                     Tonnes (milliers)
Sorghum, metric tons (thousands)           7 201       2 825       4 690       2 678       4 356            5 011      3 869       4 197        ... Sorgho, tonnes métriques (milliers)
Groundnuts, metric tons                      990         555         790         520         555             523         716         942        ...          Arachides, tonnes métriques
(thousands)                                                                                                                                                                     (milliers)
Sesame seeds, metric tons                    269         122         400         277         400             242         350         318        ...           Graines de sesame, tonnes
(thousands)                                                                                                                                                          métriques (milliers)
Wheat, metric tons (thousands)               247         331         398         364         401             680         587         980        ...       Blé, tonnes métriques (milliers)

Cotton, metric tons (thousands)              243         254         238         312         255             244         107         169        ...    Coton, tonnes métriques (milliers)


                                                       V MINING PRODUCTION - PRODUCTION MINIERE
                                                                                                                                                                                               307
                                          2002        2003        2004        2005        2006            2007        2008        2009       2010


Gold, Kilograms (thousands)               5 238.7     5 106.0     4 271.0     4 271.0     3 246.0         2 701.0     2 255.0     1 833.0       ...             Or, Kilogrammes (milliers)

Gypsum (Ton)                              4 540.0    13 304.0     7 301.0    16 800.0     7 000.0         7 974.0    12 705.0    30 000.0       ...                        Gypse (tonnes)


Chromate (Ton)                           15 000.0    15 000.0    11 000.0    30 600.0    17 200.0        28 909.0    27 094.0    14 087.0       ...                    Chromate (tonnes)


                                                                             VI ENERGY - ENERGIE

                                          2002        2003        2004        2005        2006            2007        2008        2009       2010

Electricity - total hydro production,                                                                                                                 Électricité - production hydraulique
                                          1 794.2     2 180.1     2 624.2     2 886.9     3 165.0         3 564.9     4 041.7     3 141.4       ...
kilowatt hours (millions)                                                                                                                                totale, kilowatt-heures (millions)

Electricity - total thermal                                                                                                                             Électricité - production thermique
                                          1 287.2     1 163.2     1 106.8     1 239.0     1 368.2         1 456.6     1 464.7     3 230.6       ...
production, kilowatt hours (millions)                                                                                                                    totale, kilowatt-heures (millions)

Electricity - total production, self-                                                                                                                 Electricité - Production totale privée
                                               ...         ...         ...         ...         ...             ...         ...         ...      ...
producer (Million Kilowatt Hours)                                                                                                                               (million de kilowatt heures)
                                                                                                                                                             Electricité - Production totale
Electricity - total production, public
                                           3 094       3 354       3 749       4 124       4 521            5 021      5 506       6 372        ...           publique (million de kilowatt
(Million Kilowatt Hours)
                                                                                                                                                                                    heures)


                                                                                                     African Statistical Yearbook 2011 / Annuaire Statistique pour l'Afrique 2011
Sudan                                                                                                                                                                                  Soudan
                                                  VII TOURISM AND INFRASTRUCTURE - TOURISME ET INFRASTUCTURE

                                                   2002         2003           2004          2005          2006          2007          2008          2009       2010

         Arrivals - Tourists (thousands)              51.5       52.291        60.566         245.6         294.6           336           440       420.238         ...           Arrivées - touristes (milliers)

         Rooms in hotels and similar                                                                                                                                      Chambres d'hotels et établissements
         establishments (thousands)                                                                                                                                                        assimilés (milliers)
                                                         ...          ...       3.564         2.304         2.842         3.466             ...        4.55         ...
         Paved Road (% of total)                        36           32            33            33            36            32            32            32         ...        Routes asphaltées (% du total)
         Total Network (Railways-km)                11 608       10 654        12 486        11 586        11 586        12 814        12 909        12 909         ...         Réseau total voies ferrées-Km
         Main Telephone Lines (per 1,000                                                                                                                                      Lignes téléphoniques fixes (pour
                                                        21           10            10            19            18            10              9             9        ...
         inhabitants)                                                                                                                                                                         1000 habitants)
         Mobile Cellular Subscribers (per                                                                                                                                    Abonnés aux téléphones mobiles
                                                          8          16            30            51           130           167           286             ...       ...
         1,000 inhabitants)                                                                                                                                                           (pour 1000 habitants)


                                    VII FINANCIAL AND MONETARY STATISTICS - FINANCES ET STATISTIQUES MONETAIRES

                                                   2002         2003           2004          2005          2006          2007          2008          2009       2010

         VII-1 Monetary Statistics                                                                                                                                  VII-1 Statistiques monétaires
         Sudanese Pound (Millions)                                                                                                                                          Pound Sudanais(Millions)
         Money supply (M1)                           3 523        4 585         6 044         8 130        11 311        12 417        14 819        17 661         ...                 Masse monétaire (M1)
         Quasi-money                                 2 108        2 631         3 349         5 340         6 492         7 271         8 049        10 624         ...                         Quasi-monnaie
           of which Demand Deposit                       ...          ...           ...           ...           ...           ...           ...           ...       ...              dont Monnaie scripturale
         Net foreign assets                         - 4 084      - 3 302       - 1 067        1 397           137         - 349          - 45        - 2 634        ...                 Avoirs extérieurs nets
         Domestic credit                             4 056        5 122         5 842         8 748        16 262        17 252        19 051        25 127         ...                         Crédit intérieur

         of which claims on private sector           1 784        2 796         4 212         6 697        10 859        11 760        12 711        15 513         ...     dont créances sur le secteur privé

         of which Claims on government                                                                                                                                         dont créances nettes sur le
                                                     2 067        2 002         1 324         1 550         4 284         3 958         3 661         6 630         ...
         sector, net                                                                                                                                                                         gouvernement
         International reserves (millions of US                                                                                                                           Réserves internationales (millions
                                                       249          529         1 338         1 869         1 660         1 378         1 399         1 094         ...
         $)                                                                                                                                                                                       de $ EU)
         Average Exchange Rate (National                                                                                                                                Taux de change (moyen) (monnaie
                                                      2.63         2.61          2.58          2.44          2.17          2.02          2.09          2.30         ...
         Currency per us $)                                                                                                                                                           nationale par dollars)


         VII-2 Public Finance                                                                                                                                                VII-2 Finances publiques
         Sudanese Pound (Millions)                                                                                                                                          Pound Sudanais(Millions)
         Total Revenues and Grants                  50 362       71 503       102 910       121 844       150 750       182 695       247 172       200 457         ...               Recettes totales et dons
           Tax Revenue                              21 372       26 294        42 031        50 076        58 810        66 872        77 695        86 558         ...                       Recettes fiscales
           Non Tax Revenue                          25 845       45 205        60 363        71 768        91 940       114 495       169 038       105 926         ...                  Recettes non fiscales

308        Grants                                        ...          ...           ...           ...      36 100         1 327           439         7 973         ...                                   Dons

         Total Expenditures and Net Lending         34 412       50 392       463 326        68 015        78 980       166 006       220 027       184 425         ...        Dépenses totales et prêts nets

           Current expenditure                      34 412       50 392       463 326        68 015        78 980       166 006       207 565       184 425         ...                   Dépenses courantes
           Of which Wages and Salaries              16 494       19 111        27 331        30 158        36 920        44 310        53 474        65 547         ...        Dont rémunérations et salaires
           Capital expenditure                     108 900      112 800       227 000       232 900       322 800       452 500        12 463       372 079         ...               Dépenses d'équipement
           Net Lending                            - 146 900      10 000         5 700        - 9 600       26 700         - 700              0             0        ...                              Prêts nets
         Fiscal Balance                             15 950       21 111      - 360 416       53 829        71 770        16 689        27 145        16 032         ...       Solde global y compris les dons


         VII-3 Balance of Payments                                                                                                                                   VII-3 Balance des paiements
         Sudanese Pound (Millions)                                                                                                                                          Pound Sudanais(Millions)
         Trade balance                            - 203 720       6 070       191 570     -1 121 710    -1 448 150    1 156 840     3 441 140      - 693 620        ...                  Balance commerciale
         Services Balance                         - 643 150    - 793 810    -1 020 410    -1 746 530    -2 583 820    -2 554 119    -2 388 790    -2 092 650        ...                   Balance des services
         Net Income                                 - 3 910      - 4 590        - 420         - 210         - 620     -2 435 270    -3 013 050    -1 511 050        ...                           Revenus nets
         Current transfers, net total              147 960        9 930        28 490       234 490       223 420       173 500       385 050     1 480 440         ...                    Transferts courants
         Current account balance                  - 702 820    - 782 400     - 800 770    -2 633 960    -3 809 170    -3 659 049    -1 575 650    -2 816 880        ...             Solde du compte courant


         VII-4 External Debt and Financial Flows                                                                                                          VII-4 Dette extérieure et flux financiers
         US $ (Millions)                                                                                                                                                                  $ E.U (Millions)
         Total external debt                        22 224       24 672        25 106        27 007        28 447        31 873        33 741        35 464     37 488                 Dette extérieure totale
           Private                                   4 003        4 376         4 541         4 351         4 475         4 858         5 602         5 652      4 300                                   Privée
           Public                                   18 221       20 296        20 565        22 656        23 972        27 015        28 139        29 812     33 188                                Publique
         Total external debt service                   142          250           310           282           307           174           330           301        663          Service de la dette extérieure
         Net Foreign Direct Investment                                                                                                                                        Investissements étranger direct
                                                       713        1 349         1 511         2 305         3 541         2 436         2 601         3 034         ...
         Inflows                                                                                                                                                                          (flux nets entrants)
         Net Total Official Development                                                                                                                                      Aide publique au développement
                                                       343          613           992         1 823         2 044         2 112         2 384         2 289         ...
         assistance                                                                                                                                                                              (nette totale)


      African Statistical Yearbook 2011 / Annuaire Statistique pour l'Afrique 2011
Sudan                                                                                                                                               Soudan

                            2002       2003       2004       2005       2006            2007        2008        2009       2010

Sudanese Pound (Millions)                                                                                                                     Pound Sudanais
Exports, fob                                                                                                                                Exportations, fàb


Exports - Total              1 949      2 542      3 778      4 824      5 657            8 879     11 671       7 834        ...              Exportations - Total


Main Products                                                                                                                               Principaux produits


Benzene                        207        185        285        466        774             653         321         402        ...                          Benzene


Sesame                         165        194        346        240        311             187         297         333        ...                          Sésame


Gum Arabic                      67         78        132        249        109             105         127          77        ...                 Gomme arabique


Cotton                         189        278        226        252        154             166         124         100        ...                            Coton


Gold                           125        130        120        159        165             120         254         199        ...                                Or

Main Destinations                                                                                                                      Principales destinations

China                       3 512.6    4 217.7    5 964.0    8 083.4    9 364.3        14 668.0    20 274.6    13 805.8       ...                             Chine


Japan                        127.9      559.9      845.2      905.6      647.2          1 524.7     1 464.5      497.4        ...                            Japon


Saudi Arabia                 344.7      325.6      442.6      368.3      296.9            197.7      224.5       460.6        ...                  Arabie Saoudite


United Arab Emirates         103.1      172.5      149.1      186.0      454.9            453.3      457.5      1 111.5       ...              Émirats Arabes Unis


United Kingdom               173.8      163.0      125.0       75.6       43.6             59.3       15.9        56.7        ...                     Royaume-Uni


                            2002       2003       2004       2005       2006            2007        2008        2009       2010
Imports, cif                                                                                                                                Importations, cif

Imports - Total                  ...        ...        ...        ...        ...             ...         ...         ...      ...    Importations - Total (millions)   309

                                                                                                                                            Principaux produits
Main Products


Machinery and Equipment      1 635        568      2 791      4 803      6 102            6 441      6 397       6 069        ...        Machines et équipements


Manufactured Goods           1 462      1 901      2 574      3 965      3 563            3 914      4 051       5 796        ...           Produits manufacturés


Wheat and wheat flour          583        524        664        934        742             733       1 496       1 619        ...            Blé et la farine de blé


Petroleum products             348        388        262        784        899             587       1 487         757        ...                Produits pétroliers


Textile                        370        336        452     16 458     17 529           17 689        627         795        ...                            Textile


Main Origin                                                                                                                            Principales provenances

Saudi Arabia                 749.7     1 038.8    1 135.8    1 295.9    1 712.2         1 319.5     9 032.7     1 313.5       ...                  Arabie Saoudite

United Arab Emirates         434.8      544.3      742.0     1 050.3    1 063.7           968.3     1 825.5     1 225.5       ...              Émirats Arabes Unis

China                        658.7      814.6     1 440.7     315.1     3 598.2         4 910.6     4 713.9     4 481.9       ...                             Chine

United Kingdom               344.9      400.8      512.6      847.6      900.4            505.1     2 477.8      465.2        ...                     Royaume-Uni

Japan                        341.0      374.4      620.6     1 300.4    1 532.9           741.4     1 572.8     1 044.3       ...                            Japon


                                                                                   African Statistical Yearbook 2011 / Annuaire Statistique pour l'Afrique 2011
Swaziland                                                                                                                                                        Swaziland

         AREA (KM 2)                                                                                17 364                                                              SUPERFICIE (KM 2)
         CAPITAL CITY                             Mbabane                                                                                Mbabane                                    CAPITALE
         CURRENCY                                 Lilangeni                                                                              Lilangeni                                  MONNAIE


                                 I SOCIAL AND DEMOGRAPHIC INDICATORS — INDICATEURS DEMOGRAPHIQUES ET SOCIAUX

                                                     2002      2003       2004       2005       2006         2007       2008       2009       2010
         Population                                                                                                                                                              Population
                                                                                                                                                             Population au milieu de l'année -
         Mid-year population - Total (Million)          1.1        1.1        1.1        1.1        1.1          1.0        1.0        1.0        1.0
                                                                                                                                                                                Total (million)
                                                                                                                                                             Population au milieu de l'année -
         Mid-year population - Urban (%)               22.0       22.0       22.0       22.0       22.0         22.0       28.5       28.5       29.0
                                                                                                                                                                                Urbaine (%)

         Female (%)                                    52.3       52.2       52.1       52.0       51.9         51.7       51.6       51.4       51.5                              Femme (%)


         Population by Age Group                                                                                                                                 Population par groupe d'âge


            0-14                                    434 900    441 600    448 800    456 300    464 000      471 800    479 600    488 500    492 897                                      0-14


            15-64                                   590 400    608 400    624 200    637 800    649 100      658 100    665 100    669 900    675 929                                     15-64


            65+                                      30 700     31 200     31 700     32 300     33 000       33 700     34 500     35 300     35 617                                      65+


         Active Population (000)                      434.0      438.0      442.0      446.0      452.0        335.1      468.0      476.0      477.0                  Population active (000)

            Female (%)                                 50.0       50.0       50.0       50.0       50.0         49.8       49.8       49.8       50.1                              Femme (%)

                                                                                                                                                            Taux brut de natalité - Total (par
         Crude birth rate - Total (per 1000)           32.0       31.6       31.2       30.9       30.5         30.3       29.9       29.6       29.2
                                                                                                                                                                                        1000)
                                                                                                                                                          Taux brut de mortalité - Total (par
         Crude death rate - Total (per 1000)           14.8       15.4       15.8       16.0       16.0         18.0       15.6       15.4       15.1
                                                                                                                                                                                       1000)
         Life expectancy at birth - Total                                                                                                                   Espérance de vie à la naissance -
                                                       47.3       46.1       45.3       45.0       45.0         43.3       45.8       46.4       47.5
         (years)                                                                                                                                                              Total (années)
         Net reproduction rate - (per                                                                                                                        Taux net de reproduction - (par
                                                         ...        ...        ...       1.1         ...          ...        ...        ...        ...
         woman)                                                                                                                                                                      femme)
                                                                                                                                                            Indice synthétique de fécondité -
         Total fertility rate - (p woman)
                       y        (per    )               4.0        4.0        3.9        3.8        3.7          4.0        3.5        3.5        3.5
                                                                                                                                                                                (par femme)

         Education                                                                                                                                                          Enseignement

         Teaching staff at first level - Total                                                                                                            Personnel enseignant - 1er degré -
                                                       6.70        6.7        6.8        6.7        6.9          7.2        7.4        7.7        8.3
         (thousands)                                                                                                                                                         Total (milliers)
         Teaching staff at second level - Total                                                                                                          Personnel enseignant - 2ème degré -
310                                                    3.80        4.1        3.8        4.2        4.0          4.4        4.5        4.7        4.9
         (thousands)                                                                                                                                                          Total (milliers)
         Teaching staff at third level - Total                                                                                                           Personnel enseignant - 3ème degré -
                                                         ...        ...        ...        ...        ...          ...        ...        ...        ...
         (thousands)                                                                                                                                                          Total (milliers)
         First level student enrollment - Total                                                                                                             Elèves inscrits - 1er degré - Total
                                                       209        209        218        222        230          233        230        230        239
         (thousands)                                                                                                                                                                  (milliers)
         First level student enrollment -                                                                                                                Elèves inscrits - 1er degré - Femmes
                                                       102        101        105        107        110          111        111        112        113
         Female (thousands)                                                                                                                                                            (milliers)
         Second level student enrollment -                                                                                                                Elèves inscrits - 2ème degré - Total
                                                        62         62         67         71         77           83         81         85         88
         Total (thousands)                                                                                                                                                           (milliers)
         Second level student enrollment -                                                                                                                      Elèves inscrits - 2ème degré -
                                                        31         31         33         36         39           39         39         42         43
         Female (thousands)                                                                                                                                                 Femmes (milliers)
         Third level student enrollment - Total                                                                                                           Elèves inscrits - 3ème degré - Total
                                                        5.2        5.4        6.6        5.9        5.7           ...        ...        ...        ...
         (thousands)                                                                                                                                                                 (milliers)
         Third level student enrollment -                                                                                                                       Elèves inscrits - 3ème degré -
                                                        2.8        2.9        3.5        3.1        2.8           ...        ...        ...        ...
         Female (thousands)                                                                                                                                                 Femmes (milliers)
         Public expenditure on education (%                                                                                                                 Dépenses publiques consacrées à
                                                         ...        ...      26.9       24.6       24.4         24.5       19.4       22.1       24.0
         of budget)                                                                                                                                           l'enseignement (% du budget)

         Health                                                                                                                                                                         Santé

         Hospital beds - Total (per 10 000                                                                                                                  Nombre de lits d'hôpitaux - Total
                                                         ...        ...      613          ...        ...          ...        ...        ...        ...
         population)                                                                                                                                                           (pour 10 000)
         Nurses - Total (per 10 000                                                                                                                        Nombre d'infirmières - Total (pour
                                                         ...        ...        ...        ...        ...          ...       15         15          ...
         population)                                                                                                                                                                 10 000)
         Physicians - Total (per 10 000                                                                                                                    Nombre de médecins - Total (pour
                                                         ...        ...         2         ...        ...          ...         1          1         ...
         population)                                                                                                                                                               10 000)
         Public expenditure on Health (% of                                                                                                              Dépenses publiques consacrées à la
                                                        11          9         12         13         11           10          7         10         11
         budget)                                                                                                                                                      santé (% du budget)


      African Statistical Yearbook 2011 / Annuaire Statistique pour l'Afrique 2011
Swaziland                                                                                                                                            Swaziland
                                                  II NATIONAL ACCOUNTS — COMPTES NATIONAUX

                                        2002      2003      2004      2005      2006        2007       2008      2009       2010

Gross domestic product by kind of economic activity at current prices
                                                                                   Produit intérieur brut par branche d'activité économique aux prix courants


Lilangeni (Millions)                                                                                                                             Lilangeni(Millions)

Agriculture                              1 098     1 074     1 084     1 139     1 152       1 277      1 460     1 588         ...                            Agriculture

Mining and quarrying                       47        50        57        44        57           54        52         57         ...                 Industries extractives

Manufacturing                            4 177     4 578     4 820     5 042     6 078       6 686      7 816     8 519         ...            Industries manufacturières

Electricity, gas & water                  101       108       125       132       139          149       175        188         ...                 Electricité, gaz et eau

Construction                              445       436       538       568       588          568       551        535         ...          Bâtiments et travaux publics
Wholesale & retail trade,                                                                                                                 Commerce de gros et de détail,
                                         1 331     1 417     1 396     1 487     1 678       1 774      2 007     2 107         ...
restaurants, hotels                                                                                                                                restaurants et hôtels
                                                                                                                                           Banques, assurances, affaires
Finance, insurance, real estate, etc.     996      1 079     1 187     1 302     1 403       1 558      1 850         0         ...
                                                                                                                                                           immobilières
Transport and communications              649       732       787       861       972        1 199      1 363     2 642         ...      Transport(s) et communications
                                                                                                                                             Administrations publiques et
Public administration and defense        1 783     2 003     2 222     2 434     2 712       2 859      3 358     4 604         ...
                                                                                                                                                                 défense
Other services                            195       215       226       242       251          272       306        345         ...                        Autres services
                                                                                                                                          Moins Services d’intermédiation
Less Imputed Service Charges            - 193     - 212     - 258     - 300     - 332        - 372      - 432     - 431         ...
                                                                                                                                                                financière
Gross domestic product at factor                                                                                                      Produit intérieur brut aux couts des
                                        10 630    11 479    12 184    12 952    14 698      16 024     18 506    20 154         ...
cost / basic prices                                                                                                                                 facteurs / prix de base

Plus: Indirect Taxes / taxes on                                                                                                       Plus taxes indirectes/impôts sur les
                                         2 274     2 546     3 453     3 481     5 264       5 491      6 441     6 634         ...
products, less subsidies                                                                                                                  produits, moins les subventions


Expenditure on Gross domestic product at current purchaser's values
                                                                                               Emploi du produit intérieur brut aux prix courants d'acquisition

Lilangeni (Millions)                                                                                                                             Lilangeni(Millions)
                                                                                                                                                Consommation finale des
Government final consumption             2 066     2 084     2 364     2 501     2 771       3 041      3 338     3 663         ...
                                                                                                                                                administrations publiques

Private final consumption                9 034     9 484    11 282    12 138    15 111      16 107     22 242    23 622         ...           Consommation finale privée

Gross fixed capital formation            2 491     2 590     2 388     2 471     2 558       2 644      2 756     2 757         ...        Formation brute de capital fixe

Increase in inventories                     ...       ...       ...       ...       ...          ...       ...        ...       ...                   Variation des stocks

Exports of goods and services           12 351    14 158    13 280    14 308    15 294      16 281     14 741    14 875         ...     Exportations de biens et services
                                                                                                                                                                              311
                                                                                                                                           Moins importations de biens et
Less imports of goods and services      13 037    14 292    13 677    14 985    15 772      16 558     18 129    18 129         ...
                                                                                                                                                                 services
GDP at purchasers' values               12 904    14 025    15 636    16 433    19 962      21 515     24 947    26 788         ...             PIB aux prix d'acquisition


Gross domestic product by kind of economic activity at constant
                                                                                  Produit intérieur brut par branche d'activité economique aux prix constants
prices
Annual Growth Rates (%)                                                                                                        Taux de croissance annuel (%)
Agriculture                                5.3       4.9      -2.9       5.4      -2.4         2.6       -0.1       -0.9        ...                            Agriculture

Mining and quarrying                      11.2     -20.1       9.0     -21.5      15.8        -39.1     -16.0      -30.0        ...                 Industries extractives

Manufacturing                              2.1       1.8       1.0       0.9       1.5         2.6        1.6       -3.1        ...            Industries manufacturières

Electricity, gas & water                  14.2       2.3      -2.5       3.8       5.1         4.8        2.4       5.7         ...                 Electricité, gaz et eau

Construction                             -10.7      -9.9      17.3       5.6       3.5         -3.4      -3.0       -2.6        ...          Bâtiments et travaux publics
Wholesale & retail trade,                                                                                                                        Commerce de gros et de
                                          -6.2      -0.5       8.8       8.2      10.6         9.6        4.4      -13.9        ...
restaurants, hotels                                                                                                                            détail,restaurants et hôtels
                                                                                                                                            Banques, assurances, affaires
Finance, insurance, real estate, etc.      6.1       3.7       1.9       2.9       3.2         3.6        4.3      30.4         ...
                                                                                                                                                            immobilières
Transport and communications              14.8      11.5       7.6      13.3       5.6         3.0        7.2       5.6         ...      Transport(s) et communications
                                                                                                                                             Administrations publiques et
Public administartion and defense          1.2       2.8       3.3      -4.3       5.8         4.4        1.8       3.7         ...
                                                                                                                                                                 défense
Other services                             2.0       2.0       2.0       2.3       2.4         3.7        3.0       3.5         ...                        Autres services
                                                                                                                                          Moins Services d’intérmediation
Less Imputed Service Charges              11.8       6.9       3.4       4.3       4.3         3.5        3.0       7.5         ...
                                                                                                                                                                financière
Gross domestic product at factor                                                                                                      Produit intérieur brut aux couts des
                                           2.0       2.3       2.9       2.6       3.4         3.5        2.4       1.2         ...
cost / basic prices                                                                                                                                 facteurs / prix de base

Plus: Indirect Taxes / taxes on                                                                                                       Plus taxes indirectes/impôts sur les
                                           0.9       1.8       3.1       1.8       2.8         3.4        2.1       1.3         ...
products, less subsidies                                                                                                                  produits, moins les subventions

Gross domestic product at market                                                                                                        Produit intérieur brut aux prix du
                                           1.8       2.2       2.9       2.5       3.3         3.5        2.4       1.2         ...
prices                                                                                                                                                             marché


                                                                                      African Statistical Yearbook 2011 / Annuaire Statistique pour l'Afrique 2011
Swaziland                                                                                                                                                                    Swaziland

         Expenditure on Gross domestic product at constant purchasers'
                                                                                                                       Emplois du produit intérieur brut aux prix constants d'acquisition
         values

         Annual Growth Rates (%)                                                                                                                               Taux de croissance annuel (%)
                                                                                                                                                                                 Consommation finale des
         Government final consumption                   -4.9         -3.3          4.8          2.8         -5.8          5.7         32.0          3.4         ...
                                                                                                                                                                                 administrations publiques

         Private final consumption                      -4.5         -2.1          9.9          5.1          5.9          2.2          9.6          6.2         ...            Consommation finale privée

         Gross fixed capital formation                  -7.4         -0.4        -14.8          0.6        -12.0         -0.4         18.9         -5.7         ...        Formation brute de capital fixe

         Exports of goods and services                  14.4          9.8        -13.3          4.7         -9.1          2.5         -6.3         -5.3         ...      Exportations de biens et services

                                                                                                                                                                           Moins importations de biens et
         Less imports of goods and services              4.8          5.0        -11.5          6.5        -10.5          1.1          8.8         -0.3         ...
                                                                                                                                                                                                 services


                                                                                               III INFLATION

                                                     2002         2003         2004         2005         2006         2007         2008         2009       2010
         Annual Growth Rates (%)                                                                                                                               Taux de croissance annuel (%)
         All Item                                       11.7          7.4          3.4          4.8          5.3          8.1         12.6          7.6        4.5                                Ensemble

         Food                                           21.8         12.6          6.9          9.1         14.7         17.6         18.9         10.2        0.4                             Alimentation

         Health                                          6.7          3.6          2.9          0.1          0.1          3.7          2.9          5.3        2.1                                    Santé

         Energy                                          2.2          7.7          3.1          3.9          2.0         12.4         38.7          0.5        9.7                                  Energie

         Transport                                      10.8          4.6          0.4          5.4          6.8          8.8         28.4          1.8        5.0                                Transport


                                                           IV AGRICULTURAL PRODUCTION - PRODUCTION AGRICOLE

                                                     2002         2003         2004         2005         2006         2007         2008         2009       2010
         Tons (Thousand)                                                                                                                                                            Tonnes (milliers)
         Sugar cane, metric tons                    500 670      583 014      628 191      597 563      652 735      623 357      631 236      626 984     605 665       Canne à sucre, tonnes métriques

         Maize, metric tons                          67 639       62 534       77 540       77 500       67 000       83 090       62 090       70 690          ...                Maïs, tonnes métriques

         Citrus, metric tons                        100 072       89 854       74 618       67 032       70 506       85 263       79 664       77 282          ...            Agrumes, tonnes métriques

         Cotton, metric tons                          6 000        3 959        1 221        3 168          984          720          394        1 566          ...               Coton, tonnes métriques

                                                          ...          ...          ...          ...          ...          ...          ...          ...        ...


                                                                   V MINING PRODUCTION - PRODUCTION MINIERE
312
                                                     2002         2003         2004         2005         2006         2007         2008         2009       2010


         Coal, metric tons (thousands)             553 422.0    448 664.0    488 314.0    221 701.0    310 570.0    241 283.0    174 807.0    129 647.0         ... Houilles, tonnes métriques (milliers)

         Quarry stone, metric tons                 283 175.0    224 129.0    230 062.0    566 772.0    534 688.0    207 535.0    240 997.0    202 319.0         ...      Pierres taillées, tonnes métriques
         (thousands)                                                                                                                                                                               (milliers)

                                                          ...          ...          ...          ...          ...          ...          ...          ...        ...


                                                                                          VI ENERGY - ENERGIE

                                                     2002         2003         2004         2005         2006         2007         2008         2009       2010

         Electricity - total hydro production,                                                                                                                         Électricité - production hydraulique
                                                          ...          ...          ...          ...          ...          ...          ...          ...        ...
         kilowatt hours (millions)                                                                                                                                        totale, kilowatt-heures (millions)

         Electricity - total thermal production,                                                                                                                         Électricité - production thermique
                                                      203.6        123.0        103.5        159.5        125.8        134.2        149.0        153.0          ...
         kilowatt hours (millions)                                                                                                                                        totale, kilowatt-heures (millions)

         Electricity - total production, self-                                                                                                                        Electricité - Production totale privée
                                                          ...          ...          ...          ...          ...          ...          ...          ...        ...
         producer (Million Kilowatt Hours)                                                                                                                                      (million de kilowatt heures)

         Electricity - total production, public                                                                                                                              Electricité - Production totale
                                                        204          123          104          160          126          134          149          153          ...
         (Million Kilowatt Hours)                                                                                                                                     publique (million de kilowatt heures)


      African Statistical Yearbook 2011 / Annuaire Statistique pour l'Afrique 2011
Swaziland                                                                                                                                                          Swaziland
                                         VII TOURISM AND INFRASTRUCTURE - TOURISME ET INFRASTUCTURE

                                          2002       2003        2004       2005        2006          2007       2008       2009       2010

Arrivals - Tourists (thousands)          332.343     354.499     353.492    351.041     369.809      384.782      416.4      455.8           ...           Arrivées - touristes (milliers)

Rooms in hotels and similar                                                                                                                    Chambres d'hotels et établissements
establishments (thousands)               420.754     478.788     477.363    454.157     456.253      582.602      591.5      656.2     573.149                  assimilés (milliers)

Paved Road (% of total)                       20          20         29          33          38           38         38         38          38          Routes asphaltées (% du total)
Total Network (Railways-km)                  302         302        302         302         297          297        297        297         297           Réseau total voies ferrées-Km
Main Telephone Lines (per 1,000                                                                                                                        Lignes téléphoniques fixes (pour
                                              34          37         38          38          37           40         41         42           ...
inhabitants)                                                                                                                                                           1000 habitants)
Mobile Cellular Subscribers (per                                                                                                                       Abonnés aux téléphones mobiles
                                              59          80        101         189         244          352        453        553           ...
1,000 inhabitants)                                                                                                                                              (pour 1000 habitants)


                          VII FINANCIAL AND MONETARY STATISTICS - FINANCES ET STATISTIQUES MONETAIRES

                                          2002       2003        2004       2005        2006          2007       2008       2009       2010

VII-1 Monetary Statistics                                                                                                                     VII-1 Statistiques monétaires
Lilangeni (Millions)                                                                                                                                           Lilangeni(Millions)
Money supply (M1)                            806       1 034       1 081      1 295       1 358        1 667      1 972      2 337       2 539                   Masse monétaire (M1)
Quasi-money                                1 777       1 921       2 082      2 175       2 982        3 605      4 111      5 376       5 784                           Quasi-monnaie
  of which Demand Deposit                      ...         ...        ...         ...         ...          ...        ...        ...         ...              dont Monnaie scripturale
Net foreign assets                         1 340       1 123       1 358      1 897       3 296        5 760      8 065      7 811       5 744                    Avoirs extérieurs nets
Domestic credit                            1 928       2 334       2 811      2 833       2 681        1 390        454      2 273       4 668                           Crédit intérieur

of which claims on private sector          1 546       2 119       2 745      3 469       4 250        5 184      5 527      6 250       6 215       dont créances sur le secteur privé

of which Claims on government                                                                                                                               dont créances nettes sur le
                                             145         - 5       - 197      - 787      - 1 677      - 3 884    - 5 296    - 4 238     - 2 232
sector, net                                                                                                                                                             gouvernement
International reserves (millions of US                                                                                                             Réserves internationales (millions de
                                             276         278        324         244         373          774        752        959         756
$)                                                                                                                                                                                 $ EU)
Average Exchange Rate (National                                                                                                                     Taux de change (moyen) (monnaie
                                           10.54        7.56        6.46       6.36        6.77         7.05       8.26       8.47        7.32
Currency per us $)                                                                                                                                              nationale par dollars)


VII-2 Public Finance                                                                                                                                   VII-2 Finances publiques
Lilangeni (Millions)                                                                                                                                           Lilangeni(Millions)
Total Revenues and Grants                  3 627       3 952       4 894      5 681       8 192        9 085      9 426     10 139           ...               Recettes totales et dons
  Tax Revenue                              3 295       3 740       4 704      5 367       7 855        8 880      9 063      9 809           ...                       Recettes fiscales
  Non Tax Revenue                            205          80         74         141         172          121        217        208           ...                  Recettes non fiscales
  Grants                                     127         132        116         172         166           83        145        122           ...                                   Dons      313
Total Expenditures and Net Lending         3 517       4 400       5 534      6 014       6 118        7 615      9 547     10 001           ...         Dépenses totales et prêts nets

  Current expenditure                      2 650       3 488       4 247      4 475       4 681        5 728      7 209      7 502           ...                   Dépenses courantes
  Of which Wages and Salaries              1 163       1 659       1 947      2 401       2 589        3 177      3 924      4 025           ...         Dont rémunérations et salaires
  Capital expenditure                        867         806       1 275      1 410       1 437        1 887      2 338      2 499           ...               Dépenses d'équipement
  Net Lending                                  0         106         12         129           0            0          0          0           ...                              Prêts nets
Fiscal Balance                               110       - 448       - 640      - 333       2 074        1 470      - 121        139           ...        Solde global y compris les dons


VII-3 Balance of Payments                                                                                                                          VII-3 Balance des paiements
Lilangeni (Millions)                                                                                                                                           Lilangeni(Millions)
Trade balance                              1 346         958        587      - 1 641     - 1 706       - 705       - 82     - 1 107          ...                  Balance commerciale
Services Balance                          - 1 305     - 1 090      - 827      - 765       - 610       - 1 858    - 3 520    - 3 070          ...                   Balance des services
Net Income                                    48       - 317         17       1 134          95          290       - 43     - 1 040          ...                           Revenus nets
Current transfers, net total                 659       1 136        683         620         890        1 290      1 732      1 620           ...                    Transferts courants
Current account balance                      748         687        461       - 653      - 1 332       - 984     - 1 912    - 3 597          ...              Solde du compte courant


VII-4 External Debt and Financial Flows                                                                                           VII-4 Dette extérieure et flux financiers
US $ (Millions)                                                                                                                                                     $ E.U (Millions)
Total external debt                          415         451        520         409         394          470        427        542           ...                 Dette extérieure totale
  Private                                     95         106         70          63          64           68         51         53           ...                                  Privée
  Public                                     320         345        450         345         330          403        377        489           ...                               Publique
Total external debt service                   29          43         47          38          41           42         43         63           ...          Service de la dette extérieure
Net Foreign Direct Investment                                                                                                                      Investissements étranger direct (flux
                                              92        - 61         71        - 46         121           37        106         66           ...
Inflows                                                                                                                                                                  nets entrants)
Net Total Official Development                                                                                                                        Aide publique au développement
                                              22          40         25          47          35           51         70         58           ...
assistance                                                                                                                                                               (nette totale)


                                                                                                African Statistical Yearbook 2011 / Annuaire Statistique pour l'Afrique 2011
Swaziland                                                                                                                                              Swaziland

                                                  2002       2003        2004       2005       2006       2007       2008       2009      2010

         Lilangeni (Millions)                                                                                                                                            Lilangeni
         Exports, fob                                                                                                                                         Exportations, fàb


         Exports - Total                          10 848     12 609      11 667     10 407     11 260     12 293     12 959     13 270       ...                 Exportations - Total


         Main Products                                                                                                                                        Principaux produits


                                                                                                                                                            Mélanges de substances
         Mixtures of odoriferous substances
                                                   5 231      4 281       3 539      2 755      2 390      2 689      2 719         ...      ... odoriférantes et mélanges, yc. solut
         and mixtures, incl. alcoholic solut
                                                                                                                                                                         alcoolisées


         Raw sugar cane                              542        789         862        820      1 666      1 354      1 530         ...      ...                 Canne à sucre, brut


         Unbleached coniferous chemical                                                                                                            Écrus de bois de conifères de pâte
                                                     708        831         682        372        592        343          ...       ...      ...
         wood pulp, soda or sulphate                                                                                                                   chimique, soudé ou au sulfate

                                                                                                                                                    T-shirts et maillots de corps avec
         T-shirts, singlets and other vests of
                                                     327        743         248        207          ...        ...        ...       ...      ...        d'autres matières textiles, en
         textile materials, knitted
                                                                                                                                                                            bonneterie
                                                                                                                                                   Produits, préparations et produits
         Products, preparations and residual
                                                       ...        ...         ...      629      1 237      1 779      1 891         ...      ... résiduaires des industries chimiques
         products of the chemical or allied
                                                                                                                                                          ou des industries connexes
         Main Destinations                                                                                                                                Principales destinations

         South Africa                             6 968.1    8 111.3     6 391.3    5 693.5    5 225.3    6 527.9    8 301.3        ...      ...                      Afrique du Sud


         Mozambique                                527.7      393.2       383.7      187.2      418.8      451.3      369.4         ...      ...                        Mozambique


         U.S.A                                     919.9     1 457.5     1 045.6     699.6     1 004.0     385.2      254.5         ...      ...                           Etats-Unis


         Kenya                                     329.2          ...     299.1      165.3      400.9      292.0      116.6         ...      ...                               Kenya


         Australia                                 259.5      215.3       246.5      178.3      236.8      263.3          ...       ...      ...                             Australie


                                                  2002       2003        2004       2005       2006       2007       2008       2009      2010
         Imports, cif                                                                                                                                          Importations, cif

314      Imports - Total                          11 238     12 377      11 574      7 962      9 906     10 082     10 624         ...      ...       Importations - Total (millions)


                                                                                                                                                              Principaux produits
         Main Products


         Petrol                                      312        275         354        468        433        486        633         ...      ...                              Pétrole


         Distillate Fuels                            334        270         301        440        458        478        607         ...      ...                Combustibles distillés


         Motor cars and other motor vehicles                                                                                                        Voitures, camionnettes et autres
                                                     225        310         182        186        160        174        134         ...      ...      véhicules automobiles pour le
         principally designed for the transport
                                                                                                                                                                            transport
         Dyed fabrics, knitted or crocheted,                                                                                                         Tissus teints, en bonneterie, de
                                                     189        279         181          ...        ...      147          ...       ...      ...
         of synthetic fibres                                                                                                                                      fibres synthétiques

                                                                                                                                                            Mélanges de substances
         Mixtures of odoriferous substances
                                                     761        792       1 802        872        178          ...        ...       ...      ... odoriférantes et mélanges, yc. solut
         and mixtures, incl. alcoholic solut
                                                                                                                                                                         alcoolisées

         Main Origin                                                                                                                                     Principales provenances

         South Africa                             9 638.7    9 704.0    10 469.9    9 571.3    7 219.0    8 166.2    8 324.9        ...      ...                      Afrique du Sud

         Hong Kong                                 274.8      174.8       126.5       93.5       75.0          ...        ...       ...      ...                          Hong Kong

         Taiwan                                    505.3      399.6       299.3      260.0      299.5      196.4      169.6         ...      ...                              Taiwan

         Japan                                      58.9          ...         ...     44.4       95.6       66.7       48.3         ...      ...                               Japon

         China                                     130.1      155.5       100.3      207.1      233.8      249.3       87.8         ...      ...                                Chine


      African Statistical Yearbook 2011 / Annuaire Statistique pour l'Afrique 2011
Tanzania                                                                                                                                                                      Tanzanie

AREA (KM 2)                                                                                        945 090                                                               SUPERFICIE (KM 2)
CAPITAL CITY                             Dar es Salaam                                                                              Dar es Salaam                                    CAPITALE
CURRENCY                                 Tanzanian Shilling                                                                     Shilling Tanzanien                                   MONNAIE


                          I SOCIAL AND DEMOGRAPHIC INDICATORS — INDICATEURS DEMOGRAPHIQUES ET SOCIAUX

                                            2002         2003         2004         2005         2006         2007         2008         2009       2010
Population                                                                                                                                                                        Population
                                                                                                                                                               Population au milieu de l'année -
Mid-year population - Total (Million)          36.0         36.9         37.9         39.0         40.1         41.3         42.5         43.7       ...
                                                                                                                                                                                  Total (million)
                                                                                                                                                               Population au milieu de l'année -
Mid-year population - Urban (%)                  ...          ...        24.0         24.0         25.0         25.0         25.0         25.9       ...
                                                                                                                                                                                  Urbaine (%)

Female (%)                                     50.3         50.3         50.3         50.2         50.2         50.2         50.2         50.1       ...                             Femme (%)


Population by Age Group                                                                                                                                            Population par groupe d'âge


   0-14                                   16047 084    16468 495    16915 701    17390 286    17892 293    18420 761    18974 457    19551 402       ...                                     0-14


   15-64                                  18852 583    19364 829    19893 641    20439 808    21005 350    21592 212    22200 874    22831 403       ...                                    15-64


   65+                                     1057 907     1096 325     1136 132     1177 265     1219 598     1263 234     1308 595     1356 247       ...                                      65+


Active Population (000)                    17 728.0     18 194.0     18 683.0     19 199.0     19 749.0     20 362.0     20 985.0     21 644.0       ...                 Population active (000)

   Female (%)                                  49.9         49.9         49.9         49.9         49.9         49.7         49.7         49.7       ...                             Femme (%)

                                                                                                                                                              Taux brut de natalité - Total (par
Crude birth rate - Total (per 1000)            41.8         41.9         41.9         41.9         41.8         41.7         41.5         40.0       ...
                                                                                                                                                                                         1000)
                                                                                                                                                             Taux brut de mortalité - Total (par
Crude death rate - Total (per 1000)            13.5         13.1         12.8         12.4         12.0         11.7         11.4         14.0       ...
                                                                                                                                                                                          1000)
Life expectancy at birth - Total                                                                                                                              Espérance de vie à la naissance -
                                               51.7         52.3         53.0         53.7         54.3         55.0         55.7         56.3     58.1
(years)                                                                                                                                                                         Total (années)
Net reproduction rate - (per                                                                                                                                   Taux net de reproduction - (par
                                                 ...          ...          ...         2.1           ...          ...          ...          ...      ...
woman)                                                                                                                                                                                femme)
                                                                                                                                                              Indice synthétique de fécondité -
Total fertility rate - (per woman)              5.7          5.7          5.6          5.6          5.6          5.6          5.6          5.2       ...
                                                                                                                                                                                  (par femme)

Education                                                                                                                                                                     Enseignement

Teaching staff at first level - Total                                                                                                                       Personnel enseignant - 1er degré -
                                                 ...          ...          ...          ...          ...          ...          ...          ...      ...
(thousands)                                                                                                                                                                    Total (milliers)
Teaching staff at second level -                                                                                                                           Personnel enseignant - 2ème degré -
                                                 ...          ...          ...          ...          ...          ...          ...          ...      ...
Total (thousands)                                                                                                                                                               Total (milliers)
Teaching staff at third level - Total                                                                                                                      Personnel enseignant - 3ème degré -
                                                                                                                                                                                                     315
                                                 ...          ...          ...          ...          ...          ...          ...          ...      ...
(thousands)                                                                                                                                                                     Total (milliers)
First level student enrollment - Total                                                                                                                        Elèves inscrits - 1er degré - Total
                                                 ...          ...          ...          ...          ...          ...          ...          ...      ...
(thousands)                                                                                                                                                                             (milliers)
First level student enrollment -                                                                                                                           Elèves inscrits - 1er degré - Femmes
                                              2 929        3 197        3 457        3 685        3 908        4 102        4 244           ...      ...
Female (thousands)                                                                                                                                                                      (milliers)
Second level student enrollment -                                                                                                                           Elèves inscrits - 2ème degré - Total
                                                 ...          ...          ...        524          676         1 021        1 222        1 466       ...
Total (thousands)                                                                                                                                                                      (milliers)
Second level student enrollment -                                                                                                                                 Elèves inscrits - 2ème degré -
                                                 ...          ...          ...          ...          ...          ...          ...          ...      ...
Female (thousands)                                                                                                                                                            Femmes (milliers)
Third level student enrollment -                                                                                                                            Elèves inscrits - 3ème degré - Total
                                               26.5         31.0         42.9         51.1           ...        55.1           ...          ...      ...
Total (thousands)                                                                                                                                                                      (milliers)
Third level student enrollment -                                                                                                                                  Elèves inscrits - 3ème degré -
                                                6.2          9.5         12.5         16.5           ...        17.8           ...          ...      ...
Female (thousands)                                                                                                                                                            Femmes (milliers)
Public expenditure on education (%                                                                                                                            Dépenses publiques consacrées à
                                                 ...          ...          ...          ...          ...          ...          ...          ...      ...
of budget)                                                                                                                                                      l'enseignement (% du budget)

Health                                                                                                                                                                                   Santé

Hospital beds - Total (per 10 000                                                                                                                             Nombre de lits d'hôpitaux - Total
                                                  2            4            4            4            4            4            4            4       ...
population)                                                                                                                                                                     (pour 10 000)
Nurses - Total (per 10 000                                                                                                                                   Nombre d'infirmières - Total (pour
                                                 ...          ...          ...          ...          ...          ...          ...          ...      ...
population)                                                                                                                                                                            10 000)
Physicians - Total (per 10 000                                                                                                                               Nombre de médecins - Total (pour
                                                  2            4            4            4            5            5           ...          ...      ...
population)                                                                                                                                                                          10 000)
Public expenditure on Health (% of                                                                                                                         Dépenses publiques consacrées à la
                                                  9          13           14           15           14            ...          ...          ...      ...
budget)                                                                                                                                                                  santé (% du budget)


                                                                                                      African Statistical Yearbook 2011 / Annuaire Statistique pour l'Afrique 2011
Tanzania                                                                                                                                                                   Tanzanie
                                                                    II NATIONAL ACCOUNTS — COMPTES NATIONAUX

                                                     2002         2003         2004         2005         2006         2007         2008         2009      2010

          Gross domestic product by kind of economic activity at current prices
                                                                                                              Produit intérieur brut par branche d'activité économique aux prix courants


          Tanzanian Shilling (Millions)                                                                                                                            Shilling Tanzanien(Millions)

          Agriculture                              3 161 372    3 667 339    4 323 469    4 636 136    4 950 010    5 690 446    6 671 068    7 344 928      ...                            Agriculture

          Mining and quarrying                      220 000      288 200      357 368      457 431      576 363      742 932      839 513      941 094       ...                  Industries extractives

          Manufacturing                             866 228     1 002 827    1 129 558    1 269 145    1 395 282    1 625 504    1 935 975    2 434 754      ...            Industries manufacturières

          Electricity, gas & water                  258 306      281 006      306 451      340 530      352 724      420 880      514 526      584 031       ...                 Electricité, gaz et eau

          Construction                              707 025      966 452     1 105 886    1 249 651    1 399 609    1 641 741    1 904 420    2 233 885      ...          Bâtiments et travaux publics
          Wholesale & retail trade,                                                                                                                                    Commerce de gros et de détail,
                                                   1 567 469    1 741 410    1 913 082    2 147 243    2 504 005    2 976 228    3 524 919    3 976 910      ...
          restaurants, hotels                                                                                                                                                   restaurants et hôtels
                                                                                                                                                                        Banques, assurances, affaires
          Finance, insurance, real estate, etc.    1 187 804    1 340 018    1 499 478    1 785 370    2 023 305    2 327 107    2 782 255    3 010 262      ...
                                                                                                                                                                                        immobilières
          Transport and communications              657 206      739 600      844 597      983 507     1 144 071    1 373 976    1 648 958    2 005 866      ...       Transport(s) et communications
                                                                                                                                                                           Administrations publiques et
          Public administration and defense         754 654      866 917     1 076 215    1 278 881    1 440 913    1 652 556    2 026 815    2 282 763      ...
                                                                                                                                                                                               défense
          Other services                            450 269      486 968      537 075      591 596      661 604      746 757      863 640     1 024 272      ...                        Autres services
                                                                                                                                                                    Moins Services d’intermédiation
          Less Imputed Service Charges              - 90 400    - 105 382    - 120 588    - 141 723    - 169 661    - 208 281    - 260 029    - 328 478      ...
                                                                                                                                                                                             financière
          Gross domestic product at factor                                                                                                                       Produit intérieur brut aux couts des
                                                   9 739 933   11 275 355   12 972 591   14 597 767   16 278 225   18 989 844   22 452 059   25 510 287      ...
          cost / basic prices                                                                                                                                                  facteurs / prix de base

          Plus: Indirect Taxes / taxes on                                                                                                                           Plus taxes indirectes/impôts sur les
                                                    704 574      831 707      999 001     1 367 527    1 663 043    1 958 559    2 329 620    2 702 359      ...
          products, less subsidies                                                                                                                                      produits, moins les subventions


          Expenditure on Gross domestic product at current purchaser's values
                                                                                                                          Emploi du produit intérieur brut aux prix courants d'acquisition

          Tanzanian Shilling (Millions)                                                                                                                            Shilling Tanzanien(Millions)
                                                                                                                                                                             Consommation finale des
          Government final consumption             1 372 744    1 858 769    2 361 721    2 804 521    3 144 881    4 038 989    4 321 718    4 926 759      ...
                                                                                                                                                                             administrations publiques

          Private final consumption                7 512 354    8 442 113    9 352 717   10 581 908   12 195 212   14 231 135   16 460 068   18 476 811      ...           Consommation finale privée

          Gross fixed capital formation            1 750 816    2 277 151    3 095 522    3 936 683    4 883 490    6 119 013    7 274 314    8 020 970      ...        Formation brute de capital fixe

          Increase in inventories                    44 596       43 387       57 845       64 405       74 292       90 728      106 943      152 252       ...                   Variation des stocks

          Exports of goods and services            1 836 223    2 247 385    2 745 596    3 324 425    4 047 990    5 078 248    6 230 729    6 553 198      ...      Exportations de biens et services
                                                                                                                                                                        Moins importations de biens et
316       Less imports of goods and services       2 072 225    2 761 744    3 641 808    4 746 646    6 404 597    8 609 710    9 612 093    9 917 343      ...
                                                                                                                                                                                              services
          GDP at purchasers' values               10 444 507   12 107 062   13 971 592   15 965 294   17 941 268   20 948 403   24 781 679   28 212 646      ...              PIB aux prix d'acquisition


          Gross domestic product by kind of economic activity at constant prices                             Produit intérieur brut par branche d'activité economique aux prix constants

          Annual Growth Rates (%)                                                                                                                           Taux de croissance annuel (%)
          Agriculture                                    5.0          3.2          5.9          4.4          3.9          4.0          4.6          3.2      ...                            Agriculture

          Mining and quarrying                          16.9         17.1         16.0         16.1         15.6         10.7          2.5          1.2      ...                  Industries extractives

          Manufacturing                                  7.5          9.0          9.4          9.6          8.5          8.7          9.9          8.0      ...            Industries manufacturières

          Electricity, gas & water                       5.6          6.7          7.1          8.5         -0.5         10.1          5.6          7.9      ...                 Electricité, gaz et eau

          Construction                                  11.9         13.8         13.0         10.1          9.5          9.7         10.5          7.5      ...          Bâtiments et travaux publics
          Wholesale & retail trade,                                                                                                                                          Commerce de gros et de
                                                         8.0          8.6          5.4          6.5          8.7          9.0          9.2          7.1      ...
          restaurants, hotels                                                                                                                                              détail,restaurants et hôtels
                                                                                                                                                                         Banques, assurances, affaires
          Finance, insurance, real estate, etc.          7.5          7.1          7.0          8.0          7.9          7.5          7.8          7.1      ...
                                                                                                                                                                                          immobilières
          Transport and communications                   6.8          7.1         10.5          9.4          8.6         10.1         10.8         11.0      ...       Transport(s) et communications
                                                                                                                                                                           Administrations publiques et
          Public administartion and defense              9.2          9.6         13.6         11.4          6.5          6.7          7.0          4.4      ...
                                                                                                                                                                                               défense
          Other services                                 6.5          4.5          5.0          5.1          6.0          6.2          7.0          6.3      ...                        Autres services
                                                                                                                                                                    Moins Services d’intérmediation
          Less Imputed Service Charges                   8.7         11.7         10.1         11.8         14.9         15.3         11.0          8.7      ...
                                                                                                                                                                                             financière
          Gross domestic product at factor                                                                                                                       Produit intérieur brut aux couts des
                                                         7.2          6.9          7.8          7.4          6.7          7.2          7.4          6.0      ...
          cost / basic prices                                                                                                                                                  facteurs / prix de base

          Plus: Indirect Taxes / taxes on                                                                                                                           Plus taxes indirectes/impôts sur les
                                                         7.2          6.9          7.8          7.4          6.8          6.9          7.8          5.8      ...
          products, less subsidies                                                                                                                                      produits, moins les subventions

          Gross domestic product at market                                                                                                                            Produit intérieur brut aux prix du
                                                         7.2          6.9          7.8          7.4          6.7          7.1          7.4          6.0      ...
          prices                                                                                                                                                                                marché


           2009: Provisional                                                                                                                                                        2009: provisoire


      African Statistical Yearbook 2011 / Annuaire Statistique pour l'Afrique 2011
Tanzania                                                                                                                                                             Tanzanie

Expenditure on Gross domestic product at constant purchasers' values                                    Emplois du produit intérieur brut aux prix constants d'acquisition


Annual Growth Rates (%)                                                                                                                   Taux de croissance annuel (%)
                                                                                                                                                             Consommation finale des
Government final consumption                 18.4         29.0       14.6        11.9         8.2         9.5       13.2         5.1        ...
                                                                                                                                                             administrations publiques

Private final consumption                      5.7          2.7        6.2       11.2         8.1         6.0        4.9         3.4        ...           Consommation finale privée

Gross fixed capital formation                  7.9        14.0       10.4        18.7       16.0         14.5        7.8       10.0         ...        Formation brute de capital fixe

Exports of goods and services                  7.7        19.5         8.3       13.5        -3.3        16.8       19.6         5.1        ...      Exportations de biens et services

                                                                                                                                                       Moins importations de biens et
Less imports of goods and services             9.1        21.5         9.6       34.2       10.3         16.3       12.3         2.6        ...
                                                                                                                                                                             services


                                                                                  III INFLATION

                                           2002         2003       2004        2005       2006        2007       2008        2009       2010
Annual Growth Rates (%)                                                                                                                   Taux de croissance annuel (%)
All Item                                       5.3          5.3        4.7         5.0        7.3         7.0       10.3       12.1       8.9                                Ensemble

Food                                           8.2          6.6        8.3         4.7        7.0         7.0       12.7       17.5      -28.4                            Alimentation

Health                                         2.1          1.7       -8.5         2.3      11.2          2.9        5.0         6.8      -1.7                                   Santé

Energy                                         6.4          4.1        7.1       12.7         8.5         6.1       10.7        -1.7      0.2                                   Energie

Transport                                     -2.5          3.7        0.8         7.9        9.1         7.0        6.9         0.0      -3.0                               Transport


                                                     IV AGRICULTURAL PRODUCTION - PRODUCTION AGRICOLE

                                           2002         2003       2004        2005       2006        2007       2008        2009       2010
Tons (Thousand)                                                                                                                                                 Tonnes (milliers)
Maize, Tons (thousands)                     2 705        2 322      3 157       3 219      3 423        3 302      3 556      3 326         ...                 Maïs, tonnes (milliers)

Sorghum, Tons (thousands)                     834          488        757         714        712         971        861         709         ...               Sorgho, tonnes (milliers)

Paddy, Tons (thousands)                       985        1 096      1 059       1 168      1 239        1 342      1 346      1 334         ...                   Riz, tonnes (milliers)

Wheat, Tons (thousands)                        77           74         67         102        110          83         92          95         ...                   Blé, tonnes (milliers)

Cassava, Tons (thousands)                   5 176        3 962      4 441       5 539      6 158        5 199      5 392      5 916         ...               Manioc, tonnes (milliers)


                                                          V MINING PRODUCTION - PRODUCTION MINIERE
                                                                                                                                                                                           317
                                           2002         2003       2004        2005       2006        2007       2008        2009       2010


Hard coal, metric tons (thousands)        79 210.0     54 610.0   65 041.0    74 800.0   17 940.0    27 198.0   15 242.0          ...       ... Houilles, tonnes métriques (milliers)

Gold ores and concentrates,               43 320.0     48 018.0   48 176.0    52 236.0   39 750.0    40 193.0   36 434.0    39 112.0        ...      Minerais d'or et leurs concentrés,
kilograms (thousands)                                                                                                                                           kilogrammes (milliers)
Silver ores and concentrates,                                                                                                                               Minerais d'argent et leurs
                                           6 990.0      7 986.0   13 216.0    12 891.0   14 906.0    12 381.0   10 388.0     8 231.0        ...
kilograms (thousands)                                                                                                                               concentrés, kilogrammes (milliers)


                                                                             VI ENERGY - ENERGIE

                                           2002         2003       2004        2005       2006        2007       2008        2009       2010

Electricity - total hydro production,                                                                                                              Électricité - production hydraulique
                                           2 719.0      2 548.0    2 356.0     1 778.0    1 436.0     2 511.0         ...         ...       ...
kilowatt hours (millions)                                                                                                                             totale, kilowatt-heures (millions)

Electricity - total thermal production,                                                                                                              Électricité - production thermique
                                            135.0        110.0      537.0      1 257.0    1 340.0     1 664.0         ...         ...       ...
kilowatt hours (millions)                                                                                                                             totale, kilowatt-heures (millions)

Electricity - total production, self-                                                                                                             Electricité - Production totale privée
                                              105           73         86          99        106         113          ...         ...       ...
producer (Million Kilowatt Hours)                                                                                                                           (million de kilowatt heures)

Electricity - total production, public                                                                                                                   Electricité - Production totale
                                            2 749        2 585      2 807       2 936      2 670        4 062         ...         ...       ...
(Million Kilowatt Hours)                                                                                                                          publique (million de kilowatt heures)


                                                                                                African Statistical Yearbook 2011 / Annuaire Statistique pour l'Afrique 2011
Tanzania                                                                                                                                                                              Tanzanie
                                                    VII TOURISM AND INFRASTRUCTURE - TOURISME ET INFRASTUCTURE

                                                    2002         2003          2004          2005          2006          2007          2008          2009          2010

         Arrivals - Tourists (thousands)               575          576           582           613           644           719           765           714             ...         Arrivées - touristes (milliers)

         Rooms in hotels and similar                                                                                                                                        Chambres d'hotels et établissements
         establishments (thousands)                     25           31            31            31            32            32            32            32             ...                  assimilés (milliers)

         Paved Road (% of total)                         ...           9            ...           ...           ...           ...           ...           ...           ...       Routes asphaltées (% du total)
         Total Network (Railways-km)                 4 582        4 582         4 582         4 582         4 460         4 460         4 460         4 460         4 460          Réseau total voies ferrées-Km
         Main Telephone Lines (per 1,000                                                                                                                                        Lignes téléphoniques fixes (pour
                                                          4            4             4             4             4             4             3            ...           ...
         inhabitants)                                                                                                                                                                            1000 habitants)
         Mobile Cellular Subscribers (per                                                                                                                                       Abonnés aux téléphones mobiles
                                                          6          13            19            30            56            83           130           175             ...
         1,000 inhabitants)                                                                                                                                                                (pour 1000 habitants)


                                        VII FINANCIAL AND MONETARY STATISTICS - FINANCES ET STATISTIQUES MONETAIRES

                                                    2002         2003          2004          2005          2006          2007          2008          2009          2010

         VII-1 Monetary Statistics                                                                                                                                       VII-1 Statistiques monétaires
         Tanzanian Shilling (Millions)                                                                                                                                        Shilling Tanzanien(Millions)
         Money supply (M1)                        1 311 852    1 525 606    1 864 654     2 469 469     2 918 840     3 580 780     4 289 750     4 855 670     6 297 080                 Masse monétaire (M1)
         Quasi-money                              1 043 720    1 253 230    1 289 130     1 781 260     2 245 620     2 642 800     3 169 030     3 924 470     4 715 500                         Quasi-monnaie
           of which Demand Deposit                       ...          ...           ...           ...           ...           ...           ...           ...           ...             dont Monnaie scripturale
         Net foreign assets                       1 620 140    2 272 050    2 497 430     2 666 310     3 613 810     3 674 850     4 076 150     4 930 810     6 086 250                  Avoirs extérieurs nets
         Domestic credit                           925 289      883 987     1 040 600     1 846 350     2 027 510     2 831 370     4 221 200     5 120 250     6 798 550                         Crédit intérieur

         of which claims on private sector         713 854      978 615     1 291 080     1 625 440     2 285 720     3 119 090     3 984 320     4 326 350     5 235 710      dont créances sur le secteur privé

         of which Claims on government                                                                                                                                             dont créances nettes sur le
                                                   200 763     - 108 545     - 272 124      192 072      - 282 629     - 319 844     - 334 967      128 358       806 665
         sector, net                                                                                                                                                                            gouvernement
         International reserves (millions of US                                                                                                                           Réserves internationales (millions de
                                                     1 529        2 038         2 296         2 049         2 259         2 886         2 863         3 470         3 905
         $)                                                                                                                                                                                               $ EU)
         Average Exchange Rate (National                                                                                                                                   Taux de change (moyen) (monnaie
                                                    966.58      1 038.42     1 089.33      1 128.93      1 251.90      1 245.04      1 196.31      1 320.31      1 409.27
         Currency per us $)                                                                                                                                                              nationale par dollars)


         VII-2 Public Finance                                                                                                                                                   VII-2 Finances publiques
         Tanzanian Shilling (Millions)                                                                                                                                        Shilling Tanzanien(Millions)
         Total Revenues and Grants                1 426 424    1 839 819    1 954 192     2 766 685     3 168 266     3 710 569     5 207 776     5 550 358     7 325 015               Recettes totales et dons
           Tax Revenue                             938 478     1 105 746    1 342 798     1 615 248     1 946 433     2 529 439     3 359 250     4 043 674     4 840 877                        Recettes fiscales
           Non Tax Revenue                         104 467      111 771       116 505       158 462       178 411       209 583       275 331       249 401       393 192                   Recettes non fiscales
           Grants                                  383 479      622 302       494 889       992 975     1 043 422       971 547     1 573 195     1 257 283     2 090 946                                     Dons
318      Total Expenditures and Net Lending       1 466 138    1 989 547    2 516 941     3 164 216     3 972 608     4 474 680     5 208 996     6 811 827     8 862 431         Dépenses totales et prêts nets

           Current expenditure                    1 001 138    1 388 870    1 671 580     1 949 770     2 443 001     2 921 907     3 133 191     4 438 790     5 629 000                    Dépenses courantes
           Of which Wages and Salaries             341 982      397 770       462 963       550 554       656 789       976 094     1 134 709     1 608 591     1 766 000         Dont rémunérations et salaires
           Capital expenditure                     344 611      500 897       736 828     1 230 862     1 310 745     1 337 211     1 810 972     2 130 368     2 825 431                Dépenses d'équipement
           Net Lending                                    0            0             0     - 159 701             0             0             0             0             0                              Prêts nets
         Fiscal Balance                            - 39 714    - 149 728     - 562 749     - 397 531     - 804 342     - 764 111       - 1 220    -1 261 469    -1 537 416       Solde global y compris les dons


         VII-3 Balance of Payments                                                                                                                                        VII-3 Balance des paiements
         Tanzanian Shilling (Millions)                                                                                                                                        Shilling Tanzanien(Millions)
         Trade balance                            - 543 658    - 950 405    -1 226 618    -2 006 064    -2 944 790    -3 696 857    -4 157 425    -3 845 289            ...                Balance commerciale
         Services Balance                          293 677      212 027       125 983       184 110       466 960       549 952       262 031       447 819             ...                 Balance des services
         Net Income                               - 123 387    - 123 885     - 131 857      - 83 052      - 75 680      - 89 727     - 110 706      - 94 116            ...                         Revenus nets
         Current transfers, net total              371 902      438 514       642 174       615 817       667 160       848 242       966 364       726 789             ...                  Transferts courants
         Current account balance                    - 1 466    - 423 749     - 590 318    -1 289 190    -1 886 351    -2 388 389    -3 039 736    -2 764 797            ...            Solde du compte courant


         VII-4 External Debt and Financial Flows                                                                                                           VII-4 Dette extérieure et flux financiers
         US $ (Millions)                                                                                                                                                                     $ E.U (Millions)
         Total external debt                         5 478        6 119         6 225         6 358         6 520         6 673         6 834         7 007         7 171                 Dette extérieure totale
           Private                                     920          707           547           583         4 555         3 877         3 039              0            ...                                 Privée
           Public                                    4 558        5 412         5 678         5 775         1 965         2 796         3 795         7 007             ...                               Publique
         Total external debt service                   223          187           213           199           138         4 668            68           100             ...        Service de la dette extérieure
         Net Foreign Direct Investment                                                                                                                                           Investissements étranger direct
                                                       388          308           331           494           597           647           679           645             ...
         Inflows                                                                                                                                                                             (flux nets entrants)
         Net Total Official Development                                                                                                                                         Aide publique au développement
                                                     1 269        1 724         1 767         1 498         1 814         2 820         2 331         2 934             ...
         assistance                                                                                                                                                                                 (nette totale)


      African Statistical Yearbook 2011 / Annuaire Statistique pour l'Afrique 2011
Tanzania                                                                                                                                            Tanzanie

                                         2002     2003     2004     2005     2006        2007       2008       2009      2010

US $ (Millions)                                                                                                                               Shilling Tanzanien
Exports, fob                                                                                                                                   Exportations, fàb


Exports - Total                          1 087    1 403    1 749    2 120     2 608       3 134      3 748         ...       ...                  Exportations - Total


Main Products                                                                                                                                   Principaux produits


Coffee                                     341      51       53       89        93          143        124        149        ...                                   Café


Cotton                                     35       42       54       77        57           50         96        115        ...                                  Coton


Sisal                                      56         9      11       14        14           23         32         57        ...                                   Sisal


Tea                                        29       26       32       30        41           49         50         88        ...                                    Thé


Tobacco                                    47       47       66       149      127          138        210        117        ...                                  Tabac

Main Destinations                                                                                                                         Principales destinations

Switzerland                               84.8     13.0     32.4    163.2    494.0        627.6      743.7      896.8        ...                                 Suisse


China                                      6.6      3.9     76.8    110.8    208.2        344.3      319.3      523.9        ...                                  Chine


India                                    105.4     75.2    110.5     88.8      79.2       114.9      203.7      242.6        ...                                   Inde


Kenya                                     54.4     81.2     91.3     89.9    126.7        162.2      295.0      237.1        ...                                  Kenya


South Africa                              40.1     38.8    124.0    328.2    343.5        289.2      272.9      236.5        ...                        Afrique du Sud


                                         2002     2003     2004     2005     2006        2007       2008       2009      2010
Imports, cif                                                                                                                                    Importations, cif

Imports - Total                             ...      ...      ...      ...       ...          ...        ...       ...       ...       Importations - Total (millions)
                                                                                                                                                                            319
                                                                                                                                                Principaux produits
Main Products


Petroleum oils&oils obtained from
                                                                                                                                       Huiles de pétrole, bitumineux,
bituminous minerals,o/than crude           74       102      130      267      315          356        693         ...       ...
                                                                                                                                                   distilles, sauf brut
etc
                                                                                                                                      Huile de palme et ses fractions,
Palm oil and its fractions refined but
                                           56       72       76       57        93          153        122         ...       ...   raffinées, mais non chimiquement
not chemically modified
                                                                                                                                                           modifiées

Medicaments nes, in dosage                 24       43       52       71        64          151        100         ...       ...        Médicaments nda, en dosage

Parts of electrical apparatus for line                                                                                             Parties d'appareils électriques pour
                                             4        8        3        8         9          59         99         ...       ... la téléphonie en ligne ou télégraphie
telephone or line telegraphy
                                                                                                                                                                  par fil

Wheat nes and meslin                         3        1      43       62        89          110         75         ...       ...                      Blé nda et méteil


Main Origin                                                                                                                               Principales provenances

India                                    121.4    174.2    235.4    213.8    302.0        635.0     1 023.6     999.5        ...                                   Inde

China                                    192.3    120.8    186.8    250.1    386.2        518.6      853.8      895.0        ...                                  Chine

South Africa                             112.9    318.6    366.7    451.5    716.8        820.6      980.9      888.0        ...                        Afrique du Sud

United Arab Emirates                     107.0    152.5    201.2    231.0    641.0       1 063.3    1 157.7     816.8        ...                   Emirats arabes unis

Japan                                      0.0    176.5    196.8    234.8    324.6        360.6      435.3      546.0        ...                                  Japon


                                                                                   African Statistical Yearbook 2011 / Annuaire Statistique pour l'Afrique 2011
Togo                                                                                                                                                                            Togo

         AREA (KM 2)                                                                                    56 790                                                              SUPERFICIE (KM 2)
         CAPITAL CITY                             Lome                                                                                           Lomé                                   CAPITALE
         CURRENCY                                 CFA Franc                                                                                  Franc CFA                                  MONNAIE


                                 I SOCIAL AND DEMOGRAPHIC INDICATORS — INDICATEURS DEMOGRAPHIQUES ET SOCIAUX

                                                    2002        2003        2004        2005        2006         2007        2008        2009       2010
         Population                                                                                                                                                                  Population
                                                                                                                                                                 Population au milieu de l'année -
         Mid-year population - Total (Million)          5.6         5.7         5.8         6.0         6.1          6.3         6.5         6.6       ...
                                                                                                                                                                                    Total (million)
                                                                                                                                                                 Population au milieu de l'année -
         Mid-year population - Urban (%)                 ...         ...       39.0        40.0        41.0         41.0        42.0        42.7       ...
                                                                                                                                                                                    Urbaine (%)

         Female (%)                                    51.0        51.0        51.0        50.5        50.5         50.5        50.5        50.5       ...                             Femme (%)


         Population by Age Group                                                                                                                                     Population par groupe d'âge


            0-14                                   2160 030    2211 650    2265 050    2319 340    2252 214    2306 230     2361 512    2418 000       ...                                     0-14


            15-64                                  2480 394    2539 670    2600 990    2663 332    2849 958    2918 310     2988 264    3060 000       ...                                    15-64


            65+                                     213 576     218 680     223 960     229 328     234 828      240 460     246 224     252 000       ...                                     65+


         Active Population (000)                    2 158.0     2 220.0     2 283.0     2 349.0     4 205.6      2 485.0     2 559.0     2 635.0       ...                 Population active (000)

            Female (%)                                 38.4        38.4        38.4        38.4        38.4         38.2        38.2        38.2       ...                             Femme (%)

                                                                                                                                                                Taux brut de natalité - Total (par
         Crude birth rate - Total (per 1000)           37.0        37.0        37.0        37.0        37.0         37.0        37.0        37.0     37.0
                                                                                                                                                                                            1000)
                                                                                                                                                              Taux brut de mortalité - Total (par
         Crude death rate - Total (per 1000)           13.0        13.0        13.0        13.0        13.0         13.0        13.0        13.0     13.0
                                                                                                                                                                                           1000)
         Life expectancy at birth - Total                                                                                                                       Espérance de vie à la naissance -
                                                         ...       54.3        55.0        54.2        61.8         62.2        62.6        62.9       ...
         (years)                                                                                                                                                                  Total (années)
         Net reproduction rate - (per                                                                                                                            Taux net de reproduction - (par
                                                         ...         ...         ...        2.0          ...          ...         ...         ...      ...
         woman)                                                                                                                                                                          femme)
                                                                                                                                                                Indice synthétique de fécondité -
         Total fertility rate - (p woman)
                       y        (per    )               4.9         4.8         4.7         4.6         4.5          4.4         4.3         4.2       ...
                                                                                                                                                                                    (par femme)

         Education                                                                                                                                                              Enseignement

         Teaching staff at first level - Total                                                                                                                Personnel enseignant - 1er degré -
                                                      27.77        27.5        25.2        29.7        28.0         26.1        25.5          ...      ...
         (thousands)                                                                                                                                                             Total (milliers)
         Teaching staff at second level - Total                                                                                                              Personnel enseignant - 2ème degré -
320                                                    6.82         7.0         7.4         9.3         7.6          6.6         7.6          ...      ...
         (thousands)                                                                                                                                                              Total (milliers)
         Teaching staff at third level - Total                                                                                                               Personnel enseignant - 3ème degré -
                                                        1.7         2.0         2.1         2.3         1.7          2.8         2.8          ...      ...
         (thousands)                                                                                                                                                              Total (milliers)
         First level student enrollment - Total                                                                                                                 Elèves inscrits - 1er degré - Total
                                                       978         975         985         997        1 052        1 022       1 055          ...      ...
         (thousands)                                                                                                                                                                      (milliers)
         First level student enrollment -                                                                                                                    Elèves inscrits - 1er degré - Femmes
                                                       439         441         449         458         487          474           ...         ...      ...
         Female (thousands)                                                                                                                                                                (milliers)
         Second level student enrollment -                                                                                                                    Elèves inscrits - 2ème degré - Total
                                                       262         285         304         377         402          377         320           ...      ...
         Total (thousands)                                                                                                                                                               (milliers)
         Second level student enrollment -                                                                                                                          Elèves inscrits - 2ème degré -
                                                        90         100         108         130         141          127         119           ...      ...
         Female (thousands)                                                                                                                                                     Femmes (milliers)
         Third level student enrollment - Total                                                                                                               Elèves inscrits - 3ème degré - Total
                                                       47.3        49.5        51.7        64.7        72.8         81.0        88.7          ...      ...
         (thousands)                                                                                                                                                                     (milliers)
         Third level student enrollment -                                                                                                                           Elèves inscrits - 3ème degré -
                                                       10.2        10.9        11.8        15.9        18.1         20.3        22.7          ...      ...
         Female (thousands)                                                                                                                                                     Femmes (milliers)
         Public expenditure on education (%                                                                                                                     Dépenses publiques consacrées à
                                                       27.1        28.2        28.7        18.7        16.6         17.2        15.8          ...      ...
         of budget)                                                                                                                                               l'enseignement (% du budget)

         Health                                                                                                                                                                             Santé

         Hospital beds - Total (per 10 000                                                                                                                      Nombre de lits d'hôpitaux - Total
                                                        11           9           9           8          10            ...         ...         ...      ...
         population)                                                                                                                                                               (pour 10 000)
         Nurses - Total (per 10 000                                                                                                                            Nombre d'infirmières - Total (pour
                                                         ...         ...        35           ...         ...          ...         ...         ...      ...
         population)                                                                                                                                                                     10 000)
         Physicians - Total (per 10 000                                                                                                                        Nombre de médecins - Total (pour
                                                          0          1           1           1           1            ...         ...         ...      ...
         population)                                                                                                                                                                   10 000)
         Public expenditure on Health (% of                                                                                                                  Dépenses publiques consacrées à la
                                                         ...         ...         ...         ...         ...          ...         ...         ...      ...
         budget)                                                                                                                                                          santé (% du budget)


      African Statistical Yearbook 2011 / Annuaire Statistique pour l'Afrique 2011
Togo                                                                                                                                                                                Togo
                                                         II NATIONAL ACCOUNTS — COMPTES NATIONAUX

                                           2002          2003        2004        2005        2006         2007         2008        2009         2010

Gross domestic product by kind of economic activity at current prices
                                                                                                 Produit intérieur brut par branche d'activité économique aux prix courants


CFA Franc (Millions)                                                                                                                                               Franc CFA (Millions)

Agriculture                               392 442       348 096     370 669     437 038     421 603      436 667       578 603     636 102     665 306                             Agriculture

Mining and quarrying                           32 399    35 340      29 875      33 042      32 522       31 818        59 114      48 187      41 015                  Industries extractives

Manufacturing                                  93 370    88 409      83 905      95 309     106 649      111 084       120 089     118 087     124 716             Industries manufacturières

Electricity, gas & water                       38 874    33 172      35 655      36 093      35 669       38 272        38 861      38 937      44 291                  Electricité, gaz et eau

Construction                                   22 939    22 173      26 032      27 336      37 362       44 855        39 382      33 508      41 130           Bâtiments et travaux publics
Wholesale & retail trade,                                                                                                                                     Commerce de gros et de détail,
                                          120 744       112 848     126 845     124 197     131 263      135 688       131 060     116 017     131 339
restaurants, hotels                                                                                                                                                    restaurants et hôtels
                                                                                                                                                               Banques, assurances, affaires
Finance, insurance, real estate, etc.          98 252    92 216      98 702     103 794     109 270      114 022       128 519     127 996     142 973
                                                                                                                                                                               immobilières
Transport and communications                   51 392    55 659      57 892      56 850      69 094       71 267        73 285      78 618      87 723       Transport(s) et communications
                                                                                                                                                                 Administrations publiques et
Public administration and defense              98 387    97 295      96 567      92 924      96 222       94 668       103 204     138 908     124 991
                                                                                                                                                                                     défense
Other services                                 23 287    24 035      24 840      25 839      26 708       27 660        28 653      29 704      30 813                         Autres services
                                                                                                                                                              Moins Services d’intermédiation
Less Imputed Service Charges              - 18 047      - 17 052    - 18 000    - 19 685    - 20 629     - 21 643     - 25 482     - 26 718    - 28 125
                                                                                                                                                                                    financière
Gross domestic product at factor                                                                                                                          Produit intérieur brut aux couts des
                                          954 038       892 191     932 981    1 012 739   1 045 734    1 084 358    1 275 289   1 339 345    1 406 173
cost / basic prices                                                                                                                                                     facteurs / prix de base

Plus: Indirect Taxes / taxes on                                                                                                                           Plus taxes indirectes/impôts sur les
                                               72 210    80 452      90 230     100 333     114 378      128 467       143 240     150 714     155 500
products, less subsidies                                                                                                                                      produits, moins les subventions


Expenditure on Gross domestic product at current purchaser's values
                                                                                                             Emploi du produit intérieur brut aux prix courants d'acquisition

CFA Franc (Millions)                                                                                                                                               Franc CFA (Millions)
                                                                                                                                                                    Consommation finale des
Government final consumption              122 627       126 974     135 575     150 352     157 941      148 789       190 304     211 432     194 192
                                                                                                                                                                    administrations publiques

Private final consumption                 878 300       850 897     910 522    1 098 179   1 086 463    1 109 618    1 215 199   1 231 014    1 392 597           Consommation finale privée

Gross fixed capital formation             158 024       166 628     169 182     183 067     194 845      174 195       203 294     248 678     264 895         Formation brute de capital fixe

Increase in inventories                        13 298   - 17 111    - 11 584      5 259       6 464        2 894        47 379      30 092      12 169                    Variation des stocks

Exports of goods and services             358 431       402 485     396 709     441 602     507 415      451 979       508 641     529 428     551 908      Exportations de biens et services
                                                                                                                                                               Moins importations de biens et
                                                                                                                                                                                                  321
Less imports of goods and services        504 431       557 230     577 193     765 387     793 016      674 650       746 288     760 585     854 088
                                                                                                                                                                                     services
GDP at purchasers' values                1 026 248      972 643    1 023 211   1 113 072   1 160 112    1 212 824    1 418 529   1 490 059    1 561 673             PIB aux prix d'acquisition


Gross domestic product by kind of economic activity at constant
                                                                                               Produit intérieur brut par branche d'activité economique aux prix constants
prices
Annual Growth Rates (%)                                                                                                                             Taux de croissance annuel (%)
Agriculture                                       7.2        2.3        -1.4        -2.1         4.9          3.3          3.7          8.2         3.3                            Agriculture

Mining and quarrying                             17.0      63.2        -22.5        -2.5         2.9        -25.6        -12.0         -0.2        11.0                 Industries extractives

Manufacturing                                     6.8       -8.9         0.3         7.1         9.1          2.2          8.1         -7.1         0.5            Industries manufacturières

Electricity, gas & water                         10.6      -22.4        13.5        11.0        -9.3        -11.0         10.4        12.3          3.7                 Electricité, gaz et eau

Construction                                     -4.8        1.3        17.7         4.7        27.4         -1.0         17.1        12.2          2.6          Bâtiments et travaux publics
Wholesale & retail trade,                                                                                                                                            Commerce de gros et de
                                                -23.9      20.8         12.8         3.8       -22.3         -0.2         -8.6         -4.6        12.4
restaurants, hotels                                                                                                                                                détail,restaurants et hôtels
                                                                                                                                                                Banques, assurances, affaires
Finance, insurance, real estate, etc.           -46.7      -14.7        31.9        11.8        96.7          1.8         -2.2         -1.6         9.8
                                                                                                                                                                                immobilières
Transport and communications                      2.7      12.1         14.2         2.3        -3.6         16.8         11.3          4.4         2.3      Transport(s) et communications
                                                                                                                                                                 Administrations publiques et
Public administartion and defense                 1.1       -2.3         3.2        -4.0         1.7         -2.7         -4.1          1.6         7.7
                                                                                                                                                                                     défense
Other services                                    0.0        2.2         3.3         3.2         5.1          2.7          2.4          3.0         2.8                        Autres services
                                                                                                                                                              Moins Services d’intérmediation
Less Imputed Service Charges                    -47.5      -19.0        27.4        18.3      331.8           6.4        -16.9        -13.2      105.9
                                                                                                                                                                                    financière
Gross domestic product at factor                                                                                                                          Produit intérieur brut aux couts des
                                                 -1.9        4.0         2.8         1.0         2.5          0.7          3.0          4.0         2.1
cost / basic prices                                                                                                                                                     facteurs / prix de base

Plus: Indirect Taxes / taxes on                                                                                                                           Plus taxes indirectes/impôts sur les
                                                  7.3      15.2          0.1         3.6        18.4         14.6         -2.7         -2.9        15.7
products, less subsidies                                                                                                                                      produits, moins les subventions

Gross domestic product at market                                                                                                                            Produit intérieur brut aux prix du
                                                 -1.3        4.8         2.5         1.2         3.9          2.1          2.4          3.2         3.4
prices                                                                                                                                                                                 marché


2008: semi-final           2009: Provisional      2010:Estimated                                                    2008: semi-définitif        2009: provisoire              2010:Estimée


                                                                                                   African Statistical Yearbook 2011 / Annuaire Statistique pour l'Afrique 2011
Togo                                                                                                                                                                               Togo

         Expenditure on Gross domestic product at constant purchasers'
                                                                                                                        Emplois du produit intérieur brut aux prix constants d'acquisition
         values

         Annual Growth Rates (%)                                                                                                                          Taux de croissance annuel (%)
                                                                                                                                                                            Consommation finale des
         Government final consumption                    -9.0          2.2          9.2          9.9          4.9         -7.0      17.3       -7.0       2.0
                                                                                                                                                                            administrations publiques

         Private final consumption                        6.3          3.2          1.8          9.6          8.2          5.3     -15.8       7.6        7.1             Consommation finale privée

         Gross fixed capital formation                    6.5          8.0         -0.9          7.8         10.7        -12.3      12.2      24.5        7.2         Formation brute de capital fixe

         Exports of goods and services                    7.8         28.5         -4.6          5.6         20.1        -18.2      16.0       0.2       11.7       Exportations de biens et services

                                                                                                                                                                      Moins importations de biens et
         Less imports of goods and services              18.5          8.4         -0.6         24.3         19.7         -9.8     -12.1      10.6       14.2
                                                                                                                                                                                            services


                                                                                                III INFLATION

                                                      2002         2003         2004         2005         2006         2007       2008      2009       2010
         Annual Growth Rates (%)                                                                                                                          Taux de croissance annuel (%)
         All Item                                         3.1         -0.9          0.4          6.8          2.2          0.9       8.7       2.9        5.3                               Ensemble

         Food                                             3.8         -4.8         -1.2         10.9         -1.1          2.8      19.8       2.9       -2.5                            Alimentation

         Health                                          12.1         -0.1         -0.3         -1.0         -2.7         -0.6       2.4       1.2        0.5                                   Santé

         Energy                                            ...          ...          ...          ...         7.2          2.0       2.4       3.1        1.8                                  Energie

         Transport                                        1.6         -1.3          1.1         23.6         12.2         -0.4       6.1       4.6        7.9                               Transport


                                                            IV AGRICULTURAL PRODUCTION - PRODUCTION AGRICOLE

                                                      2002         2003         2004         2005         2006         2007       2008      2009       2010
         Tons (Thousand)                                                                                                                                                       Tonnes (milliers)
         Millet and Sorghum, Tons                        221          210          205          248          267          267       268          ...       ...        Mil et Sorgho, tonnes (milliers)
         (thousands)
         Maize, Tons (thousands)                         510          538          524          510          538          566       568          ...       ...                  Maïs, tonnes (milliers)

         Rice, Tons (thousands)                           69           62           69           73           76           80        81          ...       ...                  Rice, tonnes (milliers)

         Beans, Tons (thousands)                          45           44           49           67           53           63        64          ...       ...               Haricot, tonnes (milliers)

         Yams, Tons (thousands)                          575          615          585          585          621          618       624          ...       ...             Ignames, tonnes (milliers)


                                                                    V MINING PRODUCTION - PRODUCTION MINIERE
322
                                                      2002         2003         2004         2005         2006         2007       2008      2009       2010


         Limestone, Tons                           1375 085.2 2111 988.0 2124 028.1 2253 388.8 2300 653.6           1823 538.7        ...        ...       ...                        Calcaire, tonnes

         Sand & gravel, cubic meter                 274 693.8    457 442.1    521 131.0    560 875.0    652 357.5    593 587.5        ...        ...       ...                  Sable et gravier (m3)


         Gold (Kilograms)                             1 657.6      8 668.6      7 466.8      6 178.8      5 903.9           ...       ...        ...       ...                      Or (Kilogrammes)


                                                                                           VI ENERGY - ENERGIE

                                                      2002         2003         2004         2005         2006         2007       2008      2009       2010

         Electricity - total hydro production,                                                                                                                    Électricité - production hydraulique
                                                         38.6         41.5         44.1         50.2         69.6         39.8        ...        ...       ...
         kilowatt hours (millions)                                                                                                                                   totale, kilowatt-heures (millions)

         Electricity - total thermal production,                                                                                                                    Électricité - production thermique
                                                         66.0         54.0       105.0        115.0        130.0         104.0        ...        ...       ...
         kilowatt hours (millions)                                                                                                                                   totale, kilowatt-heures (millions)

         Electricity - total production, self-                                                                                                                   Electricité - Production totale privée
                                                            1            2            4            5          11           18         ...        ...       ...
         producer (Million Kilowatt Hours)                                                                                                                                 (million de kilowatt heures)

         Electricity - total production, public                                                                                                                         Electricité - Production totale
                                                         151          174          182          184          210          178         ...        ...       ...
         (Million Kilowatt Hours)                                                                                                                                publique (million de kilowatt heures)


      African Statistical Yearbook 2011 / Annuaire Statistique pour l'Afrique 2011
Togo                                                                                                                                                                                    Togo
                                         VII TOURISM AND INFRASTRUCTURE - TOURISME ET INFRASTUCTURE

                                           2002       2003          2004         2005         2006         2007         2008         2009         2010

Arrivals - Tourists (thousands)                58          61           83           81           94           86           74            ...          ...           Arrivées - touristes (milliers)

Rooms in hotels and similar                                                                                                                                Chambres d'hotels et établissements
establishments (thousands)                  4.365        4.48        4.728        4.944        5.201        5.404            ...          ...          ...                  assimilés (milliers)

Paved Road (% of total)                         ...         ...          ...          ...          ...          ...          ...          ...          ...        Routes asphaltées (% du total)
Total Network (Railways-km)                     ...         ...          ...          ...          ...          ...          ...          ...          ...         Réseau total voies ferrées-Km
Main Telephone Lines (per 1,000                                                                                                                                  Lignes téléphoniques fixes (pour
                                               52          61           65           63           81          101          118            ...          ...
inhabitants)                                                                                                                                                                     1000 habitants)
Mobile Cellular Subscribers (per                                                                                                                                 Abonnés aux téléphones mobiles
                                              131         211          280          380          607          861        1 240        1 640        2 060
1,000 inhabitants)                                                                                                                                                        (pour 1000 habitants)


                          VII FINANCIAL AND MONETARY STATISTICS - FINANCES ET STATISTIQUES MONETAIRES

                                           2002       2003          2004         2005         2006         2007         2008         2009         2010

VII-1 Monetary Statistics                                                                                                                               VII-1 Statistiques monétaires
CFA Franc (Millions)                                                                                                                                                   Franc CFA (Millions)
Money supply (M1)                         148 407     154 749      192 933      186 745      248 399      278 430      335 857      372 912      398 103                   Masse monétaire (M1)
Quasi-money                                86 146     105 259      114 130      127 217      136 543      171 051      195 541      243 774      292 546                           Quasi-monnaie
  of which Demand Deposit                       ...         ...          ...          ...          ...          ...          ...          ...          ...              dont Monnaie scripturale
Net foreign assets                         80 985      74 142      146 399      136 151      213 108      206 687      239 400      246 367      252 993                    Avoirs extérieurs nets
Domestic credit                           163 982     183 858      181 414      200 213      200 461      263 208      321 875      407 248      461 387                           Crédit intérieur

of which claims on private sector         127 938     167 019      174 228      195 361      195 329      255 065      243 263      295 010      354 552       dont créances sur le secteur privé

of which Claims on government                                                                                                                                         dont créances nettes sur le
                                           35 745      16 840        7 186        4 852        5 133        8 143       78 612      112 238      106 835
sector, net                                                                                                                                                                       gouvernement
International reserves (millions of US                                                                                                                       Réserves internationales (millions de
                                              205         205          360          195          375          438          582          703          694
$)                                                                                                                                                                                           $ EU)
Average Exchange Rate (National                                                                                                                               Taux de change (moyen) (monnaie
                                           696.99      581.20       528.29       527.47       522.89       479.27       447.81       472.19       495.28
Currency per us $)                                                                                                                                                        nationale par dollars)


VII-2 Public Finance                                                                                                                                             VII-2 Finances publiques
CFA Franc (Millions)                                                                                                                                                   Franc CFA (Millions)
Total Revenues and Grants                 130 020     170 780      179 560      187 970      211 890      224 910      249 936      243 701      351 343                 Recettes totales et dons
  Tax Revenue                             126 530     165 260      171 720      174 860      195 900      204 520      167 458      174 335      246 673                         Recettes fiscales
  Non Tax Revenue                          29 880      31 274       36 894       36 839       38 549       43 792       53 217       52 366       47 745                    Recettes non fiscales
  Grants                                    3 490       5 520        7 850       13 110       15 990       20 390       29 261       17 000       56 925                                     Dons      323
Total Expenditures and Net Lending        134 540     146 400      165 840      219 820      245 860      221 110      253 250      295 150      342 102           Dépenses totales et prêts nets

  Current expenditure                     116 070     128 800      145 030      175 040      193 390      201 050      203 123      220 950      224 250                     Dépenses courantes
  Of which Wages and Salaries              51 600      51 720       51 630       49 240       59 400       64 290       70 411       78 000       82 626           Dont rémunérations et salaires
  Capital expenditure                      14 383      10 252       15 832       36 584       47 313       24 069       49 867       74 200       43 278                 Dépenses d'équipement
  Net Lending                                 - 2         - 1           10           10           40       - 4 040         261            ...           0                               Prêts nets
Fiscal Balance                             - 4 531     24 373        9 711      - 31 851     - 32 309       3 799       - 3 314     - 51 449       9 241          Solde global y compris les dons


VII-3 Balance of Payments                                                                                                                                    VII-3 Balance des paiements
CFA Franc (Millions)                                                                                                                                                   Franc CFA (Millions)
Trade balance                            - 105 528    - 91 145    - 133 284    - 270 153    - 242 887    - 189 388    - 203 529    - 186 356    - 232 306                   Balance commerciale
Services Balance                          - 40 486    - 63 600     - 47 200     - 53 632     - 42 790     - 33 290     - 34 118     - 44 801     - 69 874                    Balance des services
Net Income                                - 15 053    - 13 564     - 17 700     - 18 207     - 19 763     - 14 492      - 6 750      - 6 444      - 7 494                            Revenus nets
Current transfers, net total               63 550      74 198       89 500       99 031      127 400      133 715      145 018      141 108      149 999                      Transferts courants
Current account balance                   - 97 517    - 94 111    - 108 684    - 242 961    - 177 964    - 103 448     - 99 379     - 96 493    - 159 675               Solde du compte courant


VII-4 External Debt and Financial Flows                                                                                                    VII-4 Dette extérieure et flux financiers
US $ (Millions)                                                                                                                                                               $ E.U (Millions)
Total external debt                         1 480       1 702        1 804        1 626        1 880        2 123        1 787        1 740          425                   Dette extérieure totale
  Private                                       0           0            0            0            0            0             0            0            0                                   Privée
  Public                                    1 480       1 702        1 804        1 626        1 880        2 123        1 787        1 740          425                                 Publique
Total external debt service                     1           3            2            3            3            5           40           54           53            Service de la dette extérieure
Net Foreign Direct Investment                                                                                                                                Investissements étranger direct (flux
                                               53          34           59           77           77           49           24           50            ...
Inflows                                                                                                                                                                            nets entrants)
Net Total Official Development                                                                                                                                  Aide publique au développement
                                               51          50           64           82           79          121          330          499            ...
assistance                                                                                                                                                                         (nette totale)


                                                                                                     African Statistical Yearbook 2011 / Annuaire Statistique pour l'Afrique 2011
Togo                                                                                                                                                    Togo

                                           2002       2003       2004       2005       2006       2007      2008       2009       2010

         CFA Franc (Millions)                                                                                                                                 Franc CFA
         Exports, fob                                                                                                                               Exportations, fàb


         Exports - Total                  295 686    347 389    317 509    348 323    394 406    324 415    381 919    418 209    433 572              Exportations - Total


         Main Products                                                                                                                              Principaux produits


         Cocoa                              4 929      6 142     13 043     10 729      7 901      4 501      7 536     16 021     22 747                            Cacao


         Coffee                             2 200      1 001      1 697      2 330      1 620      5 387      6 335      6 672      7 332                              Café


         Cotton                            27 619     40 414     31 451     15 836     15 639     12 000     13 303      7 795     11 356                            Coton


         Phosphates                        28 716     20 315     25 382     18 427     16 566     15 030     48 900     42 527     26 774                       Phosphates


         Cement                            37 450     42 596     35 546     21 164     33 200     32 410     26 680     22 009     22 009                           Ciment

         Main Destinations                                                                                                                      Principales destinations

         Benin                            22 957.0   23 019.0   25 065.0   21 991.0   20 769.0   14 607.0        ...        ...        ...                            Bénin


         Burkina Faso                     22 558.0   40 142.0   26 844.0   35 008.0   23 746.0   13 068.0        ...        ...        ...                    Burkina Faso


         Mali                              2 294.0   18 722.0   22 975.0   14 010.0   14 780.0    9 551.0        ...        ...        ...                             Mali


         Ghana                            37 268.0   36 980.0   34 223.0   40 488.0   37 649.0    7 847.0        ...        ...        ...                           Ghana


         Netherlands                       3 424.0   31 353.0    8 129.0    2 067.0    1 114.0     649.0         ...        ...        ...                        Pays-Bas


                                           2002       2003       2004       2005       2006       2007      2008       2009       2010
         Imports, cif                                                                                                                                Importations, cif

324      Imports - Total                  401 214    438 534    450 793    618 476    637 293    513 803    585 448    604 565    665 878    Importations - Total (millions)


                                                                                                                                                    Principaux produits
         Main Products


         Food                              67 000     49 307     49 192     51 706     49 527     53 813     71 788     63 402     66 280             Produits alimentaires


         Other Consumer goods              66 800     58 543     67 485     67 147     84 535     86 683     95 351    108 549    113 477    Autres biens de consommation


         Intermidiary goods                86 700    109 328    132 607     65 130     86 092     93 026    106 328     91 332    100 957              Biens intermédiaires


         Equipment                         73 100     66 871     62 814     76 220     77 555     80 695    103 084    137 317    164 543              Biens d'équipement


         Petroleum products               134 800     98 104     68 846    254 772    237 245     97 310     92 391     58 515     75 171                Produits pétroliers


         Main Origin                                                                                                                           Principales provenances

         Germany                          14 172.0   14 941.0    9 649.0    9 154.0   10 788.0    7 464.0        ...        ...        ...                       Allemagne

         Netherlands                       9 027.0   39 669.0    9 847.0   12 385.0   12 983.0   41 774.0        ...        ...        ...                        Pays-Bas

         Italy                            10 131.0   14 592.0   10 971.0   14 022.0   14 313.0    8 359.0        ...        ...        ...                            Italie

         France                           57 186.0   68 977.0   57 329.0   55 311.0   79 694.0   72 223.0        ...        ...        ...                          France

         Cote d'Ivoire                    17 648.0   19 154.0   17 809.0   20 327.0   10 891.0    9 845.0        ...        ...        ...                    Côte d'Ivoire


      African Statistical Yearbook 2011 / Annuaire Statistique pour l'Afrique 2011
Tunisia                                                                                                                                                                       Tunisie

AREA (KM 2)                                                                                  163 610                                                                 SUPERFICIE (KM 2)
CAPITAL CITY                             Tunis                                                                                        Tunis                                      CAPITALE
CURRENCY                                 Tunisian Dinar                                                                       Dinar Tunisien                                     MONNAIE


                        I SOCIAL AND DEMOGRAPHIC INDICATORS — INDICATEURS DEMOGRAPHIQUES ET SOCIAUX

                                            2002       2003        2004        2005       2006         2007        2008        2009        2010
Population                                                                                                                                                                    Population
                                                                                                                                                          Population au milieu de l'année -
Mid-year population - Total (Million)          9.6         9.7         9.8         9.9       10.0        10.1         10.2        10.3        10.4
                                                                                                                                                                             Total (million)
                                                                                                                                                          Population au milieu de l'année -
Mid-year population - Urban (%)               64.2        64.6        65.0        65.3       65.7        66.1         66.5        66.9        67.3
                                                                                                                                                                             Urbaine (%)

Female (%)                                    55.2        54.9        54.6        54.3       54.2        54.1         54.0        54.0        54.0                              Femme (%)


Population by Age Group                                                                                                                                       Population par groupe d'âge


   0-14                                   2716 834    2651 635    2589 647    2533 966   2485 645    2444 657     2411 610    2386 794    2370 214                                      0-14


   15-64                                  6284 890    6418 636    6552 163    6685 102   6817 492    6948 391     7075 269    7194 855    7304 781                                     15-64


   65+                                     621 555     635 706     648 527     659 352    668 134     675 522      682 368     689 857     698 962                                      65+


Active Population (000)                    3 309.5     3 373.3     3 437.2     3 502.8    3 583.1      3 658.0     3 734.4     3 786.0     3 850.0                  Population active (000)

   Female (%)                                 25.2        25.5        25.8        26.1       26.3        26.4         26.5        27.0        27.0                              Femme (%)

                                                                                                                                                         Taux brut de natalité - Total (par
Crude birth rate - Total (per 1000)           16.0        16.0        16.0        16.0       16.0        16.0         16.0        16.0        16.0
                                                                                                                                                                                     1000)
                                                                                                                                                       Taux brut de mortalité - Total (par
Crude death rate - Total (per 1000)            6.0         6.0         6.0         6.0        6.0          6.0         6.0         6.0         6.0
                                                                                                                                                                                    1000)
Life expectancy at birth - Total                                                                                                                         Espérance de vie à la naissance -
                                              73.0        73.0        73.0        73.0       74.0        74.0         74.0        74.0        74.0
(years)                                                                                                                                                                    Total (années)
Net reproduction rate - (per                                                                                                                              Taux net de reproduction - (par
                                                ...         ...         ...        1.0         ...          ...         ...         ...        1.0
woman)                                                                                                                                                                            femme)
                                                                                                                                                         Indice synthétique de fécondité -
Total fertility rate - (p woman)
              y        (per    )               2.0         2.0         2.0         2.0        2.0          2.0         2.0         2.0         2.0
                                                                                                                                                                             (par femme)

Education                                                                                                                                                                Enseignement

Teaching staff at first level - Total                                                                                                                  Personnel enseignant - 1er degré -
                                             60.56        59.3        59.6        59.3       59.3        58.9         60.0          ...         ...
(thousands)                                                                                                                                                               Total (milliers)
Teaching staff at second level - Total                                                                                                                Personnel enseignant - 2ème degré -
                                             58.28          ...       68.8        71.9       73.9        78.5         83.0          ...         ...                                              325
(thousands)                                                                                                                                                                Total (milliers)
Teaching staff at third level - Total                                                                                                               Personnel enseignant - 3ème degré -
                                              11.4        12.9        14.7        16.7       16.9        18.1         18.6          ...         ...
(thousands)                                                                                                                                                              Total (milliers)
First level student enrollment - Total                                                                                                                   Elèves inscrits - 1er degré - Total
                                             1 326       1 277       1 228       1 184      1 134       1 069        1 036          ...         ...
(thousands)                                                                                                                                                                        (milliers)
First level student enrollment -                                                                                                                      Elèves inscrits - 1er degré - Femmes
                                              631         609         586         565        542          510         496           ...         ...
Female (thousands)                                                                                                                                                                  (milliers)
Second level student enrollment -                                                                                                                      Elèves inscrits - 2ème degré - Total
                                             1 169       1 149       1 210       1 239      1 247       1 268        1 259          ...         ...
Total (thousands)                                                                                                                                                                 (milliers)
Second level student enrollment -                                                                                                                            Elèves inscrits - 2ème degré -
                                              583         584           ...       633        636            ...       637           ...         ...
Female (thousands)                                                                                                                                                       Femmes (milliers)
Third level student enrollment - Total                                                                                                                 Elèves inscrits - 3ème degré - Total
                                             226.1       263.4       291.8       311.6      325.3       326.2        350.8          ...         ...
(thousands)                                                                                                                                                                       (milliers)
Third level student enrollment -                                                                                                                             Elèves inscrits - 3ème degré -
                                             121.8       144.7       164.9       178.3      187.1       192.6        206.4          ...         ...
Female (thousands)                                                                                                                                                       Femmes (milliers)
Public expenditure on education (%                                                                                                                       Dépenses publiques consacrées à
                                              16.0        18.0        17.0        17.0       18.0        18.0         21.0          ...         ...
of budget)                                                                                                                                                 l'enseignement (% du budget)

Health                                                                                                                                                                               Santé

Hospital beds - Total (per 10 000                                                                                                                        Nombre de lits d'hôpitaux - Total
                                              171         170         176         176        178          176         182           ...         ...
population)                                                                                                                                                                 (pour 10 000)
Nurses - Total (per 10 000                                                                                                                              Nombre d'infirmières - Total (pour
                                              294         305         298         295        304          310         308           ...         ...
population)                                                                                                                                                                       10 000)
Physicians - Total (per 10 000                                                                                                                          Nombre de médecins - Total (pour
                                               82          83          89          94         95          103         112           ...         ...
population)                                                                                                                                                                     10 000)
Public expenditure on Health (% of                                                                                                                    Dépenses publiques consacrées à la
                                                 9           8           8          8          7             7           6          ...         ...
budget)                                                                                                                                                            santé (% du budget)


                                                                                                 African Statistical Yearbook 2011 / Annuaire Statistique pour l'Afrique 2011
Tunisia                                                                                                                                                             Tunisie
                                                                   II NATIONAL ACCOUNTS — COMPTES NATIONAUX

                                                     2002          2003      2004     2005     2006       2007         2008        2009       2010

          Gross domestic product by kind of economic activity at current prices
                                                                                                  Produit intérieur brut par branche d'activité économique aux prix courants


          Tunisian Dinar (Millions)                                                                                                                          Dinar Tunisien(Millions)

          Agriculture                                     2 730     3 287     3 846    3 839    4 246       4 309        4 336       4 886     4 710                              Agriculture

          Mining and quarrying                            1 344     1 355     1 561    2 265    2 809       3 657        5 226       4 602     5 065                   Industries extractives

          Manufacturing                                   5 370     5 578     6 064    6 363    6 910       7 977        9 120       8 990    10 061              Industries manufacturières

          Electricity, gas & water                         483       487       576      555      593         611           713         757       814                   Electricité, gaz et eau

          Construction                                    1 548     1 623     1 734    1 885    2 079       2 170        2 268       2 554     2 868            Bâtiments et travaux publics
          Wholesale & retail trade,                                                                                                                          Commerce de gros et de détail,
                                                          4 377     4 771     5 167    5 578    6 090       6 428        6 787       7 407     7 979
          restaurants, hotels                                                                                                                                         restaurants et hôtels
                                                                                                                                                              Banques, assurances, affaires
          Finance, insurance, real estate, etc.           5 203     5 656     6 020    6 455    7 373       8 001        8 556       9 228    10 036
                                                                                                                                                                              immobilières
          Transport and communications                    3 524     3 781     4 396    4 991    5 410       5 949        6 800       7 284     7 772        Transport(s) et communications
                                                                                                                                                                Administrations publiques et
          Public administration and defense               5 027     5 410     5 909    6 370    6 854       7 449        8 045       8 756     9 500
                                                                                                                                                                                    défense
          Other services                                   154       170       181      192      206         215           229         247       266                          Autres services
                                                                                                                                                             Moins Services d’intermédiation
          Less Imputed Service Charges                   - 483      - 457    - 520    - 581    - 750       - 885         - 925       - 869     - 880
                                                                                                                                                                                   financière
          Gross domestic product at factor                                                                                                               Produit intérieur brut aux couts des
                                                         29 276    31 660    34 934   37 912   41 821      45 881       51 155      53 841    58 190
          cost / basic prices                                                                                                                                          facteurs / prix de base

          Plus: Indirect Taxes / taxes on                                                                                                                Plus taxes indirectes/impôts sur les
                                                          3 625     3 713     3 905    3 958    3 935       3 977        4 064       4 935     5 463
          products, less subsidies                                                                                                                           produits, moins les subventions


          Expenditure on Gross domestic product at current purchaser's values
                                                                                                             Emploi du produit intérieur brut aux prix courants d'acquisition

          Tunisian Dinar (Millions)                                                                                                                          Dinar Tunisien(Millions)
                                                                                                                                                                   Consommation finale des
          Government final consumption                    5 668     6 085     6 572    7 084    7 645       8 298        8 917       9 715         ...
                                                                                                                                                                   administrations publiques

          Private final consumption                      20 641    22 249    24 199   25 870   28 243      30 699       33 999      36 370         ...           Consommation finale privée

          Gross fixed capital formation                   8 148     8 101     8 595    8 981   10 333      11 490       13 010      14 310         ...        Formation brute de capital fixe

          Increase in inventories                        - 313       150       456       98      396         319           972         104         ...                   Variation des stocks

          Exports of goods and services                  13 419    13 967    16 389   18 814   21 061      25 470       30 761      26 428         ...     Exportations de biens et services
326                                                                                                                                                           Moins importations de biens et
          Less imports of goods and services             14 660    15 177    17 371   18 976   21 923      26 419       32 440      28 152         ...
                                                                                                                                                                                    services
          GDP at purchasers' values                      32 901    35 373    38 839   41 870   45 756      49 857       55 219      58 775    63 653               PIB aux prix d'acquisition


          Gross domestic product by kind of economic activity at constant
                                                                                                 Produit intérieur brut par branche d'activité economique aux prix constants
          prices
          Annual Growth Rates (%)                                                                                                                Taux de croissance annuel (%)
          Agriculture                                     -10.0      18.0      13.5     -7.8      7.9         0.8         -0.9         8.8       -8.5                             Agriculture

          Mining and quarrying                              4.4      -4.5       3.0      5.4     -8.3        20.6         -3.6         3.3       0.1                   Industries extractives

          Manufacturing                                     1.1       1.1       2.5      0.6      4.3         8.8          5.6         -2.1      8.6              Industries manufacturières

          Electricity, gas & water                          0.9       4.6       7.1      2.8     -0.1        -4.3          4.6         3.6       3.5                   Electricité, gaz et eau

          Construction                                      4.2       0.5       5.1      6.6      6.5         4.0          4.3         3.9       4.8            Bâtiments et travaux publics
          Wholesale & retail trade,                                                                                                                                 Commerce de gros et de
                                                            0.9       5.7       5.4      4.9      5.7         3.6          4.3         1.6       3.4
          restaurants, hotels                                                                                                                                     détail,restaurants et hôtels
                                                                                                                                                               Banques, assurances, affaires
          Finance, insurance, real estate, etc.            27.2      22.6      14.9      4.3     10.3         8.3          4.5         1.8       5.0
                                                                                                                                                                               immobilières
          Transport and communications                     -9.6      -6.0      -1.4     13.6      8.0         8.0          9.4         5.5       7.1        Transport(s) et communications
                                                                                                                                                                Administrations publiques et
          Public administartion and defense                 3.3       5.9       5.5      5.8      6.2         5.5          4.8         5.2       3.4
                                                                                                                                                                                    défense
          Other services                                    1.0       3.5       0.6      1.0      1.2         1.9          4.7         5.0       4.2                          Autres services
                                                                                                                                                             Moins Services d’intérmediation
          Less Imputed Service Charges                    -15.6      -5.6       3.3      7.1      8.2         6.6          3.6         3.3       3.5
                                                                                                                                                                                   financière
          Gross domestic product at factor                                                                                                               Produit intérieur brut aux couts des
                                                            2.0       5.8       6.2      3.8      5.9         6.7          4.4         3.0       3.8
          cost / basic prices                                                                                                                                          facteurs / prix de base

          Plus: Indirect Taxes / taxes on                                                                                                                Plus taxes indirectes/impôts sur les
                                                           -1.1       2.1       3.4      5.6      3.2         2.3          5.3         4.2       3.1
          products, less subsidies                                                                                                                           produits, moins les subventions

          Gross domestic product at market                                                                                                                 Produit intérieur brut aux prix du
                                                            1.7       5.5       6.0      4.0      5.7         6.3          4.5         3.1       3.7
          prices                                                                                                                                                                      marché


          2008: semi-final           2009: Provisional      2010:Estimated                                          2008: semi-définitif      2009: provisoire               2010:Estimée


      African Statistical Yearbook 2011 / Annuaire Statistique pour l'Afrique 2011
Tunisia                                                                                                                                                          Tunisie

Expenditure on Gross domestic product at constant purchasers'
                                                                                                 Emplois du produit intérieur brut aux prix constants d'acquisition
values

Annual Growth Rates (%)                                                                                                            Taux de croissance annuel (%)
                                                                                                                                                     Consommation finale des
Government final consumption                  6.3       7.4       4.3        2.8       7.0          5.5        5.1      5.2         ...
                                                                                                                                                     administrations publiques

Private final consumption                     3.6       4.6       4.9        4.8       4.5          5.6        4.4      3.7         ...            Consommation finale privée

Gross fixed capital formation                -1.7      -1.8       1.0        2.7       9.5          6.3        5.3      3.5         ...        Formation brute de capital fixe

Exports of goods and services                -3.5       0.0       5.5        4.5       4.3        11.8         2.8      -6.9        ...      Exportations de biens et services

                                                                                                                                               Moins importations de biens et
Less imports of goods and services           -3.0       0.3       2.7        0.0       7.6          9.6        5.4      -8.2        ...
                                                                                                                                                                     services


                                                                            III INFLATION

                                          2002      2003      2004       2005      2006         2007       2008       2009      2010
Annual Growth Rates (%)                                                                                                            Taux de croissance annuel (%)
All Item                                      2.7       2.7       3.6        2.0       4.5          3.2        5.0      3.5        4.4                                Ensemble

Food                                          4.0       3.4       5.0        0.1       5.4          2.8        6.2      4.3        5.8                             Alimentation

Health                                        1.6       2.7       4.0        4.1       3.4          2.6        4.6      4.0        3.6                                    Santé

Energy                                        1.5       2.7       3.8        5.3       9.4          3.2      10.0       2.3        4.3                                  Energie

Transport                                     2.4       4.5       3.4        4.8       6.4          4.9        5.2      2.3        2.6                                Transport


                                                IV AGRICULTURAL PRODUCTION - PRODUCTION AGRICOLE

                                          2002      2003      2004       2005      2006         2007       2008       2009      2010
Tons (Thousand)                                                                                                                                         Tonnes (milliers)
Cereals, Tons (thousands)                    513     2 904     2 347      2 097     1 610        1 988      1 188     2 534         ...              Céréales, tonnes (milliers)

Olive oil, Tons (thousands)                  150       360     1 400        650     1 050          900      1 000       800         ...        Olives à huile, tonnes (milliers)

Dates, Tons (thousands)                      115       111       122        113       131          124        145       140         ...                Dattes, tonnes (milliers)

Citrus, Tons (thousands)                     240       224       209        243       262          247        300       300         ...             Agrumes, tonnes (milliers)

Milk, Tons (thousands)                       945       891       864        920       979        1 006      1 010     1 048         ...                   Lait, tonnes (milliers)


                                                     V MINING PRODUCTION - PRODUCTION MINIERE
                                                                                                                                                                                    327
                                          2002      2003      2004       2005      2006         2007       2008       2009      2010

                                                                                                                                                 Phosphates de chaux, tonnes
Phosphates, Tons (thousands)              7 461.0   7 890.0   8 051.0    8 220.4   7 800.8      8 001.8    7 691.7        ...       ...
                                                                                                                                                                    (milliers)
Lead ore, Tons (thousands)                    8.2       8.2       8.5      13.6         ...          ...        ...       ...       ...    Minerai de plomb, tonnes (milliers)


Iron ore, Tons (thousands)                 202.0     160.0     256.0      206.4     214.3        180.4      108.3         ...       ...        Minerai de fer, tonnes (milliers)


                                                                        VI ENERGY - ENERGIE

                                          2002      2003      2004       2005      2006         2007       2008       2009      2010

Electricity - total hydro production,                                                                                                      Électricité - production hydraulique
                                            64.0     166.0     153.0      145.0      92.0         49.0       38.0         ...       ...
kilowatt hours (millions)                                                                                                                     totale, kilowatt-heures (millions)

Electricity - total thermal production,                                                                                                      Électricité - production thermique
                                          4 292.0   4 659.0   4 626.0    5 344.0   5 174.0      5 926.0    6 410.0        ...       ...
kilowatt hours (millions)                                                                                                                     totale, kilowatt-heures (millions)

Electricity - total production, self-                                                                                                     Electricité - Production totale privée
                                             941       929       946        939       914          878        828         ...       ...
producer (Million Kilowatt Hours)                                                                                                                   (million de kilowatt heures)

Electricity - total production, public                                                                                                           Electricité - Production totale
                                          10 340    10 901    11 508     12 067    12 496       13 090     10 250         ...       ...
(Million Kilowatt Hours)                                                                                                                  publique (million de kilowatt heures)


                                                                                          African Statistical Yearbook 2011 / Annuaire Statistique pour l'Afrique 2011
Tunisia                                                                                                                                                                         Tunisie
                                                  VII TOURISM AND INFRASTRUCTURE - TOURISME ET INFRASTUCTURE

                                                   2002         2003         2004         2005         2006         2007         2008        2009       2010

         Arrivals - Tourists (thousands)          5063.538     5114.303     5997.929     6378.435     6549.549     6761.906     7048.999          ...        ...           Arrivées - touristes (milliers)

         Rooms in hotels and similar                                                                                                                             Chambres d'hotels et établissements
         establishments (thousands)                    777          790          800          816          825          734            ...        ...        ...                  assimilés (milliers)

         Paved Road (% of total)                         ...          ...         66            ...         74            ...         75          ...        ...        Routes asphaltées (% du total)
         Total Network (Railways-km)                 1 909        1 909        1 909        1 909       19 273        2 218       19 371          ...        ...         Réseau total voies ferrées-Km
         Main Telephone Lines (per 1,000                                                                                                                               Lignes téléphoniques fixes (pour
                                                       117          118          121          125          125          124          119        118          ...
         inhabitants)                                                                                                                                                                  1000 habitants)
         Mobile Cellular Subscribers (per                                                                                                                              Abonnés aux téléphones mobiles
                                                        59          191          374          564          720          764          829        930          ...
         1,000 inhabitants)                                                                                                                                                     (pour 1000 habitants)


                                   VII FINANCIAL AND MONETARY STATISTICS - FINANCES ET STATISTIQUES MONETAIRES

                                                   2002         2003         2004         2005         2006         2007         2008        2009       2010

         VII-1 Monetary Statistics                                                                                                                            VII-1 Statistiques monétaires
         Tunisian Dinar (Millions)                                                                                                                                      Dinar Tunisien(Millions)
         Money supply (M1)                           6 892        7 265        8 036        9 140       10 339       11 579       12 991     14 874     16 465                   Masse monétaire (M1)
         Quasi-money                                10 149       10 868       12 151       13 275       14 674       16 539       19 278     21 427     23 984                           Quasi-monnaie
           of which Demand Deposit                       ...          ...          ...          ...          ...          ...          ...        ...        ...              dont Monnaie scripturale
         Net foreign assets                          1 905        2 256        3 130        4 076        6 837        6 698        8 216      9 785      9 311                    Avoirs extérieurs nets
         Domestic credit                            20 001       21 079       23 478       25 467       28 028       30 778       34 825     38 413     44 650                           Crédit intérieur

         of which claims on private sector          18 332       19 517       21 493       23 275       25 071       27 525       31 670     34 805     41 490       dont créances sur le secteur privé

         of which Claims on government                                                                                                                                      dont créances nettes sur le
                                                     1 670        1 562        1 985        2 192        2 958        3 253        3 156      3 608      3 160
         sector, net                                                                                                                                                                    gouvernement
         International reserves (millions of US                                                                                                                    Réserves internationales (millions de
                                                     2 290        2 945        3 936        4 437        6 773        7 851        8 849     11 057      9 459
         $)                                                                                                                                                                                        $ EU)
         Average Exchange Rate (National                                                                                                                            Taux de change (moyen) (monnaie
                                                      1.42         1.29         1.25         1.30         1.33         1.28         1.23       1.35       1.43
         Currency per us $)                                                                                                                                                     nationale par dollars)


         VII-2 Public Finance                                                                                                                                          VII-2 Finances publiques
         Tunisian Dinar (Millions)                                                                                                                                      Dinar Tunisien(Millions)
         Total Revenues and Grants                   7 670        7 821        8 717        9 280        9 756       10 902       13 357     13 576     15 139                 Recettes totales et dons
           Tax Revenue                               6 429        6 631        7 252        7 904        8 470        9 508       11 332     11 686          ...                       Recettes fiscales
           Non Tax Revenue                           1 123        1 113        1 396        1 306        1 238        1 358        1 834      1 707          ...                  Recettes non fiscales
328        Grants                                      118           77           68           70           48           36          192        183          ...                                   Dons

         Total Expenditures and Net Lending          8 431        8 836        9 517       10 254       10 968       12 197       13 724     15 165     16 842           Dépenses totales et prêts nets

           Current expenditure                       4 186        4 489        4 805        5 164        5 645        6 087        6 613      7 279          ...                   Dépenses courantes
           Of which Wages and Salaries               3 684        3 968        4 253        4 591        4 901        5 297        5 732      6 269          ...         Dont rémunérations et salaires
           Capital expenditure                       2 404        2 596        2 616        2 637        2 539        2 677        3 181      3 866          ...               Dépenses d'équipement
           Net Lending                                 102          191           66          111          112          355           47        654          ...                              Prêts nets
         Fiscal Balance                              - 761       - 1 015       - 800        - 973       - 1 212      - 1 295       - 366     - 1 589    - 1 702         Solde global y compris les dons


         VII-3 Balance of Payments                                                                                                                                 VII-3 Balance des paiements
         Tunisian Dinar (Millions)                                                                                                                                      Dinar Tunisien(Millions)
         Trade balance                              - 3 019      - 2 924      - 3 028      - 2 547      - 3 345      - 3 685      - 4 941    - 4 788    - 7 124                   Balance commerciale
         Services Balance                            1 750        1 707        2 048        2 374        2 450        2 699        3 257      3 649      4 122                     Balance des services
         Net Income                                    105          182          151        - 377        - 123        - 420        - 675      - 751      - 422                             Revenus nets
         Current transfers, net total                  104           95          143          162          194          231          250        424        366                      Transferts courants
         Current account balance                    - 1 060       - 941        - 686        - 388        - 824       - 1 175      - 2 109    - 1 465    - 3 058               Solde du compte courant


         VII-4 External Debt and Financial Flows                                                                                                   VII-4 Dette extérieure et flux financiers
         US $ (Millions)                                                                                                                                                            $ E.U (Millions)
         Total external debt                        15 143       17 789       19 526       18 078       18 532       20 145       20 589     21 444     20 296                   Dette extérieure totale
           Private                                   6 049        7 363        8 360        7 933        7 946        8 816        9 446      9 207      8 655                                    Privée
           Public                                    9 095       10 426       11 166       10 145       10 586       11 329       11 142     12 237     11 640                                 Publique
         Total external debt service                 6 896        7 452        8 667        8 784        9 185        9 038       10 095     10 979     11 722            Service de la dette extérieure
         Net Foreign Direct Investment                                                                                                                             Investissements étranger direct (flux
                                                       821          584          639          783        3 308        1 616        2 758      1 688          ...
         Inflows                                                                                                                                                                         nets entrants)
         Net Total Official Development                                                                                                                               Aide publique au développement
                                                       221          300          352          362          431          321          332        474          ...
         assistance                                                                                                                                                                      (nette totale)


      African Statistical Yearbook 2011 / Annuaire Statistique pour l'Afrique 2011
Tunisia                                                                                                                                           Tunisie

                                 2002      2003      2004      2005      2006        2007       2008      2009       2010

Tunisian Dinar (Millions)                                                                                                                     Dinar Tunisien
Exports, fob                                                                                                                              Exportations, fàb


Exports - Total                   9 749    10 343    12 055    13 794    15 558      19 410     23 637   194 692         ...                 Exportations - Total


Main Products                                                                                                                             Principaux produits


Hosiery and Confection            3 789     3 875     4 058     4 005     3 972       4 523      4 564     4 172         ...            Bonneterie et Confection


Crude oil                           715       640       936     1 416     1 564       2 632      3 219     2 093         ...                         Pétrole brut


Threads and cables Electric         461       507       661       763       773       1 003      1 254     1 354         ...            Fils et Câbles électriques


D.A.P (Diammonium phosphate)        267       297       350       329       389         509      1 074       502         ...   D.A.P (Diammoniaque phosphaté)


Phosphoric acid                     214       158       226       283       317         344       887        418         ...                 Acide phosphorique

Main Destinations                                                                                                                    Principales destinations

France                           3 025.0   3 365.5   4 041.9   4 525.1   5 020.7     6 239.2   6 735.3    5 770.5        ...                               France


Italy                            2 081.1   2 281.4   3 105.7   3 308.2   3 437.0     4 519.2   4 883.9    4 095.1        ...                                Italie


Germany                          1 109.8   1 105.6   1 110.1   1 156.5   1 220.3     1 596.7   1 637.1    1 711.8        ...                           Allemagne


Libya                             464.9     453.8     499.9     622.6     825.8       892.7    1 065.2    1 121.2        ...                                Libye


United Kingdom                    241.6     337.3     370.9     394.0     452.4       835.5    1 099.4     925.5         ...                        Royaume-Uni


                                 2002      2003      2004      2005      2006        2007       2008      2009       2010
Imports, cif                                                                                                                               Importations, cif

Imports - Total                  13 511    14 039    15 960    17 292    20 004      24 437     30 241    25 878         ...       Importations - Total (millions)   329

                                                                                                                                          Principaux produits
Main Products


Refined Products                    812       999     1 131     1 571     1 932       1 936      3 084     1 691         ...                     Produits raffinés


Fabrics                           1 712     1 736     1 760     1 757     1 735       2 120      2 121     1 901         ...                               Tissus


Iron & Steel                        273       424       665       583       746       1 048      1 407       749         ...                          Fer & acier


Material structure and plastic      565       584       693       816       926       1 132      1 264     1 197         ...     Matière et ouvrage en plastique


Crude Petroleum                     305       344       395       561       710         746      1 149       676         ...                         Pétrole brut


Main Origin                                                                                                                          Principales provenances

France                           3 454.7   3 658.1   3 983.4   4 023.0   4 525.9     5 226.9   5 585.7    5 169.2        ...                               France

Italy                            2 632.5   2 804.7   3 137.1   3 708.9   3 857.8     4 764.1   5 213.4    4 209.1        ...                                Italie

Germany                          1 205.5   1 264.4   1 346.1   1 418.0   1 573.7     1 635.1   2 109.1    2 250.9        ...                           Allemagne

Russia                            263.8     287.5     486.1     487.1     755.5      1 042.0   2 279.5     961.6         ...                               Russie

Libya                             408.1     460.4     526.9     661.9     965.9       826.7    1 319.2     754.4         ...                                Libye


                                                                               African Statistical Yearbook 2011 / Annuaire Statistique pour l'Afrique 2011
Uganda                                                                                                                                                                         Ouganda

         AREA (KM 2)                                                                                        241 038                                                                SUPERFICIE (KM 2)
         CAPITAL CITY                             Kampala                                                                                          Kampala                                     CAPITALE
         CURRENCY                                 Uganda Shilling                                                                         Shilling Ugandais                                    MONNAIE


                                 I SOCIAL AND DEMOGRAPHIC INDICATORS — INDICATEURS DEMOGRAPHIQUES ET SOCIAUX

                                                     2002         2003         2004         2005         2006         2007         2008         2009       2010
         Population                                                                                                                                                                         Population
                                                                                                                                                                        Population au milieu de l'année -
         Mid-year population - Total (Million)          26.0         26.9         27.8         28.7         29.7         30.6         31.7         32.7     31.7
                                                                                                                                                                                           Total (million)
                                                                                                                                                                        Population au milieu de l'année -
         Mid-year population - Urban (%)                  ...          ...        12.0         13.0         13.0         13.0         13.0         13.1       ...
                                                                                                                                                                                           Urbaine (%)

         Female (%)                                     50.1         50.0         50.0         50.0         50.0         50.0         49.9         49.9       ...                             Femme (%)


         Population by Age Group                                                                                                                                            Population par groupe d'âge


            0-14                                   12879 152    13296 063    13722 605    14157 693    14600 664    15051 839    15512 179    15983 083       ...                                     0-14


            15-64                                  12445 147    12871 693    13321 099    13791 362    14282 896    14797 036    15333 713    15892 829       ...                                    15-64


            65+                                      711 032      722 647      735 205      750 200      768 172      788 668      810 973      833 952       ...                                     65+


         Active Population (000)                    11 288.0     11 667.0     12 065.0     12 480.0     12 913.0     13 393.0     13 875.0     14 376.0       ...                 Population active (000)

            Female (%)                                  47.8         47.8         47.8         47.7         47.7         47.8         47.8         47.8       ...                             Femme (%)

                                                                                                                                                                       Taux brut de natalité - Total (par
         Crude birth rate - Total (per 1000)            47.5         47.3         47.2         47.0         46.7         46.5         46.2         45.8       ...
                                                                                                                                                                                                   1000)
                                                                                                                                                                     Taux brut de mortalité - Total (par
         Crude death rate - Total (per 1000)            15.5         15.0         14.5         14.0         13.6         13.1         12.7         12.3       ...
                                                                                                                                                                                                  1000)
         Life expectancy at birth - Total                                                                                                                              Espérance de vie à la naissance -
                                                        47.7         48.5         49.4         50.3         51.1         51.9         52.7         53.5       ...
         (years)                                                                                                                                                                         Total (années)
         Net reproduction rate - (per                                                                                                                                   Taux net de reproduction - (par
                                                          ...          ...          ...         2.5           ...          ...          ...          ...      ...
         woman)                                                                                                                                                                                 femme)
                                                                                                                                                                       Indice synthétique de fécondité -
         Total fertility rate - (p woman)
                       y        (per    )                6.7          6.7          6.6          6.6          6.5          6.4          6.3          6.3       ...
                                                                                                                                                                                           (par femme)

         Education                                                                                                                                                                     Enseignement

         Teaching staff at first level - Total                                                                                                                       Personnel enseignant - 1er degré -
                                                          ...          ...          ...          ...          ...          ...          ...          ...      ...
         (thousands)                                                                                                                                                                    Total (milliers)
         Teaching staff at second level - Total                                                                                                                     Personnel enseignant - 2ème degré -
330                                                       ...          ...          ...          ...          ...          ...          ...          ...      ...
         (thousands)                                                                                                                                                                     Total (milliers)
         Teaching staff at third level - Total                                                                                                                      Personnel enseignant - 3ème degré -
                                                          ...          ...          ...          ...          ...          ...          ...          ...      ...
         (thousands)                                                                                                                                                                     Total (milliers)
         First level student enrollment - Total                                                                                                                        Elèves inscrits - 1er degré - Total
                                                          ...          ...          ...          ...          ...          ...          ...          ...      ...
         (thousands)                                                                                                                                                                             (milliers)
         First level student enrollment -                                                                                                                           Elèves inscrits - 1er degré - Femmes
                                                          ...          ...          ...          ...          ...          ...          ...          ...      ...
         Female (thousands)                                                                                                                                                                       (milliers)
         Second level student enrollment -                                                                                                                           Elèves inscrits - 2ème degré - Total
                                                          ...          ...          ...          ...          ...          ...          ...          ...      ...
         Total (thousands)                                                                                                                                                                      (milliers)
         Second level student enrollment -                                                                                                                                 Elèves inscrits - 2ème degré -
                                                          ...          ...          ...          ...          ...          ...          ...          ...      ...
         Female (thousands)                                                                                                                                                            Femmes (milliers)
         Third level student enrollment - Total                                                                                                                      Elèves inscrits - 3ème degré - Total
                                                          ...          ...          ...          ...          ...          ...          ...          ...      ...
         (thousands)                                                                                                                                                                            (milliers)
         Third level student enrollment -                                                                                                                                  Elèves inscrits - 3ème degré -
                                                          ...          ...          ...          ...          ...          ...          ...          ...      ...
         Female (thousands)                                                                                                                                                            Femmes (milliers)
         Public expenditure on education (%                                                                                                                            Dépenses publiques consacrées à
                                                          ...          ...          ...          ...          ...          ...          ...          ...      ...
         of budget)                                                                                                                                                      l'enseignement (% du budget)

         Health                                                                                                                                                                                    Santé

         Hospital beds - Total (per 10 000                                                                                                                             Nombre de lits d'hôpitaux - Total
                                                          ...          ...          ...          ...          ...          ...          ...          ...      ...
         population)                                                                                                                                                                      (pour 10 000)
         Nurses - Total (per 10 000                                                                                                                                   Nombre d'infirmières - Total (pour
                                                          ...          ...          ...          ...          ...          ...          ...          ...      ...
         population)                                                                                                                                                                            10 000)
         Physicians - Total (per 10 000                                                                                                                               Nombre de médecins - Total (pour
                                                          ...          ...          ...          ...          ...          ...          ...          ...      ...
         population)                                                                                                                                                                          10 000)
         Public expenditure on Health (% of                                                                                                                         Dépenses publiques consacrées à la
                                                          ...          ...          ...          ...          ...          ...          ...          ...      ...
         budget)                                                                                                                                                                 santé (% du budget)


      African Statistical Yearbook 2011 / Annuaire Statistique pour l'Afrique 2011
Uganda                                                                                                                                            Ouganda
                                                     II NATIONAL ACCOUNTS — COMPTES NATIONAUX

                                            2002     2003     2004     2005     2006        2007      2008       2009      2010

    Gross domestic product by kind of economic activity at current prices
                                                                                   Produit intérieur brut par branche d'activité économique aux prix courants


    Uganda Shilling (Millions)                                                                                                       Shilling Ugandais(Millions)

    Agriculture                              2 685    3 322    3 520    4 284    4 553       4 827     6 083      7 774        ...                            Agriculture

    Mining and quarrying                       37       37       42       49       55          67         81        80         ...                 Industries extractives

    Manufacturing                             865      959     1 066    1 226    1 394       1 616     2 041      2 581        ...            Industries manufacturières

    Electricity, gas & water                  439      479      527      662      783        1 062     1 172      1 363        ...                 Electricité, gaz et eau

    Construction                             1 349    1 551    1 816    2 156    2 256       2 840     3 458      3 895        ...          Bâtiments et travaux publics
    Wholesale & retail trade,                                                                                                            Commerce de gros et de détail,
                                             2 051    2 347    2 552    2 991    3 556       4 240     5 289      6 829        ...
    restaurants, hotels                                                                                                                           restaurants et hôtels
                                                                                                                                          Banques, assurances, affaires
    Finance, insurance, real estate, etc.    1 400    1 611    1 802    1 990    2 259       2 687     3 139      3 643        ...
                                                                                                                                                          immobilières
    Transport and communications              580      688      788      916     1 218       1 474     1 772      2 129        ...      Transport(s) et communications
                                                                                                                                            Administrations publiques et
    Public administration and defense         512      567      596      658      720         747        845       940         ...
                                                                                                                                                                défense
    Other services                           1 269    1 439    1 606    1 851    2 146       2 288     2 484      2 785        ...                        Autres services
                                                                                                                                         Moins Services d’intermédiation
    Less Imputed Service Charges            - 148    - 228    - 253    - 274    - 330        - 408     - 512      - 651        ...
                                                                                                                                                               financière
    Gross domestic product at factor                                                                                                 Produit intérieur brut aux couts des
                                            11 039   12 771   14 063   16 507   18 611      21 440    25 852     31 368        ...
    cost / basic prices                                                                                                                            facteurs / prix de base

    Plus: Indirect Taxes / taxes on                                                                                                  Plus taxes indirectes/impôts sur les
                                              951     1 072    1 209    1 371    1 555       1 911     2 326      2 799        ...
    products, less subsidies                                                                                                             produits, moins les subventions


    Expenditure on Gross domestic product at current purchaser's values
                                                                                              Emploi du produit intérieur brut aux prix courants d'acquisition

    Uganda Shilling (Millions)                                                                                                       Shilling Ugandais(Millions)
                                                                                                                                               Consommation finale des
    Government final consumption             1 872    2 051    2 216    2 441    2 692       2 609     2 814      3 567        ...
                                                                                                                                               administrations publiques

    Private final consumption                9 388   10 649   11 394   13 387   16 142      17 970    22 901     28 466        ...           Consommation finale privée

    Gross fixed capital formation            2 319    2 804    3 300    3 813    4 126       5 304     5 672      7 322        ...        Formation brute de capital fixe

    Increase in inventories                    36       62       18       42       53          62         77        93         ...                   Variation des stocks

    Exports of goods and services            1 267    1 648    2 046    2 717    3 003       4 405     5 625      6 760        ...     Exportations de biens et services
                                                                                                                                          Moins importations de biens et
                                                                                                                                                                             331
    Less imports of goods and services       2 893    3 371    3 702    4 521    5 851       7 000     8 912     12 040        ...
                                                                                                                                                                services
    GDP at purchasers' values               11 990   13 843   15 271   17 878   20 166      23 351    28 178     34 167        ...             PIB aux prix d'acquisition


    Gross domestic product by kind of economic activity at constant
                                                                                  Produit intérieur brut par branche d'activité economique aux prix constants
    prices
    Annual Growth Rates (%)                                                                                                   Taux de croissance annuel (%)
    Agriculture                                3.0      2.2      1.1      2.5     -1.8         1.7       2.3        2.4        ...                            Agriculture

    Mining and quarrying                      13.0     -5.5      9.9     21.4     18.2         5.0      10.4       -8.8        ...                 Industries extractives

    Manufacturing                              3.5      6.2      4.4      9.5      3.5         7.6       7.2       10.1        ...            Industries manufacturières

    Electricity, gas & water                   6.1      3.7      5.0      2.4     -3.7         5.3       4.0        8.9        ...                 Electricité, gaz et eau

    Construction                              14.8      9.5     12.5     24.6     10.0         8.8      21.6       -4.4        ...          Bâtiments et travaux publics
    Wholesale & retail trade,                                                                                                                   Commerce de gros et de
                                               5.8      6.6      4.8     10.8      9.5        12.0      13.3        3.9        ...
    restaurants, hotels                                                                                                                       détail,restaurants et hôtels
                                                                                                                                           Banques, assurances, affaires
    Finance, insurance, real estate, etc.      9.6      3.7      6.9      8.4      8.7         4.2       8.4       10.7        ...
                                                                                                                                                           immobilières
    Transport and communications              10.0     11.0     11.6      7.0     21.7        12.6      22.7       10.2        ...      Transport(s) et communications
                                                                                                                                            Administrations publiques et
    Public administartion and defense         11.7      5.6      1.0      4.7      3.0         3.7       8.8        4.7        ...
                                                                                                                                                                défense
    Other services                            11.1      8.6      7.6      8.6     10.3         3.3       1.4        4.5        ...                        Autres services
                                                                                                                                         Moins Services d’intérmediation
    Less Imputed Service Charges              67.8    -25.6      0.4     28.0     33.8       -17.5      22.9      -53.1        ...
                                                                                                                                                               financière
    Gross domestic product at factor                                                                                                 Produit intérieur brut aux couts des
                                               7.0      6.2      5.7      9.2      6.4         6.9      10.2        4.8        ...
    cost / basic prices                                                                                                                            facteurs / prix de base

    Plus: Indirect Taxes / taxes on                                                                                                  Plus taxes indirectes/impôts sur les
                                               8.1      6.0      6.7     19.5     13.4        19.1      12.6        9.2        ...
    products, less subsidies                                                                                                             produits, moins les subventions

    Gross domestic product at market                                                                                                   Produit intérieur brut aux prix du
                                               7.1      6.2      5.8     10.0      7.0         8.1      10.4        5.3        ...
    prices                                                                                                                                                        marché


Break in the serie from 2004                                                                                                    Rupture de la série à partir 2004


                                                                                     African Statistical Yearbook 2011 / Annuaire Statistique pour l'Afrique 2011
Uganda                                                                                                                                                           Ouganda

         Expenditure on Gross domestic product at constant purchasers'
                                                                                                              Emplois du produit intérieur brut aux prix constants d'acquisition
         values

         Annual Growth Rates (%)                                                                                                                Taux de croissance annuel (%)
                                                                                                                                                                  Consommation finale des
         Government final consumption                   7.4        4.5          3.7          4.5       3.7       -1.5     -0.5       5.3         ...
                                                                                                                                                                  administrations publiques

         Private final consumption                      6.6        1.4          3.4          8.1     12.3         3.3      8.8       5.3         ...            Consommation finale privée

         Gross fixed capital formation                  9.6       10.7         13.8         20.2     11.0       15.4       6.7       5.3         ...        Formation brute de capital fixe

         Exports of goods and services                  8.1        9.5         20.9         21.5      -6.3      54.4      45.8       5.3         ...      Exportations de biens et services

                                                                                                                                                            Moins importations de biens et
         Less imports of goods and services             8.2       -4.4          9.6         16.8     17.2       17.3      19.4       5.3         ...
                                                                                                                                                                                  services


                                                                                            III INFLATION

                                                    2002       2003         2004         2005      2006       2007       2008     2009      2010
         Annual Growth Rates (%)                                                                                                                Taux de croissance annuel (%)
         All Item                                      -0.3        8.7          3.7          8.6       7.2        6.1     12.0      13.0        4.0                                Ensemble

         Food                                           3.2       -0.2         -3.1         -6.8       5.7        2.5     19.0      25.2       -5.6                             Alimentation

         Health                                        -0.1        4.3          3.0          3.8       3.5        4.6      7.7      12.9        0.3                                    Santé

         Energy                                         2.9        5.3          3.8          7.4       8.7      16.6      10.3       6.7       -3.8                                  Energie

         Transport                                     -0.1        4.3          3.0          3.8       3.5        4.6      7.7       2.4       -8.9                                Transport


                                                          IV AGRICULTURAL PRODUCTION - PRODUCTION AGRICOLE

                                                    2002       2003         2004         2005      2006       2007       2008     2009      2010
         Tons (Thousand)                                                                                                                                             Tonnes (milliers)
         Plantains, Tons (thousands)                 9 888      9 700        9 686        9 045     9 054      9 231     9 371     9 512         ...             Plantains, tonnes (milliers)

         Cassava, Tons (thousands)                   5 373      5 450        5 500        5 576     4 926      4 456     5 072     5 179         ...               Manioc, tonnes (milliers)

         Sweet potato, Tons (thousands)              2 592      2 610        2 650        2 604     2 628      2 602     2 707     2 766         ...       Patates douces, tonnes (milliers)

         Maze, Tons (thousands)                      1 217      1 300        1 080        1 170     1 258      1 262     1 266     1 272         ...                  Maïs, tonnes (milliers)

         Millet, Tons (thousands)                      590        640          659          672       687        732       783       841         ...                 Millet, tonnes (milliers)


                                                                V MINING PRODUCTION - PRODUCTION MINIERE
332
                                                    2002       2003         2004         2005      2006       2007       2008     2009      2010

         Gold ores and concentrates                                                                                                                              Minerais d'or et concentrés
                                                        2.6         ...          ...        46.0     21.9       25.4       1.9       0.0         ...
         (Kilograms)                                                                                                                                                          (Kilogrammes)
         Salt and pure sodium chloride,             5 000.0    5 000.0      5 000.0      5 000.0   5 000.0    5 000.0       ...       ...        ...         Sel et chlorure de sodium pur,
         metric tons (thousands)                                                                                                                                 tonnes métriques (milliers)
         Abrasives, natural, metric tons                                                                                                                Abrasifs naturels, tonnes métriques
                                                   12 388.0   65 587.0    134 644.0    140 000.0        ...        ...      ...       ...        ...
         (thousands)                                                                                                                                                               (milliers)


                                                                                       VI ENERGY - ENERGIE

                                                    2002       2003         2004         2005      2006       2007       2008     2009      2010

         Electricity - total hydro production,                                                                                                          Électricité - production hydraulique
                                                    1 741.0    1 796.0      1 940.0      1 813.0   1 239.0    1 412.0       ...       ...        ...
         kilowatt hours (millions)                                                                                                                         totale, kilowatt-heures (millions)

         Electricity - total thermal production,                                                                                                          Électricité - production thermique
                                                        6.2        6.2          2.2         67.4    376.0      540.0        ...       ...        ...
         kilowatt hours (millions)                                                                                                                         totale, kilowatt-heures (millions)

         Electricity - total production, self-                                                                                                         Electricité - Production totale privée
                                                        45         45           47           47        47         47        ...       ...        ...
         producer (Million Kilowatt Hours)                                                                                                                       (million de kilowatt heures)

         Electricity - total production, public                                                                                                               Electricité - Production totale
                                                     1 702      1 757        1 895        1 833     1 568      1 905        ...       ...        ...
         (Million Kilowatt Hours)                                                                                                                      publique (million de kilowatt heures)


      African Statistical Yearbook 2011 / Annuaire Statistique pour l'Afrique 2011
Uganda                                                                                                                                                                            Ouganda
                                         VII TOURISM AND INFRASTRUCTURE - TOURISME ET INFRASTUCTURE

                                           2002         2003         2004         2005         2006          2007         2008         2009         2010

Arrivals - Tourists (thousands)               254          305          512          468          539           642          844          806            ...           Arrivées - touristes (milliers)

Rooms in hotels and similar                                                                                                                                  Chambres d'hotels et établissements
establishments (thousands)                     19            ...          ...          ...          ...           ...          ...          ...          ...                  assimilés (milliers)

Paved Road (% of total)                         ...         23            ...          ...          ...           ...          ...          ...          ...        Routes asphaltées (% du total)
Total Network (Railways-km)                   259            ...        259            ...          ...           ...          ...          ...          ...         Réseau total voies ferrées-Km
Main Telephone Lines (per 1,000                                                                                                                                    Lignes téléphoniques fixes (pour
                                                 2            2            3            3            4             5            5           ...          ...
inhabitants)                                                                                                                                                                       1000 habitants)
Mobile Cellular Subscribers (per                                                                                                                                   Abonnés aux téléphones mobiles
                                               15           29           42           46           68           137          270            ...          ...
1,000 inhabitants)                                                                                                                                                          (pour 1000 habitants)


                          VII FINANCIAL AND MONETARY STATISTICS - FINANCES ET STATISTIQUES MONETAIRES

                                           2002         2003         2004         2005         2006          2007         2008         2009         2010

VII-1 Monetary Statistics                                                                                                                                 VII-1 Statistiques monétaires
Uganda Shilling (Millions)                                                                                                                                       Shilling Ugandais(Millions)
Money supply (M1)                        1 416 841    1 717 592    1 851 288    2 113 523    2 522 511    3 086 580     3 780 280    4 401 000    5 911 750                  Masse monétaire (M1)
Quasi-money                               646 425      719 061      797 156      989 878     1 108 680    1 337 260     2 005 600    2 396 740    3 442 960                          Quasi-monnaie
  of which Demand Deposit                       ...          ...          ...          ...          ...           ...          ...          ...          ...              dont Monnaie scripturale
Net foreign assets                       1 472 240    2 218 340    2 510 270    2 679 430    3 784 990    4 942 420     5 014 410    5 216 110    6 299 060                   Avoirs extérieurs nets
Domestic credit                          1 402 940    1 222 180    1 219 900    1 359 650    1 168 560    1 010 950     2 880 380    3 483 720    5 870 800                          Crédit intérieur

of which claims on private sector         861 494     1 045 260    1 221 870    1 382 870    1 840 770    2 167 710     3 405 400    3 995 280    5 459 690      dont créances sur le secteur privé

of which Claims on government                                                                                                                                           dont créances nettes sur le
                                          497 497      130 089      - 55 240     - 85 277    - 761 236    -1 262 660    - 642 478    - 635 426     343 575
sector, net                                                                                                                                                                         gouvernement
International reserves (millions of US                                                                                                                         Réserves internationales (millions de
                                              934        1 080        1 308        1 344        1 811         2 560        2 301        2 994        2 960
$)                                                                                                                                                                                             $ EU)
Average Exchange Rate (National                                                                                                                                 Taux de change (moyen) (monnaie
                                          1 797.55     1 963.72     1 810.30     1 780.67     1 831.45     1 723.49      1 720.44     2 030.49     2 177.56
Currency per us $)                                                                                                                                                          nationale par dollars)


VII-2 Public Finance                                                                                                                                               VII-2 Finances publiques
Uganda Shilling (Millions)                                                                                                                                       Shilling Ugandais(Millions)
Total Revenues and Grants                2 027 978    2 231 781    2 814 600    3 101 600    3 325 716    3 915 918     3 993 470    4 641 699    5 166 416                Recettes totales et dons
  Tax Revenue                            1 151 220    1 394 360    1 642 100    1 887 700    2 324 574    2 706 224     3 224 264    3 758 250    4 199 818                        Recettes fiscales
  Non Tax Revenue                         153 558      120 212       27 200       32 200      103 627       121 903       30 724       34 640       42 000                    Recettes non fiscales
  Grants                                  723 200      717 209     1 145 300    1 181 700     897 515     1 087 791      738 482      848 809      924 598                                     Dons      333
Total Expenditures and Net Lending       2 447 750    2 770 000    3 182 800    3 222 600    3 609 200    4 210 000     3 906 120    4 620 110    5 785 628          Dépenses totales et prêts nets

  Current expenditure                    1 226 700    1 403 900    1 656 100    1 683 300    1 992 070    2 070 260     2 242 900    2 576 330    2 869 538                    Dépenses courantes
  Of which Wages and Salaries             541 500      612 300      682 900      774 200      866 500       986 500     1 106 100    1 183 600    1 307 000          Dont rémunérations et salaires
  Capital expenditure                    1 019 000    1 141 900    1 188 800    1 232 000    1 314 400    1 516 100     1 436 700    1 657 100    2 491 100                Dépenses d'équipement
  Net Lending                               4 850      - 12 700       9 200       - 7 600     - 29 270      101 100     - 162 890     - 56 690     - 31 110                               Prêts nets
Fiscal Balance                           - 419 772    - 538 219    - 368 200    - 121 000    - 283 484     - 294 082      87 350       21 589     - 619 212         Solde global y compris les dons


VII-3 Balance of Payments                                                                                                                                      VII-3 Balance des paiements
US $ (Millions)                                                                                                                                                                 $ E.U(Millions)
Trade balance                               - 534        - 620        - 599        - 698        - 928         - 995        - 913       - 1 250      - 1 718                   Balance commerciale
Services Balance                            - 298        - 278         - 60        - 106        - 175         - 271        - 474        - 437        - 735                     Balance des services
Net Income                                  - 134        - 137        - 215        - 272        - 249         - 229        - 254        - 268        - 359                             Revenus nets
Current transfers, net total                  684          770          993        1 136        1 037         1 178        1 274        1 328        1 104                      Transferts courants
Current account balance                     - 283        - 265          119           60        - 315         - 316        - 367        - 628       - 1 707               Solde du compte courant


VII-4 External Debt and Financial Flows                                                                                                      VII-4 Dette extérieure et flux financiers
US $ (Millions)                                                                                                                                                                 $ E.U (Millions)
Total external debt                         3 799        4 211        4 465        4 422        4 464         1 468        1 881        2 420        2 839                   Dette extérieure totale
  Private                                       4             0            0            4            5             6         115          115          101                                    Privée
  Public                                    3 796        4 211        4 465        4 418        4 459         1 462        1 766        2 305        2 738                                 Publique
Total external debt service                   159          165          183          187          262         3 509           78           68          102            Service de la dette extérieure
Net Foreign Direct Investment                                                                                                                                  Investissements étranger direct (flux
                                              185          202          295          380          644           733          787          799            ...
Inflows                                                                                                                                                                              nets entrants)
Net Total Official Development                                                                                                                                    Aide publique au développement
                                              725          997        1 216        1 192        1 554         1 737        1 641        1 786            ...
assistance                                                                                                                                                                           (nette totale)


                                                                                                      African Statistical Yearbook 2011 / Annuaire Statistique pour l'Afrique 2011
Uganda                                                                                                                                   Ouganda

                                             2002     2003     2004       2005       2006     2007     2008     2009     2010

         US $ (Millions)                                                                                                                      Shilling Ugandais
         Exports, fob                                                                                                                         Exportations, fàb


         Exports - Total                       481      526       759      1 016     1 188    1 686    2 703    3 093       ...                  Exportations - Total


         Main Products                                                                                                                        Principaux produits


         Coffee, not roasted, not
                                               132      154       163        187       178      227      362      357       ...    Café, non torréfié, non décaféiné
         decaffeinated


                                                                                                                                      Filet de poisson ou de viande,
         Fish fillets and other fish meat,
                                                49       46        91        138       128      115      103       89       ...          hachée ou non, fraîches ou
         minced or not, fresh or chilled
                                                                                                                                                          réfrigérées


         Tobacco, unmanufactured, stemmed
                                                40       41        52         55        31       69       75       78       ...   Tabac, artisanal, filtre, ou emballe
         or stripped


         Portland cement nes                     1        2         3          9        15       35       49       30       ...                Ciment Portland NDA


         Cut flowers and flower buds for                                                                                             Cut flowers and flower buds for
                                                15       20        26         29        27       30       38       36       ...
         bouquets, etc., fresh                                                                                                                  bouquets, etc., fresh

         Main Destinations                                                                                                               Principales destinations

         Belgium                              61.1     44.0       68.0      84.6      75.4     91.8    133.5     99.9       ...                             Belgique


         Netherlands                          49.1     60.5       75.2      78.4      63.4     86.4     80.9     86.9       ...                             Pays-Bas


         Rwanda                                8.0     14.2       23.4      39.8      61.5     98.3    148.5    143.0       ...                              Rwanda


         France                               13.8     18.2       40.4      78.3      80.4     86.7     85.9     47.2       ...                               France


         Germany                              28.4     34.3       33.0      44.1      60.4     75.7    101.0     96.7       ...                           Allemagne


                                             2002     2003     2004       2005       2006     2007     2008     2009     2010
         Imports, cif                                                                                                                         Importations, cif

334      Imports - Total                        ...      ...        ...       ...       ...      ...      ...      ...      ...       Importations - Total (millions)


                                                                                                                                              Principaux produits
         Main Products


         Medicaments nes, in dosage             22       50        43         65       114       87      122      131       ...        Médicaments nda, en dosage


         Portland cement nes                    11       18        19         31        39       52       85       87       ...                Ciment Portland NDA

         Petroleum oils&oils obtained from                                                                                            Huiles de pétrole, bitumineux,
         bituminous minerals,o/than crude      193      215       265        261        46       54       66       54       ...
                                                                                                                                                  distilles, sauf brut
         etc
         Transmission apparatus,for                                                                                               Appareils de transmission, pour les
         radioteleph incorporatg reception       9       11        33         43        80       95       52       74       ...    appareils de réception radioteleph
         apparatus                                                                                                                                        incorporatg

         Electrical apparatus for line                                                                                                  Appareils électriques pour la
                                                 2        4         4          7         3       22       41       16       ...
         telephony/telegraphy nes                                                                                                  téléphonie ou la télégraphie NDA


         Main Origin                                                                                                                     Principales provenances

         Kenya                               301.7    401.1      470.4     566.2     387.0    498.9    614.7    598.3       ...                                Kenya

         China                                28.1     51.4       76.4      79.4     137.8    202.9    230.1    231.2       ...                                Chine

         India                                62.1     83.8       77.3      84.8     109.8    133.8    183.5    226.9       ...                                  Inde

         South Africa                         57.2     62.3       87.2      87.6     103.2    152.9    165.8    147.5       ...                       Afrique du Sud

         Japan                                30.1     35.8       63.0      60.6      81.9    125.2    186.7    127.7       ...                                Japon


      African Statistical Yearbook 2011 / Annuaire Statistique pour l'Afrique 2011
Zambia                                                                                                                                                                         Zambie

AREA (KM 2)                                                                                   752 618                                                                  SUPERFICIE (KM 2)
CAPITAL CITY                             Lusaka                                                                                            Lusaka                                  CAPITALE
CURRENCY                                 Zambian Kwacha                                                                                    Kwacha                                  MONNAIE


                        I SOCIAL AND DEMOGRAPHIC INDICATORS — INDICATEURS DEMOGRAPHIQUES ET SOCIAUX

                                           2002        2003        2004        2005        2006         2007        2008        2009         2010
Population                                                                                                                                                                      Population
                                                                                                                                                            Population au milieu de l'année -
Mid-year population - Total (Million)         11.0        11.2        11.5        11.7        12.0        12.3         12.6        12.9         13.3
                                                                                                                                                                               Total (million)
                                                                                                                                                            Population au milieu de l'année -
Mid-year population - Urban (%)               34.8        34.9        34.9        35.0        35.1        35.2         35.3        35.5         35.7
                                                                                                                                                                               Urbaine (%)

Female (%)                                    62.0        61.8        61.6        61.4        61.2        61.1         60.9        60.8         60.7                              Femme (%)


Population by Age Group                                                                                                                                         Population par groupe d'âge


   0-14                                   4997 969    5130 431    5265 370    5403 821    5545 979    5690 804     5836 609    5981 108     6122 581                                      0-14


   15-64                                  5655 353    5760 074    5868 684    5986 296    6114 810    6253 798     6403 214    6562 233     6730 359                                     15-64


   65+                                     318 923     328 455     338 224     348 315     358 692     369 340      380 396     392 027      404 329                                      65+


Active Population (000)                    4 179.5     4 248.0     4 320.1     4 400.2     4 487.6      4 583.8     4 688.5     4 815.7      4 942.3                  Population active (000)

   Female (%)                                 44.6        44.4        44.3        44.1        44.0        43.8         43.7        43.3         43.2                              Femme (%)

                                                                                                                                                           Taux brut de natalité - Total (par
Crude birth rate - Total (per 1000)           45.0        45.0        44.0        44.0        43.0        43.0         42.0        42.0         43.0
                                                                                                                                                                                       1000)
                                                                                                                                                         Taux brut de mortalité - Total (par
Crude death rate - Total (per 1000)           14.0        13.0        13.0        13.0        13.0        13.0         13.0        13.0         17.0
                                                                                                                                                                                      1000)
Life expectancy at birth - Total                                                                                                                           Espérance de vie à la naissance -
                                              52.0        52.0        52.0        53.0        52.0        51.0         51.0        51.0         45.0
(years)                                                                                                                                                                      Total (années)
Net reproduction rate - (per                                                                                                                                Taux net de reproduction - (par
                                                ...         ...         ...        2.0          ...          ...         ...         ...         2.0
woman)                                                                                                                                                                              femme)
                                                                                                                                                           Indice synthétique de fécondité -
Total fertility rate - (p woman)
              y        (per    )               6.0         6.0         6.0         6.0         6.0          6.0         6.0         6.0          6.0
                                                                                                                                                                               (par femme)

Education                                                                                                                                                                  Enseignement

Teaching staff at first level - Total                                                                                                                    Personnel enseignant - 1er degré -
                                             31.49          ...       36.1        39.1        40.7        44.0         48.1        61.8           ...
(thousands)                                                                                                                                                                 Total (milliers)
Teaching staff at second level - Total                                                                                                                  Personnel enseignant - 2ème degré -
                                             18.72          ...         ...       19.5          ...       26.8         29.1        15.4           ...                                              335
(thousands)                                                                                                                                                                  Total (milliers)
Teaching staff at third level - Total                                                                                                                 Personnel enseignant - 3ème degré -
                                                ...        0.6         0.8         0.6         0.8          1.7         1.7          ...          ...
(thousands)                                                                                                                                                                Total (milliers)
First level student enrollment - Total                                                                                                                     Elèves inscrits - 1er degré - Total
                                             1 732          ...      2 251       2 573       2 679       2 790        2 909       2 841           ...
(thousands)                                                                                                                                                                          (milliers)
First level student enrollment -                                                                                                                        Elèves inscrits - 1er degré - Femmes
                                              832           ...      1 096       1 252       1 322       1 369        1 433       1 407           ...
Female (thousands)                                                                                                                                                                    (milliers)
Second level student enrollment -                                                                                                                        Elèves inscrits - 2ème degré - Total
                                              351           ...       364         443           ...        556         677         708            ...
Total (thousands)                                                                                                                                                                   (milliers)
Second level student enrollment -                                                                                                                              Elèves inscrits - 2ème degré -
                                              159           ...       160         198           ...        265         311         322            ...
Female (thousands)                                                                                                                                                         Femmes (milliers)
Third level student enrollment - Total                                                                                                                   Elèves inscrits - 3ème degré - Total
                                                ...         ...         ...         ...         ...          ...         ...         ...          ...
(thousands)                                                                                                                                                                         (milliers)
Third level student enrollment -                                                                                                                               Elèves inscrits - 3ème degré -
                                                ...         ...         ...         ...         ...          ...         ...         ...          ...
Female (thousands)                                                                                                                                                         Femmes (milliers)
Public expenditure on education (%                                                                                                                         Dépenses publiques consacrées à
                                                ...         ...       14.8          ...         ...          ...         ...         ...          ...
of budget)                                                                                                                                                   l'enseignement (% du budget)

Health                                                                                                                                                                                 Santé

Hospital beds - Total (per 10 000                                                                                                                          Nombre de lits d'hôpitaux - Total
                                                ...        22          22           ...         ...         19           ...        30            ...
population)                                                                                                                                                                   (pour 10 000)
Nurses - Total (per 10 000                                                                                                                                Nombre d'infirmières - Total (pour
                                                ...         ...       169           ...         ...        515           ...       700            ...
population)                                                                                                                                                                         10 000)
Physicians - Total (per 10 000                                                                                                                            Nombre de médecins - Total (pour
                                                ...         ...        11           ...         ...        572           ...        11            ...
population)                                                                                                                                                                       10 000)
Public expenditure on Health (% of                                                                                                                      Dépenses publiques consacrées à la
                                               14          13          14          15          16            ...         ...         ...          ...
budget)                                                                                                                                                              santé (% du budget)


                                                                                                  African Statistical Yearbook 2011 / Annuaire Statistique pour l'Afrique 2011
Zambia                                                                                                                                                              Zambie
                                                                  II NATIONAL ACCOUNTS — COMPTES NATIONAUX

                                                     2002         2003      2004      2005      2006       2007      2008       2009          2010

          Gross domestic product by kind of economic activity at current prices
                                                                                                   Produit intérieur brut par branche d'activité économique aux prix courants


          Zambian Kwacha(Billions)                                                                                                                                   Kwacha(Milliards)

          Agriculture                                     3 247    4 245     5 568     6 724     7 800       9 140    10 864    13 470             ...                            Agriculture

          Mining and quarrying                             575       565       810     1 031     1 613       2 037     2 228       805             ...                 Industries extractives

          Manufacturing                                   1 694    2 241     2 828     3 430     4 016       4 487     5 125     6 011             ...            Industries manufacturières

          Electricity, gas & water                         488       595       695       923     1 166       1 345     1 512     1 805             ...                 Electricité, gaz et eau

          Construction                                    1 068    1 590     2 322     3 216     4 704       6 693     8 811    12 468             ...          Bâtiments et travaux publics
          Wholesale & retail trade,                                                                                                                          Commerce de gros et de détail,
                                                          3 411    4 402     5 515     6 763     7 645       8 750    10 128    11 554             ...
          restaurants, hotels                                                                                                                                         restaurants et hôtels
                                                                                                                                                              Banques, assurances, affaires
          Finance, insurance, real estate, etc.           2 534    3 189     3 975     4 751     5 543       6 325     7 648     9 264             ...
                                                                                                                                                                              immobilières
          Transport and communications                    1 056    1 058     1 252     1 396     1 629       1 984     2 249     2 313             ...      Transport(s) et communications
                                                                                                                                                                Administrations publiques et
          Public administration and defense                647       752       797     1 002       983       1 258     1 446     1 483             ...
                                                                                                                                                                                    défense
          Other services                                   832     1 077     1 326     1 805     2 479       3 066     4 019     5 159             ...                        Autres services
                                                                                                                                                             Moins Services d’intermédiation
          Less Imputed Service Charges                   - 858    - 1 062   - 1 312   - 1 593   - 1 866    - 2 096    - 2 592   - 3 205            ...
                                                                                                                                                                                   financière
          Gross domestic product at factor                                                                                                               Produit intérieur brut aux couts des
                                                         14 694   18 651    23 774    29 447    35 712      42 989    51 438    61 127             ...
          cost / basic prices                                                                                                                                          facteurs / prix de base

          Plus: Indirect Taxes / taxes on                                                                                                                Plus taxes indirectes/impôts sur les
                                                          1 631    1 900     2 219     2 594     2 849       3 205     3 640     3 200             ...
          products, less subsidies                                                                                                                           produits, moins les subventions


          Expenditure on Gross domestic product at current purchaser's values
                                                                                                              Emploi du produit intérieur brut aux prix courants d'acquisition

          Zambian Kwacha(Billions)                                                                                                                                   Kwacha(Milliards)
                                                                                                                                                                   Consommation finale des
          Government final consumption                    2 109    2 981     4 866     6 563     7 857       9 080    12 123    13 797             ...
                                                                                                                                                                   administrations publiques

          Private final consumption                      11 344   13 750    16 791    20 127    22 432      26 169    32 518    33 167             ...           Consommation finale privée

          Gross fixed capital formation                   3 517    5 055     7 369     8 830     9 450       9 529    10 780    14 626             ...        Formation brute de capital fixe

          Increase in inventories                          219       270       360       369       505        623        767       899             ...                   Variation des stocks

          Exports of goods and services                   3 850    4 190     6 996     7 610    14 787      18 900    19 377    22 670             ...     Exportations de biens et services
336                                                                                                                                                           Moins importations de biens et
          Less imports of goods and services              4 715    5 696    10 389    11 457    16 470      18 105    20 488    20 832             ...
                                                                                                                                                                                    services
          GDP at purchasers' values                      16 324   20 551    25 993    32 042    38 561      46 195    55 079    64 326             ...             PIB aux prix d'acquisition


          Gross domestic product by kind of economic activity at constant
                                                                                                  Produit intérieur brut par branche d'activité economique aux prix constants
          prices
          Annual Growth Rates (%)                                                                                                                 Taux de croissance annuel (%)
          Agriculture                                      -1.7      5.1       4.2       -0.6      2.2         0.4       2.6       7.1             ...                            Agriculture

          Mining and quarrying                             16.4      3.4      13.9       7.9       7.3         3.6       2.5      15.7             ...                 Industries extractives

          Manufacturing                                     5.7      7.6       4.7       2.9       5.8         3.0       1.8       2.5             ...            Industries manufacturières

          Electricity, gas & water                         -5.2      0.4       -1.7      5.5      10.5         1.0       -1.2      8.6             ...                 Electricité, gaz et eau

          Construction                                     17.4     21.6      20.5      21.2      14.4        20.0       8.7      15.6             ...          Bâtiments et travaux publics
          Wholesale & retail trade,                                                                                                                                 Commerce de gros et de
                                                            5.0      6.2       5.1       3.5       3.7         3.4       2.9       0.4             ...
          restaurants, hotels                                                                                                                                     détail,restaurants et hôtels
                                                                                                                                                               Banques, assurances, affaires
          Finance, insurance, real estate, etc.             1.9      4.8       6.4      11.0      22.0        19.2      15.8       3.1             ...
                                                                                                                                                                               immobilières
          Transport and communications                      4.0      3.7       3.8       3.2       3.6         3.6       5.6       4.0             ...      Transport(s) et communications
                                                                                                                                                                Administrations publiques et
          Public administartion and defense                -1.0      0.2       0.3       6.2       -8.7       14.7       2.2      -10.3            ...
                                                                                                                                                                                    défense
          Other services                                    4.7      3.1       0.9      17.0      26.3        10.9      18.6      17.6             ...                        Autres services
                                                                                                                                                             Moins Services d’intérmediation
          Less Imputed Service Charges                      2.6      2.5       2.5       2.5       2.6         2.5       2.5       2.6             ...
                                                                                                                                                                                   financière
          Gross domestic product at factor                                                                                                               Produit intérieur brut aux couts des
                                                            4.6      6.0       6.2       5.9       7.0         6.7       5.6       6.3             ...
          cost / basic prices                                                                                                                                          facteurs / prix de base

          Plus: Indirect Taxes / taxes on                                                                                                                Plus taxes indirectes/impôts sur les
                                                           -6.7      -2.7      -2.7      -0.1      -3.0       -0.3       5.7       6.3             ...
          products, less subsidies                                                                                                                           produits, moins les subventions

          Gross domestic product at market                                                                                                                 Produit intérieur brut aux prix du
                                                            3.3      5.1       5.4       5.3       6.2         6.2       5.7       6.3             ...
          prices                                                                                                                                                                      marché


          2008: semi-final           2009: Provisional                                                                                    2008: semi-définitif            2009: provisoire


      African Statistical Yearbook 2011 / Annuaire Statistique pour l'Afrique 2011
Zambia                                                                                                                                                                           Zambie

Expenditure on Gross domestic product at constant purchasers'
                                                                                                              Emplois du produit intérieur brut aux prix constants d'acquisition
values

Annual Growth Rates (%)                                                                                                                             Taux de croissance annuel (%)
                                                                                                                                                                      Consommation finale des
Government final consumption                    2.3         19.3         39.0         14.0          9.8          4.4         18.7         -3.4       ...
                                                                                                                                                                      administrations publiques

Private final consumption                      15.1          4.6        -19.2          2.3          8.7         20.5          2.0          2.3       ...            Consommation finale privée

Gross fixed capital formation                  18.0         19.0          9.9          2.4          8.4         16.2         12.1         -3.1       ...        Formation brute de capital fixe

Exports of goods and services                 -22.3        -16.3         38.9          5.4          7.2        -30.5         -3.9         30.6       ...      Exportations de biens et services

                                                                                                                                                                Moins importations de biens et
Less imports of goods and services              1.8          1.7         14.2          3.1          8.5          6.9          2.7          5.4       ...
                                                                                                                                                                                      services


                                                                                      III INFLATION

                                            2002         2003         2004         2005         2006         2007         2008         2009       2010
Annual Growth Rates (%)                                                                                                                             Taux de croissance annuel (%)
All Item                                       26.7         17.2         17.5         15.9          8.2          8.9         16.6          9.9      7.1                               Ensemble

Food                                           35.5         13.5         16.3         17.5         -0.2          5.9         20.5          8.0      1.2                            Alimentation

Health                                         15.6         19.1         13.5         10.5         25.1          9.1          9.9         15.9      0.1                                   Santé

Energy                                         17.0         21.6         17.3         26.5         13.0         11.2         15.2         11.4       ...                                 Energie

Transport                                      13.3         10.4         21.0         -3.5         15.2         13.6         15.9         -3.4      1.0                               Transport


                                                  IV AGRICULTURAL PRODUCTION - PRODUCTION AGRICOLE

                                            2002         2003         2004         2005         2006         2007         2008         2009       2010
Tons (Thousand)                                                                                                                                                          Tonnes (milliers)
Maize, Tons (thousands)                        840        1 207        1 214          866        1 424        1 366        1 446        1 889        ...                  Maïs, tonnes (milliers)

Wheat, Tons (thousands)                         75           84          100          137           94          116          113          195        ...                   Blé, tonnes (milliers)

Cotton lint, Tons (thousands)                   66           65          144          155          118           55           89           87        ...      Fibres de coton, tonnes (milliers)
Groundnuts in shell, Tons                                                                                                                                          Arachides en coques, tonnes
                                                76           83           70           74           84           55           85          121        ...
(thousands)                                                                                                                                                                          (milliers)
Soya beans, Tons (thousands)                    35           42           55           90           58           55           57          119        ...      Graines de soja, tonnes (milliers)


                                                          V MINING PRODUCTION - PRODUCTION MINIERE
                                                                                                                                                                                                    337
                                            2002         2003         2004         2005         2006         2007         2008         2009       2010

                                                                                                                                                                      Minerai de cuivre et leurs
Copper ores, Tons (thousands)             337 742.7    353 594.0    422 180.7    465 002.0    515 618.1    550 731.2    575 036.7    336 980.3       ...
                                                                                                                                                                  concentrés, tonnes métriques

Cobalt, Tons (thousands)                    3 984.4      6 493.0      6 081.6      5 530.8      4 647.8      4 413.5      4 053.4      1 714.4       ...     Cobalt, tonnes métriques (milliers)


                                                 ...          ...          ...          ...          ...          ...          ...          ...      ...


                                                                                 VI ENERGY - ENERGIE

                                            2002         2003         2004         2005         2006         2007         2008         2009       2010

Electricity - total hydro production,                                                                                                                       Électricité - production hydraulique
                                               50.0         51.0         52.0         55.0         56.0         57.0         57.0         57.0       ...
kilowatt hours (millions)                                                                                                                                      totale, kilowatt-heures (millions)

Electricity - total thermal production,                                                                                                                       Électricité - production thermique
                                            8 102.0      8 257.0      8 460.0      8 883.0      9 329.0      9 796.0      9 534.0      4 978.2       ...
kilowatt hours (millions)                                                                                                                                      totale, kilowatt-heures (millions)

Electricity - total production, self-                                                                                                                      Electricité - Production totale privée
                                               199          209          219          232          243          255            ...          ...      ...
producer (Million Kilowatt Hours)                                                                                                                                    (million de kilowatt heures)

Electricity - total production, public                                                                                                                            Electricité - Production totale
                                             7 953        8 099        8 293        8 706        9 142        9 598            ...          ...      ...
(Million Kilowatt Hours)                                                                                                                                   publique (million de kilowatt heures)


                                                                                                       African Statistical Yearbook 2011 / Annuaire Statistique pour l'Afrique 2011
Zambia                                                                                                                                                                                     Zambie
                                                   VII TOURISM AND INFRASTRUCTURE - TOURISME ET INFRASTUCTURE

                                                     2002          2003          2004         2005         2006          2007          2008          2009          2010

         Arrivals - Tourists (thousands)                565           413           515          669          757           897           812             ...           ...           Arrivées - touristes (milliers)

         Rooms in hotels and similar                                                                                                                                        Chambres d'hotels et établissements
         establishments (thousands)                       5             5             5            ...          ...           ...           ...           ...           ...                  assimilés (milliers)

         Paved Road (% of total)                         11            11            11           11           11            11            11            11             ...        Routes asphaltées (% du total)
         Total Network (Railways-km)                 59 596        59 596        59 596       59 596       59 596        59 596        59 596        59 596             ...         Réseau total voies ferrées-Km
         Main Telephone Lines (per 1,000                                                                                                                                          Lignes téléphoniques fixes (pour
                                                           8           10             8             8            8             8             8             7            ...
         inhabitants)                                                                                                                                                                             1000 habitants)
         Mobile Cellular Subscribers (per                                                                                                                                         Abonnés aux téléphones mobiles
                                                         13            19            37           83          144           225           270           323             ...
         1,000 inhabitants)                                                                                                                                                                (pour 1000 habitants)


                                   VII FINANCIAL AND MONETARY STATISTICS - FINANCES ET STATISTIQUES MONETAIRES

                                                     2002          2003          2004         2005         2006          2007          2008          2009          2010

         VII-1 Monetary Statistics                                                                                                                                       VII-1 Statistiques monétaires
         Zambian Kwacha(Millions)                                                                                                                                                           Kwacha(Millions)
         Money supply (M1)                        2 454 705     2 976 488     3 900 974     3 823 712    5 773 490     7 118 170    8 490 480     9 096 740 11 946 510                      Masse monétaire (M1)
         Quasi-money                                929 793     1 253 360     1 680 540     1 934 110    2 528 380     3 281 290    4 324 630     4 700 170     5 650 700                           Quasi-monnaie
           of which Demand Deposit                        ...           ...           ...          ...          ...           ...           ...           ...           ...              dont Monnaie scripturale
         Net foreign assets                       -3 001 020    -3 016 480    -2 108 760    - 352 672    3 498 340     4 552 020    4 984 690     4 913 220     6 855 600                    Avoirs extérieurs nets
         Domestic credit                          7 636 760     7 863 210     9 119 700     7 227 810    6 422 960     7 572 070 10 337 800 11 976 000 14 314 900                                   Crédit intérieur

         of which claims on private sector        1 028 270     1 392 270     2 094 850     2 466 400    3 755 150     5 460 280    8 209 280     7 741 450     8 910 070       dont créances sur le secteur privé

         of which Claims on government                                                                                                                                                 dont créances nettes sur le
                                                  6 506 960     6 338 350     6 849 470     4 514 350    2 402 020     1 677 860    1 886 130     3 963 130     5 213 240
         sector, net                                                                                                                                                                               gouvernement
         International reserves (millions of US                                                                                                                               Réserves internationales (millions de
                                                        535           248           337          560          720         1 090         1 096         1 892         2 094
         $)                                                                                                                                                                                                   $ EU)
         Average Exchange Rate (National                                                                                                                                       Taux de change (moyen) (monnaie
                                                   4 398.59      4 733.27      4 778.88      4 463.50     3 603.07      4 002.52     3 745.66      5 046.11      4 797.14
         Currency per us $)                                                                                                                                                                nationale par dollars)


         VII-2 Public Finance                                                                                                                                                     VII-2 Finances publiques
         Zambian Kwacha(Millions)                                                                                                                                                           Kwacha(Millions)
         Total Revenues and Grants                4 247 200     5 114 000     6 177 000     7 467 010 16 825 010      10 626 510 12 290 010 13 105 000 14 229 415                         Recettes totales et dons
           Tax Revenue                            2 837 000     3 558 000     4 550 000     5 512 010    6 317 010     8 184 010    9 654 010     9 661 000             ...                       Recettes fiscales
           Non Tax Revenue                           60 200       132 000       194 000      130 000      301 000       338 500       567 000       654 000             ...                  Recettes non fiscales
338        Grants                                 1 350 000     1 424 000     1 433 000     1 825 000 10 207 000       2 104 000    2 069 000     2 790 000             ...                                   Dons

         Total Expenditures and Net Lending       5 172 000     6 337 000     6 910 000     8 325 000    9 781 000    10 736 000 13 524 000 14 479 000 16 903 573                   Dépenses totales et prêts nets

           Current expenditure                    2 089 500     2 842 000     3 297 000     4 590 310    5 784 112     7 236 000    9 066 000     9 538 000             ...                   Dépenses courantes
           Of which Wages and Salaries            1 301 200     1 728 000     2 012 000     2 455 000    2 833 000     3 531 000    4 465 000     5 317 000             ...         Dont rémunérations et salaires
           Capital expenditure                    1 924 600     2 335 000     2 265 000     2 267 000    1 601 000     1 842 000    1 966 000     2 808 000             ...               Dépenses d'équipement
           Net Lending                               86 000         6 000         4 000      - 24 000     483 000      - 474 000      427 000       300 000             ...                              Prêts nets
         Fiscal Balance                            - 924 800    -1 223 000     - 733 000    - 857 990    7 044 010     - 109 490    -1 233 990    -1 374 000    -2 674 158         Solde global y compris les dons


         VII-3 Balance of Payments                                                                                                                                            VII-3 Balance des paiements
         US $(Millions)                                                                                                                                                                        $ E.U(Millions)
         Trade balance                                - 214         - 306          - 27           86        1 307           899           405           906         2 472                    Balance commerciale
         Services Balance                             - 245         - 238         - 216        - 198        - 358         - 640         - 615         - 465        - 1 350                    Balance des services
         Net Income                                   - 148         - 145         - 350        - 604       - 1 168       - 1 545       - 1 399       - 1 361       - 1 933                            Revenus nets
         Current transfers, net total                   104            67            29          107          173           530           560           516           545                      Transferts courants
         Current account balance                      - 504         - 621         - 565        - 609         - 46         - 755        - 1 049        - 403         - 266                Solde du compte courant


         VII-4 External Debt and Financial Flows                                                                                                           VII-4 Dette extérieure et flux financiers
         US $(Millions)                                                                                                                                                                        $ E.U(Millions)
         Total external debt                          6 892         6 690         6 225        4 131          533         1 102         1 259         1 578         1 755                   Dette extérieure totale
           Private                                        7             7             0             0            0             0             0             0             0                                   Privée
           Public                                     6 885         6 683         6 225        4 131          533         1 102         1 259         1 578         1 755                                 Publique
         Total external debt service                    123           192           373          166           66            69            97            87            83            Service de la dette extérieure
         Net Foreign Direct Investment                                                                                                                                        Investissements étranger direct (flux
                                                        303           347           364          357          616         1 324           939           959             ...
         Inflows                                                                                                                                                                                    nets entrants)
         Net Total Official Development                                                                                                                                          Aide publique au développement
                                                        811           775         1 130        1 172        1 449         1 008         1 116         1 269             ...
         assistance                                                                                                                                                                                 (nette totale)


      African Statistical Yearbook 2011 / Annuaire Statistique pour l'Afrique 2011
Zambia                                                                                                                                                      Zambie

                                        2002      2003      2004      2005      2006        2007       2008      2009       2010

Zambian Kwacha(Millions)                                                                                                                                         Kwacha
Exports, fob                                                                                                                                        Exportations, fàb


Exports - Total                          4 246     5 041     8 720     9 856    14 018      17 805     18 268    20 686         ...                    Exportations - Total


Main Products                                                                                                                                       Principaux produits


Cathodes and sections of cathodes                                                                                                     Cathodes et sections de cathodes de
                                         2 004     1 866     2 381     3 418     5 268       8 382      7 657     7 667         ...
of refined copper                                                                                                                                            cuivre raffiné


Plates, sheets and strip, of refined                                                                                                  Plaques, feuilles et bandes de cuivre
                                             0         0        43       398     3 227       3 284      3 543     2 315         ...
copper, uncoi                                                                                                                                                 raffiné, uncoi


                                                                                                                                                Minerais de cuivre et leurs
Copper ores and concentrates                16        57       173       407     1 807       1 108      2 580     1 340         ...
                                                                                                                                                               concentrés


Other: articles of cobalt, nes             229       232     1 236       746       514         987      1 066       308         ...          Autre: articles de cobalt, nda


Wire of refined copper, maximum                                                                                                        Fil en cuivre raffiné, la plus grande
                                            69        92       209       278       531         595       492        461         ...
cross-sectional dimension >6mm                                                                                                              dimension transversale> 6mm

Main Destinations                                                                                                                              Principales destinations

Switzerland                              247.8     365.9    1 228.1   3 322.4   5 462.8     7 876.8   9 274.5    8 824.1        ...                                  Suisse


South Africa                            1 005.6   1 030.5   1 858.6    881.2    1 652.9     2 250.3   1 942.8    1 792.5        ...                         Afrique du Sud


United Kingdom                          1 676.7   1 217.6   1 327.6    340.0     365.0       224.2      428.7     391.8         ...                          Royaume-Uni


China                                     16.9      79.8     166.4     852.1     983.8       755.1    1 057.8    2 021.8        ...                                   Chine


Congo, DR                                204.9     288.1     551.6     485.1     535.5      1 128.4   1 052.7    1 394.7        ...                             Congo, RD


                                        2002      2003      2004      2005      2006        2007       2008      2009       2010
Imports, cif                                                                                                                                         Importations, cif

Imports - Total                          5 825     7 250     9 078    10 609    10 447      15 896     18 765    21 823         ...         Importations - Total (millions)    339

                                                                                                                                                    Principaux produits
Main Products


Petroleum oils and oils obtained from                                                                                                       Huiles de pétrole, les huiles de
                                             2       196       642       454       833         916      1 747     2 040         ...
bituminous minerals, crude                                                                                                                      minéraux bitumineux, brut


                                                                                                                                                Minerais de cuivre et leurs
Copper ores and concentrates                10        15        43        69       107         552      1 581     1 155         ...
                                                                                                                                                               concentrés


Gas oils.                                  111       120       160       314       385         536       676        108         ...                                Gas-oils

Diesel non dual purpose vehicles for                                                                                                        Diesel but non double pour les
                                           105       109       150       208       198         166       238        161         ...
either person                                                                                                                                  véhicules soit à la personne


Urea                                        55        67       144       112       108         161       146        311         ...                                    Urée


Main Origin                                                                                                                                    Principales provenances

South Africa                            3 446.2   3 698.9   4 794.3   5 170.8   5 146.5     7 010.9   7 841.3    6 841.5        ...                         Afrique du Sud

United Kingdom                           400.8     440.4    1 524.1   1 441.4    416.3       598.6      573.3     624.8         ...                          Royaume-Uni

Congo, DR                                 15.5      78.7     100.3     160.5     204.3       658.7    1 986.1    2 010.1        ...                             Congo, DR

Zimbabwe                                 424.5     977.6     594.9     497.8     633.1       453.8      381.4     258.4         ...                              Zimbabwe

United Arab Emirates                      80.3     320.8     698.8     423.2    1 148.6     1 003.9     448.3     478.1         ...                    Émirats Arabes Unis


                                                                                      African Statistical Yearbook 2011 / Annuaire Statistique pour l'Afrique 2011
Zimbabwe                                                                                                                                                            Zimbabwe

         AREA (KM 2)                                                                                   390 760                                                             SUPERFICIE (KM 2)
         CAPITAL CITY                             Harare                                                                                     Harare                                    CAPITALE
         CURRENCY                                 Zimbabwe Dollar                                                                Dollar Zimbabween                                     MONNAIE


                                  I SOCIAL AND DEMOGRAPHIC INDICATORS — INDICATEURS DEMOGRAPHIQUES ET SOCIAUX

                                                    2002        2003        2004        2005        2006         2007        2008        2009       2010
         Population                                                                                                                                                                 Population
                                                                                                                                                                 Population au milieu de l'année -
         Mid-year population - Total (Million)         11.6        12.5        13.0        13.1        13.2        13.3         13.4        13.8       ...
                                                                                                                                                                                    Total (million)
                                                                                                                                                                 Population au milieu de l'année -
         Mid-year population - Urban (%)               34.6          ...       35.0        36.0        36.0        37.0         29.0        37.8       ...
                                                                                                                                                                                    Urbaine (%)

         Female (%)                                    51.3        51.3        51.4        51.5        51.6        51.6         51.9        51.7       ...                             Femme (%)


         Population by Age Group                                                                                                                                     Population par groupe d'âge


            0-14                                   4722 013    5183 737    5149 380    5114 015    5078 348    5043 916     5014 762    4995 760       ...                                     0-14


            15-64                                  6445 950    6872 744    6880 515    6889 493    6899 538    6913 359     6945 524    7014 225       ...                                    15-64


            65+                                     463 694     453 711     462 400     471 576     481 467     491 945      502 595     512 799       ...                                      65+


         Active Population (000)                    5 234.0     5 248.0     5 258.0     5 271.0     5 292.0      5 320.0     5 373.0     5 449.0       ...                 Population active (000)

            Female (%)                                 46.0        45.6        45.5        45.4        45.2        44.7         44.6        44.4       ...                             Femme (%)

                                                                                                                                                                Taux brut de natalité - Total (par
         Crude birth rate - Total (per 1000)           30.2        30.2        30.1        30.1        30.0        30.0         25.3        29.8       ...
                                                                                                                                                                                           1000)
                                                                                                                                                               Taux brut de mortalité - Total (par
         Crude death rate - Total (per 1000)           17.2        18.5        18.4        18.0        17.4        16.7         18.9        15.3       ...
                                                                                                                                                                                            1000)
         Life expectancy at birth - Total                                                                                                                       Espérance de vie à la naissance -
                                                       41.5        39.0        41.3        41.7        42.4        43.4         43.3        45.7       ...
         (years)                                                                                                                                                                  Total (années)
         Net reproduction rate - (per                                                                                                                            Taux net de reproduction - (par
                                                         ...         ...         ...        1.1          ...          ...         ...         ...      ...
         woman)                                                                                                                                                                         femme)
                                                                                                                                                                Indice synthétique de fécondité -
         Total fertility rate - (per woman)             3.7         4.8         3.7         3.8         3.6          3.5         3.3         3.7       ...
                                                                                                                                                                                    (par femme)

         Education                                                                                                                                                              Enseignement

         Teaching staff at first level - Total                                                                                                                Personnel enseignant - 1er degré -
                                                      64.31        64.8        65.5        65.6        65.1           ...         ...         ...      ...
         (thousands)                                                                                                                                                             Total (milliers)
         Teaching staff at second level -                                                                                                                    Personnel enseignant - 2ème degré -
                                                      32.91        33.0        34.8        35.3        35.0           ...         ...         ...      ...
340      Total (thousands)                                                                                                                                                        Total (milliers)
         Teaching staff at third level - Total                                                                                                               Personnel enseignant - 3ème degré -
                                                         ...         ...         ...         ...         ...          ...         ...         ...      ...
         (thousands)                                                                                                                                                              Total (milliers)
         First level student enrollment - Total                                                                                                                 Elèves inscrits - 1er degré - Total
                                                      2 480       2 463       2 465       2 462       2 446           ...         ...         ...      ...
         (thousands)                                                                                                                                                                      (milliers)
         First level student enrollment -                                                                                                                    Elèves inscrits - 1er degré - Femmes
                                                      1 173       1 180       1 186       1 199       1 193           ...         ...         ...      ...
         Female (thousands)                                                                                                                                                               (milliers)
         Second level student enrollment -                                                                                                                    Elèves inscrits - 2ème degré - Total
                                                       819         810         802         802         775            ...         ...         ...      ...
         Total (thousands)                                                                                                                                                               (milliers)
         Second level student enrollment -                                                                                                                          Elèves inscrits - 2ème degré -
                                                       389         360           ...         ...       400            ...         ...         ...      ...
         Female (thousands)                                                                                                                                                     Femmes (milliers)
         Third level student enrollment -                                                                                                                     Elèves inscrits - 3ème degré - Total
                                                       60.2        55.7          ...         ...         ...          ...         ...         ...      ...
         Total (thousands)                                                                                                                                                               (milliers)
         Third level student enrollment -                                                                                                                           Elèves inscrits - 3ème degré -
                                                       24.6        21.6          ...         ...         ...          ...         ...         ...      ...
         Female (thousands)                                                                                                                                                     Femmes (milliers)
         Public expenditure on education (%                                                                                                                     Dépenses publiques consacrées à
                                                       18.0        19.0        21.0        12.0        19.0           ...         ...         ...      ...
         of budget)                                                                                                                                               l'enseignement (% du budget)

         Health                                                                                                                                                                            Santé

         Hospital beds - Total (per 10 000                                                                                                                      Nombre de lits d'hôpitaux - Total
                                                         ...         ...         ...         ...         ...          ...         ...         ...      ...
         population)                                                                                                                                                              (pour 10 000)
         Nurses - Total (per 10 000                                                                                                                            Nombre d'infirmières - Total (pour
                                                          8          ...          7          ...         ...          ...         ...         ...      ...
         population)                                                                                                                                                                     10 000)
         Physicians - Total (per 10 000                                                                                                                        Nombre de médecins - Total (pour
                                                          2          ...          2          ...         ...          ...         ...         ...      ...
         population)                                                                                                                                                                   10 000)
         Public expenditure on Health (% of                                                                                                                  Dépenses publiques consacrées à la
                                                          9           9         11            5           9           ...         ...         ...      ...
         budget)                                                                                                                                                           santé (% du budget)


      African Statistical Yearbook 2011 / Annuaire Statistique pour l'Afrique 2011
Zimbabwe                                                                                                                                           Zimbabwe
                                                      II NATIONAL ACCOUNTS — COMPTES NATIONAUX

                                            2002     2003     2004     2005     2006          2007           2008      2009      2010

    Gross domestic product by kind of economic activity at current prices
                                                                                    Produit intérieur brut par branche d'activité économique aux prix courants


    Zimbabwe Dollar(Billions)                                                                                                       Dollar Zimbabween(Milliards)

    Agriculture                                 1        1        4       23      156           3 335    351 722 873     909        ...                           Agriculture

    Mining and quarrying                        0        0        5       35      239           3 547     99 667 704     288        ...                 Industries extractives

    Manufacturing                               1        2        8       47      283           1 249    103 044 119     856        ...           Industries manufacturières

    Electricity, gas & water                    0        0        2        7       27           1 777    113 993 074     286        ...                Electricité, gaz et eau

    Construction                                0        0        1        1       15            485      13 622 993      34        ...         Bâtiments et travaux publics
    Wholesale & retail trade,                                                                                                                Commerce de gros et de détail,
                                                1        2       13       47      169           1 711    384 243 165     639        ...
    restaurants, hotels                                                                                                                               restaurants et hôtels
                                                                                                                                              Banques, assurances, affaires
    Finance, insurance, real estate, etc.       0        2        4       13       42            308       2 405 787     344        ...
                                                                                                                                                              immobilières
    Transport and communications                1        2        6        8       21            761     154 988 919     886        ...      Transport(s) et communications
                                                                                                                                                 Administrations publiques et
    Public administration and defense           0        0        1        2        7            260      22 172 296     231        ...
                                                                                                                                                                     défense
    Other services                              0        1        4       12       37           2 220    207 053 386     600        ...                       Autres services
                                                                                                                                           Moins Services d’intermédiation
    Less Imputed Service Charges                0        0        0      - 1       - 1            - 9      - 991 961     - 22       ...
                                                                                                                                                                    financière
    Gross domestic product at factor                                                                                                    Produit intérieur brut aux couts des
                                                3       10       46      195      996          15 645   1451 922 357    5 050       ...
    cost / basic prices                                                                                                                               facteurs / prix de base

    Plus: Indirect Taxes / taxes on                                                                                                       Plus taxes indirectes/impôts sur les
                                                0        1        3       10       34            123            441      787        ...
    products, less subsidies                                                                                                                  produits, moins les subventions


    Expenditure on Gross domestic product at current purchaser's values
                                                                                                   Emploi du produit intérieur brut aux prix courants d'acquisition

    Zimbabwe Dollar(Billions)                                                                                                       Dollar Zimbabween(Milliards)
                                                                                                                                                   Consommation finale des
    Government final consumption                0        1        5        9       18            733       8 256 310     833        ...
                                                                                                                                                   administrations publiques

    Private final consumption                   3        9       43      191      999          14 144   1410 943 484    5 903       ...          Consommation finale privée

    Gross fixed capital formation               0        1        4       14       98            455      12 778 596     684        ...       Formation brute de capital fixe

    Increase in inventories                     0        0        0        0     - 17            710      19 944 688   - 575        ...                  Variation des stocks

    Exports of goods and services               0        0        9       48      364            182            193     1 651       ...     Exportations de biens et services

    Less imports of goods and services          0        0       13       58      432            456            472     3 333       ...
                                                                                                                                              Moins importations de biens et     341
                                                                                                                                                                    services
    GDP at purchasers' values                   4       11       49      205     1 030         15 768   1451 922 798    5 837       ...             PIB aux prix d'acquisition


    Gross domestic product by kind of economic activity at constant
                                                                                   Produit intérieur brut par branche d'activité economique aux prix constants
    prices
    Annual Growth Rates (%)                                                                                                        Taux de croissance annuel (%)
    Agriculture                                ...    -14.5     -9.1     -5.4     -4.0           -7.0          -35.8       ...      ...                           Agriculture

    Mining and quarrying                       ...    -30.9    22.9      1.3      -6.0           -3.0          -29.5       ...      ...                 Industries extractives

    Manufacturing                              ...    -13.4    -10.2     3.8      -2.8           -5.0          -12.3       ...      ...           Industries manufacturières

    Electricity, gas & water                   ...     1.5      8.2      -7.1     -4.2           -0.8           -8.7       ...      ...                Electricité, gaz et eau

    Construction                               ...    -10.4     -1.8     -2.4     -4.5           -3.0           -3.3       ...      ...         Bâtiments et travaux publics
    Wholesale & retail trade,                                                                                                                      Commerce de gros et de
                                               ...    -30.8    -20.0    -20.0     -2.0            2.5            8.7       ...      ...
    restaurants, hotels                                                                                                                          détail,restaurants et hôtels
                                                                                                                                               Banques, assurances, affaires
    Finance, insurance, real estate, etc.      ...     2.8      -2.4    -20.2     -6.9           -3.6          -27.1       ...      ...
                                                                                                                                                                immobilières
    Transport and communications               ...     -8.2     -1.3     1.0      -1.0           -2.0           11.4       ...      ...      Transport(s) et communications
                                                                                                                                                 Administrations publiques et
    Public administartion and defense          ...     1.9      5.9      5.9      -2.0           -4.0            0.0       ...      ...
                                                                                                                                                                     défense
    Other services                             ...     -1.8     -1.9     -1.6     -3.2           -4.0           -1.6       ...      ...                       Autres services
                                                                                                                                           Moins Services d’intérmediation
    Less Imputed Service Charges               ...    -52.0    -34.7    -34.2     -4.4           -2.0          -23.7       ...      ...
                                                                                                                                                                    financière
    Gross domestic product at factor                                                                                                    Produit intérieur brut aux couts des
                                                       -8.2     -4.2     -5.2     -3.6           -3.7          -11.3       ...      ...
    cost / basic prices                                                                                                                               facteurs / prix de base

    Plus: Indirect Taxes / taxes on                                                                                                       Plus taxes indirectes/impôts sur les
                                               ...     0.2      1.0      5.9      -3.8            0.0            0.0       ...      ...
    products, less subsidies                                                                                                                  produits, moins les subventions

    Gross domestic product at market                                                                                                        Produit intérieur brut aux prix du
                                               ...     -7.4     -3.6     -4.0     -3.6           -3.3           -9.9       ...      ...
    prices                                                                                                                                                            marché


2009 is in US$                                                                                                                     2009: Evaluée en dollars Américain


                                                                                         African Statistical Yearbook 2011 / Annuaire Statistique pour l'Afrique 2011
Zimbabwe                                                                                                                                                           Zimbabwe

         Expenditure on Gross domestic product at constant purchasers'
                                                                                                                   Emplois du produit intérieur brut aux prix constants d'acquisition
         values

         Annual Growth Rates (%)                                                                                                                     Taux de croissance annuel (%)
                                                                                                                                                                       Consommation finale des
         Government final consumption                   ...       -13.6       -3.3        2.2         2.2           2.2         -1.7      15.1        ...
                                                                                                                                                                       administrations publiques

         Private final consumption                      ...        17.4       -3.0      -15.2        -4.7          -4.9         -9.6      19.8        ...           Consommation finale privée

         Gross fixed capital formation                  ...        19.5       -9.6      -54.1       -29.4          -6.1         -3.4     119.0        ...        Formation brute de capital fixe

         Exports of goods and services                  ...      -344.9      42.7        -3.3         1.3          -7.1         -2.6      -9.2        ...      Exportations de biens et services

                                                                                                                                                                 Moins importations de biens et
         Less imports of goods and services             ...          ...        ...        ...         ...           ...          ...       ...       ...
                                                                                                                                                                                       services


                                                                                          III INFLATION

                                                   2002         2003       2004       2005        2006          2007         2008       2009      2010
         Annual Growth Rates (%)                                                                                                                     Taux de croissance annuel (%)
         All Item                                   233.2        1084.4    4879.7     16486.4    184101.1    12562581.0          ...       6.5       3.1                               Ensemble

         Food                                       235.1        1143.5    5369.0          ...   197259.1    14745627.0          ...        ...       ...                           Alimentation

         Health                                     214.1         774.7    4224.0     18150.7    595497.0    33011038.0          ...        ...       ...                                  Santé

         Energy                                         ...          ...        ...        ...         ...           ...         ...        ...       ...                                 Energie

         Transport                                  184.0         818.0    5127.1          ...   225313.0    24890041.0          ...        ...       ...                              Transport


                                                              IV AGRICULTURAL PRODUCTION - PRODUCTION AGRICOLE

                                                   2002         2003       2004       2005        2006          2007         2008       2009      2010
         Tons (Thousand)                                                                                                                                                  Tonnes (milliers)
         Maize, Tons (thousands)                      605         1 059     1 686        915        1 485         1 162          ...        ...    1 192                  Maïs, tonnes (milliers)

         Cotton lint, Tons (thousands)                194          159        364        196         208           224           ...        ...     115        Fibres de coton, tonnes (milliers)

         Tobacco, Tons (thousands)                    114           94         78         83          45            79           ...        ...       ...                Tabac, tonnes (milliers)

         Soya beans, Tons (thousands)                  84           41         86         57          70           112           ...        ...       ...      Graines de soja, tonnes (milliers)
                             ,
         Groundnuts in shells, Tons                                                                                                                                 Arachides en coques, tonnes
                                                                                                                                                                                   q   ,
                                                       56           87         64         58          83           125           ...        ...       ...
         (thousands)                                                                                                                                                                  (milliers)


                                                                  V MINING PRODUCTION - PRODUCTION MINIERE
342
                                                   2002         2003       2004       2005        2006          2007         2008       2009      2010


         Hard coal, metric tons (thousands)        3 938.0      3 029.0    3 797.7    2 890.7     2 107.1       2 107.0          ...        ...       ... Houilles, tonnes métriques (milliers)

         Asbetos, metric tons (thousands)           168.0         143.0      90.0          ...         ...           ...          ...       ...       ...            Asbestos, tonnes métriques
                                                                                                                                                                                       (milliers)
                                                                                                                                                              Minerais de fer, tonnes métriques
         Iron ores, mereic tons (thousands)         272.0         411.0     228.7       224.2       104.5         104.0          ...        ...       ...
                                                                                                                                                                                       (milliers)


                                                                                      VI ENERGY - ENERGIE

                                                   2002         2003       2004       2005        2006          2007         2008       2009      2010

         Electricity - total hydro production,                                                                                                               Électricité - production hydraulique
                                                   4 576.8      3 387.5    3 907.0    3 701.7     4 224.0       3 967.0          ...        ...       ...
         kilowatt hours (millions)                                                                                                                              totale, kilowatt-heures (millions)

         Electricity - total thermal production,                                                                                                               Électricité - production thermique
                                                   3 821.2      5 358.3    5 520.4    5 454.1     5 552.0       5 213.0          ...        ...       ...
         kilowatt hours (millions)                                                                                                                              totale, kilowatt-heures (millions)

         Electricity - total production, self-                                                                                                              Electricité - Production totale privée
                                                      189           53        292        216            0             0          ...        ...       ...
         producer (Million Kilowatt Hours)                                                                                                                            (million de kilowatt heures)

         Electricity - total production, public                                                                                                                    Electricité - Production totale
                                                    8 398         8 746     9 427       9 156       9 776         9 180          ...        ...       ...
         (Million Kilowatt Hours)                                                                                                                           publique (million de kilowatt heures)


      African Statistical Yearbook 2011 / Annuaire Statistique pour l'Afrique 2011
Zimbabwe                                                                                                                                                                    Zimbabwe
                                          VII TOURISM AND INFRASTRUCTURE - TOURISME ET INFRASTUCTURE

                                           2002         2003         2004         2005        2006             2007        2008        2009         2010

Arrivals - Tourists (thousands)               346         1118         1124         1031         1865             677          345        558            ...        Arrivées - touristes (milliers)

Rooms in hotels and similar                                                                                                                                 Chambres d'hotels et établissements
establishments (thousands)                      6            6            6            6            ...             ...          ...        ...           8                  assimilés (milliers)

Paved Road (% of total)                        19            ...          ...          ...          ...             ...          ...        ...          ...     Routes asphaltées (% du total)
Total Network (Railways-km)                     ...          ...          ...          ...          ...             ...          ...        ...          ...      Réseau total voies ferrées-Km
Main Telephone Lines (per 1,000                                                                                                                                 Lignes téléphoniques fixes (pour
                                               26           28           33           49           64              92            ...        ...          ...
inhabitants)                                                                                                                                                                     1000 habitants)
Mobile Cellular Subscribers (per                                                                                                                                Abonnés aux téléphones mobiles
                                               22           23           24           25           25              26            ...        ...          ...
1,000 inhabitants)                                                                                                                                                         (pour 1000 habitants)


                               VII FINANCIAL AND MONETARY STATISTICS - FINANCES ET STATISTIQUES MONETAIRES

                                           2002         2003         2004         2005        2006             2007        2008        2009         2010

VII-1 Monetary Statistics                                                                                                                                 VII-1 Statistiques monétaires
Zimbabwe Dollar(Billions)                                                                                                                                 Dollar Zimbabween(Milliards)
Money supply (M1)                             357        2 087        6 857       44 746      636 799      425 445 000           ...        ...          ...              Masse monétaire (M1)
Quasi-money                                   172          717        2 377       13 678      270 556      123 289 000           ...        ...          ...                      Quasi-monnaie
  of which Demand Deposit                       ...          ...          ...          ...          ...             ...          ...        ...          ...            dont Monnaie scripturale
Net foreign assets                           - 13        - 179       - 1 624      - 9 860     - 35 620       2 210 590           ...        ...          ...               Avoirs extérieurs nets
Domestic credit                               504        3 050       11 142       65 793      621 042      747 345 000           ...        ...          ...                      Crédit intérieur

of which claims on private sector             296        2 124        5 017       19 237      383 832      613 593 000           ...        ...          ...   dont créances sur le secteur privé

of which Claims on government                                                                                                                                         dont créances nettes sur le
                                              143          622        5 502       44 634      204 702      105 078 000           ...        ...          ...
sector, net                                                                                                                                                                        gouvernement
International reserves (millions of US                                                                                                                       Réserves internationales (millions de
                                               83            ...          ...          ...          ...             ...          ...        ...          ...
$)                                                                                                                                                                                           $ EU)
Average Exchange Rate (National                                                                                                                               Taux de change (moyen) (monnaie
                                              0.06         0.70         5.07       22.36       164.36         9 675.78           ...        ...          ...
Currency per us $)                                                                                                                                                          nationale par dollars)


VII-2 Public Finance                                                                                                                                            VII-2 Finances publiques
Zimbabwe Dollar(Billions)                                                                                                                                 Dollar Zimbabween(Milliards)
Total Revenues and Grants                1 113 384    1 551 086    2 110 591     941 572      520 435         201 596      133 000     972 975    2 014 754             Recettes totales et dons
  Tax Revenue                            1 039 231    1 489 195    2 024 105     908 504      503 652         192 788      128 000     880 688    1 873 983                      Recettes fiscales
  Non Tax Revenue                          71 596       55 039       80 489       33 069       16 783            8 808       5 000      51 000     140 771                  Recettes non fiscales
  Grants                                    2 557        6 852        5 997             0            0               0            0     41 288            0                                   Dons
                                                                                                                                                                                                      343
Total Expenditures and Net Lending       1 283 241    1 566 586    2 547 581    1 437 504     695 852         384 203      225 123     980 487    1 815 554       Dépenses totales et prêts nets

  Current expenditure                     789 012     1 038 325    1 307 921     755 398      279 226         118 594       51 729     603 911    1 036 800                  Dépenses courantes
  Of which Wages and Salaries             452 586      593 072      953 661      564 726      211 112          89 314       43 970     409 261     794 000        Dont rémunérations et salaires
  Capital expenditure                      92 051      120 973      318 148      115 130      121 109          69 564       14 291      45 204     252 671               Dépenses d'équipement
  Net Lending                              19 725       60 318       36 451       19 499        2 351            9 253       3 000       1 098       3 166                              Prêts nets
Fiscal Balance                           - 169 857     - 15 501    - 436 990    - 495 932    - 175 417       - 182 607     - 92 123    - 7 511     199 200       Solde global y compris les dons


VII-3 Balance of Payments                                                                                                                                  VII-3 Balance des paiements
US $(Millions)                                                                                                                                                               $ E.U(Millions)
Trade balance                                - 34        - 123        - 325        - 411        - 475           - 294        - 972     - 1 622      - 1 654                Balance commerciale
Services Balance                            - 204        - 216        - 108        - 175        - 121           - 143        - 207        - 32        - 59                  Balance des services
Net Income                                  - 246        - 191        - 208        - 197        - 209           - 245        - 224       - 200       - 192                          Revenus nets
Current transfers, net total                  228          169          204          163          439             440          625        926          636                   Transferts courants
Current account balance                     - 256        - 361        - 437        - 620        - 365           - 243        - 779       - 928      - 1 268            Solde du compte courant


VII-4 External Debt and Financial Flows                                                                                                      VII-4 Dette extérieure et flux financiers
US $(Millions)                                                                                                                                                               $ E.U(Millions)
Total external debt                         4 232        4 511        4 566        4 388        4 898            5 283       5 793       6 853       7 453                Dette extérieure totale
  Private                                   1 780        2 220        2 467        2 661        3 279            3 773       4 445       5 683       6 487                                  Privée
  Public                                    2 451        2 291        2 099        1 727        1 619            1 510       1 349       1 171         966                                Publique
Total external debt service                   495          424          353          348          352             343          414        319          335         Service de la dette extérieure
Net Foreign Direct Investment                                                                                                                                    Investissements étranger direct
                                               26             4            9         103           40              69           52         60            ...
Inflows                                                                                                                                                                      (flux nets entrants)
Net Total Official Development                                                                                                                                  Aide publique au développement
                                              199          187          187          373          278             479          612        737            ...
assistance                                                                                                                                                                          (nette totale)


                                                                                                          African Statistical Yearbook 2011 / Annuaire Statistique pour l'Afrique 2011
Zimbabwe                                                                                                                                        Zimbabwe

                                             2002     2003     2004      2005        2006       2007       2008       2009       2010

         US $(Millions)                                                                                                                             Dollar Zimbabween
         Exports, fob                                                                                                                                  Exportations, fàb


         Exports - Total                     2 108    1 794     1 662      1 671      1 588      1 721          ...        ...      ...                   Exportations - Total


         Main Products                                                                                                                                 Principaux produits


         Ferro-chromium containing by                                                                                                       Ferro-chrome contenant en poids
                                               103      116       166       201         188        203         47         31       195
         weight more than 4% of carbon                                                                                                                plus de 4% de carbone


         Tobacco, unmanufactured, stemmed
                                               550      485       363       256         212        266        100        242       420     Tabac, artisanal, filtre, ou emballe
         or stripped


         Nickel mattes                          ...       0        ...        ...       169        211        149        252       441                        Mattes de nickel


                                                                                                                                                   Minerais de nickel et leurs
         Nickel ores and concentrates          54       132       181       221         172        224        234          ...      ...
                                                                                                                                                                  concentrés


         Nickel unwrought, not alloyed         77       137       158       227         339        537         33         15       14                 Nickel brut, sans alliage

         Main Destinations                                                                                                                        Principales destinations

         South Africa                        202.3    347.8     430.1      488.3      686.2      854.2      759.3      188.0        ...                        Afrique du Sud


         China                               159.6    167.1     141.2      157.9      139.1      142.8      148.2      140.8        ...                                  Chine


         Japan                               125.4    140.9     124.0      134.4      131.1      225.6      118.2       45.1        ...                                 Japon


         Zambia                               97.1    202.7     124.5      110.1      175.7      111.7      107.1       56.9        ...                                Zambie


         Germany                             142.2    146.4     119.5      109.2      143.2      139.0       92.3       44.2        ...                             Allemagne


                                             2002     2003     2004      2005        2006       2007       2008       2009       2010
         Imports, cif                                                                                                                                  Importations, cif


344      Imports - Total                        ...      ...       ...        ...         ...        ...        ...        ...      ...        Importations - Total (millions)


                                                                                                                                                       Principaux produits
         Main Products


         Maize, nes                            49       64         38       135          74        127        337         54        ...                             Maïs, nda


         Petroleum oils&oils obtained from
                                                                                                                                               Huiles de pétrole, bitumineux,
         bituminous minerals,o/than crude      37       100       203       165         189        186        306        196        ...
                                                                                                                                                           distilles, sauf brut
         etc

         Nickel mattes                           0        0        ...        ...          0       270        164         95        ...                       Mattes de nickel

         Diesel powered trucks with a GVW                                                                                                 Diesel chariots de manutention d'un
                                               26       25         17        25          40         56         71         51        ...
         not exceeding five tonnes                                                                                                           PTAC n'excédant pas cinq tonnes


         Electrical energy                     39       24         19        39          66         68         53         53        ...                     Énergie électrique


         Main Origin                                                                                                                              Principales provenances

         South Africa                        692.4    858.6     929.1    1 161.5     1 065.2    1 194.8    1 689.0    1 608.0       ...                        Afrique du Sud

         Botswana                             73.6     94.7     130.1      184.1      253.5      370.3      219.4      154.3        ...                             Botswana

         China                                32.2     30.3     113.1      125.4      136.3      203.3      133.1      156.3        ...                                  Chine

         Swaziland                             0.3    117.9       0.1        0.6      369.0         0.0        0.0        0.0       ...                             Swaziland

         United States                        49.3     41.7      47.3       44.7       47.6      105.2       92.9       85.5        ...                             États-Unis


      African Statistical Yearbook 2011 / Annuaire Statistique pour l'Afrique 2011
Better Statistics for Better Development Outcomes
                          De meilleures statistiques pour un développement plus performant


        ELOPME                                                                     ELOPME
    D EV       NT                            INE DE DÉVE                       D EV       NT
N                                     I   CA             LO                N
                    F
                                   FR                                   CA                      F
                    UN


                                                                                                UN
                                                          PP


                                                                     I
                             A


                                                                    R
                                                                 AF
                            E


                                                             E
                      D


                                                                                                  D
                           BANQU


                                                              ME
                                                                NT
                    NT


                                                                                                NT
                                                                 FO
                  ME


                                                                                              ME
                                                                   ND
                PE


                                                                                            PE


                     P                                                  AF
                LO                                                                              OP
                                                                     S


R IC                                                                       R   ICA         EL
    AIN DE DÉVE                                                                   IN DE DÉV


                             African Development Bank Group                                           African Union             Economic Commission for Africa
                             Groupe de la Banque africaine de développement                           Union Africaine           Comission Economique pour l’Afrique
                             Temporary Relocation Agency (TRA)                                        P.O. Box 3243             P.O. Box 3001
                             Agence Temporaire de Relocalisation (ATR)                                Roosvelt Street           Addis Ababa
                             13 Avenue du Ghana                                                       (Old Airport Area)        Ethiopia
                             BP 323, 1002 Tunis Belvédère                                             W21K19 Addis Ababa        Tel: +251 11 551 7200
                             Tunis, Tunisia / Tunisie                                                 Ethiopia                  Fax: +251 11 551 0365
                             Tel : (216) 71 103 325                                                   Tel: (251) 11 551 77 00   Email: ecainfo@uneca.org
                             Fax : (216) 71 103 743                                                   Fax:(251) 11 551 78 44    www.uneca.org
                             Email : Statistics@afdb.org                                              www.au.int
                             www.afdb.org

African Statistical Yearbook

  • 1.
  • 2.
    African Statistical Yearbook AnnuaireStatistique pour l’Afrique 2011
  • 3.
    Designations employed inthis publication do not imply the expression of any opinion on the part of the African Development Bank Group (AfDB), the African Union Commission (AUC) and the United Nations Economic Com- mission for Africa (UNECA) concerning the legal status of any country or territory, or the delimitation of its frontiers. While every effort has been made to present reliable information, the three institutions accept no responsibility whatsoever for any consequences of its use. African Development Bank Group African union Economic Commission for Africa Temporary Relocation Agency (TRA) P.O. Box 3243 P.O. Box 3001 13 Avenue du Ghana BP 323, 1002 Tunis Roosvelt Street (Old Airport Area) Addis Ababa Ethiopia Belvédère Tunis, Tunisia W21K19 Addis Ababa Ethiopia Tel: +251 11 551 7200 Tel : (216) 71 103 325 Tel: (251) 11 551 77 00 Fax: +251 11 551 0365 Fax : (216) 71 103 743 Fax:(251) 11 551 78 44 Email: ecainfo@uneca.org Email : Statistics@afdb.org www.au.int www.uneca.org www.afdb.org Les dénominations employées dans cette publication n’impliquent, de la part de la Banque africaine de déve- loppement (BAD), la Commission de l’Union africaine (CUA) et la Commission économique pour l’Afrique des Nations Unies (UNECA) aucune prise de position sur le statut juridique ou le tracé des frontières des pays. Tout en s’étant efforcées de présenter des informations aussi fiables que possible, les trois institutions déclinent toute responsabilité quant à l’usage qui pourrait être fait de ces données. 2 Groupe de la Banque africaine Union Africaine Commission économique pour de développement P.O. Box 3243 l’Afrique Agence Temporaire de Relocalisation (ATR) Roosvelt Street (Old Airport Area) P.O. Box 3001 Addis Abeba 13 Avenue du Ghana BP 323, 1002 Tunis W21K19 Addis Abeba Ethiopie Belvédère Tunis, Tunisie Ethiopie Tel: +251 11 551 7200 Tel : (216) 71 103 325 Tel: (251) 11 551 77 00 Fax:+251 11 551 0365 Fax : (216) 71 103 743 Fax:(251) 11 551 78 44 Email: ecainfo@uneca.org Email : Statistics@afdb.org www.au.int www.uneca.org www.afdb.org Design/layout by Phoenix Design Aid Printing by Scanprint, Denmark ISO 14001 certified and EMAS-approved. ISSN 1561-2805 African Statistical Yearbook 2011 / Annuaire Statistique pour l'Afrique 2011
  • 4.
    2011 Acknowledgments Remerciements T he 2011 African Statistical Yearbook was prepared under the overall umbrella of the African Statistical Coordination Committee set up by major continental or- L ’annuaire statistique pour l’Afrique 2011 a été élaboré sous l’égide du Comité africain de coordination de la statistique adopté par les principales organisations du ganizations dealing with statistical development namely continent en charge du développement de la statistique, the African Development Bank (AfDB), the African Capac- à savoir, la Banque africaine de développement (BAD), ity Building Foundation (ACBF), the African Union Commis- la Fondation africaine de renforcement des capacités sion (AUC), and the United Na tions Economic Commission (ACBF), la Commission de l’Union africaine (CUA), et la for Africa (UNECA) in the framework of the implementa- Commission économique pour l’Afrique des Nations Unies tion of the Reference Regional Strategic Framework for (UNECA) dans le cadre de la mise en œuvre du Cadre Statistical Capacity Building in Africa (RRSF). stratégique régional de référence pour le renforcement des capacités statistiques en Afrique (CSRR). It was prepared under the overall guidance of Dr. Dimitri Sanga, Director of the African Centre for Statistics (ACS) Il a été conçu sous la direction générale du Dr. Dimitri of the UNECA, Dr. Charles Lufumpa, Director of the Statis- Sanga, Directeur du Centre africain pour les statistiques tics Department of the AfDB, Dr. Kouassi Réné Nguettia, (CAS) de l’UNECA, de Dr. Charles Lufumpa, Directeur du Director of Economic affairs (AUC) and the leadership of Département des statistiques de la BAD, de Dr. Kouassi Mr. Kokil Beejaye, Division Manager at the AfDB, Mr. Yeo René Nguettia, Directeur des affaires économiques de Dossina, Acting Head of Statistics Division at AUC and Dr. la CUA et sous la conduite de M. Kokil Beejaye, Chef de Chukwudozie Ezigbalike, Data Management Coordinator Division à la BAD, M. Yeo Dossina, Chef par Interim de la Di- at ACS. vision Statistique à la CUA et Dr. Chukwudozie Ezigbalike, Cordonnateur et gestionnaire des données au CAS. The joint AfDB-AUC-UNECA Technical Team comprised Mr. Maurice Mubila, Mr. Kouakou Louis, Mr. Letsara Nirina, Mr. L’équipe technique conjointe BAD, CUA, UNECA a été Christophe Baradandikanya, Ms. Amel Feidi, Mr. Kadisha composée de M. Maurice Mubila, M. Louis Kouakou, M. Mbiya Hilaire from the AfDB; Mr. Gerard Osbert, Mr. Raj Nirina Letsara, M. Christophe Baradandikanya, Mme Amel Mitra, Ms. Fatouma Sissoko, Mr. Andry Andriantseheno, Feidi, M. Kadisha Mbiya Hilaire pour la BAD, M. Gerard Mr. Oumar Sarr, Mr. Molla Hunegnaw, Mr. Negussie Gorfe, Osbert, M. Raj Mitra, Mme. Fatouma Sissoko, M. Andry Mr. Steve Gui-Diby, Mr. Gulilat Tesfaye, Mr. Tesfaye Belay, Andriantseheno, M. Oumar Sarr, M. Molla Hunegnaw, M. 3 Mr. Michael Girma, Mr. Kidus Mengistu, Mr. Elias Fisseha Negussie Gorfe, M. Steve Gui-Diby, , M. Gulilat Tesfaye, M. from the ACS; and Mr. Jose Awong, from the AUC. Tesfaye Belay, M. Kidus Mengistu, M. Michael Girma, M. Elias Fisseha, pour le CAS et M. Jose Awong pour la CUA. The following National Data Correspondents (NDC) pro- vided useful data for their respective country: Burkina Les corresponants Nationaux en Donnees (CND) suivants Faso: Aboudrahyme Savadogo; Chad: Mbaiogoum Tinro ont fourni des donnees pour leur pays : Burkina Faso : Raoul; Congo: Gilbert Foumou; Burundi: Nizigiyimana Vé- Aboudrahyme Savadogo ; Burundi : Nizigiyimana Véné- nérand; Cameroun: Jazet Kengap Eric; Central African rand ; Cameroun : Jazet Kengap Eric ; Comores : Anfaita Republic: Bayo Christophe; Comoros: Anfaita Achirafi; Achirafi  ; Congo : Gilbert Foumou ; Côte d’Ivoire : Lig- Cote d’Ivoire: Ligbet Magloire; Democratic Republic bet Magloire ; Gabon : Ondo Metoo Symolin ; Gambie : of Congo: Kankwanda Ebulelang Grégoire; Gabon: Ondo Ousman Dibba ; Guinée : Balde Saikou Ahmed Tidiane ; Metoo Symolin; Gambia: Ousman Dibba; Guinea: Balde Kenya : Pamela Audi ; Lesotho : Molato Celina Malehloa ; Saikou Ahmed Tidiane; Kenya: Pamela Audi; Lesotho: Madagascar : Randriambolamanitra Samue ; Malawi : Molato Celina Malehloa; Malawi: Willie Asayilekachaka; Willie Asayilekachaka  ; Mali  : Dembele Diakaridia  ; Mali: Dembele Diakaridia; Mauritania: Sow Ali Ousman; Maroc : Zerrou Abdelilah ; Maurice : Li Fa Cheung Kai Mauritius: Li Fa Cheung Kai Suet; Mozambique: Saide Suet  ; Mauritanie  : Sow Ali Ousman  ; Mozambique  : Dada; Niger: Manou Anaroua; Nigeria: Ichedi Sunday Saide Dada ; Niger : Manou Anaroua ; Nigeria : Ichedi Joel; Sao Tome & Principe: Adelino de Freitas; Senegal: Sunday Joel ; République Démocratique du Congo : Mbaye Maganou; Sierra Leone: Abubakarr Turay; Sudan: Kankwanda Ebulelang Grégoire ; République centrafri- Elalim Abdel Ghani Mohamed; Swaziland: Hanson Sibo- caine: Bayo Chistophe ; Sao Tome & Principe : Adelino niso Dlamin; Tanzania: Gregory Luxford Elias; Uganda: de Freitas ; Sénégal :Mbaye Maganou ; Sierra Leone : Musoke John; Zambia: Tembo Joseph; Zimbabwe: Mak- Abubakarr Turay ; Soudan : Elalim Abdel Ghani  Moha- ware Godfrey. med ; Swaziland : Hanson Siboniso Dlamin ; Tanzanie : Gregory Luxford Elias ; Tchad : Mbaiogoum Tinro Raoul ; Ouganda : Musoke John ; Zambie : Tembo Joseph ; Zim- babwe :Makware Godfrey. African Statistical Yearbook 2011 / Annuaire Statistique pour l'Afrique 2011
  • 5.
    4 2011 Contents Table des matières African Statistical Yearbook 2011 / Annuaire Statistique pour l'Afrique 2011
  • 6.
    2011 Contents Table des matières Foreword .................................................................................................................................................. 9 Préface Introduction .............................................................................................................................................. 13 Abbreviations and Acronyms .................................................................................................................. 15 Abréviations et acronymes General Notes ........................................................................................................................................... 17 Notes Générales SECTION I SUMMARY TABLES TABLEAUX I TABLEAUX RESUMES 1 Social and Demographic Indicators ............................................................................................. 33 Indicateurs démographiques et sociaux 1-1 Total Mid-Year Population ........................................................................................................ 34 Population totale au milieu de l’année 1-2 Female Population (as % of Total) ............................................................................................. 35 Population féminine (% de la population totale) 1-3 Economically Active Population............................................................................................... 36 Population active 1-4 Adult Illiteracy Rate .................................................................................................................. 37 Taux d’analphabétisme des adultes 1-5 Gross Enrolment Ratio in Primary Education........................................................................... 38 5 Taux brut de scolarisation au primaire 1-6 Gross Enrolment Ratio in Secondary Education ...................................................................... 39 Taux brut de scolarisation au secondaire 1-7 Pupil/Teacher Ratios ................................................................................................................. 40 Ratios élèves enseignants 1-8 Primary Health Care ................................................................................................................. 41 Soins de santé primaire 2 Economic Statistics........................................................................................................................ 43 Statistiques économiques 2.1 GDP at Current market prices .................................................................................................. 46 PIB aux prix courant du marché 2.2 Real GDP Growth Rate .............................................................................................................. 47 Taux de croissance réelle du PIB 2.3 Per Capita GDP .......................................................................................................................... 48 PIB par habitant 2.4 Structure of Output .................................................................................................................. 49 Structure du PIB 2.5 Structure of Demand ................................................................................................................ 50 Structure de la demande African Statistical Yearbook 2011 / Annuaire Statistique pour l'Afrique 2011
  • 7.
    2.6 Consumer Prices....................................................................................................................... 51 Prix à la consommation 2.7 Agricultural and Food Production Index ................................................................................. 52 Indice de la production agricole et alimentaire 2.8 Industrial, Mining and Manufacturing Production Index ........................................................ 53 Indice de la production industrielle, minière et manufacturière 2.9 Electricity Production by Type ................................................................................................. 54 Production d’électricité par catégorie 3 Monetary and Financial Statistics ............................................................................................... 57 Statistiques monétaires et financières 3.1 Broad Money Supply (M2) ........................................................................................................ 59 Masse monétaire (M2) 3.2 Exchange Rate Indices .............................................................................................................. 60 Indice des taux de change 3.3 Public Finances ......................................................................................................................... 61 Finances Publiques 3.4 External Debt ............................................................................................................................ 62 Dette extérieure 3.5 Balance of Payments ................................................................................................................ 63 Balance des paiements 6 3.6 Financial Flows .......................................................................................................................... 64 Flux financiers 3.7 Intra-African Trade by Economic Groupings in 2009............................................................... 65 Commerce intra-africain par zones économiques en 2009 4 Economic Infrastructure and Investment Climate Infrastructures économiques et climat des affaires 4.1 Tourism and Infrastructure ...................................................................................................... 67 Tourisme et infrastructure 4.2 Doing Business in 2010 ............................................................................................................. 68 Climat des affaires en 2010 5 Millennium Development Goals ................................................................................................... 71 Objectifs du millénaire pour le développement SECTION II COUNTRY TABLES TABLEAUX PAR PAYS 1. Algeria - Algérie ............................................................................................................................... 80 2. Angola .............................................................................................................................................. 85 3. Benin - Bénin .................................................................................................................................... 90 4. Botswana ......................................................................................................................................... 95 5. Burkina Faso .................................................................................................................................... 100 6. Burundi ............................................................................................................................................ 105 African Statistical Yearbook 2011 / Annuaire Statistique pour l'Afrique 2011
  • 8.
    2010 Contents Table des matières 7. Cameroon - Cameroun .................................................................................................................... 110 8. Cape Verde - Cap Vert ..................................................................................................................... 115 9. Central African Rep. - Rép. Centrafricaine ...................................................................................... 120 10. Chad - Tchad..................................................................................................................................... 125 11. Comoros - Comores ......................................................................................................................... 130 12. Congo ............................................................................................................................................... 135 13. Congo, Dem. Rep. - Congo, Rép. Dém. ............................................................................................ 140 14. Côte d’Ivoire .................................................................................................................................... 145 15. Djibouti............................................................................................................................................. 150 16. Egypt - Egypte.................................................................................................................................. 155 17. Equatorial Guinea - Guinée Equatoriale .......................................................................................... 160 18. Eritrea - Erythrée ............................................................................................................................. 165 19. Ethiopia - Ethiopie ............................................................................................................................ 170 20. Gabon ............................................................................................................................................... 175 21. Gambia - Gambie .............................................................................................................................. 180 22. Ghana ............................................................................................................................................... 185 23. Guinea - Guinée ................................................................................................................................ 190 24. Guinea Bissau - Guinée Bissau......................................................................................................... 195 25. Kenya................................................................................................................................................ 200 26. Lesotho ............................................................................................................................................ 205 27. Liberia - Libéria ................................................................................................................................ 210 28. Libyan Arab Jamahiriya – Jamahiriya Arabe Libyenne ................................................................... 215 29. Madagascar ..................................................................................................................................... 220 30. Malawi .............................................................................................................................................. 225 31. Mali ................................................................................................................................................... 230 32. Mauritania - Mauritanie ................................................................................................................... 235 7 33. Mauritius - Maurice.......................................................................................................................... 240 34. Morocco - Maroc.............................................................................................................................. 245 35. Mozambique .................................................................................................................................... 250 36. Namibia - Namibie............................................................................................................................ 255 37. Niger................................................................................................................................................. 260 38 Nigeria - Nigéria ............................................................................................................................... 265 39. Rwanda ............................................................................................................................................ 270 40. Sao Tome & Principe ........................................................................................................................ 275 41. Senegal - Sénégal ............................................................................................................................ 280 42. Seychelles ........................................................................................................................................ 285 43. Sierra Leone ..................................................................................................................................... 290 44. Somalia - Somalie............................................................................................................................. 295 45. South Africa - Afrique du Sud.......................................................................................................... 300 46. Sudan - Soudan ................................................................................................................................ 305 47. Swaziland ......................................................................................................................................... 310 48. Tanzania – Tanzanie ......................................................................................................................... 315 49. Togo.................................................................................................................................................. 320 50. Tunisia - Tunisie ................................................................................................................................ 325 51. Uganda - Ouganda ........................................................................................................................... 330 52. Zambia - Zambie............................................................................................................................... 335 53. Zimbabwe ........................................................................................................................................ 340 African Statistical Yearbook 2011 / Annuaire Statistique pour l'Afrique 2011
  • 9.
    8 2011 Foreword Avant-propos African Statistical Yearbook 2011 / Annuaire Statistique pour l'Afrique 2011
  • 10.
    2011 Foreword Avant-propos T he coordination between the African Development Bank (AfDB), the African Union Commission (AUC), and the United Nations Economic Commission for Africa L e partenariat dans le domaine de la statistique continue de se poursuivre entre la Banque africaine de développement (BAD), la Commission économique (ECA) in the field of statistics continues. The joint produc- pour l’Afrique (CEA) et la Commission de l’Union africaine tion of the annual African Statistical Yearbook (ASYB) is (CUA). L’Annuaire statistique pour l’Afrique (ASA), qui a testimony of the ever-stronger partnerships between est une production conjointe de ces trois organisations the three pan-African organizations. The joint produc- panafricaines est un témoignage de ce partenariat sans tion through a pan-African mechanism gives the ASYB a cesse grandissant. Cette production conjointe, réalisée continental seal of approval. Working together, we check à travers un mécanisme panafricain, confère à l’ASA, un and validate the data to improve the quality and reduce sceau marquant son caractère continental approuvé. potential inconsistencies that would have resulted from En travaillant conjointement, les partenaires ont vérifié separate go-it-alone products. et validé les données afin d’améliorer leur qualité et de réduire les incohérences éventuelles qui auraient résulté de la production de publications séparées. As with the previous two editions, this third edition A l’instar des deux précédentes éditions, cette troisième presents time series showing how African Countries édition présente des séries temporelles montrant dans performed on several economic and social thematic areas quelles mesures les pays africains ont progressé dans over the 2002 to 2010 period. We have continued our ef- divers domaines socioéconomiques au cours de la forts to privilege the use of data sourced from countries période 2002 à 2010. Un effort continu a été fourni pour national sources, validated through a rigorous process. utiliser dans la mesure du possible les sources de don- nées provenant des systèmes statistiques nationaux et validées à travers une procédure rigoureuse. Invariably, there are some data sets that have to be Invariablement, une partie des données a été recueillie sourced from international organization that have been auprès de sources internationales qui se sont spéciali- 9 designated to compile comparable statistics on specific sées dans la compilation des données statistiques com- themes for the whole world, including Africa. Still it is parables sur des thèmes spécifiques pour l’ensemble important that such series are confirmed by the countries des pays du monde, incluant l’Afrique. Il n’en demeure so that any variations resulting, for instance from meth- pas moins que de telles séries de données aient été odological differences, are reconciled before compiling confirmées par les pays afin que tout écart résultant par the final figures in the ASYB. We have therefore continued exemple des différences méthodologiques soit réconcilié to emphasize the importance of involving our member et réajusté dans l’ASA. C’est pour cette raison que les States in the validation process. This year, we were able partenaires ont mis l’accent sur l’importance d’associer to get 32 countries represented at the validation meeting leurs pays membres au processus de validation de ces of experts, compared to 18 last year. données. Cette année, 32 pays étaient représentés à la réunion d’expert de validation des données, comparati- vement à 18 pays l’année dernière. One of the values of producing the ASYB is the bringing Une des valeurs ajoutées obtenues par la production de together, in one volume, of data on African countries. l’ASA est la mise à disposition, en un seul volume, des It however goes more than just compiling them in one données sur les pays africains. Bien entendu, son intérêt volume as new information products are generated that va bien au delà d’une simple compilation des données would otherwise not be available. For example, bringing dans un seul volume car il présente des informations the trade figures declared by African countries allows us nouvelles qui n’auraient pas été disponibles autrement. to compute volume of trade between and within several A titre d’exemple, il présente des données commerciales regional economic communities (RECs). We are therefore déclarées par les pays africains permettant de calculer able to compare the performance of the RECs with re- des volumes du commerce entre et au sein des com- spect to intra- and inter-REC trade. These reported trade munautés économiques régionales (CER). Ce qui rend figures show that in 2009, 12% of cumulative exports from possible la comparaison des performances des CER au African countries go to other African countries. Econo- regard des commerces intra et inter-CER. Ces données mists, researchers, African leaders and other decision commerciales montrent qu’en 2009, 12% des exportations African Statistical Yearbook 2011 / Annuaire Statistique pour l'Afrique 2011
  • 11.
    2011 Foreword Avant-propos makers can interpret these figures to ascertain both the totales africaines sont réalisées avec d’autres pays afri- level of progress made in intra-African trade, and which cains. Economistes, chercheurs, dirigeants et décideurs RECs need more attention to improve the local and overall africains peuvent interpréter ces données à la fois comme situation. un progrès en matière de commerce intra-africain et un défi pour les CER pour améliorer leur situation localement et globalement. We are therefore committed to continue producing, Les trois institutions sont donc résolues à poursuivre la jointly, the ASYB on an annual basis. And bearing in mind production conjointe de l’Annuaire statistique sur une that the original collection of the statistics takes place at base annuelle. Prenant en considération le fait que la the national level, we shall continue in our efforts, again collecte originelle des données statistiques se fait au jointly, to reinforce the capacities of the national struc- niveau national, nous poursuivrons nos efforts conjoints tures to produce quality and credible statistics, first for de renforcer les capacités des structures nationales à their development needs, and then to feed into appropri- produire des statistiques crédibles et de qualité, d’abord ate continental and global databases and repositories. pour leurs propres besoins de développement et enfin en vue d’alimenter une base de données régionale, appro- priée et de référence. 10 Dr. Charles Leyeka Lufumpa Dr. René N’Guettia Kouassi Dr. Dimitri Sanga Director Director Director Statistics Department  Economic Affairs African Centre for Statistics African Development Bank African Union Commission United Nations Economic Commission for Africa African Statistical Yearbook 2011 / Annuaire Statistique pour l'Afrique 2011
  • 12.
    2011 Introduction T he Yearbook series, is a result of joint efforts by major African regional organizations to set up a joint data collection mechanism of socioeconomic data on African L ’annuaire publication de la série, est le résultat des efforts conjoints des principales organisations régionales africaines pour disposer d’un mécanisme countries as well as the development of a common har- commun de collecte des données socio-économiques monized database. The Joint African Statistical Yearbook et d’une base de données commune et harmonisée sur is meant to break with the practices of the past where les pays africains. L’annuaire statistique commun marque each regional/sub-regional organization was publishing le début d’une rupture avec les pratiques du passé où statistical data on African countries of the continent chaque organisation régionale/sous-régionale éditait in an inefficient way, leading to duplication of efforts, des données statistiques sur les pays africains d’une inefficient use of scarce resources, increased burden on manière inefficace. En effet, ces anciennes pratiques countries and sending different signals to users involved conduisaient à la duplication des efforts, à une mauvaise in tracking development efforts on the continent. It is utilisation des ressources rares et à l’accroissement des expected that the joint collection and sharing of data fardeaux sur les pays. En même temps, elles envoyaient between regional institutions will promote wider use des messages disparates aux utilisateurs impliqués dans of country data, reduce costs and significantly improve les efforts de suivi du développement du continent. On the quality of the data and lead to better monitoring of s’attend à ce que la collecte et le partage communs des development initiatives on the continent. données entre les institutions régionales favorisent une utilisation plus large des données des pays, réduisent leurs coûts d’accès, améliorent de manière significative leur qualité et conduiront à un meilleur suivi des initiatives de développement du continent. The data in this issue of the Yearbook are arranged gener- Le présent annuaire présente généralement les don- ally for the years 2002 to 2010 or for the last eight years nées sur la période allant de 2002 à 2010 ou sur les huit for which data are available. dernières années pour lesquelles des données sont disponibles. L’annuaire est édité en un volume composé 11 de deux parties : un ensemble de tableaux synoptiques et un ensemble de profils-pays. The Yearbook is published in one volume consisting of Chaque tableau synoptique affiche les données pour two parts: a set of summary tables followed by country un secteur déterminé. Chaque secteur regroupe des profiles. The summary tables are presented by selected indicateurs couverts par tous les pays africains et facilite sectors. Each table presents indicators for all African la comparaison entre eux. Neuf principaux secteurs ont countries for comparison purposes. The indicators are été sélectionnés. grouped in nine main sectors. African Statistical Yearbook 2011 / Annuaire Statistique pour l'Afrique 2011
  • 13.
    12 2011 Abbreviations and Acronyms Abréviations et acronymes African Statistical Yearbook 2011 / Annuaire Statistique pour l'Afrique 2011
  • 14.
    2011 Abbreviations and Acronyms Abréviations et acronymes ACBF African Capacity Building Foundation / Fondation pour le renforcement des capacités en Afrique AEO/PEA African Economic Outlook/Perspectives de l'économie africaine AfDB/BAD African Development Bank / Banque africaine de développement ACS/CAS African Centre for Statistics / Centre africain pour la statistique AUC/CUA African Union Commission / Commission de l’Union africaine CPC/CCP Central Product Classification / Classification centrale des produits des Nations Unies CPI/IPC Consumer Price Index / Indice des prix à la consommation COMTRADE United Nations Commodity Trade Statistics Database / Base de données des statistiques du commerce des Nations Unies ECA/CEA Economic Commission for Africa / Commission économique pour l’Afrique FAO Food and Agriculture Organization / Organisation des Nations Unies pour l’alimentation et l’agriculture F.O.B/F.À.B Free On Board / Franco à bord ILO/BIT International Labor Organization / Bureau international du travail IMF/FMI International Monetary Fund / Fonds monétaire international ISIC/CITI International Standard Industrial Classification / Classification internationale type par industrie ITU/UIT International Telecommunication Union / Union internationale des télécommunications M1 Broad Money / Masse monétaire MDG/OMD Millennium Development Goals / Objectifs du millénaire pour le développement NEPAD New Partnership for Africa’s Development / Nouveau partenariat pour le développement de l’Afrique ODA/APD Official Development Assistance / Aide publique au développement OECD/OCDE Organization for Economic Co-operation and Development / Organisation de coopération et de développement économique 13 PRS/SRP Poverty Reduction strategy / Stratégie de réduction de la pauvreté RRSF/CSRR Regional Reference Strategic Framework / Cadre stratégique régional de référence SDR/DTS Special Drawing Rights / Droits de tirage spéciaux SNA/SCN System of National Accounts / Système de comptabilité nationale UN/ONU United Nations / Organisation des Nations Unies UNCTAD/CNUCED United Nations Conference on Trade and Development / Conférence des Nations Unies sur le commerce et le développement UNDATA United Nations Statistical Databases / Bases des données statistiques des Nations Unies UNESCO United Nations Educational, Scientific and Cultural Organization / Organisation des Nations Unies pour l’éducation, la science et la culture US/EU United States / Etats-Unis d’Amérique WTO/OMC World Trade Organization / Organisation mondiale du commerce African Statistical Yearbook 2011 / Annuaire Statistique pour l'Afrique 2011
  • 15.
    14 2011 General notes Notes générales African Statistical Yearbook 2011 / Annuaire Statistique pour l'Afrique 2011
  • 16.
    2011 General notes Notes générales T he statistics presented in the Yearbook are, as far as possible in accordance with international recom- mendations and definitions. Where important deviations L es statistiques présentées dans cet Annuaire sont, autant que possible, conformes aux recommanda- tions et définitions internationales. Lorsque des diver- are known to exist, they are indicated in footnotes at the gences importantes sont connues, elles ont été indiquées end of each country’s table. Owing to the rounding of fig- dans les notes figurant à la fin du tableau de chaque ures, the totals shown in tables do not always correspond pays concerné. A cause des chiffres arrondis, les totaux exactly to the sum of their component items. indiqués dans certains tableaux ne correspondent pas toujours exactement à la somme de leurs composantes. I. SOCIAL AND DEMOGRAPHIC I. INDICATEURS SOCIO- INDICATORS DEMOGRAPHIQUES Population Population D ata presented in this section, are derived mainly from the following publications: «World Population Prospects, estimates and projections of the UN Secretar- L es données présentées dans cette section sont tirées principalement des publications: «Perspec- tives d’avenir de la population mondiale, estimations et iat Population Division”, “World Urbanisation Prospects” projections», «Perspectives d’Urbanisation Mondiale» and «Labour Force Estimates and Projections, 1980-2020» de la Division de la Population du Secrétariat de l’ONU, prepared by the International Labour Organisation (ILO). «Estimations et Projections de la Main d’Oeuvre, 1980- National sources have been used to supplement missing 2020» du Bureau International du Travail (BIT). Les sources data when comparable with the UN series. nationales ont été utilisées pour compléter les données non disponibles, dans la mesure où elles étaient compa- Mid-year population rables aux séries de l’ONU. Unless otherwise stated, the figures shown relate to de 15 facto population. Population (Urban) refers to the number Population en milieu d’année of persons living in areas defined as urban according to Sauf indication contraire, les chiffres indiqués se rap- national definitions of this concept. Since national defini- portent à la population de fait. La population urbaine est tions differ, cross-country comparisons should be made le nombre des personnes vivant dans les zones considé- with care. rées comme urbaines selon les définitions de ce concept dans chaque pays. Etant donné que cette définition varie Population by age groups quelque peu d’un pays à un autre, la prudence s’impose Three age groups are used in order to highlight the lorsqu’on procède à des comparaisons entre pays. proportion of active population vis-à-vis the depend- ant population. Population aged 15-64 is the number of Groupes d’âges people who could potentially be economically active, Trois groupes d’âge sont utilisés dans le but de mettre en excluding children. lumière la proportion du groupe d’âge actif par rapport aux dépendants. La population âgée de 15- 64 ans est le Economically active population nombre de personnes qui peuvent potentiellement être The economically active population comprises all em- économiquement active, et exclut les enfants. ployed and unemployed persons (including those seek- ing jobs for the first time). It covers employers, persons Population économiquement active working on their own account, salaried employees, wage La population active comprend toutes les personnes em- earners, unpaid family workers, members of producers’ ployées ou non (y compris celles qui sont à la recherche co-operatives and members of the armed forces. de leur premier emploi). Elle comprend les employeurs, les travailleurs indépendants, les salariés, les rentiers, les Life expectancy, Crude birth and death rates travailleurs familiaux non rémunérés, les membres des Life expectancy at birth is the average number of years a coopératives de producteurs et ceux des forces armées. newborn infant would live if prevailing patterns of mortal- ity of the total population at the time of his/her birth were to stay the same throughout his/her life. Crude birth and African Statistical Yearbook 2011 / Annuaire Statistique pour l'Afrique 2011
  • 17.
    death rates representthe number of live births and the Espérance de vie, taux bruts de natalité et de number of deaths respectively per 1000 people. Death is mortalité the permanent disappearance of all evidence of life at any L’espérance de vie à la naissance indique le nombre time after live birth has taken place (postnatal cessation moyen d’années que vivrait un nouveau-né si les ten- of vital functions without capability of resuscitation). This dances de la mortalité observées pour l’ensemble de definition excludes foetal deaths. la population au moment de sa naissance restaient inchangées tout au long de sa vie. Les taux bruts de Net reproduction rate natalité et de mortalité représentent respectivement le The net reproduction rate is the average number of nombre annuel moyen de naissances et de décès pour daughters that would be born to a woman if she passed 1000 habitants. La mortalité est le fait d’une disparition through her lifetime conforming to the age-specific permanente de toute évidence de vie, à tout moment, fertility and mortality rates of a given year. This rate is après que la naissance ait eu lieu (cette définition exclut similar to the gross reproduction rate but takes into ac- les mort- nés). count that some women will die before completing their childbearing years. Taux net de reproduction Le taux net de reproduction mesure le degré de rempla- Total fertility rate cement d’une génération par la suivante. Il s’exprime par The total fertility rate is the average number of children le nombre de filles mises au monde en descendance finale that would be born per woman if she experiences no par femme, rapport non corrigé de l’effet de mortalité ce mortality and were subject to a given set of age-specific qui le différencie du taux brut de reproduction. fertility throughout her lifetime. Indice synthétique de fécondité Education L’indice synthétique de fécondité est le nombre moyen The sources of the data on education, reported in this de naissances qu’une femme soumise à un ensemble de publication, consist of national publications and the fécondités spécifiques par âge, pourrait avoir au cours 16 UNESCO Statistical Yearbook. Data presented generally de sa période de procréation. relate to the public (official) and private (independent) schools. The indicated years refer to the beginning of Education school year. Adult education, apprenticeship courses Les sources des données sur l’éducation présentées dans and correspondence schools are excluded. Owing to vari- cette publication sont les publications nationales et l’An- ations in school systems, caution needs to be exercised nuaire statistique de l’UNESCO. Les données présentées when comparing the data across countries. portent en général sur les écoles de l’Etat (publiques) et les écoles indépendantes (privées). Les années indiquées Teaching Staff at specific level se rapportent au commencement de l’année scolaire. Teachers are defined as persons whose professional Sont exclus la formation des adultes, les stages d’appren- activity involves the transmitting of knowledge, attitudes tissage et les cours par correspondance. Compte tenu des and skills that are stipulated in formal curriculum pro- différences des systèmes scolaires, la comparaison des grammes to students enrolled in a formal Educational in- données présentées est sujette à caution. stitution at specific level (primary, secondary or tertiary). Personnel enseignant par degré Student enrolment at specific level Les enseignants sont définis comme étant les personnes First level student enrolment is the number of pupils dont l’activité professionnelle consiste à transmettre des enrolled at the primary level of education, regardless of connaissances, des aptitudes et le savoir-faire stipulés age. Second level student Enrolment is the total number dans un programme officiel d’études aux étudiants ins- of students enrolled at the secondary level of education, crits dans une institution scolaire officielle selon le degré regardless of age. (premier, deuxième ou troisième degré). Adult Illiteracy Rate Elèves inscrits selon le degré Percentage of persons aged 15 and over who cannot La scolarisation dans le premier degré est le nombre d’en- read and write. fants de tous âges inscrits à l’école primaire. La scolarisa- tion dans le second degré est le nombre d’élèves de tous âges inscrits dans le cycle d’enseignement secondaire. African Statistical Yearbook 2011 / Annuaire Statistique pour l'Afrique 2011
  • 18.
    General notes Notes générales Pupil-Teacher ratio Taux d’analphabétisme des adultes Pupil-teacher ratio is the average number of pupils (stu- C’est le pourcentage des adultes âgés de plus de 15 ans dents) per teacher at a specific level of education in a qui ne savent ni lire ni écrire. given school-year. Ratio élèves-enseignants Public expenditure on education Le rapport élève-maître est le nombre moyen d’élèves Public Education expenditure is government expenditure (étudiants) par enseignant dans un degré d’enseignement on the provision, management, inspection and support déterminé dans une année scolaire donnée. of pre-primary, primary and secondary schools; universi- ties and colleges; vocational, technical and other training Dépenses publiques consacrées à l’enseignement institutions; and general administration and subsidiary Les dépenses publiques d’éducation sont des dépenses services. engagées par l’Administration publique pour le fonction- nement, l’administration, l’insertion et l’appui des écoles Health maternelles, primaires et secondaires; des universités et The figures for physicians and nurses relate to those reg- des établissements d’enseignement supérieur; des éta- istered at the government offices. The number of hospital blissements d’enseignements professionnel, technique beds refers to public and private hospitals. et autres; et de l’administration générale et des services annexes. Acces to safe water It is measured by the number of people who have a rea- Santé sonable means of getting an adequate amount of clean Les chiffres donnés se rapportent aux médecins et water, expressed as a percentage of the total population. infirmiers enregistrés au niveau des services du gou- vernement. Le nombre de lits d’hôpitaux sont ceux du public et du privé. Accès à l’eau potable 17 Il est mesuré par le pourcentage dans la population totale de personnes qui disposent de moyen approprié pour accéder à de l’eau buvable. II. NATIONAL ACCOUNTS II. COMPTES NATIONAUX T his section provides information on national ac- counts. National accounts data provide essential information on the economic performance of African C ette section présente des informations sur la comp- tabilité nationale. Les données de la comptabilité nationale fournissent des indications essentielles sur la countries in terms of growth and structure of output, performance économique des pays africains en termes investments and savings. National accounts data are ob- de croissance et de structure de production, d’investis- tained from various national sources and supplemented sement et d’épargne. Les données de la comptabilité with data from international sources such as the UN nationale proviennent de diverses sources nationales et Yearbook of National accounts and ADB and ECA African complétées par d’autres sources internationales telles Centre for Statistics estimates. Where necessary, official que l’Annuaire de Comptabilité nationale de l’ONU et figures have been adjusted to conform with the System les estimations de la BAD et du Centre africain pour la of National Accounts (SNA). Many countries continue to statistique de la CEA. Les chiffres officiels ont été ajustés compile their national accounts in accordance with the en fonction du Système de Comptabilité Nationale (SCN) 1968 SNA, but an increasing number is adopting the 1993 quand cela s’est avéré nécessaire. De nombreux pays SNA. A few countries still use concepts from older SNA continuent d’élaborer leurs comptes nationaux à partir guidelines, including valuations such as factor cost, in du SCN 1968. Mais de plus en plus de pays sont en train describing major economic aggregates. de migrer vers le SCN 1993. Certains pays continuent encore d’utiliser les concepts provenant des anciennes Gross Domestic Product (GDP) recommandations du SCN incluant la comptabilisation GDP measures the total final output of goods and services des agrégats économiques aux coûts des facteurs. African Statistical Yearbook 2011 / Annuaire Statistique pour l'Afrique 2011
  • 19.
    produced by anational economy, excluding provisions Produit intérieur brut (PIB) for depreciation. Le produit intérieur brut (PIB) mesure la production finale totale des biens et services de l’économie nationale, en GDP by kind of economic activity (by sector) excluant l’amortissement. GDP by sector gives value-added by the broad categories of the ISIC classification. Value added is evaluated at basic Le PIB par branche d’activité (par secteur) prices or factor cost or at producer prices depending Le PIB par secteur donne la valeur ajoutée pour les on the current practice in the country. Data is provided grandes catégories de la classification CITC. La valeur at current prices and in terms of growth rates over the ajoutée est évaluée aux prix de base ou aux coûts des previous year based on data at constant prices. facteurs ou encore au prix du producteur selon la pratique en vigueur du pays. Les données nominales sur les valeurs Expenditure on GDP ajoutées sont fournies aux prix courants et les taux de General Government final consumption croissance annuels pour chaque catégorie sont calculés General Government final consumption expenditure à partir des données à prix constants. comprises all current expenditure for purchases of goods and services by all levels of government, as well as capital Emplois du PIB expenditure on national defense and security. La consommation finale des administrations publiques Private final consumption La consommation finale des administrations publiques Household final consumption expenditure represents comprend toutes les dépenses courantes consacrées à the final consumption of households and non-profit in- l’achat de biens et de services par les administrations de stitutions. It includes imputed rent for owner-occupied tous les niveaux, ainsi que les dépenses en capital au titre dwellings but excludes purchases of dwellings and it also de la défense et de la sécurité nationale. includes any statistical discrepancy. La consommation finale privée 18 Gross capital formation La consommation finale privée représente la consom- Gross capital formation consists of gross domestic mation finale des ménages et des institutions à but non fixed capital formation plus net changes in the level of lucratif. Elle ne comprend pas les achats de logement mais inventories. elle inclut le loyer imputé des logements occupés par leur propriétaire. Elle comprend aussi tout écart statistique. Exports and imports of goods and services Exports and imports of goods and services refer to the La formation brute de capital value of goods and non-factor services provided to or La formation brute de capital comprend les dépenses from the rest of the world. They do not include receipts consacrées à l’accroissement du capital fixe de l’écono- and payments for factor services such as investment mie, majorées des variations nettes du niveau des stocks. income, interest and labor income. The data are gener- ally estimated on the basis of foreign trade statistics and Les exportations et importations de biens et services are not directly comparable with those from the balance Les exportations et importations de biens et services of payments. représentent la valeur des biens et services non fac- teurs fournis au reste du monde ou reçus de celui-ci. La valeur des revenus et des paiements des services facteurs comme le produit des placements, les intérêts et le revenu du travail, en est exclue. Les données sont généralement estimées sur la base des statistiques du commerce extérieur et ne sont pas directement compa- rables à celles de la balance des paiements. African Statistical Yearbook 2011 / Annuaire Statistique pour l'Afrique 2011
  • 20.
    General notes Notes générales III. INFLATION III. INFLATION I nflation is measured by the annual percent changes in Consumer price index. Consumer price index (CPI) shows the cost of acquisition of a basket of goods and L ’inflation est mesurée par la variation annuelle de l’indice des prix à la consommation (IPC). L’IPC montre le coût d’acquisition par un consommateur moyen d’un services purchased by the average consumer. Weights panier de biens et services. Les coefficients de pondé- for the computation of the index numbers are obtained ration pour le calcul des indices sont obtenus à partir from household budget surveys. CPI data are provided d’enquêtes sur les dépenses des ménages. Les données by the national statistical systems, mainly by the National de l’IPC proviennent des systèmes statistiques nationaux, Statistical Offices or Central banks. et essentiellement des Instituts nationaux de statistique ou des Banques centrales. IV. AGRICULTURAL PRODUCTION IV. PRODUCTION AGRICOLE Agricultural production Production agricole The data on major crops produced is obtained from the Les données sur les principales productions agricoles National Statistical Offices of the following countries; sont obtenues via les instituts nationaux de statistiques Burkina Faso, Burundi, Cameroon, Congo, Côte d’Ivoire, des pays suivants  : Burkina Faso, Burundi, Cameroun, Democratic Republic of Congo, Gabon, Gambia, Guinea- Congo, Côte d’Ivoire, République démocratique du Bissau, Kenya, Lesotho, Madagascar, Malawi, Mali, Congo, Gabon, Gambie, Guinée-Bissau, Kenya, Lesotho, Mauritania, Mauritius, Morocco, Mozambique, Nigeria, Madagascar, Malawi, Mali, Mauritanie, île Maurice, Maroc, Senegal, Sudan, Swaziland, Zambia, and Zimbabwe. For Mozambique, Nigeria, Sénégal, Soudan, Swaziland, Zam- the remaining countries the data is obtained from the bie, et Zimbabwe. Pour les autres pays les données sont online database of the Food and Agricultural Organiza- tirées de la base de données en ligne de l’Organisation 19 tion (FAO). For those countries, the five major crops per pour l’Alimentation et l’Agriculture (FAO). Pour ces pays, country are obtained by calculating the average yearly les cinq principales productions agricoles sont obtenues production of each crop produced by a given country en calculant la production annuelle moyenne de chaque (considering only years when the crop is produced); and produit du pays (seules les années où le produit est ranking it in descending order. récolté sont retenues) et en rangeant ces productions par ordre décroissant. Agricultural and food production index The various indices of agricultural production illustrate Indices de la production agricole et alimentaire the relative level of the aggregate volume of agricultural Les différents indices de la production agricole illustrent production for each year, compared to the base period le niveau du volume global de production agricole chaque 1999-2001. These indices of agricultural production ob- année, relativement à la période de base 1999-2001. tained from the FAO online database are computed using Ces indices sont obtenus à partir de la base de données the Laspeyres formula, as the price weighted sum of the en ligne de la FAO et calculés en utilisant la formule de production of various commodities less seed and feed. Laspeyres - somme pondérée par les prix des produc- The price used for weighting the production quantity of tions des différents produits hors semences et graines each commodity is the average price during the years d’alimentation. Le prix utilisé pour pondérer la quantité indicated as the base year. de chaque produit est le prix moyen au cours des années de référence. V. MINING PRODUCTION V. PRODUCTION MINIERE T he sources for the data reported are national statis- tical offices (for those countries to which the AfDB, AUC and UNECA questionnaire was sent), the United Na- L es sources des données présentées sont soit  : les instituts nationaux de statistiques, pour les pays auxquels le questionnaire conjoint BAD- CUA – ECA a tions Industrial Commodity Database accessed through été envoyé, Soit : la base des données sur les produits African Statistical Yearbook 2011 / Annuaire Statistique pour l'Afrique 2011
  • 21.
    UNDATA (at http://data.un.org/)and the United Nations industriels des Nations Unies, accessible via UNDATA (à Industrial Commodity Yearbook. Data for some of the min- http://data.un.org/) ou l’annuaire des produits industriels erals were also obtained from British Geological Survey, des Nations Unies. Pour certains minerais, les données World Minerals Production 2003 – 2007 (at http://www. ont également été obtenues à partir de l’enquête géo- bgs.ac.uk/downloads/browse.cfm?sec=12&cat=135) and logique britannique « la production de minerais dans le the United States Geological Survey website (at http:// monde en 2003 – 2007 » sur le site : http://www.bgs.ac.uk/ minerals.usgs.gov/minerals/pubs/commodity/myb/). downloads/browse.cfm?sec=12&cat=135 0u sur le site de l’enquête géologique des Etats-Unis : Mining production http://minerals.usgs.gov/minerals/pubs/commodity/myb/ For a details description of the minerals included in this publication, the user may refer to the Central Product Production minière Classification (CPC) Ver.1.1, Statistical Papers, Series Pour les descriptions détaillées des produits miniers M, No.77, Ver.1.1 (United Nations publication, Sales No. inclus dans cette publication, le lecteur peut se référer à E.03.XVII.3). It was difficult to identify the three major la Classification Centrale des Produits (CCP), Papiers sta- commodities for each country because of the reference tistiques, Séries M, N077, Ver 1.1 (Publication des Nations period being too narrow and commodities varying from Unies, Ventes N0. E.03.XVII.3). Il était difficile d’identifier one country to another. First, we obtained the export les trois principaux produits puisque la période de réfé- values of minerals for the years 1998 through 2007. We rence était très variable et courte pour plusieurs produits then considered the average value (considering only years et aussi les produits varient d’un pays à un autre. Dans when the commodity is available) to help us decide which un premier temps, nous avons obtenu les valeurs des commodity to include in the publication. In addition, we exportations des produits miniers pour les années 1998 decided to choose strategic commodities (such as oil, à 2007. Nous avons ensuite agrégé sur la période où le gas and diamonds) when the country is produces them. produit est disponible avant de calculer la moyenne pour pouvoir décider quel produit à inclure dans la publication. Finalement, nous avons décidé de choisir les produits 20 stratégiques (tels que le pétrole, le gaz et le diamant) lorsque le pays continue de les produire. VI. ENERGY VI. ENERGIE T he data provided for this section are from the United Nations Energy Statistical Yearbook and the Energy Database which could be accessed through UNDATA (at L es sources des données publiées proviennent de l’Annuaire statistique sur l’énergie des Nations Unies et de la base de données sur l’énergie accessible à travers http://data.un.org/). UNDATA (http://data.un.org). Electricity production Production d’électricité The figures reported for production refer to gross gen- Les chiffres publiés pour la production sont relatifs à la eration of electricity, which include the consumption by production brute d’électricité, qui inclut la consommation station auxiliaries and any losses in transformers as well des stations auxiliaires et toutes pertes dans la trans- as electricity generated by pumping stations without de- formation et aussi l’électricité produite par les stations ducting the electric energy consumed by the pumps. The de pompage sans déduction de l’énergie consommée production of electricity includes public utilities, whose par ces mêmes pompes. La production d’électricité primary purpose is to generate and transmit electric comprend, d’une part, les installations publiques, dont energy for use by the public, and self producers, who le but primaire est la génération et la transmission de produce electric energy intended, in whole or in part, l’énergie électrique pour la consommation publique, for their own uses. et d’autre part, les producteurs privés qui produisent l’énergie électrique, totalement ou en partie, pour leur propre consommation. African Statistical Yearbook 2011 / Annuaire Statistique pour l'Afrique 2011
  • 22.
    General notes Notes générales VII. TOURISM AND INFRASTRUCTURE VII. TOURISME ET INFRASTRUCTURE Tourism Tourisme E xcept for the countries that are listed below, and which provided the data on Tourism and Infra- structure through their National Statistical Offices, the A l’exception des pays énumérés ci-dessous, dont les INS ont communique les données sur le tourisme et les infrastructures, les données de cette section sont data on Tourism have been obtained from the African tirées du CD-ROM des indicateurs de développement de Development Indicators CDROM of the World Bank. The l’Afrique de la Banque mondiale. Les pays qui ont fourni countries that provided data on Tourism and Infrastruc- des données sur le tourisme et l’infrastructure sont  : ture are: Burkina Faso, Burundi, Congo, Djibouti, Côte le Burkina Faso, le Burundi, le Congo, Djibouti, la Côte d’Ivoire, Gabon, Gambia, Guinea-Bissau, Kenya, Libyan d’Ivoire, le Gabon, la Gambie, la Guinée-Bissau, le Kenya, Arab Jamahiriya, Lesotho, Madagascar, Malawi, Mali, la Jamahiriya arabe libyenne, le Lesotho, Madagascar, le Mauritania, Mauritius, Morocco, Mozambique, Nigeria, Malawi, le Mali, la Mauritanie, l’île Maurice, le Maroc, la Senegal, Sudan, Swaziland, and Zambia. The last two Mozambique, le Nigeria, le Sénégal, le Soudan, le Swazi- countries provided only infrastructure data. land, et la Zambie. Ces deux derniers pays n’ont fourni que les données d’infrastructures. The indicators published are the number of arrivals in the country and the number of hotel rooms. The number of Les indicateurs publiés sont le nombre d’arrivées dans tourists to a country, unless otherwise stated, refers to all le pays et le nombre de chambres d’hôtel. Le nombre de persons (checked at the frontier) travelling for pleasure, touristes d’un pays se rapporte, sauf indication contraire, health, business, meetings or studies and stopping in à toutes les personnes contrôlées à la frontière et voya- that country for twenty-four hours or more. The figures geant pour le plaisir, la santé, les affaires, les réunions exclude immigrants and residents in a frontier zone. ou les études, s’arrêtant dans le pays pour vingt-quatre heures ou plus. Les données excluent les immigrés et résidants frontaliers. 21 VIII. FINANCIAL AND MONETARY VIII. FINANCES ET STATISTIQUES STATISTICS MONETAIRES Monetary Statistics Statistiques monétaires D ata for this section are essentially obtained from the IMF International Financial Statistics Database and National Central Banks. L es données de cette section proviennent essentielle- ment des banques centrales africaines et de la base de données sur les Statistiques financières internatio- nales du FMI. Money supply (M1) Money supply comprises transferable deposits and cur- La masse monétaire rency outside deposit money banks. La masse monétaire au sens strict (M1) comprend les dépôts transférables et la circulation fiduciaire hors Quasi money banques. Quasi money comprises time, savings and foreign cur- rency deposits. La quasi-monnaie La quasi-monnaie englobe les dépôts à terme, les dépôts Net foreign assets d’épargne et les dépôts en devises. Net foreign assets equal the sum of foreign assets, less the sum of foreign liabilities of monetary authorities and Les avoirs extérieurs nets deposit money banks. Les avoirs extérieurs nets sont égaux à la somme des avoirs extérieurs moins la somme des engagements Domestic credit extérieurs des autorités monétaires et des banques Domestic credit includes all domestic assets of the bank- créatrices de monnaie. African Statistical Yearbook 2011 / Annuaire Statistique pour l'Afrique 2011
  • 23.
    ing system. Itis the sum of claims on the central govern- Le crédit intérieur ment (net), on official entities and the private sector. Le crédit intérieur est égal à la somme des créances nettes Credit to the private sector is shown separately but as a sur l’Etat, sur les entreprises publiques et le secteur privé. subset of domestic credit. Le crédit au secteur privé est présenté séparément mais en tant que sous-groupe du crédit intérieur. International reserves International reserves consist of the country’s holdings Les réserves internationales of monetary gold, Special Drawing Rights (SDRs) and Les réserves internationales comprennent les avoirs du foreign exchange, as well as its reserve position in the pays en or monétaire, droits de tirage spéciaux (DTS) et International Monetary Fund (IMF). devises, ainsi que ses réserves auprès du Fonds moné- taire international (FMI). Exchange rates Exchange rates expressed in national currency unit per Le taux de change US dollar unit are reported as end period and period av- Le taux de change, exprimés en unité de monnaie natio- erages of market exchange rates and official rates. The nale par rapport au dollar EU, sont indiqués comme des market rate is defined as the rate determined largely by taux de fin de période et des moyennes sur la période des market forces; and the official rate is that determined by taux de change du marché et des taux officiels. Le taux du the authorities. marché est défini comme le taux déterminé grosso modo par les forces du marché; et le taux officiel est celui fixé Public Finance par les autorités. Data for this section have been primarily collected from National Authorities such as National Statistics Offices, Finances publiques Ministries of Finance and Central Banks; and where na- Les données de section sont principalement collectées tional sources are not available; data from IMF publica- par les autorités nationales, telles que les instituts tions (Country Reports) are used. nationaux de statistiques, les ministères des finances et 22 les banques centrales ; quand les sources nationales ne The data for Botswana, Egypt, Ethiopia, Kenya, Malawi, sont pas disponibles, les données des publications du Mauritius, Namibia, South Africa and Swaziland, were FMI (rapports des pays) sont employées. compiled following their respective fiscal period as an- nual data. Therefore, the years 2002 - 2010 represent Pour le Botswana, l'Egypte, l'Ethiopie, le Kenya, le Malawi, the ending calendar year according to the fiscal period les îles Maurice, la Namibie, l'Afrique du Sud et le Swazi- of each country. land, les données ont été compilées selon l’année fiscale, comme données annuelles. Ainsi, les années 2002 à 2010 Revenue and grants représentent bien l'année civile selon la période fiscale These include all non-repayable receipts, requited and de chaque pays. unrequited, current and capital, and non-compulsory, nonrepayable, unrequited receipts from other govern- Recettes totales et dons ments (domestic or foreign) and international institutions. Les recettes publiques incluent toutes les recettes non remboursables de l’Etat, avec ou sans contrepartie, pro- Tax revenue venant d’autres administrations (locales ou étrangères) This includes compulsory, unrequited, non-repayable et des institutions internationales. contributions exacted by a government for public pur- poses. Recettes fiscales Les recettes fiscales regroupent les impôts, taxes, droits Non-tax revenue et autres transferts obligatoires autres que les cotisations This includes requited receipts from property incomes, de sécurité sociale. Elles sont la principale source de fees and charges, non-industrial and incidental sales, the revenu de la plupart des administrations publiques et cash operating surpluses of departmental enterprises constituent des transferts obligatoires vers ce secteur. and unrequited receipts such as fines, forfeits and cur- rent private donations. Recettes non fiscales Elles regroupent les impôts sur les revenus de la pro- priété, les droits et taxes non industrielles et les ventes African Statistical Yearbook 2011 / Annuaire Statistique pour l'Afrique 2011
  • 24.
    General notes Notes générales Grants de biens existants, les amendes, les pénalités, les confis- Unrequited, non-repayable, non-compulsory govern- cations, les indemnisations accordées par un tribunal, et ment receipts from other governments or international les transferts volontaires autres que les dons. institutions. Les dons Expenditure and net lending Les dons sont des transferts non obligatoires courants ou These include all non-repayable payments by govern- en capital qu’une administration publique peut recevoir ment, whether requited or unrequited and whether d’une autre administration publique ou d’une organisa- current or capital, as well as government transactions in tion internationale. debt and equity claims upon others acquired for purposes Dépenses et prêts nets of public policy. Ils comprennent tous les paiements non remboursables Current Expenditure effectués par l’Administration publique, avec ou sans It includes all non-repayable payments by government, contrepartie, y compris les dépenses courantes et en whether requited or unrequited, other than capital ex- capital, les transactions au titre de la dette publique et penditure or grants. les participations au capital pour des raisons de politique publique. Capital Expenditure Expenditure for acquisition of fixed capital assets, stocks, Dépenses courantes land or intangible assets plus unrequited transfers for Elles comprennent tous les paiements non rembour- the purpose of permitting the recipient to acquire such sables effectués par l’Administration publique, avec ou assets. In order to be classified as a capital asset, an sans contrepartie, autres que les dépenses en capital ou asset acquired must exceed a minimum value and be les subventions. intended for use for more than one year in the process Dépenses en capital of production. Il s’agit des dépenses pour l’acquisition d’immobilisa- 23 Net lending tions, des stocks, des terrains ou des actifs incorporels Net lending (lending minus repayments) comprises gov- ainsi que les transferts sans contrepartie dans le but de ernment transactions in claims upon others acquired for permettre au bénéficiaire d’acquérir ces actifs. Pour être purposes of public policy rather than for management of classé comme un capital, un bien acquis doit dépasser une government liquidity or earning a return. It covers both valeur minimale et être destiné à plus d’un an d’utilisation debt and equities and both payments and receipts. dans le processus de production. Fiscal Balance Les prêts nets Fiscal balance or Government overall surplus/deficit is Les prêts nets (total des prêts moins les remboursements) defined as total revenue and grants received less total comprennent les transactions de l’Etat relatives aux expenditure and net lending. créances sur des tiers obtenues à des fins de politique publique plutôt que d’en tirer profit. Ce chiffre porte à la Balance of Payments fois sur les paiements et les recettes. The Balance of payments is a statistical statement that sum- marizes, for a specific period, the economic transactions Déficit fiscal of an economy with the rest of the world. Transactions for L’excédent/déficit global des finances publiques est la the most part between residents and non-residents con- différence entre, d’une part, les recettes courantes, les sist of those involving goods, services, and income; those recettes en capital et les dons publics reçus et, d’autre involving financial claims on, and liabilities to, the rest of part, les dépenses totales et les prêts moins les rem- the world; and those classified as transfers which involve boursements. offsetting entries to balance, in an accounting sense, one- sided transactions. Data in this section are obtained from Balance des paiements African Central Banks and where data are not available from Il s’agit d’un état statistique où sont résumées, pour une national sources or if country data do not meet the required période donnée, les transactions économiques d’une quality, IMF Country Reports are also used. économie avec le reste du monde. Les transactions, pour la plupart entre résidents et non-résidents, sont celles qui African Statistical Yearbook 2011 / Annuaire Statistique pour l'Afrique 2011
  • 25.
    Trade balance portent sur les biens, services et revenus; celles qui font Trade balance is equal to exports less imports of goods, naître des créances financières sur le reste du monde ou both measured on the "free-on-board" (f.o.b.) basis - that des engagements financiers envers celui-ci et celles qui is, by the value of the goods at the border of the exporting sont considérées comme des transferts, pour lesquels il y a country. Goods cover general merchandise, goods for lieu de passer des contre-écritures de manière à solder les processing, repairs on goods, goods procured in ports transactions à sens unique. Les données de cette section by carriers, and non-monetary gold. proviennent des Banques centrales africaines. Lorsque ces données ne sont pas disponibles ou de mauvaise qualité, Services balance les Rapports pays du FMI ont été utilisés en remplacement. Services include transportation (freight and passenger transportation); travel; communication services; con- Balance commerciale struction services; insurance services; financial services; Elle est égale à la différence entre les exportations et les computer and information services; royalties and license importations de biens, évalués sur la base f.à.b (franco à fees; personal, cultural, and recreational services; gov- bord) c’est-à-dire à la frontière du pays exportateur. Le ernment services. Service Balance is defined as exports poste des biens englobe les marchandises générales, les minus imports of services. biens importés ou exportés pour subir une transforma- tion, la valeur des réparations de biens, les biens achetés Net income dans les ports par les transporteurs non-résidents, et l’or Income includes compensation of employees which non monétaire. covers wages, salaries, and other benefits; investment income which consist of direct investment income, port- Balance des services folio investment income and other investment income. Les services recouvrent les transports (Fret et transport Net income is income received from investments abroad international des passagers), la rubrique des voyages, les less income paid to foreigners investing in the country. services de communication, les services des bâtiments et travaux publics, les services d’assurance, les services 24 Current transfers d’informatique et d’information; les redevances et droits Current transfers consist of all transfers that do not de licence: les services personnels, culturels et relatifs involve: (i) transfers of ownership of fixed assets; (ii) aux loisirs; les services fournis ou reçus par les adminis- transfers of funds linked to acquisition or disposal of fixed trations publiques. La balance des services est définie assets; (iii) forgiveness, without any counterparts being par les revenus moins les paiements au titre des services. received in return, of liabilities by creditors. Revenus nets Current account balance Le poste revenus enregistre deux types de flux: ceux qui Current account balance is the sum of net exports of relèvent de la rémunération des salariés qui comprend goods and services, net income, and net current trans- les salaires, traitements et autres prestations; et ceux qui fers. correspondent au revenu des investissements qui com- prend les revenus des investissements directs, des inves- External debt and Financial Flows tissements de portefeuille et d’autres investissements. Data in this section are mainly obtained from the follow- ing international sources: IMF World Economic Outlook Transferts courants database, OECD Online Database and UNCTAD online Les transferts courants sont tous ceux qui ne font pas database. However, few countries have submitted their intervenir i) le transfert de propriété d’un actif fixe, ii) le data and they are published in this edition of the Year- transfert de fonds lié ou subordonné à l’acquisition ou à book. The purpose of the yearbook is to include data la cession d’un actif fixe, iii) la remise, sans contrepartie, from national sources to the extent possible when the d’une dette par un créancier. data quality is acceptable. Data from national sources relate to the following countries: Burkina Faso, Kenya, Solde du compte courant Lesotho, Madagascar, Mali, Mauritius, Mozambique, La balance des comptes des opérations courantes est la Senegal, Swaziland, Tunisia and Zambia. somme des exportations nettes des biens et services, du revenu net et des transferts courants nets. External Debt External Debt (total outstanding debt) is the amount, at African Statistical Yearbook 2011 / Annuaire Statistique pour l'Afrique 2011
  • 26.
    General notes Notes générales any given time, of disbursed and outstanding contractual Dette extérieure et flux financiers liabilities of residents of a country to non-residents to Les données de cette section proviennent essentielle- repay principal, with or without interest, or to pay inter- ment des sources internationales suivantes: la base de est with or without principal. It is the sum of public and données sur les «Perspectives de l’économie mondiale publicly-guaranteed short and long-term debt, private » du FMI, les bases de données en ligne de l’OCDE et de non-guaranteed short and long-term debt and the use la CNUCED. Cependant, quelques pays ont fourni leurs of IMF credit. données pour cette édition de l’annuaire. L’objectif de l’annuaire est d’inclure les données fournies par les External debt service pays eux-mêmes dans la mesure du possible pourvu Total External Debt service is the sum of principal re- que la qualité des données le permette. Les données payments and interest actually made. It is debt service nationales proviennent des pays suivants : Burkina Faso, payments on short and long-term debt (public and Kenya, Lesotho, Madagascar, Mali, Maurice, Mozambique, publicly-guaranteed and private non-guaranteed) and Sénégal, Swaziland, Tunisie et Zambie. the use of IMF credit. Dette extérieure totale Foreign direct investment La dette extérieure totale est le montant dû mais non Foreign direct investment refers to investment made to remboursé, à un moment donné, par les résidents d’un acquire or add to a lasting management interest (usually pays à des non résidents, et qui se sont engagés à rem- 10 percent of voting stock) enterprise operating in a coun- bourser le principal, avec ou sans intérêt, ou à payer les try other than that of the investor. It is the sum of equity intérêts avec ou sans le principal. Elle est la somme de la capital, reinvestment of earnings and other short and dette publique, de la dette garantie publique, de la dette long-term capital as shown in the balance of payments. privée non garantie à long terme, du recours au crédit du FMI et de la dette à court terme. Official development assistance ODA relates to grants or concessional loans (i.e. with a Service de la dette extérieure grant element of at least 25 percent), undertaken by the Le service total de la dette (extérieure) est la somme 25 official sector, whose main objective is the promotion of des remboursements du principal et des paiements des economic development and welfare. Data in this section intérêts. Il s’agit du service de la dette à court terme et are net disbursements of ODA. de la dette à long terme (dette publique, dette privée à garantie publique et dette non garantie privée) et du recours au crédit du FMI. Investissements directs étrangers L’investissement direct étranger représente l’investisse- ment effectué pour acquérir ou accroître une participa- tion durable au capital d’une entreprise (généralement 10 pour cent du pouvoir de vote) opérant dans un pays autre que celui de l’investisseur. C’est la somme du capi- tal social, du réinvestissement des bénéfices et d’autres capitaux à court et à long termes comme il est indiqué dans la section traitant de la balance des paiements. Aide publique au développement L’APD représente les dons et les prêts accordés à des conditions financières privilégiées (c’est-à-dire avec un élément de libéralité d’au moins 25 pour cent) au secteur public dans le but principal de promouvoir le dévelop- pement économique et le bien-être social. Il s’agit des décaissements nets d’APD. African Statistical Yearbook 2011 / Annuaire Statistique pour l'Afrique 2011
  • 27.
    General notes Notes générales IX. EXTERNAL TRADE IX. COMMERCE EXTERIEUR D ata for this section are mainly obtained from national sources.This is the case for the following countries: Angola, Botswana, Burkina Faso, Burundi, Cameroon, L es données pour cette section proviennent majori- tairement des sources nationales. C’est le cas des pays suivants : Angola, Botswana, Burkina Faso, Burundi, Central African Republic, Comoros, Congo, Côte d'Ivoire, Cameroun, République centrafricaine, Comores, Congo, Democratic Republic of Congo, Egypt, Gabon, The Gam- République démocratique du Congo, Côte d'Ivoire, bia, Guinea, Guinea-Bissau, Kenya, Lesotho, Libyan Arab Egypte, Gabon, Gambie, Guinée, Guinée-Bissau, Kenya, Jamahiriya, Madagascar, Malawi, Mali, Mauritania, Mau- Lesotho, Jamahiriya arabe libyenne, Madagascar, Ma- ritius, Morocco, Mozambique, Namibia, Nigeria, Rwanda, lawi, Mali, Mauritanie, Maurice, Maroc, Mozambique, Senegal, Seychelles, Sierra Leone, Sudan, Tanzania, Namibie, Nigeria, Rwanda, Sénégal, Seychelles, Sierra United Republic of, Tunisia, and Zambia. Where national Leone, Soudan, Tanzanie, Tunisie et Zambie. Dans le data were not available, we have used the United Nations cas où des données nationales n’ont pu être trouvées, COMTRADE online database. The names of major Export nous avons eu recours à la base de données en ligne and Import commodities have been selected by the re- des Nations Unies COMTRADE. Les noms des principaux porting countries themselves. For the data obtained from produits d'exportation et d'importation ont été choisis COMTRADE the harmonized system (rev1) classification par les pays eux-mêmes. Pour les données obtenues is used to determine the list of main exports and imports de COMTRADE la nomenclature du système harmonisé commodities. Unless otherwise indicated the import sta- (rev1) a été employée pour déterminer la liste des pro- tistics are reported on CIF valuation base while exports duits principaux d'exportations et d'importation. Sauf are reported on FOB. indication contraire, les statistiques d'importation sont valorisées sur la base CAF tandis que les exportations sont valorisées FOB. 26 X. MILLENIUM DEVELOPMENT X. OBJECTIFS DU MILLENAIRE POUR GOALS LE DEVELOPPEMENT I ndicators presented in this publication come from the MDGs websites. L es indicateurs publiés proviennent du site web des OMDs. Environnement Environment Le Burkina Faso, le Burundi, le Cameroun, les Comores, le Burkina Faso, Burundi, Cameroon, Comoros, Congo, Congo, le Gabon, la Guinée, le Kenya, la Jamahiriya arabe Gabon, Guinea, Kenya, Libyan Arab Jamahiriya, Malawi, libyenne, le Malawi, la Mauritanie, l’île Maurice, le Maroc, Mauritania, Mauritius, Morocco, Mozambique, Nigeria, le Mozambique, le Nigeria, le Sénégal, et le Zimbabwe ont Senegal, and Zimbabwe are the countries that provided fourni des données sur l’environnement ; pour les autres data on environment for the remaining countries is ob- pays, les données ont été tirées du CD-ROM des indica- tained from the African Development Indicators CD-ROM teurs africains de développement de la Banque mondiale. of the World Bank. Technologies de l’information et de Information and Communication Technology communication (TIC) (ICT) Le Cameroun, les Comores, le Congo, Djibouti, la Guinée, Cameroon, Comoros, Congo, Djibouti, Guinea, Kenya, le Kenya, la Jamahiriya arabe libyenne, le Malawi, le Mali, Libyan Arab Jamahiriya, Malawi, Mali, Mauritania, Mau- la Mauritanie, l’île Maurice, le Mozambique, le Nigeria, ritius, Mozambique, Nigeria, Senegal, Sudan, Swaziland, le Sénégal, le Soudan, le Swaziland et la Zambie ont and Zambia are the countries that provided data on ICT fourni des données sur les TIC  ; pour les autres pays, the data for the remaining countries is obtained from the les données ont été obtenues de l’Union internationale International Telecommunication Union (ITU) and African des Télécommunication (UIT) ou à partir du CD-ROM des Development Indicators CD-ROM of the World Bank. indicateurs de développement de l’Afrique de la Banque mondiale. African Statistical Yearbook 2011 / Annuaire Statistique pour l'Afrique 2011
  • 28.
    1 Part 27 Partie Summary Tables Tableaux résumés African Statistical Yearbook 2011 / Annuaire Statistique pour l'Afrique 2011
  • 29.
    1 28 Section Social and Demographic Indicators Indicateurs démographiques et sociaux African Statistical Yearbook 2011 / Annuaire Statistique pour l'Afrique 2011
  • 30.
    2011 Pupil/Teacher Ratio inPrimary Le ratio élèves par enseignant Education dans l’éducation primaire Women participation in the workforce in La participation des femmes dans la Africa: Good but insufficient progress? population active en Afrique: Des progrès The economically active population in Africa has in- prometteurs mais insuffisants? creased by about 32.6% between 2000 and 2010. For La population économiquement active en Afrique s’est the 52 countries included in the table, the number of accrue d’environ 32.6% entre 2000 et 2010. Pour les 52 economically active persons has reached 413.5 million in pays pris en compte dans le graphique, le nombre de 2010 as compared to 311.8 million in 2000. This increase personnes économiquement actives a atteint 413.5 mirrors roughly the increment in the African population millions en 2010 comparativement à 311.8 millions en during the past ten years. 2000. Cet accroissement reflète approximativement l’augmentation de la population africaine au cours de dix The share of women in the economically active population dernières années. in Africa has shown some promising progress between 2000 and 2010. This share went up from 40.3% to 41.0% L’évolution de la part des femmes dans la population over the ten years under consideration. Although this is économiquement active en Afrique dénote en partie a positive movement, at the current trends, Africa is still un progrès encourageant entre 2000 et 2010. Cette not likely to meet the MDG target on parity of women and part a grimpé de 40.3% à 41.0% au cours des dix années men in the economically active population. sous revue. Bien que cette évolution soit positive, aux tendances actuelles, il est probable que l’Afrique ne soit However, these figures should be interpreted with cau- pas encore en mesure de réaliser l’objectif du millénaire tion. While there seems to be some progress, the figures pour le développement relatif à la parité entre les femmes do not tell us anything about the internal structure of the et les hommes s’agissant de la population économique- workforce. It is important to know whether the share of ment active. women’s activity in the economy has been increasing at all levels of responsibilities or whether women are still Cependant, ces chiffres doivent être interprétés avec mainly concentrated in low level jobs. prudence. Quoiqu’il semble y avoir du progrès, les chiffres 29 Econom ically Active Population and Share of Wom en in the Econom ically Active Population (Africa excepted Seychelles) Population économ iquem ent active et la part des fem m es dans la population économ iquem ent active (Afrique excepté Seychelles) 450 42 400 41 350 40 300 250 39 200 38 150 37 100 36 50 0 35 2000 2001 2002 2003 2004 2005 2006 2007 2008 2009 2010 Economically Active Population, in millions (left scale) / Population économiquement active en millions (échelle de gauche) % of Women in the Economically Active Population (right scale) / % des femmes dans la population économiquement active (échelle de droite) African Statistical Yearbook 2011 / Annuaire Statistique pour l'Afrique 2011
  • 31.
    2011 Pupil/Teacher Ratio in Primary Le ratio élèves par enseignant Education dans l’éducation primaire The concept of economically active persons is usually ne nous disent rien au sujet de la structure interne de la based on the definition from the System of National Ac- main d’œuvre. Il est important de savoir si la part des count (SNA), which minimizes activities in the informal activités de femmes dans l’économie s’est accrue à tous sector where women are a majority. This definition les niveaux des responsabilités ou si les femmes sont excludes those engaged in domestic activities that con- encore principalement concentrées dans les travaux de tribute to the general well being, but are not considered niveau inférieur. productive according to the SNA. It is therefore possible that the participation of women in activities that generate Le concept des personnes économiquement actives goods and services which increase the well-being of the est communément basé sur la définition du Système de populations and contribute to the development of the comptabilité national (SCN), qui minimise les activités du continent is probably higher than what these numbers secteur informel où exercent en majorité les femmes. suggest. Il est par conséquent possible que la participation des femmes aux activités qui génèrent des biens et services qui concourent à l’amélioration du bien-être des popula- tions et contribuent au développement du continent soit probablement plus importante que ce que ces chiffres suggèrent. 30 African Statistical Yearbook 2011 / Annuaire Statistique pour l'Afrique 2011
  • 32.
    POPULATION 1-1. Total mid-year population - Population totale au milieu de l'année THOUSANDS MILLIERS Pays Country 1980 1990 2000 2004 2005 2006 2007 2008 2009 2010 Algeria 18 811 25 283 30 506 32 366 32 855 33 351 33 858 34 373 34 895 35 423 Algérie Angola 7 854 10 661 14 280 16 135 16 618 17 089 17 555 18 021 18 498 18 993 Angola Benin 3 560 4 795 6 659 7 611 7 868 8 128 8 393 8 662 8 935 9 212 Bénin Botswana 985 1 352 1 723 1 815 1 839 1 865 1 892 1 921 1 950 1 978 Botswana Burkina Faso 6 862 8 814 11 676 13 290 13 747 14 225 14 721 15 234 15 757 16 287 Burkina Faso Burundi 4 130 5 681 6 473 7 162 7 378 7 603 7 838 8 074 8 303 8 519 Burundi Cameroon 9 080 12 233 15 865 17 417 17 823 18 238 18 660 19 088 19 522 19 958 Cameroun Cape Verde 289 354 439 470 477 485 492 499 506 513 Cap-Vert Central African Republic 2 269 2 928 3 746 4 029 4 101 4 178 4 257 4 339 4 422 4 506 République Centrafricaine Chad 4 608 6 105 8 402 9 697 10 019 10 326 10 623 10 914 11 206 11 506 Tchad Comoros 329 438 552 603 616 631 646 661 676 691 Comores Congo 1 815 2 446 3 036 3 341 3 417 3 486 3 551 3 615 3 683 3 759 Congo Congo, Dem. Republic 27 170 37 016 50 829 57 337 59 077 60 800 62 523 64 257 66 020 67 827 Rép. Démocratique du Congo Côte d'Ivoire 8 419 12 610 17 281 18 839 19 245 19 673 20 123 20 591 21 075 21 571 Côte d'Ivoire Djibouti 340 560 730 791 805 820 834 849 864 879 Djibouti Egypt 44 433 57 785 70 174 75 718 77 154 78 602 80 061 81 527 82 999 84 474 Egypte Equatorial Guinea 220 379 529 592 609 625 642 659 676 693 Guinée Equatoriale Eritrea 2 469 3 158 3 657 4 307 4 473 4 631 4 781 4 927 5 073 5 224 Erythrée Ethiopia 35 409 48 292 65 515 72 746 74 661 76 628 78 646 80 713 82 825 84 976 Ethiopie Gabon 682 926 1 233 1 343 1 369 1 396 1 422 1 448 1 475 1 501 Gabon Gambia 616 896 1 302 1 481 1 526 1 571 1 616 1 660 1 705 1 751 Gambie Ghana 11 026 14 968 19 529 21 435 21 915 22 393 22 871 23 351 23 837 24 333 Ghana Guinea 4 628 6 147 8 384 9 041 9 221 9 412 9 615 9 833 10 069 10 324 Guinée Guinea-Bissau 836 1 022 1 304 1 438 1 473 1 507 1 541 1 575 1 611 1 647 Guinée-Bissau Kenya 16 261 23 433 31 441 34 890 35 817 36 772 37 755 38 765 39 802 40 863 Kenya Lesotho 1 296 1 602 1 889 1 977 1 995 2 014 2 032 2 049 2 067 2 084 Lesotho Liberia 1 910 2 167 2 824 3 225 3 334 3 471 3 627 3 793 3 955 4 102 Libéria Libyan Arab Jamahiriya 3 063 4 365 5 346 5 803 5 923 6 045 6 169 6 294 6 420 6 546 Jamahiriya Arabe Libyenne Madagascar 8 604 11 273 15 275 17 131 17 614 18 105 18 604 19 111 19 625 20 146 Madagascar Malawi 6 215 9 451 11 831 13 277 13 654 14 043 14 439 14 846 15 263 15 692 Malawi Mali 7 183 8 655 10 523 11 552 11 833 12 118 12 409 12 706 13 010 13 323 Mali 31 Mauritania 1 525 1 988 2 604 2 908 2 985 3 062 3 139 3 215 3 291 3 366 Mauritanie Mauritius 966 1 056 1 195 1 242 1 252 1 262 1 271 1 280 1 288 1 297 Maurice Morocco 19 567 24 808 28 827 30 152 30 495 30 853 31 224 31 606 31 993 32 381 Maroc Mozambique 12 138 13 543 18 249 20 311 20 834 21 353 21 869 22 383 22 894 23 406 Mozambique Namibia 1 013 1 417 1 824 1 971 2 009 2 048 2 089 2 130 2 171 2 212 Namibie Niger 5 922 7 904 11 031 12 636 13 102 13 604 14 140 14 704 15 290 15 891 Niger Nigeria 74 523 97 338 124 842 137 544 140 879 144 273 147 722 151 212 154 729 158 259 Nigéria Rwanda 5 197 7 150 7 958 8 820 8 992 9 210 9 455 9 721 9 998 10 277 Rwanda Sao Tome and Principe 95 116 140 150 153 155 158 160 163 165 Sao Tomé-et-Principe Senegal 5 636 7 538 9 902 10 989 11 281 11 583 11 893 12 211 12 534 12 861 Sénégal Seychelles 66 72 81 82 83 83 83 84 84 85 Seychelles Sierra Leone 3 261 4 084 4 228 4 926 5 107 5 271 5 420 5 560 5 696 5 836 Sierra Leone Somalia 6 434 6 596 7 394 8 164 8 354 8 544 8 733 8 926 9 133 9 359 Somalie South Africa 29 075 36 745 44 872 47 477 48 073 48 639 49 173 49 668 50 110 50 492 Afrique du Sud Sudan 20 509 27 091 34 904 37 900 38 698 39 545 40 432 41 348 42 272 43 192 Soudan Swaziland 603 864 1 080 1 115 1 124 1 137 1 151 1 168 1 185 1 202 Swaziland Tanzania 18 661 25 455 34 131 37 945 39 007 40 117 41 276 42 484 43 739 45 040 Tanzanie Togo 2 785 3 926 5 247 5 843 5 992 6 145 6 300 6 459 6 619 6 780 Togo Tunisia 6 457 8 215 9 452 9 790 9 878 9 971 10 069 10 169 10 272 10 374 Tunisie Uganda 12 655 17 731 24 433 27 779 28 699 29 652 30 638 31 657 32 710 33 796 Ouganda Zambia 5 774 7 910 10 467 11 472 11 738 12 019 12 314 12 620 12 935 13 257 Zambie Zimbabwe 7 282 10 461 12 455 12 492 12 475 12 459 12 449 12 463 12 523 12 644 Zimbabwe Africa 481 519 637 806 818 270 898 569 919 669 941 216 963 195 985 585 1008 354 1031 472 Afrique African Statistical Yearbook 2011 / Annuaire Statistique pour l'Afrique 2011
  • 33.
    POPULATION 1-2. Female (as % of Total) - Population féminine (% de la population totale) PERCENTAGE POURCENTAGE Pays Country 1980 1990 2000 2004 2005 2006 2007 2008 2009 2010 Algeria 49.8 49.6 49.5 49.5 49.5 49.5 49.5 49.5 49.5 49.5 Algérie Angola 50.8 50.7 50.7 50.7 50.7 50.7 50.7 50.7 50.7 50.7 Angola Benin 51.6 50.9 50.1 49.8 49.7 49.7 49.6 49.6 49.5 49.5 Bénin Botswana 51.2 50.8 50.5 50.3 50.2 50.2 50.1 50.1 50.0 50.0 Botswana Burkina Faso 50.5 50.7 50.5 50.2 50.2 50.1 50.1 50.1 50.1 50.0 Burkina Faso Burundi 51.9 51.3 51.5 51.2 51.2 51.1 51.1 51.0 51.0 50.9 Burundi Cameroon 50.4 50.3 50.2 50.1 50.1 50.1 50.1 50.0 50.0 50.0 Cameroun Cape Verde 54.1 53.1 52.5 52.4 52.3 52.3 52.3 52.2 52.2 52.2 Cap-Vert Central African Republic 50.9 50.9 50.9 50.9 50.9 50.9 50.9 50.9 50.9 50.9 République Centrafricaine Chad 50.8 50.6 50.4 50.4 50.4 50.3 50.3 50.3 50.3 50.3 Tchad Comoros 50.0 50.0 49.9 49.8 49.8 49.8 49.8 49.8 49.8 49.8 Comores Congo 50.3 50.2 50.2 50.2 50.1 50.1 50.1 50.1 50.1 50.1 Congo Congo, Dem. Republic 51.1 50.7 50.6 50.5 50.5 50.5 50.5 50.5 50.4 50.4 Rép. Démocratique du Congo Côte d'Ivoire 48.0 48.1 48.5 48.8 48.9 48.9 49.0 49.0 49.1 49.1 Côte d'Ivoire Djibouti 50.3 50.1 50.1 50.1 50.0 50.0 50.0 50.0 50.0 50.0 Djibouti Egypt 49.9 49.7 49.6 49.7 49.7 49.7 49.7 49.7 49.7 49.7 Egypte Equatorial Guinea 51.3 50.8 50.5 50.5 50.5 50.5 50.4 50.4 50.4 50.4 Guinée Equatoriale Eritrea 50.8 51.0 51.1 51.0 51.0 50.9 50.9 50.9 50.8 50.8 Erythrée Ethiopia 50.4 50.4 50.3 50.3 50.3 50.3 50.3 50.3 50.3 50.2 Ethiopie Gabon 50.8 50.5 50.4 50.2 50.2 50.1 50.1 50.1 50.0 50.0 Gabon Gambia 50.7 50.6 50.5 50.4 50.4 50.4 50.4 50.4 50.4 50.4 Gambie Ghana 49.5 49.5 49.4 49.3 49.3 49.3 49.3 49.3 49.3 49.3 Ghana Guinea 49.8 49.6 49.5 49.5 49.5 49.5 49.5 49.5 49.5 49.5 Guinée Guinea-Bissau 50.6 50.6 50.5 50.5 50.5 50.5 50.5 50.5 50.5 50.5 Guinée-Bissau Kenya 50.2 50.2 50.2 50.1 50.1 50.1 50.0 50.0 50.0 50.0 Kenya Lesotho 53.9 53.6 53.2 53.1 53.0 53.0 52.9 52.9 52.8 52.7 Lesotho Liberia 50.7 50.7 50.5 50.4 50.4 50.4 50.4 50.3 50.3 50.3 Libéria Libyan Arab Jamahiriya 46.6 47.3 47.9 48.1 48.1 48.2 48.2 48.3 48.3 48.3 Jamahiriya Arabe Libyenne Madagascar 49.7 49.9 50.1 50.2 50.2 50.2 50.2 50.2 50.2 50.2 Madagascar Malawi 51.6 50.9 50.5 50.4 50.4 50.4 50.4 50.3 50.3 50.3 Malawi 32 Mali 49.9 50.3 50.6 50.6 50.6 50.6 50.6 50.6 50.6 50.6 Mali Mauritania 49.8 49.8 49.5 49.4 49.4 49.3 49.3 49.3 49.3 49.3 Mauritanie Mauritius 50.7 50.1 50.3 50.3 50.3 50.4 50.4 50.4 50.4 50.5 Maurice Morocco 50.0 50.1 50.5 50.7 50.8 50.8 50.8 50.9 50.9 50.9 Maroc Mozambique 51.1 52.2 52.0 51.7 51.6 51.6 51.5 51.4 51.4 51.3 Mozambique Namibia 51.3 51.2 51.0 50.9 50.8 50.8 50.8 50.7 50.7 50.7 Namibie Niger 50.1 50.7 50.0 50.0 50.0 50.0 50.0 49.9 49.9 49.9 Niger Nigeria 50.3 50.3 50.1 50.0 50.0 49.9 49.9 49.9 49.9 49.9 Nigéria Rwanda 52.0 51.6 52.0 51.8 51.7 51.7 51.6 51.6 51.6 51.5 Rwanda Sao Tome and Principe 50.3 50.4 50.4 50.4 50.4 50.5 50.5 50.5 50.5 50.5 Sao Tomé-et-Principe Senegal 49.4 49.8 50.2 50.3 50.4 50.4 50.4 50.4 50.4 50.4 Sénégal Seychelles 49.8 50.1 49.6 49.6 49.7 49.7 49.7 49.7 49.7 49.7 Seychelles Sierra Leone 51.4 51.4 51.6 51.5 51.4 51.4 51.4 51.3 51.3 51.3 Sierra Leone Somalia 50.6 50.5 50.5 50.5 50.5 50.4 50.4 50.4 50.4 50.4 Somalie South Africa 50.3 50.5 50.8 50.8 50.8 50.8 50.7 50.7 50.7 50.7 Afrique du Sud Sudan 49.9 49.8 49.7 49.7 49.7 49.7 49.7 49.7 49.6 49.6 Soudan Swaziland 52.5 52.9 51.8 51.5 51.4 51.3 51.3 51.2 51.1 51.0 Swaziland Tanzania 50.6 50.5 50.4 50.3 50.2 50.2 50.2 50.2 50.1 50.1 Tanzanie Togo 50.7 50.6 50.6 50.5 50.5 50.5 50.5 50.5 50.5 50.5 Togo Tunisia 49.3 49.5 49.5 49.6 49.7 49.7 49.7 49.7 49.7 49.7 Tunisie Uganda 50.2 50.2 50.1 50.0 50.0 50.0 50.0 49.9 49.9 49.9 Ouganda Zambia 50.3 50.3 50.3 50.2 50.2 50.2 50.2 50.1 50.1 50.1 Zambie Zimbabwe 50.3 50.3 51.1 51.4 51.5 51.6 51.6 51.7 51.7 51.6 Zimbabwe Africa 50.3 50.2 50.2 50.2 50.2 50.2 50.2 50.1 50.1 50.1 Afrique African Statistical Yearbook 2011 / Annuaire Statistique pour l'Afrique 2011
  • 34.
    POPULATION 1-3. Economically active population- Population active Total (000) Female / Femmes (%) Country 2000 2005 2009 2010 2000 2005 2009 2010 Pays Algeria 11 107 13 197 14 842 15 196 28.3 30.2 31.6 31.9 Algérie Angola 6 238 7 326 8 275 8 533 46.6 46.7 46.8 46.9 Angola Benin 2 670 3 212 3 698 3 825 44.9 45.8 46.3 46.4 Bénin Botswana 799 903 996 1 019 47.1 47.4 47.4 47.4 Botswana Burkina Faso 5 214 6 275 7 137 7 366 47.8 47.3 47.1 47.1 Burkina Faso Burundi 3 139 3 865 4 572 4 733 53.0 52.8 52.6 52.6 Burundi Cameroon 5 991 6 918 7 731 7 945 39.2 39.7 40.1 40.2 Cameroun Cape Verde 156 187 214 221 39.7 41.8 43.2 43.4 Cap-Vert Central African Republic 1 704 1 887 2 073 2 125 46.2 46.5 46.5 46.6 République Centrafricaine Chad 3 276 3 810 4 280 4 400 45.6 45.2 45.2 45.2 Tchad Comoros 256 298 333 342 45.8 46.2 46.5 46.6 Comores Congo 1 256 1 451 1 593 1 637 43.0 43.3 43.7 43.8 Congo Congo, Dem. Republic 18 599 21 788 24 917 25 774 40.3 40.4 40.7 40.7 Rép. Démocratique du Congo Côte d'Ivoire 6 724 7 522 8 367 8 606 35.2 36.1 36.9 37.1 Côte d'Ivoire Djibouti 295 345 387 398 41.5 43.0 44.2 44.4 Djibouti Egypt 21 653 24 702 27 411 28 006 24.4 23.8 23.0 22.9 Egypte Equatorial Guinea 186 226 261 270 27.5 29.4 30.9 31.1 Guinée Equatoriale Eritrea 1 382 1 835 2 155 2 230 42.1 43.5 44.5 44.7 Erythrée Ethiopia 28 996 34 871 39 962 41 310 45.2 47.0 47.9 48.0 Ethiopie Gabon 537 628 711 732 44.6 45.6 46.7 46.9 Gabon Gambia 581 681 765 788 46.1 46.1 46.2 46.3 Gambie Ghana 8 552 9 851 10 944 11 232 48.4 48.9 49.2 49.2 Ghana Guinea 3 952 4 397 4 850 4 988 46.7 46.8 46.9 46.9 Guinée Guinea-Bissau 541 605 660 676 42.7 42.5 42.4 42.4 Guinée-Bissau Kenya 14 321 16 760 18 712 19 233 46.6 46.7 46.7 46.7 Kenya Lesotho 809 883 935 949 52.0 52.4 52.5 52.4 Lesotho Liberia 1 123 1 340 1 611 1 677 47.2 47.4 47.6 47.7 Libéria Libyan Arab Jamahiriya 1 831 2 157 2 369 2 418 21.3 22.3 22.5 22.5 Jamahiriya Arabe Libyenne Madagascar 7 270 8 505 9 683 10 007 48.7 49.0 49.2 49.2 Madagascar 33 Malawi 4 954 5 637 6 311 6 510 50.1 49.9 49.7 49.7 Malawi Mali 2 959 3 388 3 767 3 869 35.9 36.6 37.4 37.6 Mali Mauritania 1 030 1 232 1 395 1 435 40.8 41.4 41.9 42.1 Mauritanie Mauritius 532 554 573 577 34.1 35.5 36.1 36.3 Maurice Morocco 10 217 11 117 11 982 12 190 26.4 25.8 25.8 25.8 Maroc Mozambique 8 909 10 041 11 003 11 261 53.1 52.5 52.0 51.8 Mozambique Namibia 601 691 783 807 45.1 46.0 46.5 46.6 Namibie Niger 3 548 4 198 4 803 4 973 31.2 31.6 31.6 31.6 Niger Nigeria 39 222 44 906 49 998 51 349 34.6 34.8 35.1 35.2 Nigéria Rwanda 3 708 4 399 4 961 5 105 53.1 53.1 52.9 52.9 Rwanda Sao Tome and Principe 46 53 58 59 37.1 37.4 38.0 38.1 Sao Tomé-et-Principe Senegal 4 089 4 769 5 408 5 580 42.1 42.8 43.4 43.5 Sénégal Seychelles 36 38 39 ... 47.2 47.4 48.7 ... Seychelles Sierra Leone 1 663 1 952 2 141 2 188 52.1 51.7 51.4 51.3 Sierra Leone Somalia 2 944 3 267 3 541 3 627 41.7 41.2 40.9 40.8 Somalie South Africa 15 595 17 587 19 153 19 419 43.5 44.0 43.7 43.6 Afrique du Sud Sudan 10 485 11 997 13 472 13 885 27.9 28.8 29.4 29.6 Soudan Swaziland 373 410 457 470 41.5 42.5 43.4 43.6 Swaziland Tanzania 16 767 19 143 21 386 22 005 49.9 49.6 49.4 49.3 Tanzanie Togo 2 182 2 594 2 962 3 059 42.0 42.8 43.5 43.6 Togo Tunisia 3 179 3 503 3 786 3 850 24.7 26.1 26.7 26.9 Tunisie Uganda 10 497 12 323 14 127 14 631 47.0 46.7 46.6 46.5 Ouganda Zambia 4 024 4 400 4 816 4 942 44.9 44.1 43.3 43.2 Zambie Zimbabwe 5 109 5 037 5 026 5 107 46.9 47.4 47.5 47.4 Zimbabwe Africa 311 830 359 662 402 391 413 532 40.3 40.7 41.0 41.0 Afrique African Statistical Yearbook 2011 / Annuaire Statistique pour l'Afrique 2011
  • 35.
    EDUCATION 1-4. Adult Illiteracy Rate ( % ) - Taux d'analphabetisme des adultes (% ) PERCENTAGE POURCENTAGE 2005 2006 2008 Pays Country MF M F MF M F MF M F Algeria 26.3 16.9 35.8 25.4 16.3 34.7 ... ... ... Algérie Angola … … … … … … 30.4 17.2 43.0 Angola Benin 61.1 48.3 73.8 60.3 47.6 72.9 59.2 46.5 71.9 Bénin Botswana 18.6 18.6 18.6 17.9 17.9 17.8 16.7 16.9 16.5 Botswana Burkina Faso 76.4 68.6 83.4 74.0 65.7 82.1 ... ... ... Burkina Faso Burundi … … … … … … 34.1 27.7 40.1 Burundi Cameroon … … … … … … 24.1 16.0 32.2 Cameroun Cape Verde 17.9 11.7 23.3 17.0 11.1 22.2 15.9 10.4 20.7 Cap-Vert Central African Republic … … … … … … 45.4 31.2 58.9 République Centrafricaine Chad … … … … … … 67.3 56.2 78.1 Tchad Comoros 26.7 21.1 32.2 25.8 20.4 31.2 26.4 20.7 32.2 Comores Congo 14.8 9.0 20.4 14.0 8.4 19.3 ... ... ... Congo Congo, Dem. Republic … … … … … … 33.4 22.5 43.9 Rép. Démocratique du Congo Côte d'Ivoire … … … … … … 45.4 35.8 55.7 Côte d'Ivoire Djibouti … … … … … … ... ... ... Djibouti Egypt 28.6 17.0 40.6 28.6 16.7 40.3 ... ... ... Egypte Equatorial Guinea … … … … … … 7.0 3.1 10.9 Guinée Equatoriale Eritrea … … … … … … 34.7 23.0 45.5 Erythrée Ethiopia … … … … … … 64.1 50.0 77.2 Ethiopie Gabon 15.4 11.0 19.7 14.6 10.4 18.7 13.0 9.1 16.8 Gabon Gambia … … … … … … 54.7 43.3 65.7 Gambie Ghana 36.6 29.4 43.8 35.8 28.8 42.8 34.2 27.7 40.7 Ghana Guinea … … … … … … 62.0 50.4 73.6 Guinée Guinea-Bissau 39.0 27.6 49.8 37.2 26.2 47.6 49.0 33.9 63.5 Guinée-Bissau Kenya … … … … … … 13.5 9.7 17.2 Kenya Lesotho … … … … … … 10.5 17.4 4.9 Lesotho Liberia 46.8 41.0 52.5 45.6 40.4 50.8 41.9 36.7 47.0 Libéria Libyan Arab Jamahiriya 14.4 6.2 23.2 13.8 5.9 22.4 11.6 5.1 18.7 Jamahiriya Arabe Libyenne Madagascar … … … … … … 29.3 23.5 34.7 Madagascar Malawi 30.1 21.8 38.0 29.1 21.3 36.7 27.2 19.8 34.2 Malawi 34 Mali 77.5 69.3 84.8 77.1 68.9 84.4 ... ... ... Mali Mauritania 45.4 37.5 53.3 44.8 37.1 52.5 43.2 35.9 50.5 Mauritanie Mauritius 13.4 10.3 16.4 13.0 10.1 15.9 12.5 9.6 15.2 Maurice Morocco 46.2 32.8 58.9 45.3 32.0 57.8 43.6 30.6 55.9 Maroc Mozambique 56.8 43.2 68.9 56.2 43.0 68.0 46.0 30.5 59.9 Mozambique Namibia 12.8 11.9 13.6 12.4 11.6 13.1 11.8 11.3 12.3 Namibie Niger 71.3 57.1 84.9 70.2 56.2 84.2 ... ... ... Niger Nigeria 30.0 21.2 38.6 29.0 20.6 37.2 39.9 28.5 51.2 Nigéria Rwanda … … … … … … 29.7 25.2 33.9 Rwanda Sao Tome and Principe 13.0 6.9 18.9 12.5 6.7 18.1 11.7 6.5 16.7 Sao Tomé-et-Principe Senegal 58.6 47.7 69.2 58.0 47.3 68.5 ... ... ... Sénégal Seychelles … … … … … … 8.2 8.6 7.7 Seychelles Sierra Leone 64.0 52.0 75.4 62.9 51.0 74.3 60.2 48.3 71.1 Sierra Leone Somalia … … … … … … ... ... ... Somalie South Africa 12.9 12.0 13.8 12.4 11.5 13.3 11.0 10.1 11.9 Afrique du Sud Sudan … … … … … … 30.7 21.0 40.4 Soudan Swaziland … … … … … … 13.5 12.6 14.4 Swaziland Tanzania 28.4 21.2 35.5 28.0 21.1 34.8 27.4 21.0 33.7 Tanzanie Togo … … … … … … 35.1 23.4 46.3 Togo Tunisia 24.0 14.9 33.1 23.1 14.2 32.0 22.4 13.6 29.0 Tunisie Uganda 28.4 19.4 37.3 27.4 18.8 35.9 25.4 17.6 33.2 Ouganda Zambia … … … … … … 29.3 19.4 39.0 Zambie Zimbabwe 9.9 6.6 13.1 9.3 6.3 12.4 8.6 5.6 11.2 Zimbabwe African Statistical Yearbook 2011 / Annuaire Statistique pour l'Afrique 2011
  • 36.
    EDUCATION 1-5. Gross Enrolment Ratio in primary - Taux brut de scolarisation au primaire PERCENTAGE POURCENTAGE 2000 2005 2006-10 Pays Country MF M F MF M F MF M F Algeria 107.8 112.3 103.1 111.7 115.8 107.3 107.7 111.0 104.2 Algérie Angola ... ... ... ... ... ... 127.7 141.1 114.4 Angola Benin 86.0 101.3 70.3 104.3 115.7 92.5 121.9 129.2 114.2 Bénin Botswana 106.1 106.1 106.0 108.7 109.5 107.9 109.4 110.9 107.9 Botswana Burkina Faso 44.6 51.9 37.0 57.8 64.0 51.4 79.2 82.9 75.4 Burkina Faso Burundi 60.7 67.5 54.0 87.9 94.6 81.2 146.6 149.1 144.2 Burundi Cameroon 86.0 92.8 79.2 108.1 117.6 98.4 113.8 122.0 105.5 Cameroun Cape Verde 119.6 121.5 117.7 108.8 111.6 106.0 98.1 101.8 94.4 Cap-Vert Central African Republic ... ... ... 64.7 76.8 52.8 88.6 103.8 73.6 République Centrafricaine Chad 66.4 82.4 50.3 76.9 91.7 61.9 89.7 105.2 74.2 Tchad Comoros 111.5 120.3 102.4 121.5 129.1 113.7 119.4 124.6 114.1 Comores Congo 85.0 88.1 81.8 113.8 117.7 109.9 119.5 123.5 115.5 Congo Congo, Dem. Republic ... ... ... ... ... ... 90.3 97.5 83.0 Rép. Démocratique du Congo Côte d'Ivoire 72.6 83.1 62.1 ... ... ... 73.6 81.2 66.0 Côte d'Ivoire Djibouti 32.5 37.5 27.5 41.5 45.7 37.3 54.5 57.6 51.3 Djibouti Egypt 93.1 96.6 89.4 96.3 99.1 93.3 99.7 102.1 97.1 Egypte Equatorial Guinea 102.6 105.0 100.2 95.0 97.3 92.7 81.9 83.6 80.1 Guinée Equatoriale Eritrea 57.6 63.4 51.7 67.9 75.2 60.5 48.3 52.8 43.8 Erythrée Ethiopia 55.1 66.9 43.3 81.6 89.4 73.8 102.5 107.1 97.8 Ethiopie Gabon 135.2 135.2 135.2 ... ... ... … … … Gabon Gambia 91.0 97.3 84.6 88.2 87.2 89.3 84.7 83.8 85.5 Gambie Ghana 83.5 86.3 80.5 88.4 90.0 86.8 105.2 105.7 104.6 Ghana Guinea 59.7 70.5 48.5 83.7 91.9 75.1 89.8 96.7 82.8 Guinée Guinea-Bissau 80.4 96.0 64.8 115.6 ... ... 119.7 … … Guinée-Bissau Kenya 95.0 95.6 94.3 106.6 108.7 104.4 112.7 113.9 111.4 Kenya Lesotho 113.7 111.6 115.8 114.0 114.1 113.8 104.4 104.6 104.2 Lesotho Liberia 113.4 131.6 95.1 ... ... ... 90.6 95.6 85.6 Libéria Libyan Arab Jamahiriya 118.7 119.7 117.6 106.3 107.2 105.2 110.3 113.0 107.5 Jamahiriya Arabe Libyenne Madagascar 103.8 105.8 101.7 144.9 148.0 141.7 160.4 162.3 158.5 Madagascar 35 Malawi 135.1 137.5 132.6 117.3 115.8 118.8 119.3 117.6 121.1 Malawi Mali 58.7 67.5 49.8 79.6 89.2 69.7 94.7 102.9 86.3 Mali Mauritania 86.5 86.7 86.2 97.5 94.8 100.4 104.4 100.6 108.4 Mauritanie Mauritius 103.2 103.3 103.2 98.8 98.8 98.9 100.0 100.0 100.1 Maurice Morocco 92.0 99.9 83.8 106.8 112.7 100.7 107.4 111.9 102.7 Maroc Mozambique 74.9 85.4 64.4 101.4 110.0 92.7 115.7 121.7 109.6 Mozambique Namibia 115.8 115.4 116.1 112.3 112.3 112.3 112.1 113.0 111.2 Namibie Niger 32.2 38.0 26.0 49.3 57.0 41.3 66.6 73.1 59.8 Niger Nigeria 95.5 105.9 84.8 99.4 108.1 90.4 93.1 99.2 86.8 Nigéria Rwanda 105.4 107.2 103.6 137.3 135.9 138.6 150.7 149.8 151.4 Rwanda Sao Tome and Principe ... ... ... 128.1 130.2 126.1 130.4 130.6 130.1 Sao Tomé-et-Principe Senegal 68.2 73.1 63.2 79.0 80.5 77.5 83.7 82.1 85.4 Sénégal Seychelles 110.8 109.9 111.7 108.6 109.8 107.3 106.2 105.0 107.4 Seychelles Sierra Leone 69.5 ... ... ... ... ... 157.7 167.8 148.0 Sierra Leone Somalia ... ... ... ... ... ... 32.6 42.0 23.1 Somalie South Africa 106.1 108.7 103.4 104.9 107.1 102.8 101.2 103.2 99.1 Afrique du Sud Sudan 46.7 50.3 42.9 54.0 57.7 50.2 74.0 77.8 70.0 Soudan Swaziland 93.9 96.6 91.2 101.1 104.6 97.6 107.9 111.9 103.8 Swaziland Tanzania 68.1 68.5 67.7 104.7 106.5 102.8 104.9 104.9 104.9 Tanzanie Togo 108.6 122.2 95.0 106.4 115.1 97.6 115.2 118.8 111.5 Togo Tunisia 115.3 118.1 112.4 112.1 113.6 110.4 107.1 108.3 105.8 Tunisie Uganda 127.5 131.2 123.7 119.3 119.4 119.1 121.6 120.8 122.4 Ouganda Zambia 81.7 84.5 78.9 115.3 117.9 112.7 112.9 113.5 112.4 Zambie Zimbabwe 100.1 ... ... ... ... ... 103.6 … … Zimbabwe Africa 85.8 92.0 79.2 96.9 101.9 91.7 102.7 106.3 99.0 Afrique African Statistical Yearbook 2011 / Annuaire Statistique pour l'Afrique 2011
  • 37.
    EDUCATION 1-6. Gross Enrolment Ratio in secondary - Taux brut de scolarisation au secondaire PERCENTAGE POURCENTAGE 2000 2005 2006-10 Pays Country MF M F MF M F MF M F Algeria ... ... ... 83.2 80.3 86.3 … … … Algérie Angola 14.3 15.7 12.9 ... ... ... 15.2 … … Angola Benin 22.6 30.7 14.3 36.3 46.1 26.1 … … … Bénin Botswana 76.2 74.3 78.1 78.5 76.7 80.4 81.5 79.4 83.7 Botswana Burkina Faso 10.4 12.5 8.2 14.0 16.3 11.6 21.4 24.3 18.5 Burkina Faso Burundi ... ... ... 13.2 15.2 11.3 21.2 24.6 17.8 Burundi Cameroon 27.2 ... ... 27.2 30.3 23.9 41.5 45.2 37.7 Cameroun Cape Verde ... ... ... 68.4 65.7 71.2 81.5 74.7 88.2 Cap-Vert Central African Republic ... ... ... ... ... ... 13.6 17.5 9.8 République Centrafricaine Chad 10.6 16.5 4.7 15.8 23.5 8.1 24.1 34.1 14.0 Tchad Comoros 29.0 31.9 26.1 45.8 52.1 39.3 … … … Comores Congo 35.0 41.0 28.9 ... ... ... … … … Congo Congo, Dem. Republic ... ... ... ... ... ... 36.7 47.0 26.2 Rép. Démocratique du Congo Côte d'Ivoire 23.1 29.9 16.2 ... ... ... … … … Côte d'Ivoire Djibouti 13.8 16.6 10.9 22.8 27.3 18.1 30.5 35.1 25.8 Djibouti Egypt 75.8 78.6 72.8 ... ... ... … … … Egypte Equatorial Guinea 29.8 41.4 18.2 ... ... ... … … … Guinée Equatoriale Eritrea 24.6 29.1 20.2 30.3 38.2 22.5 31.8 37.1 26.4 Erythrée Ethiopia 14.4 17.3 11.6 24.9 31.2 18.6 34.4 38.8 30.0 Ethiopie Gabon 48.3 51.9 44.7 ... ... ... … … … Gabon Gambia 34.9 41.9 27.9 51.8 56.9 46.7 50.3 51.2 49.5 Gambie Ghana 39.7 43.7 35.6 46.1 50.1 42.0 57.2 60.5 53.6 Ghana Guinea 15.9 22.9 8.6 30.1 39.7 20.2 37.0 46.3 27.4 Guinée Guinea-Bissau 19.9 25.6 14.1 33.9 ... ... 35.9 … … Guinée-Bissau Kenya 39.3 40.2 38.3 47.6 48.6 46.5 59.5 62.4 56.5 Kenya Lesotho 30.4 26.3 34.5 37.4 33.0 41.7 45.0 37.8 52.3 Lesotho Liberia 36.9 43.1 30.6 ... ... ... … … … Libéria Libyan Arab Jamahiriya ... ... ... 103.0 94.3 112.0 93.5 86.3 101.0 Jamahiriya Arabe Libyenne 36 Madagascar ... ... ... 22.0 22.4 21.5 31.5 32.5 30.6 Madagascar Malawi 31.0 35.5 26.6 27.3 30.1 24.5 29.5 31.5 27.6 Malawi Mali 17.6 22.7 12.5 25.9 32.2 19.6 38.3 46.4 30.1 Mali Mauritania 18.4 20.8 15.8 23.2 24.4 21.9 24.5 25.9 22.9 Mauritanie Mauritius 76.9 78.1 75.7 86.9 87.2 86.5 87.2 86.1 88.3 Maurice Morocco 38.1 42.4 33.7 49.2 53.4 44.8 55.8 60.1 51.4 Maroc Mozambique 6.1 7.5 4.7 13.2 15.7 10.8 25.5 28.0 22.9 Mozambique Namibia 60.7 57.2 64.1 63.3 59.3 67.3 65.8 60.7 70.9 Namibie Niger 6.6 8.3 5.0 9.6 11.9 7.4 13.3 16.0 10.5 Niger Nigeria 24.9 27.3 22.4 35.1 38.6 31.5 30.5 34.3 26.5 Nigéria Rwanda 10.7 11.0 10.3 15.8 16.8 14.8 26.7 27.5 26.0 Rwanda Sao Tome and Principe ... ... ... 45.3 43.7 46.9 51.0 50.3 51.8 Sao Tomé-et-Principe Senegal 15.9 19.2 12.5 22.6 25.9 19.3 30.1 33.6 26.5 Sénégal Seychelles 104.3 101.1 107.7 105.8 103.7 108.0 105.0 102.6 107.5 Seychelles Sierra Leone ... ... ... ... ... ... 34.6 41.8 27.7 Sierra Leone Somalia ... ... ... ... ... ... 7.7 10.6 4.9 Somalie South Africa 85.5 81.3 89.7 92.6 89.8 95.3 93.9 91.6 96.1 Afrique du Sud Sudan 24.8 ... ... 31.2 32.2 30.1 38.0 40.3 35.5 Soudan Swaziland 41.8 41.7 41.9 46.1 45.9 46.3 53.3 56.0 50.5 Swaziland Tanzania 6.3 7.0 5.7 11.0 11.9 10.0 27.4 30.7 24.1 Tanzanie Togo 30.7 42.6 18.9 42.5 55.7 29.4 41.3 54.1 28.5 Togo Tunisia 75.9 73.9 78.0 85.3 81.4 89.3 91.8 88.3 95.6 Tunisie Uganda 16.1 18.1 14.0 18.7 20.6 16.7 27.4 29.8 24.9 Ouganda Zambia ... ... ... ... ... ... … … … Zambie Zimbabwe ... ... ... ... ... ... … … … Zimbabwe Africa 32.8 35.9 30.7 36.7 39.4 34.0 37.8 41.8 33.8 Afrique African Statistical Yearbook 2011 / Annuaire Statistique pour l'Afrique 2011
  • 38.
    EDUCATION 1-7. Pupils teachers ratio - Ratios élèves enseignants PERCENTAGE POURCENTAGE Primary - Primaire Secondary - Secondaire Pays Country 2000 2003 2005 2009 2000 2003 2005 2009 Algeria 28.4 27.5 25.4 23.2 ... 31.5 21.0 20.8 Algérie Angola ... ... ... ... 18.8 19.0 ... ... Angola Benin 52.6 62.2 46.8 44.6 23.4 17.7 24.0 23.9 Bénin Botswana 26.7 26.1 24.2 25.4 17.3 18.4 13.6 14.0 Botswana Burkina Faso 48.9 44.7 47.2 48.9 ... 24.7 31.0 30.3 Burkina Faso Burundi 55.4 49.9 48.7 53.7 ... 18.8 22.8 29.6 Burundi Cameroon 51.9 57.1 47.8 46.0 ... ... 16.2 16.2 Cameroun Cape Verde 28.7 27.9 26.0 24.4 ... 23.7 23.1 18.2 Cap-Vert Central African Republic ... ... 88.6 100.2 ... ... ... 76.1 République Centrafricaine Chad 68.6 72.1 63.2 62.4 32.2 32.2 33.5 32.9 Tchad Comoros 36.8 35.9 35.0 30.2 ... 11.3 13.8 13.8 Comores Congo 60.5 65.2 82.8 51.8 ... 28.1 34.0 34.3 Congo Congo, Dem. Republic ... 34.0 ... 39.0 14.0 15.0 ... 16.6 Rép. Démocratique du Congo Côte d'Ivoire 45.0 42.4 ... 41.9 ... ... ... 29.4 Côte d'Ivoire Djibouti 32.0 34.5 34.6 34.0 ... ... ... 34.3 Djibouti Egypt 23.0 22.2 25.6 27.1 16.9 17.3 17.0 16.6 Egypte Equatorial Guinea 43.4 32.0 ... 28.0 23.1 ... ... Guinée Equatoriale Eritrea 47.5 46.7 47.5 47.4 54.1 53.5 51.3 49.3 Erythrée Ethiopia 67.3 ... ... 62.3 ... ... 46.2 Ethiopie Gabon 46.6 36.0 36.0 ... ... ... ... Gabon Gambia 37.4 39.4 36.5 34.4 22.8 21.2 23.2 24.1 Gambie Ghana 33.8 31.3 32.8 32.2 19.1 18.2 18.8 17.1 Ghana Guinea 45.6 45.0 44.9 44.1 ... 31.3 34.4 33.3 Guinée Guinea-Bissau 44.1 ... ... ... 14.4 ... ... Guinée-Bissau Kenya 34.4 38.0 44.8 46.5 ... 29.4 24.8 29.9 Kenya Lesotho 47.9 46.2 41.6 37.0 22.1 23.8 26.6 16.9 Lesotho Liberia 38.3 ... ... 23.9 26.4 ... ... 13.3 Libéria Libyan Arab Jamahiriya ... ... ... ... ... ... ... 4.8 Jamahiriya Arabe Libyenne Madagascar M d 48.0 48 0 51.6 51 6 53.6 53 6 47.2 47 2 ... ... 21.6 21 6 26.7 26 7 Madagascar M d Malawi 75.1 ... 84.8 92.8 ... ... 25.5 27.8 Malawi 37 Mali 65.3 57.3 54.4 51.4 29.0 ... 23.5 Mali Mauritania 45.0 41.1 40.3 37.2 26.3 26.1 31.0 26.6 Mauritanie Mauritius 26.1 23.1 22.3 21.7 19.4 18.6 17.2 16.4 Maurice Morocco 28.8 28.2 27.1 26.5 17.0 18.1 19.0 18.7 Maroc Mozambique 64.0 ... 66.3 64.1 ... ... 32.2 36.7 Mozambique Namibia 31.6 31.6 30.8 29.4 24.1 25.2 25.1 24.5 Namibie Niger 40.7 41.7 43.7 40.7 23.4 28.6 27.4 27.9 Niger Nigeria 42.9 35.8 36.9 46.3 30.4 38.6 38.2 28.4 Nigéria Rwanda 54.0 59.9 65.9 67.7 ... 26.8 23.7 17.9 Rwanda Sao Tome and Principe ... 32.1 30.8 30.8 ... ... 21.7 21.7 Sao Tomé-et-Principe Senegal 50.9 46.0 41.7 36.4 27.3 25.6 26.4 26.4 Sénégal Seychelles 14.7 14.0 13.7 13.1 14.5 13.7 12.8 13.8 Seychelles Sierra Leone ... ... ... 43.7 ... ... ... 23.9 Sierra Leone Somalia ... ... ... 30.8 ... ... ... ... Somalie South Africa 33.5 33.8 29.6 31.0 28.1 29.8 32.9 30.8 Afrique du Sud Sudan ... 28.1 29.0 36.7 ... 26.6 21.5 22.2 Soudan Swaziland 31.3 31.2 32.9 32.4 17.3 16.9 16.8 19.1 Swaziland Tanzania 41.4 56.9 55.9 52.4 ... ... ... Tanzanie Togo 37.5 35.5 33.6 39.1 31.5 33.8 30.5 35.5 Togo Tunisia 23.2 21.5 20.0 17.3 19.0 ... 17.2 15.2 Tunisie Uganda 59.4 52.4 49.9 49.9 17.7 17.6 19.0 18.8 Ouganda Zambia 57.8 ... 65.9 60.5 18.4 ... 22.7 23.2 Zambie Zimbabwe 37.0 38.6 ... 38.2 24.7 22.3 ... ... Zimbabwe Africa 39.3 36.3 38.1 ... 21.2 24.4 23.4 ... Afrique African Statistical Yearbook 2011 / Annuaire Statistique pour l'Afrique 2011
  • 39.
    HEALTH - SANTE 1-8. Primary health care - Soins de santé primaire Immunization / Vaccination (%) Access to safe water Diphtheria Tuberculosis - Measles - - Accès à l'eau (DPT3) - PERCENTAGE Tuberculose Rougeole POURCENTAGE potable Diphtérie Pays Country 1990 2008 1990 2009 1990 2009 1990 2009 Algeria 94 83 99 99 89 93 83 88 Algérie Angola 36 50 48 83 24 73 38 77 Angola Benin 56 75 92 99 74 83 79 72 Bénin Botswana 93 95 93 99 92 96 87 94 Botswana Burkina Faso 41 76 95 92 66 82 79 75 Burkina Faso Burundi 70 72 97 98 86 92 74 91 Burundi Cameroon 50 74 76 90 48 80 56 74 Cameroun Cape Verde ... 84 97 99 88 99 79 96 Cap-Vert Central African Republic 58 67 96 74 82 54 82 62 République Centrafricaine Chad 38 50 59 40 20 23 32 23 Tchad Comoros 87 95 99 80 94 83 87 79 Comores Congo ... 71 90 90 79 91 75 76 Congo Congo, Dem. Republic ... 46 65 80 35 77 38 76 Rép. Démocratique du Congo Côte d'Ivoire 76 80 62 95 54 81 56 67 Côte d'Ivoire Djibouti 77 92 81 90 85 89 85 73 Djibouti Egypt 90 99 89 98 87 97 86 95 Egypte Equatorial Guinea ... … 94 73 77 33 88 51 Guinée Equatoriale Eritrea 43 61 99 … 99 … 95 Ethiopia 17 38 64 76 49 79 38 75 Ethiopie Gabon ... 87 96 89 78 45 76 55 Gabon Gambia 74 92 98 94 92 98 86 96 Gambie Ghana 54 82 71 99 58 94 61 93 Ghana Guinea 52 71 50 81 17 57 35 51 Guinée Guinea-Bissau ... 61 90 89 61 68 53 76 Guinée-Bissau Kenya 43 59 92 75 84 75 78 74 Kenya Lesotho 61 85 89 96 82 83 80 85 Lesotho Liberia 58 68 80 64 64 Libéria Libyan Arab Jamahiriya 54 … 90 99 84 98 89 98 Jamahiriya Arabe Libyenne 38 Madagascar 31 41 67 73 46 78 47 64 Madagascar Malawi 40 80 97 95 87 93 81 92 Malawi Mali 29 56 82 86 42 74 43 71 Mali Mauritania 30 49 79 81 33 64 38 59 Mauritanie Mauritius 99 99 87 95 85 99 76 99 Maurice Morocco 74 81 96 99 81 99 79 98 Maroc Mozambique 36 47 59 87 46 76 59 77 Mozambique Namibia 64 92 85 … 83 … 76 Namibie Niger 35 48 50 78 22 70 25 73 Niger Nigeria 47 58 80 53 56 42 54 41 Nigéria Rwanda 68 65 92 93 84 97 83 92 Rwanda Sao Tome and Principe ... 89 99 99 92 98 71 90 Sao Tomé-et-Principe Senegal 61 69 90 97 51 86 51 79 Sénégal Seychelles ... … 98 96 99 99 86 97 Seychelles Sierra Leone ... 49 … 95 … 75 … 71 Sierra Leone Somalia ... 30 31 29 19 31 30 24 Somalie South Africa 83 91 57 81 72 69 79 62 Afrique du Sud Sudan 65 57 77 82 62 84 57 82 Soudan Swaziland ... 69 96 99 89 95 85 95 Swaziland Tanzania 55 54 85 93 78 85 80 91 Tanzanie Togo 49 60 99 91 77 89 73 84 Togo Tunisia 81 94 96 98 93 99 93 98 Tunisie Uganda 43 67 75 90 45 64 52 68 Ouganda Zambia 49 60 97 92 91 81 90 85 Zambie Zimbabwe 78 82 91 91 88 73 87 76 Zimbabwe Africa 56 65 77 80 61 73 61 71 Afrique African Statistical Yearbook 2011 / Annuaire Statistique pour l'Afrique 2011
  • 40.
    39 African Statistical Yearbook2011 / Annuaire Statistique pour l'Afrique 2011
  • 41.
    2 40 Section Economic Statistics Statistiques économiques African Statistical Yearbook 2011 / Annuaire Statistique pour l'Afrique 2011
  • 42.
    2011 Africa: Macroeconomic Afrique : Tendances Trends in 2010 macroéconomiques en 2010 Following the world economic recovery, although timid Avec la reprise de l'économie mondiale, pourtant timide in the advanced countries but particularly robust in the dans les pays avancés mais particulièrement robuste dans emerging economies, Africa achieved average growth of les économies émergentes, l’Afrique a affiché un taux de 4.9% in 2010 compared with only 3.1% in 2009. The lower croissance moyen de 4.9% en 2010 comparé à seulement growth in 2009 had been caused by the global recession 3.1% de 2009. Cette croissance plus faible de 2009 avait during which Africa has, however, shown a high degree of été influencée par la récession économique mondiale, une resilience. Africa´s economic recovery, which got under- phase durant laquelle l’Afrique a néanmoins montré un way around mid-2009, strengthened during the course of degré élevé de résilience. Le rétablissement économique the year 2010, in line with the upturn of the international en Afrique, qui a commencé vers le milieu de 2009, s'est trade and the rebound of commodity prices. consolidé pendant l’année 2010, en lien avec la reprise du commerce international et le rebond des cours de matières premières. Graph 1 : Countries growth in 2009/2010 12.0 Graphique 1 : Croissance par pays en 2009/2010 9.0 12.0 6.0 Growth in 2010 9.0 Croissance en 2010 3.0 6.0 0.0 3.0 -6.0 -3.0 0.0 3.0 6.0 9.0 12.0 -3.0 0.0 -6.0 -3.0 0.0 3.0 6.0 9.0 12.0 -6.0 -3.0 Growth in 2009 41 -6.0 Croissance en 2009 In most countries growth was higher in 2010 than in 2009 and only in a few it was lower (points under the 45° line in Graph 1). Furthermore, no country registered a contrac- Dans la plupart des pays, la croissance en 2010 a été tion of its output 2010 compared to nine cases in 2009. plus élevée qu’en 2009 et n'a été plus faible que pour In addition, the main regions of the continent achieved peu de pays (les points au dessous de la ligne à 45° dans growth rates, close to their trend levels recorded dur- le graphique 1). En outre, aucun pays n’a enregistré une ing the decade 2000. The only exception was Southern contraction de son activité en 2010 contre neuf cas en Africa, where growth in 2010 remained below the earlier 2009. En plus, les principales régions du continent ont trend (see Graph 2). This region had been most affected réalisé des taux de croissance proches de leurs niveaux by the global recession and had experienced slightly tendanciels enregistrés durant la décennie 2000. A l’ex- negative growth in 2009. A major tendency was also ception de l’Afrique australe, où la croissance de 2010 est confirmed in 2010, namely the increasingly homogeneous demeurée plutôt au-dessous de sa tendance de moyen 10.0 Graph 2. Africa - Real GDP growth (in %) 10.0 Graphique 2. Afrique - Croissance du PIB réel (en %) in 2010 en 2010 average over 2000-2009 moyenne sur 2000-2009 6.6 6.7 6.6 6.7 7.5 7.5 5.2 4.9 5.2 5.0 4.5 4.7 4.6 4.7 5.0 5.0 6.2 6.7 6.2 6.2 2.5 4.9 4.7 4.6 2.5 4.8 4.4 4.7 3.3 3.4 0.0 0.0 AFRICA Central East Africa North Southern West Africa AFRIQUE Afrique Afrique de Afrique du Afrique Afrique de Africa Africa Africa Centrale l'Est Nord Australe l'Ouest African Statistical Yearbook 2011 / Annuaire Statistique pour l'Afrique 2011
  • 43.
    Africa: Macroeconomic Afrique : Tendances Trends in 2010 macroéconomiques en 2010 character of growth between countries, as illustrated by terme (voir graphique 2). Cette région avait été la plus the dispersion of countries real GDP growth rates, which affectée par la récession mondiale et avait enregistré une has declined significantly during the second half of the croissance légèrement négative en 2009. Une tendance decade. In contrast, the pace of the recovery in 2010 majeure a été également confirmée en 2010, à savoir le differed across countries and regions. The South African caractère de plus en plus homogène de la croissance economy recovered in 2010 with growth of 2.8%, after entre les pays, comme illustré par la dispersion de taux de negative growth of 1.7% in 2009 caused by the repercus- croissance du PIB réel par pays, qui a diminué de manière sions of the global recession. South Africa´s recovery significative pendant la deuxième moitié de la décennie. contributed to the rebound of the Southern Africa region, which grew by 3.3% in 2010 after having contracted 0.5% En revanche, le rythme de la reprise en 2010 a été variable in 2009. Elsewhere, in particular in the West Africa and selon les pays et les régions. L’économie sud-africaine East Africa regions, growth showed stable momentum, s'est rétablie en 2010 avec une croissance à 2.8%, après thanks to the good economic performances in countries un taux négatif de 1.7% en 2009 suite aux répercussions such as Ghana (5.9%), Burkina-Faso (5.7%) and Kenya (5.0%). de la récession mondiale. Le redressement de l'activité en Afrique du Sud a contribué au rebond de la région On the whole, Africa´s growth in 2010 was driven by a d’Afrique australe, dont la production a crû de 3.3% en strengthening of domestic demand, due to higher con- 2010 après une contraction de 0.5% en 2009. Ailleurs, sumption and the recovery of investment, whose ratio en particulier dans les régions d'Afrique de l’Ouest et to GDP remained stable around 25%. Exports volumes d’Afrique de l’Est, la croissance s’est maintenue à un increased by 1.6% after a contraction of 5.6% in 2009, rythme stable, grâce aux bonnes performances écono- with stronger growth, in particular towards the emerging miques dans des pays tels que le Ghana (5.9%), le Burkina- economies of Asia. Faso (5.7%) et le Kenya (5.0%). Overall, Africa´s economic performance has clearly im- Dans l’ensemble, la croissance de 2010 en Afrique a été proved in 2010: a more balanced and stronger growth, soutenue par la vigueur de la demande intérieure, repo- 42 Graph 4. Real GDP Growth Rate / Real Per Capita GDP Growth Graphique 4. Taux de croissance réel du PIB et taux de Rate croissance du PIB réel par habitant (%) (%) 12.0 15.0 9.0 12.0 6.0 9.0 6.0 3.0 3.0 0.0 2002 2003 2004 2005 2006 2007 2008 2009 2010 2002 2003 2004 2005 2006 2007 2008 2009 2010 Afrique: Taux de croissance réel du PIB Afrique: Inflation Africa: Real GDP Growth Rate Africa: Inflation Graph 5. Fiscal Balance / Current Account Balance Graphique 5. Solde budgétaire et Solde du compte courant (% of GDP) (% du PIB) 9.0 9.0 6.0 6.0 3.0 3.0 0.0 0.0 -3.0 -3.0 -6.0 -6.0 2002 2003 2004 2005 2006 2007 2008 2009 2010 2002 2003 2004 2005 2006 2007 2008 2009 2010 Africa: Fiscal Balance Africa: Current Account Balance Afrique: Solde budgétaire Afrique: Solde du compte courant African Statistical Yearbook 2011 / Annuaire Statistique pour l'Afrique 2011
  • 44.
    2011 Africa: Macroeconomic Afrique : Tendances Trends in 2010 macroéconomiques en 2010 Graph 6. Africa - Inflation ( %) Graphique 4. Afrique - Inflation (en %) 6. 15.0 15.0 12.0 12.0 9.0 9.0 6.0 6.0 3.0 3.0 2000 2001 2002 2003 2004 2005 2006 2007 2008 2009 2010 2000 2001 2002 2003 2004 2005 2006 2007 2008 2009 2010 an improvement of the fiscal balance with the deficit de- sant sur une consommation finale robuste et une dyna- clining from 5.2% of GDP in 2009 to 3.3%, an improvement mique favorable de l’investissement, dont le rapport au in the current account balance which moves to positive PIB est demeuré stable autour de 25%. Les exportations territory at 0.4% of GDP after – 1.6% in 2009 and a more en volume ont augmenté de 1.6% après une contraction de moderate inflation rate (see graph 3). Despite the rebound 5.6% de 2009, moyennant, en particulier, une croissance in food and fuel prices, inflation was more subdued dur- davantage plus forte des flux orientés vers les économies ing 2010 in the majority of the African countries, with émergentes d’Asie. only 19 countries recording a higher inflation than in the previous year. Africa´s median inflation rate declined to De manière générale, la situation économique de l’Afrique 4.8% in 2010 from 7.2% in 2009 and the aggregate infla- s’est clairement améliorée en 2010 : une croissance plus tion rate declined to 7.7% down from 10% in 2009 (Graph équilibrée et plus forte, une amélioration du solde budgé- 4). Inflation receded in all the regions, except for West taire avec un déficit diminuant de 5.2% du PIB en 2009 à 43 Africa, where the aggregate inflation rate of the region 3.3% en 2010, une amélioration du solde du compte cou- increased marginally by 0.1 percentage points to 10.4%. rant qui passe en territoire positif à 0.4% du PIB en 2010 The moderation of inflation allowed the monetary policy après – 1.6% en 2009 et un taux d’inflation plus modéré to remain on the whole accommodating, as in South Af- (voir graphique 3). En dépit du rebond des prix des pro- rica where authorities lowered its policy interest rate to duits alimentaires et de l'énergie, l’inflation a été plutôt further support economic activity. maîtrisée pendant 2010 dans la plupart des pays africains, avec seulement 19 pays enregistrant une inflation plus élevée qu’une année auparavant. Le taux d’inflation médian pour l’Afrique s'est replié à 4.8% en 2010 contre 7.2% en 2009, et le taux d’inflation global a diminué à 7.7% contre 10% en 2009 (graphique 4). L’inflation a reculé dans toutes régions, excepté en Afrique de l’Ouest, où le taux d’inflation de la région a augmenté marginalement de 0.1 point de pourcentage à 10.4%. La modération de l’inflation a permis à la politique monétaire d'être dans l'ensemble plutôt accommodante, comme en Afrique du Sud où les autorités ont abaissé le taux d’intérêt directeur pour soutenir davantage l’activité économique. African Statistical Yearbook 2011 / Annuaire Statistique pour l'Afrique 2011
  • 45.
    NATIONAL ACCOUNTS -COMPTES NATIONAUX 2-1. GDP at Current market prices - PIB aux prix du marche (courant) Million US Dollars Millions de dollars EU Country 2002 2003 2004 2005 2006 2007 2008 2009 2010 Pays Algeria 56 760 67 864 85 333 103 198 117 209 135 119 171 393 137 892 ... Algérie Angola 11 432 13 956 19 775 30 629 45 163 59 263 84 945 69 696 ... Angola Benin 2 808 3 557 4 051 4 358 4 705 5 511 6 643 6 907 7 349 Bénin Botswana 6 092 8 087 10 048 10 256 11 256 12 377 13 473 11 474 14 853 Botswana Burkina Faso 3 206 4 206 4 839 5 463 5 816 6 756 8 174 8 133 ... Burkina Faso Burundi ... ... ... 1 073 1 217 1 284 1 242 1 251 ... Burundi Cameroon 10 880 13 622 15 775 16 588 17 953 20 432 23 322 23 381 ... Cameroun Cape Verde 621 814 924 972 1 108 1 331 1 539 1 575 1 870 Cap-Vert Central African Republic 991 1 139 1 270 1 350 1 473 1 697 1 986 2 012 ... République Centrafricaine Chad 1 988 2 722 3 279 5 879 6 557 7 215 8 504 6 895 8 188 Tchad Comoros 247 318 368 380 406 462 520 520 525 Comores Congo 3 020 3 496 4 649 6 087 7 731 7 436 9 905 7 960 ... Congo Côte d'Ivoire 12 347 15 307 16 554 17 085 17 801 20 342 24 055 23 899 ... Côte d'Ivoire Democratic Republic of Congo 5 544 5 670 6 533 11 964 14 297 16 209 18 990 17 555 ... République Démocratique du Congo Djibouti 577 596 628 666 709 769 848 983 1 049 Djibouti Egypt 84 828 71 357 78 322 93 185 107 741 132 164 164 841 187 986 215 162 Egypte Equatorial Guinea 2 087 2 754 4 774 7 206 8 553 10 841 15 949 10 127 12 419 Guinée équatoriale Eritrea 729 870 1 109 1 098 1 211 1 318 1 380 1 873 ... Erythrée Ethiopia 7 768 8 539 10 035 12 286 15 134 19 182 25 897 28 476 30 201 Ethiopie Gabon 4 932 6 055 7 178 8 666 9 546 11 430 14 413 10 866 ... Gabon Gambia 578 509 579 628 666 826 1 035 931 ... Gambie Ghana 6 166 7 633 8 881 10 732 20 410 24 758 28 528 26 169 31 438 Ghana Guinea 2 950 3 446 3 666 2 937 2 821 4 209 3 778 4 459 5 029 Guinée Guinea-Bissau 407 465 523 573 579 691 843 837 848 Guinée-Bissau Kenya 13 103 14 904 16 095 18 739 22 504 27 167 30 031 29 394 ... Kenya Lesotho 657 969 1 235 1 355 1 415 1 581 1 601 1 720 2 100 Lesotho Liberia 519 404 467 511 671 653 830 856 ... Libéria Libyan Arab Jamahiriya 21 913 26 236 33 293 45 452 55 077 62 668 81 376 58 762 ... Jamahiriya Arabe Libyenne Madagascar 4 397 5 474 4 364 5 039 5 515 7 343 9 424 8 590 ... Madagascar Malawi 2 665 2 425 2 625 2 545 2 330 3 552 4 074 4 728 ... Malawi 44 Mali 3 189 4 222 4 982 5 486 6 123 7 145 8 738 8 964 9 228 Mali Mauritania 1 145 1 281 1 441 2 191 3 157 3 537 3 589 3 024 ... Mauritanie Mauritius 4 756 5 641 6 386 6 284 6 507 7 521 9 296 8 586 9 445 Maurice Morocco 40 442 49 757 56 947 59 464 65 640 75 223 88 879 91 374 93 569 Maroc Mozambique 4 201 4 666 5 698 6 579 7 096 8 036 9 891 9 674 ... Mozambique Namibia 3 361 4 931 6 607 7 261 7 979 8 815 8 958 9 183 ... Namibie Niger 2 145 2 640 2 897 3 370 3 647 4 291 5 369 5 244 ... Niger Nigeria 59 117 67 656 87 845 112 249 145 428 166 451 208 065 169 408 ... Nigéria Rwanda 1 677 1 847 2 088 2 581 3 109 3 741 4 716 5 265 5 632 Rwanda Sao Tome and Principe 85 102 111 124 136 147 181 209 ... Sao Tomé-et-Principe Senegal 5 334 6 860 8 031 8 708 9 359 11 285 13 287 12 756 ... Sénégal Seychelles 736 740 864 928 1 015 1 018 921 788 890 Seychelles Sierra Leone 1 311 1 426 1 418 1 491 1 646 1 951 2 193 2 177 ... Sierra Leone Somalia 1 219 1 517 1 984 2 316 2 390 2 483 2 600 2 012 ... Somalie South Africa 111 101 168 219 219 093 247 051 261 007 286 169 275 279 282 755 363 111 Afrique du Sud Sudan 18 137 21 355 26 646 35 183 45 460 56 554 61 118 65 794 ... Soudan Swaziland 1 224 1 854 2 421 2 584 2 948 3 054 3 020 3 161 ... Swaziland Tanzania, United Republic of 10 806 11 659 12 826 14 142 14 331 16 825 20 715 21 368 ... Tanzanie, République Unie de Togo 1 472 1 674 1 937 2 110 2 219 2 531 3 168 3 156 3 162 Togo Tunisia 23 142 27 454 31 184 32 272 34 377 38 910 44 815 43 529 44 561 Tunisie Uganda 6 670 7 050 8 436 10 040 11 011 13 549 16 378 16 828 ... Ouganda Zambia 3 711 4 342 5 439 7 179 10 702 11 541 14 705 12 748 ... Zambie Zimbabwe 6 203 6 199 6 206 6 073 6 101 5 660 5 218 5 837 6 384 Zimbabwe Africa 581 395 696 483 848 660 1 002 564 1 158 960 1 341 024 1 570 639 1 479 747 ... Afrique African Statistical Yearbook 2011 / Annuaire Statistique pour l'Afrique 2011
  • 46.
    NATIONAL ACCOUNTS -COMPTES NATIONAUX 2-2. GDP growth rates - Taux de croissance du PERCENTAGE POURCENTAGE Country 2002 2003 2004 2005 2006 2007 2008 2009 2010 Pays Algeria 4.7 6.9 5.1 5.1 2.0 3.0 2.4 2.4 ... Algérie Angola 14.5 3.3 11.2 20.6 18.6 20.3 13.2 -0.4 ... Angola Benin 4.4 3.9 3.1 2.9 3.8 4.6 5.3 6.7 9.2 Bénin Botswana 9.0 6.3 6.0 1.6 5.1 4.8 2.9 -4.9 7.2 Botswana Burkina Faso 4.4 7.8 4.5 8.7 6.3 4.1 2.6 3.1 ... Burkina Faso Burundi ... ... ... ... 5.4 3.8 7.5 3.2 ... Burundi Cameroon 4.0 4.0 3.7 2.3 3.2 3.3 2.9 1.9 ... Cameroun Cape Verde 5.3 4.7 4.3 6.5 10.1 8.6 6.2 3.6 5.3 Cap-Vert Central African Republic -0.6 -7.1 2.7 2.4 3.8 3.7 2.2 -0.4 ... République Centrafricaine Chad 8.5 14.3 33.7 8.6 0.8 2.6 -1.8 -1.1 6.1 Tchad Comoros 2.3 2.1 1.9 2.8 2.6 5.2 0.6 -3.4 1.8 Comores Congo 4.6 0.8 3.7 7.6 6.2 -1.6 6.4 6.8 ... Congo Côte d'Ivoire -1.7 -1.4 1.2 1.7 1.5 1.8 2.5 3.5 ... Côte d'Ivoire Democratic Republic of Congo 3.5 5.4 7.3 6.1 5.3 6.3 6.2 2.8 ... République Démocratique du Congo Djibouti 2.6 3.2 3.0 3.2 12.7 5.0 5.0 5.5 ... Djibouti Egypt 18.3 3.2 4.1 4.5 6.8 63.9 7.3 4.9 4.8 Egypte Equatorial Guinea 20.4 14.4 32.6 8.9 5.6 24.0 15.5 4.6 1.3 Guinée équatoriale Eritrea 3.0 -2.7 1.5 2.6 -1.0 1.4 -9.8 3.6 ... Erythrée Ethiopia 1.5 -2.2 13.6 11.8 10.8 11.5 10.8 8.8 12.4 Ethiopie Gabon -0.3 2.5 1.4 3.0 1.2 5.6 2.3 -1.4 ... Gabon Gambia 0.5 2.3 -0.6 0.3 3.4 6.0 6.3 5.0 ... Gambie Ghana 4.5 5.2 5.6 5.9 6.4 6.5 8.4 4.7 6.6 Ghana Guinea 5.2 1.2 2.3 3.0 2.5 1.8 4.9 -0.3 1.9 Guinée Guinea-Bissau -1.3 0.4 2.8 4.3 2.1 3.2 3.2 3.0 3.5 Guinée-Bissau Kenya 0.5 2.9 5.1 5.9 6.3 7.1 1.7 2.5 5.4 Kenya Lesotho 0.5 4.7 2.3 2.4 4.7 4.5 4.7 3.0 2.0 Lesotho Liberia 3.7 -31.3 2.6 5.3 7.8 9.4 7.1 4.6 ... Libéria Libyan Arab Jamahiriya -1.3 13.0 4.4 10.3 6.7 5.1 2.7 -0.7 ... Jamahiriya Arabe Libyenne Madagascar -12.7 9.8 5.3 4.6 5.0 6.2 7.1 -3.7 ... Madagascar Malawi 2.9 5.7 5.4 3.3 15.2 3.3 9.0 ... ... Malawi Mali 4.3 7.6 2.3 6.1 5.3 4.3 5.0 4.5 4.5 Mali 45 Mauritania 1.1 5.6 6.7 3.9 11.4 1.0 3.7 -1.1 ... Mauritanie Mauritius 1.9 4.3 5.8 1.2 3.9 5.5 4.6 2.1 3.9 Maurice Morocco 3.3 6.3 4.8 3.0 7.8 2.7 5.6 4.9 3.1 Maroc Mozambique 9.2 6.5 7.9 8.4 8.7 7.3 6.8 6.3 6.6 Mozambique Namibia 4.8 4.2 12.3 2.5 7.1 5.4 4.3 -0.7 ... Namibie Niger 5.3 3.4 -0.8 7.4 5.8 3.4 9.3 -0.9 ... Niger Nigeria 21.2 10.3 10.6 5.4 6.2 7.0 6.0 6.7 7.5 Nigéria Rwanda 13.3 2.1 7.4 9.4 8.8 7.8 11.7 6.0 7.4 Rwanda Sao Tome and Principe 3.6 5.8 4.3 3.5 11.4 5.0 6.5 ... ... Sao Tomé-et-Principe Senegal 0.7 6.7 5.9 5.6 2.5 4.9 3.2 2.2 4.2 Sénégal Seychelles 1.2 -5.9 -2.8 6.7 9.5 9.6 -1.3 0.7 ... Seychelles Sierra Leone 18.2 10.9 9.6 7.5 7.4 6.4 4.4 4.5 5.2 Sierra Leone Somalia 3.5 3.5 3.0 3.0 2.4 2.6 2.6 2.6 ... Somalie South Africa 3.7 2.9 4.6 5.3 5.6 5.6 3.6 -1.7 2.8 Afrique du Sud Sudan 6.0 6.3 5.1 6.1 9.4 8.1 7.8 6.1 ... Soudan Swaziland 1.8 2.2 2.9 2.5 3.3 3.5 2.4 1.2 ... Swaziland Tanzania, United Republic of 7.2 6.9 7.8 7.4 6.7 7.1 7.4 6.0 ... Tanzanie, République Unie de Togo -1.3 4.8 2.5 1.2 3.9 2.1 2.4 3.2 3.4 Togo Tunisia 1.7 5.5 6.0 4.0 5.7 6.3 4.5 3.1 3.7 Tunisie Uganda 7.1 6.2 5.8 10.0 7.0 8.1 10.4 5.3 ... Ouganda Zambia 3.3 5.1 5.4 5.3 6.2 6.2 5.7 6.3 ... Zambie Zimbabwe -5.9 -7.4 -3.6 -4.0 -3.6 -3.3 -9.9 ... ... Zimbabwe Africa Afrique African Statistical Yearbook 2011 / Annuaire Statistique pour l'Afrique 2011
  • 47.
    NATIONAL ACCOUNTS -COMPTES NATIONAUX 2-3. Per Capita GDP - PIB par habitant DOLLARS EU DOLLARS EU Country 2002 2003 2004 2005 2006 2007 2008 2009 2010 Pays Algeria 1 807 2 128 2 636 3 141 3 514 3 991 4 986 3 952 ... Algérie Angola 754 892 1 226 1 843 2 643 3 376 4 714 3 768 ... Angola Benin 395 483 532 554 579 657 767 773 798 Bénin Botswana 3 438 4 509 5 535 5 577 6 036 6 540 7 013 5 885 7 511 Botswana Burkina Faso 258 327 364 397 409 459 537 516 ... Burkina Faso Burundi ... ... ... 145 160 164 154 151 ... Burundi Cameroon 654 800 906 931 984 1 095 1 222 1 198 ... Cameroun Cape Verde 1 366 1 760 1 967 2 036 2 286 2 707 3 087 3 115 3 647 Cap-Vert Central African Republic 255 288 315 329 353 399 458 455 ... République Centrafricaine Chad 220 291 338 587 635 679 779 615 712 Tchad Comoros 428 539 611 617 644 716 788 769 759 Comores Congo 950 1 072 1 391 1 782 2 218 2 094 2 740 2 161 ... Congo Côte d'Ivoire 683 829 879 888 905 1 011 1 168 1 134 ... Rép. Démocratique du Congo Democratic Republic of Congo 103 102 114 203 235 259 296 266 ... Côte d'Ivoire Djibouti 757 767 794 828 865 921 998 1 137 1 194 Djibouti Egypt 1 164 960 1 034 1 208 1 371 1 651 2 022 2 265 2 547 Egypte Equatorial Guinea 3 723 4 778 8 059 11 835 13 675 16 881 24 195 14 975 17 911 Guinée Equatoriale Eritrea 184 210 258 246 262 276 280 369 ... Erythrée Ethiopia 112 120 138 165 197 244 321 344 355 Ethiopie Gabon 3 826 4 601 5 346 6 329 6 840 8 039 9 953 7 369 ... Gabon Gambia 416 354 391 411 424 512 624 546 ... Gambie Ghana 30 36 41 49 91 108 122 110 129 Ghana Guinea 339 389 406 319 300 438 384 443 487 Guinée Guinea-Bissau 297 332 363 389 384 448 535 519 515 Guinée-Bissau Kenya 396 438 461 523 612 720 775 739 ... Kenya Lesotho 339 495 625 679 703 778 781 832 1 007 Lesotho Liberia 170 129 145 153 193 180 219 216 ... Libéria Libyan Arab Jamahiriya 3 934 4 615 5 737 7 674 9 111 10 159 12 929 9 153 ... Jamahiriya Arabe Libyenne Madagascar 272 329 255 286 305 395 493 438 ... Madagascar 46 Malawi 212 188 198 186 166 246 274 310 ... Malawi Mali 290 374 431 464 505 576 688 689 693 Mali Mauritania 416 452 495 734 1 031 1 127 1 116 919 ... Mauritanie Mauritius 3 901 4 583 5 142 5 018 5 156 5 917 7 264 6 665 7 285 Maurice Morocco 1 371 1 669 1 889 1 950 2 128 2 409 2 812 2 856 2 890 Maroc Mozambique 218 236 281 316 332 367 442 423 ... Mozambique Namibia 1 771 2 549 3 352 3 614 3 895 4 220 4 206 4 230 ... Namibie Niger 182 216 229 257 268 303 365 343 ... Niger Nigeria 451 504 639 797 1 008 1 127 1 376 1 095 ... Nigéria Rwanda 196 213 237 287 338 396 485 527 548 Rwanda Sao Tome and Principe 587 688 740 815 875 934 1 132 1 282 ... Sao Tomé-et-Principe Senegal 511 641 731 772 808 949 1 088 1 018 ... Sénégal Seychelles 8 976 8 999 10 490 11 232 12 228 12 213 10 986 9 354 10 524 Seychelles Sierra Leone 289 301 288 292 312 360 394 382 ... Sierra Leone Somalia 157 190 243 277 280 284 291 220 ... Somalie South Africa 2 405 3 591 4 615 5 139 5 366 5 820 5 542 5 643 7 191 Afrique du Sud Sudan 50 57 70 91 115 140 148 156 ... Soudan Swaziland 1 112 1 673 2 171 2 298 2 593 2 652 2 586 2 668 ... Swaziland Tanzania, United Republic of 301 316 338 363 357 408 488 489 ... Tanzanie Togo 265 294 331 352 361 402 490 477 466 Togo Tunisia 2 405 2 829 3 185 3 267 3 448 3 864 4 407 4 238 4 295 Tunisie Uganda 256 262 304 350 371 442 517 514 ... Ouganda Zambia 338 387 474 612 890 937 1 165 985 ... Zambie Zimbabwe 496 496 497 487 490 455 419 466 505 Zimbabwe Africa 1 047 1 236 1 505 1 700 1 892 2 122 2 491 2 078 ... Afrique African Statistical Yearbook 2011 / Annuaire Statistique pour l'Afrique 2011
  • 48.
    NATIONAL ACCOUNTS -COMPTES NATIONAUX 2-4. Structure of Output (at current market prices) - Structure du PIB (aux prix courants du marché) Share of GDP (%) Agriculture Industry Manufacturing Services Part du PIB (%) Country 2002 2009 2002 2009 2002 2009 2002 2009 Pays Algeria 10.1 10.0 53.7 51.3 6.7 5.0 36.3 38.7 Algérie Angola 7.9 8.6 69.0 70.9 3.7 0.9 23.0 20.5 Angola Benin 37.4 35.9 15.0 14.5 9.4 8.3 47.6 49.6 Bénin Botswana 2.1 3.3 56.8 42.5 3.9 4.5 41.1 54.2 Botswana Burkina Faso 38.6 35.2 17.5 23.8 11.1 12.2 43.9 41.0 Burkina Faso Burundi 47.2 47.0 17.0 15.0 11.3 10.1 35.8 38.0 Burundi Cameroon 22.1 23.5 32.0 29.9 20.6 16.2 45.8 46.6 Cameroun Cape Verde 11.6 8.2 16.5 17.8 5.0 3.4 71.8 74.1 Cap-Vert Central African Republic 53.6 53.5 14.0 13.9 6.2 6.3 32.4 32.6 République Centrafricaine Chad 35.8 20.5 18.5 45.6 9.4 6.2 45.7 33.9 Tchad Comoros 41.1 43.9 11.8 10.8 4.2 3.8 47.1 45.3 Comores Congo 6.5 5.4 65.6 67.6 5.5 5.4 28.0 26.9 Congo Côte d'Ivoire 30.1 26.0 23.3 25.6 16.8 17.8 46.6 48.4 Côte d'Ivoire Democratic Republic of Congo 51.0 16.6 21.5 30.0 5.4 21.8 27.5 53.4 République Démocratique du Congo Djibouti 3.5 3.9 15.5 19.7 2.6 2.3 81.0 76.4 Djibouti Egypt 16.5 13.7 34.8 37.6 19.8 16.6 48.7 48.7 Egypte Equatorial Guinea 88.0 66.1 7.7 30.0 0.1 0.2 4.3 3.8 Guinée équatoriale Eritrea 11.7 24.2 24.8 18.9 11.7 5.8 63.5 56.9 Erythrée Ethiopia 43.5 50.8 13.9 10.4 5.7 3.7 42.6 38.8 Ethiopie Gabon 6.5 5.8 55.6 56.5 5.7 4.8 37.9 37.7 Gabon Gambia 24.0 28.8 15.7 12.9 7.0 5.7 62.6 58.3 Gambie Ghana 39.2 31.7 28.2 18.9 10.1 6.9 32.6 49.5 Ghana Guinea 23.4 25.9 33.9 40.3 4.1 7.4 42.7 33.8 Guinée Guinea-Bissau 43.0 44.6 16.7 13.8 13.6 11.9 40.2 41.6 Guinée-Bissau Kenya 29.1 27.6 17.4 18.7 11.1 10.6 53.5 53.7 Kenya Lesotho 10.1 8.4 34.0 31.9 22.5 15.9 55.9 59.7 Lesotho Liberia 72.3 63.7 8.0 12.7 5.4 7.2 19.7 23.6 Libéria Libyan Arab Jamahiriya 4.3 2.8 60.9 71.4 4.9 6.3 34.9 25.9 Jamahiriya Arabe Libyenne Madagascar 31.7 28.5 16.4 20.2 13.0 14.6 51.9 51.3 Madagascar 47 Malawi 42.9 36.3 14.9 17.1 4.9 5.6 42.2 46.5 Malawi Mali 33.1 39.0 28.1 21.0 8.5 5.7 38.8 39.9 Mali Mauritania 25.8 20.6 27.3 34.7 5.3 4.1 46.9 44.8 Mauritanie Mauritius 6.3 4.3 30.7 29.1 22.5 19.5 63.0 66.6 Maurice Morocco 16.5 16.4 27.3 28.5 16.7 16.1 56.2 55.1 Maroc Mozambique 27.8 29.6 23.1 23.6 13.9 14.2 49.0 46.9 Mozambique Namibia 10.9 9.4 32.3 32.3 13.1 14.7 56.7 58.3 Namibie Niger 47.6 44.0 12.0 16.1 6.3 5.5 40.5 39.9 Niger Nigeria 48.6 37.1 30.5 34.3 3.2 2.3 20.9 28.7 Nigéria Rwanda 38.5 36.6 15.0 15.5 8.2 6.9 46.5 47.9 Rwanda Sao Tome and Principe 23.0 19.4 18.0 20.3 8.6 8.7 59.0 60.3 Sao Tomé-et-Principe Senegal 15.5 16.7 25.5 23.2 17.2 14.1 59.0 60.1 Sénégal Seychelles 3.0 2.8 31.7 17.2 18.7 9.4 65.3 80.0 Seychelles Sierra Leone 43.1 62.0 10.4 5.2 3.0 1.8 46.5 32.9 Sierra Leone Somalia 60.1 60.2 7.3 7.4 2.5 2.5 32.6 32.5 Somalie South Africa 4.2 2.9 32.6 31.1 19.2 15.2 63.2 66.0 Afrique du Sud Sudan 39.1 31.0 20.5 29.4 8.4 7.9 40.4 39.7 Soudan Swaziland 10.3 7.9 44.9 46.1 39.3 42.3 44.8 46.0 Swaziland Tanzania, United Republic of 32.5 28.8 21.1 24.3 8.9 9.5 46.5 46.9 Tanzanie, République Unie de Togo 41.1 47.5 19.7 17.8 9.8 8.8 39.2 34.7 Togo Tunisia 9.3 9.1 29.9 31.4 18.3 16.7 60.8 59.5 Tunisie Uganda 24.3 24.8 24.4 25.2 7.8 8.2 51.3 50.0 Ouganda Zambia 22.1 22.0 26.0 34.5 11.5 9.8 51.9 43.5 Zambie Zimbabwe 32.1 18.0 16.3 29.0 11.7 17.0 51.6 53.0 Zimbabwe Africa … … … … … … … … Afrique African Statistical Yearbook 2011 / Annuaire Statistique pour l'Afrique 2011
  • 49.
    NATIONAL ACCOUNTS -COMPTES NATIONAUX 2-5. Structure of Demand (at current market prices) - Structure de la demande (aux prix courants du marché) General Exports of Goods less Imports of Household Final GovernmentFinal Gross Capital and Non Factor Goods and Non Cons. Expenditure Cons. Expenditure Formation / Services / Factor Services Share of GDP (%) / Dep. des Part du PIB (%) / Dep. Generale du Formation brute de Exportations de /moins menages en cons. gouv. en cons. capital biens et services Importations de finale finale non facteurs biens et services Country 2002 2009 2002 2009 2002 2009 2002 2009 2002 2009 Pays Algeria 43.0 37.4 15.5 16.4 30.7 46.8 36.5 35.2 25.6 35.8 Algérie Angola 39.6 44.9 35.0 26.1 12.6 17.5 75.0 53.1 62.2 41.5 Angola Benin 78.0 74.5 12.3 11.6 18.5 21.7 22.2 19.8 31.0 27.6 Bénin Botswana 41.2 62.7 20.7 24.2 27.0 24.1 46.6 33.6 35.4 44.6 Botswana Burkina Faso 73.8 72.0 21.2 20.3 17.5 22.7 9.2 11.3 21.7 26.3 Burkina Faso Burundi 93.2 88.5 13.3 10.6 17.1 14.8 6.5 4.6 30.1 18.5 Burundi Cameroon 70.8 75.2 10.2 11.3 19.8 18.5 19.9 16.0 20.7 21.0 Cameroun Cape Verde 84.4 78.4 18.4 20.1 35.8 47.0 25.1 20.7 63.7 66.2 Cap-Vert Central African Republic 80.7 85.0 13.8 9.3 9.6 13.1 16.0 14.8 20.1 22.2 République Centrafricaine Chad 82.3 74.8 7.7 9.6 106.6 38.0 12.7 43.6 109.2 65.9 Tchad Comoros 82.3 101.7 15.9 11.6 12.2 13.8 15.7 3.0 26.2 30.2 Comores Congo 36.2 26.8 15.8 12.5 22.2 51.6 74.0 81.2 48.2 72.0 Congo Côte d'Ivoire 66.1 66.9 13.2 13.5 5.7 10.4 47.5 46.6 32.4 37.4 Côte d'Ivoire Democratic Republic of Congo 80.5 61.5 6.7 6.0 6.1 30.2 16.2 32.4 14.3 30.1 République Démocratique du Congo Djibouti 79.2 83.9 25.3 20.8 11.2 18.9 47.2 36.9 62.9 60.5 Djibouti Egypt 74.8 76.1 11.8 11.3 18.1 19.2 17.8 25.0 22.6 31.6 Egypte Equatorial Guinea 14.1 7.8 5.3 4.7 31.8 69.5 102.7 89.4 53.9 71.4 Guinée équatoriale Eritrea 83.8 86.9 39.7 20.0 29.5 9.1 11.8 4.5 64.8 20.5 Erythrée Ethiopia 75.0 87.5 14.8 8.2 24.1 22.5 12.6 10.5 26.6 28.7 Ethiopie Gabon 37.0 39.7 15.1 15.4 31.6 24.9 55.5 56.4 39.2 36.4 Gabon Gambia 71.1 82.6 10.8 7.6 41.1 28.6 6.8 6.4 29.8 26.5 Gambie Ghana 78.7 76.9 17.6 9.6 19.2 19.6 42.4 30.5 58.5 41.3 Ghana Guinea 77.1 80.9 8.0 8.5 19.2 16.4 27.5 24.2 31.8 30.0 Guinée Guinea-Bissau 86.2 92.2 14.9 13.5 8.5 8.0 15.7 15.3 25.3 29.0 Guinée-Bissau Kenya 74.5 75.5 17.1 16.3 15.2 20.9 23.7 25.3 30.5 37.9 Kenya Lesotho 110.6 97.2 36.8 40.7 30.2 29.0 66.2 46.2 143.7 113.1 Lesotho Liberia 89.7 184.4 13.7 15.1 4.7 20.0 19.9 29.3 27.9 148.9 Libéria Libyan Arab Jamahiriya 57.0 36.6 16.6 12.6 14.4 9.7 48.3 68.1 36.3 27.0 Jamahiriya Arabe Libyenne Madagascar 87.3 78.2 8.4 11.5 13.4 34.1 16.0 28.5 25.0 52.2 Madagascar Malawi 88.6 80.1 8.6 19.0 16.1 26.2 20.8 23.3 34.2 48.5 Malawi 48 Mali 67.9 62.2 16.6 17.3 16.4 21.2 29.7 21.6 30.6 22.4 Mali Mauritania 73.9 74.3 22.5 16.1 22.3 27.7 32.5 49.0 51.2 67.0 Mauritanie Mauritius 60.9 74.6 13.9 14.6 22.1 21.4 62.0 48.5 58.9 59.1 Maurice Morocco 57.9 57.0 18.3 18.0 25.9 36.0 30.1 28.6 32.2 39.5 Maroc Mozambique 88.2 80.5 12.3 12.9 29.6 14.9 24.9 27.7 55.1 36.1 Mozambique Namibia 61.5 58.8 21.5 24.4 18.5 27.3 46.0 44.4 48.1 53.3 Namibie Niger 75.3 74.3 16.4 17.2 17.3 29.1 15.4 19.8 24.4 40.5 Niger Nigeria 77.7 74.8 6.7 12.7 7.0 12.1 36.0 30.8 27.4 30.4 Nigéria Rwanda 83.6 81.3 19.6 14.5 13.6 21.6 7.0 11.6 23.7 28.9 Rwanda Sao Tome and Principe 82.0 85.1 37.8 38.5 33.3 65.0 35.1 25.3 86.5 113.9 Sao Tomé-et-Principe Senegal 80.0 78.6 13.3 14.2 17.2 27.1 28.5 23.2 39.0 43.1 Sénégal Seychelles 47.3 85.0 22.2 13.3 36.4 29.3 74.7 103.4 80.6 131.0 Seychelles Sierra Leone 140.6 79.9 9.6 15.0 -17.8 19.6 10.9 14.4 43.2 28.9 Sierra Leone Somalia 72.3 72.6 8.6 8.7 20.5 20.0 0.3 0.3 1.7 1.7 Somalie South Africa 61.5 60.2 18.8 21.1 15.6 19.0 32.9 27.4 29.1 28.3 Afrique du Sud Sudan 78.5 70.9 6.1 8.7 21.8 17.4 11.2 20.9 17.6 17.9 Soudan Swaziland 70.0 88.2 16.0 13.7 19.3 10.3 95.7 55.5 101.0 67.7 Swaziland Tanzania, United Republic of 71.9 65.5 13.1 17.5 17.2 29.0 17.6 23.2 19.8 35.2 Tanzanie, République Unie de Togo 85.6 82.6 11.9 14.2 16.7 18.7 34.9 35.5 49.2 51.0 Togo Tunisia 62.7 61.9 17.2 16.5 23.8 24.5 40.8 45.0 44.6 47.9 Tunisie Uganda 78.3 83.3 15.6 10.4 19.6 21.7 10.6 19.8 24.1 35.2 Ouganda Zambia 69.5 51.6 12.9 21.4 22.9 24.1 23.6 35.2 28.9 32.4 Zambie Zimbabwe 99.3 101.1 15.3 14.3 12.1 13.4 39.6 28.3 66.1 57.1 Zimbabwe Africa … … … … … … … … … … Afrique African Statistical Yearbook 2011 / Annuaire Statistique pour l'Afrique 2011
  • 50.
    PRICES - PRIX 2-6. Consumer Price Index - Indice des prix à la consommation 2000 = 100 2000 = 100 Country 2001 2002 2003 2004 2005 2006 2007 2008 2009 2010 Pays Algeria 103.5 104.9 107.6 111.5 113.3 115.9 120.1 125.9 133.1 138.6 Algérie Angola 216.1 451.3 895.2 1285.2 1580.2 1790.5 2009.8 2260.3 2570.5 2948.9 Angola Benin 104.0 106.5 108.1 109.1 114.9 119.3 120.8 130.4 133.2 136.0 Bénin Botswana 106.6 115.1 125.8 134.5 146.1 163.1 174.6 196.6 212.7 227.7 Botswana Burkina Faso 104.7 107.1 109.3 108.9 115.9 118.6 118.3 130.9 134.4 135.5 Burkina Faso Burundi 109.3 107.9 119.4 129.4 146.4 150.3 162.9 202.7 224.4 240.3 Burundi Cameroon 102.8 105.7 106.4 106.6 108.7 114.1 115.4 121.6 125.2 127.0 Cameroun Cape Verde 103.7 105.7 106.9 104.9 105.3 110.4 115.3 123.1 124.6 127.2 Cap-Vert Central African Republic 103.8 106.2 110.7 108.4 111.5 119.0 120.1 131.3 135.9 138.3 République Centrafricaine Chad 112.4 118.3 116.2 110.0 118.6 128.2 116.6 126.3 139.1 139.9 Tchad Comoros 105.6 109.3 113.5 118.6 120.9 126.3 131.9 138.2 144.9 149.1 Comores Congo 100.8 103.8 105.6 109.5 112.2 117.5 120.6 127.7 132.5 138.9 Congo Côte d'Ivoire 104.4 107.6 111.1 112.7 117.1 120.0 122.3 130.0 136.1 139.7 Côte d'Ivoire Democratic Republic of Congo 457.3 573.0 646.5 672.4 816.2 924.0 1078.3 1272.4 1860.3 2293.1 République Démocratique du Congo Djibouti 101.8 102.4 104.4 107.7 111.0 114.9 120.6 135.0 137.3 143.1 Djibouti Egypt 102.4 104.9 108.2 122.2 132.9 138.5 153.6 171.6 199.4 222.8 Egypte Equatorial Guinea 108.8 117.1 125.7 131.0 138.4 144.5 148.6 155.0 166.1 173.9 Guinée équatoriale Eritrea 114.6 134.0 164.3 205.6 231.3 266.2 290.9 349.0 464.1 523.0 Erythrée Ethiopia 94.8 88.0 101.2 109.9 117.4 131.8 152.7 180.8 245.9 273.4 Ethiopie Gabon 102.1 102.3 104.5 104.9 104.7 103.2 108.4 114.1 116.3 119.9 Gabon Gambia 104.5 113.5 132.8 151.8 159.4 162.7 171.5 179.2 187.4 198.4 Gambie Ghana 132.9 152.6 193.3 217.7 251.2 280.6 310.7 361.8 431.6 466.3 Ghana Guinea 105.4 108.6 122.6 144.0 189.2 254.8 313.1 370.6 388.0 449.3 Guinée Guinea-Bissau 103.3 106.8 103.0 103.8 107.3 108.0 113.0 124.8 122.8 126.0 Guinée-Bissau Kenya 105.8 107.9 118.5 132.5 146.0 154.9 161.5 185.2 204.7 213.0 Kenya Lesotho 108.1 120.0 128.7 135.2 139.9 148.4 160.3 177.2 190.1 203.9 Lesotho Liberia 112.1 128.0 141.2 146.3 156.4 167.6 186.7 219.4 236.1 254.2 Libéria Libyan Arab Jamahiriya 90.8 81.9 80.2 78.4 80.7 81.8 86.9 95.9 98.2 102.9 Jamahiriya Arabe Libyenne Madagascar 106.9 124.3 122.9 140.5 166.2 185.3 203.1 221.8 240.6 263.6 Madagascar Malawi 127.2 149.2 163.5 182.2 210.4 239.7 258.7 281.2 304.9 328.4 Malawi Mali 105.2 110.5 109.0 105.6 112.4 114.1 115.7 126.2 129.0 130.8 Mali 49 Mauritania 107.7 113.4 119.4 131.9 147.9 157.1 168.5 180.8 184.8 196.1 Mauritanie Mauritius 105.4 112.1 116.5 122.0 128.0 139.4 151.6 166.3 170.5 175.5 Maurice Morocco 100.6 103.4 104.7 106.2 107.3 110.8 113.3 117.5 118.7 119.7 Maroc Mozambique 109.1 127.3 144.5 162.7 173.2 196.1 212.2 234.1 242.3 273.1 Mozambique Namibia 109.2 121.6 130.3 135.8 138.8 145.8 155.6 171.8 186.7 195.2 Namibie Niger 104.0 106.7 105.0 105.3 113.5 114.0 114.4 127.4 133.6 138.1 Niger Nigeria 118.9 134.2 153.0 176.0 207.5 224.6 236.7 264.1 297.2 337.8 Nigéria Rwanda 103.4 105.4 113.3 126.8 138.4 150.7 164.4 189.8 209.4 216.0 Rwanda Sao Tome and Principe 109.2 119.2 130.7 147.4 172.8 212.7 252.0 317.8 370.9 413.0 Sao Tomé-et-Principe Senegal 103.0 105.4 105.4 105.9 107.7 109.7 116.2 122.9 121.6 123.0 Sénégal Seychelles 106.0 106.2 110.1 114.6 115.3 113.2 119.2 163.3 215.1 209.9 Seychelles Sierra Leone 102.6 98.8 106.3 121.4 133.7 144.2 161.0 184.9 202.0 238.0 Sierra Leone Somalia 100.0 100.0 100.0 100.0 100.0 100.0 100.0 100.0 100.0 100.0 Somalie South Africa 105.8 115.4 122.1 123.8 128.0 133.9 143.6 160.1 171.5 178.8 Afrique du Sud Sudan 107.4 116.2 125.8 135.0 142.6 165.0 179.5 205.2 227.8 259.2 Soudan Swaziland 106.9 119.4 128.2 132.6 138.9 146.3 158.1 178.1 191.5 200.2 Swaziland Tanzania, United Republic of 105.1 109.6 115.4 120.9 127.0 136.2 145.8 160.8 180.3 196.3 Tanzanie, République Unie de Togo 103.9 107.1 106.2 106.6 113.8 116.4 117.6 127.8 131.4 138.4 Togo Tunisia 101.9 104.7 107.6 111.5 113.8 118.9 122.6 128.8 133.3 139.1 Tunisie Uganda 101.9 101.6 110.5 114.5 124.4 133.3 141.5 158.5 179.7 192.8 Ouganda Zambia 121.7 148.7 180.7 213.2 252.3 275.0 304.3 342.2 376.1 405.9 Zambie Zimbabwe 172 162 175 182 185 193 185 199 211 222 Zimbabwe Africa 108.3 116.1 124.8 133.9 143.5 152.0 162.4 179.2 197.1 212.4 Afrique African Statistical Yearbook 2011 / Annuaire Statistique pour l'Afrique 2011
  • 51.
    PRODUCTION 2-7. Agricultural and Food Production Index - Indice de la production agricole et alimentaire 1999-2001=100 1999-2001=100 Agricultural Production / Production Food Production / Production agricole alimentaire Country 2000 2005 2008 2009 2000 2005 2008 2009 Pays Algeria 95 137 131 161 95 137 131 161 Algérie Angola 99 147 163 197 99 148 165 199 Angola Benin 102 115 113 113 101 120 117 117 Bénin Botswana 99 111 113 113 99 111 113 113 Botswana Burkina Faso 87 137 144 140 86 125 137 136 Burkina Faso Burundi 95 110 109 109 95 112 110 110 Burundi Cameroon 99 116 112 115 99 118 119 120 Cameroun Cape Verde 96 101 123 123 96 101 123 123 Cap-Vert Central African Republic 102 107 116 119 102 111 121 123 République Centrafricaine Chad 93 119 118 118 93 120 124 125 Tchad Comoros 100 99 112 112 100 99 112 112 Comores Congo 100 117 124 124 100 117 124 124 Congo Congo, Dem. Republic 99 97 97 97 99 97 98 98 Rép. Démocratique du Congo Côte d'Ivoire 104 106 113 113 102 109 125 122 Côte d'Ivoire Djibouti 102 115 147 147 102 115 147 147 Djibouti Egypt 102 115 130 135 102 116 132 137 Egypte Equatorial Guinea 101 94 93 91 100 95 92 89 Guinée Equatoriale Eritrea 93 104 124 124 93 104 125 125 Erythrée Ethiopia 98 132 143 148 97 134 144 150 Ethiopie Gabon 101 100 103 103 101 100 103 103 Gabon Gambia 101 93 100 117 101 93 100 117 Gambie Ghana 99 127 144 154 99 127 145 155 Ghana Guinea 101 117 135 137 100 119 138 140 Guinée Guinea-Bissau 100 113 121 122 100 113 121 122 Guinée-Bissau Kenya 94 116 124 124 93 116 125 126 Kenya Lesotho 94 94 75 75 94 92 72 72 Lesotho Liberia 102 105 117 117 102 104 130 130 Libéria Libyan Arab Jamahiriya 98 104 108 108 98 103 108 108 Jamahiriya Arabe Libyenne 50 Madagascar 99 116 114 114 99 118 115 115 Madagascar Malawi 102 89 142 142 101 86 137 137 Malawi Mali 87 124 142 159 94 128 165 184 Mali Mauritania 100 112 114 115 100 112 114 115 Mauritanie Mauritius 101 105 104 106 101 106 105 107 Maurice Morocco 94 123 137 137 94 123 138 137 Maroc Mozambique 95 119 122 122 96 108 102 102 Mozambique Namibia 98 96 100 100 98 96 100 100 Namibie Niger 93 130 183 183 93 130 184 184 Niger Nigeria 100 123 132 133 100 123 133 133 Nigéria Rwanda 103 124 133 134 103 125 134 134 Rwanda Sao Tome and Principe 99 102 109 111 99 102 109 111 Sao Tomé-et-Principe Senegal 102 101 121 129 102 101 121 130 Sénégal Seychelles 100 69 49 49 100 68 49 49 Seychelles Sierra Leone 92 170 200 200 92 173 204 204 Sierra Leone Somalia 101 108 104 104 101 108 104 104 Somalie South Africa 105 111 121 119 105 112 123 120 Afrique du Sud Sudan 97 116 116 118 97 116 117 119 Soudan Swaziland 98 113 109 109 99 117 114 114 Swaziland Tanzania 94 131 140 140 95 128 139 139 Tanzanie Togo 94 102 112 112 95 112 129 129 Togo Tunisia 97 118 126 116 97 118 126 116 Tunisie Uganda 98 105 109 111 99 106 109 111 Ouganda Zambia 98 127 130 144 100 113 119 135 Zambie Zimbabwe 106 71 70 70 105 83 81 81 Zimbabwe African Statistical Yearbook 2011 / Annuaire Statistique pour l'Afrique 2011
  • 52.
    PRODUCTION 2-8. Industrial, Mining and manufacturing Production Index - Indice de la production industrielle, minière et manufacturière Manufacturing Industrial Production / Mining Production / Production / Production Production Industrielle Production minière manufacturière Country Base 2007 2008 2009 2007 2008 2009 2007 2008 2009 Pays Algeria 2005=100 96.9 98.7 98.8 125.9 138.3 143.0 87.2 88.9 89.4 Algérie Angola 2005=100 ... ... ... ... ... ... ... ... ... Angola Benin 2005=100 112.8 120.4 128.7 ... ... ... ... ... ... Bénin Botswana 2005=100 ... ... ... ... ... ... ... ... ... Botswana Burkina Faso 2005=100 ... ... ... ... ... ... ... ... ... Burkina Faso Burundi 2005=100 ... ... ... ... ... ... 105.1 107.0 104.5 Burundi Cameroon 2005=100 103.9 107.2 108.4 ... ... ... 104.4 107.4 108.8 Cameroun Cape Verde 2005=100 ... ... ... ... ... ... ... ... ... Cap-Vert Central African Republic 2005=100 182.7 210.7 143.0 ... ... ... ... ... ... République Centrafricaine Chad 2005=100 88.1 80.9 77.2 ... ... ... ... ... ... Tchad Comoros 2005=100 ... ... ... ... ... ... ... ... ... Comores Congo 2005=100 105.6 ... ... ... ... ... ... ... ... Congo Congo, Dem. Republic 2005=100 ... ... ... ... ... ... ... ... ... Rép. Démocratique du Congo Côte d'Ivoire 2005=100 107.9 107.9 113.2 134.4 125.7 ... 93.7 95.3 ... Côte d'Ivoire Djibouti 2005=100 ... ... ... ... ... ... ... ... ... Djibouti Egypt 2005=100 ... ... ... ... ... ... 125.4 129.6 120.5 Egypte Equatorial Guinea 2005=100 ... ... ... ... ... ... ... ... ... Guinée Equatoriale Eritrea 2005=100 ... ... ... ... ... ... ... ... ... Erythrée Ethiopia 2005=100 ... ... ... ... ... ... ... ... ... Ethiopie Gabon 2005=100 111.7 119.2 114.8 ... ... ... ... ... ... Gabon Gambia 2005=100 ... ... ... ... ... ... ... ... ... Gambie Ghana 2005=100 ... ... ... ... ... ... ... ... ... Ghana Guinea 2006=100 100.1 110.4 98.9 ... ... ... ... ... ... Guinée Guinea-Bissau 2007=100 ... 153.2 162.5 ... ... ... ... ... ... Guinée-Bissau Kenya 2005=100 ... ... ... ... ... ... ... ... ... Kenya Lesotho 2005=100 ... ... ... ... ... ... ... ... ... Lesotho Liberia 2005=100 ... ... ... ... ... ... ... ... ... Libéria Libyan Arab Jamahiriya 2005=100 ... ... ... ... ... ... ... ... ... Jamahiriya Arabe Libyenne 51 Madagascar 2005=100 ... ... ... ... ... ... ... ... ... Madagascar Malawi 2005=100 ... ... ... ... ... ... ... ... ... Malawi Mali 2005=100 105.9 102.8 127.3 ... ... ... ... ... ... Mali Mauritania 2006=100 79.1 71.5 67.5 ... ... ... ... ... ... Mauritanie Mauritius 2005=100 105.6 106.6 108.7 99.1 99.1 84.3 105.3 105.8 107.9 Maurice Morocco 2005=100 108.0 110.0 109.3 112.8 110.7 96.3 110.0 112.3 112.6 Maroc Mozambique 2005=100 ... ... ... ... ... ... ... ... ... Mozambique Namibia 2005=100 ... ... ... ... ... ... ... ... ... Namibie Niger 2005=100 99.3 105.2 125.6 ... ... ... ... ... ... Niger Nigeria 2005=100 ... ... ... ... ... ... ... ... ... Nigéria Rwanda 2005=100 ... ... ... ... ... ... ... ... ... Rwanda Sao Tome and Principe 2005=100 ... ... ... ... ... ... ... ... ... Sao Tomé-et-Principe Senegal 2005=100 103.0 93.4 100.2 67.6 77.6 88.3 104.3 92.0 99.7 Sénégal Seychelles 2005=100 ... ... ... ... ... ... ... ... ... Seychelles Sierra Leone 2005=100 ... ... ... ... ... ... ... ... ... Sierra Leone Somalia 2005=100 ... ... ... ... ... ... ... ... ... Somalie South Africa 2005=100 106.4 105.3 94.1 97.8 92.3 86.2 109.6 110.4 96.2 Afrique du Sud Sudan 2005=100 ... ... ... ... ... ... ... ... ... Soudan Swaziland 2005=100 ... ... ... ... ... ... ... ... ... Swaziland Tanzania 2005=100 ... ... ... ... ... ... 123.5 202.9 187.8 Tanzanie Togo 2005=100 ... ... ... ... ... ... ... ... ... Togo Tunisia 2005=100 112.7 116.4 111.1 112.8 107.1 107.3 113.1 118.3 111.3 Tunisie Uganda 2005=100 ... ... ... ... ... ... 113.6 118.0 138.2 Ouganda Zambia 2005=100 114.8 120.9 131.4 119.7 132.3 150.7 110.2 112.1 114.9 Zambie Zimbabwe 2005=100 ... ... ... ... ... ... ... ... ... Zimbabwe African Statistical Yearbook 2011 / Annuaire Statistique pour l'Afrique 2011
  • 53.
    PRODUCTION 2-9. Electricity Production by Type - Production d'électricité par catégorie Millions Kilowatt hours Millions de kilowatt heures of which Electricity - gross production, Total hydro production Total thermal production public & self-producer Country 2000 2006 2007 2000 2006 2007 2000 2006 2007 Pays Algeria 25 412 35 226 37 196 54 218 226 25 358 35 008 36 970 Algérie Angola 1 445 2 959 3 171 912 2 665 2 583 533 294 588 Angola Benin 84 128 132 2 1 1 82 127 131 Bénin Botswana 1 114 1 042 1 119 ... ... ... 1 114 1 042 1 119 Botswana Burkina Faso 390 548 612 98 80 111 292 468 501 Burkina Faso Burundi 101 95 119 99 93 117 2 2 2 Burundi Cameroon 3 480 5 106 5 753 3 442 3 892 3 847 38 1 214 1 906 Cameroun Cape Verde 146 252 269 ... ... ... 139 245 263 Cap-Vert Central African Republic 107 139 160 84 110 130 23 29 30 République Centrafricaine Chad 92 102 105 ... ... ... 92 102 105 Tchad Comoros 28 51 50 3 5 2 25 46 48 Comores Congo 298 453 407 297 372 335 1 81 72 Congo Congo, Dem. Republic 6 018 7 886 8 302 5 999 7 862 8 276 19 24 26 Rép. Démocratique du Congo Côte d'Ivoire 4 813 5 535 5 631 1 764 1 510 1 797 3 049 4 025 3 834 Côte d'Ivoire Djibouti 180 280 292 ... ... ... 180 280 292 Djibouti Egypt 70 337 118 407 128 129 14 266 12 925 15 510 55 990 104 866 111 788 Egypte Equatorial Guinea 50 95 95 7 7 2 43 88 93 Guinée Equatoriale Eritrea 209 269 288 ... ... ... 209 267 286 Erythrée Ethiopia 1 696 3 270 3 503 1 646 3 259 3 369 23 10 133 Ethiopie Gabon 1 315 1 732 1 844 803 945 801 512 787 1 043 Gabon Gambia 90 216 229 ... ... ... 90 216 229 Gambie Ghana 7 224 8 435 6 984 6 606 5 619 3 727 618 2 816 3 257 Ghana Guinea 913 872 973 511 461 538 402 411 435 Guinée Guinea-Bissau 58 66 70 ... ... ... 58 66 70 Guinée-Bissau Kenya 4 323 7 323 6 773 1 325 3 025 3 592 2 569 3 252 2 192 Kenya Lesotho 290 200 200 290 200 200 ... ... ... Lesotho Liberia 310 351 353 ... ... ... 310 351 353 Libéria Libyan Arab Jamahiriya 15 496 23 992 25 694 ... ... ... 15 496 23 992 25 694 Jamahiriya Arabe Libyenne 52 Madagascar 780 990 935 540 600 540 240 390 395 Madagascar Malawi 1 226 1 580 1 637 1 033 1 354 1 403 193 226 234 Malawi Mali 412 489 495 235 266 271 177 223 224 Mali Mauritania 234 569 587 ... ... ... 234 569 587 Mauritanie Mauritius 1 777 2 350 2 465 95 77 84 1 682 2 273 2 381 Maurice Morocco 13 715 23 192 22 858 718 1 601 1 331 12 933 21 408 21 248 Maroc Mozambique 8 849 14 737 16 076 8 836 14 717 16 063 13 20 13 Mozambique Namibia 1 414 1 491 1 694 1 380 1 385 1 564 34 106 130 Namibie Niger 190 179 197 ... ... ... 190 179 197 Niger Nigeria 14 727 23 110 22 978 5 743 7 714 6 406 8 984 15 396 16 572 Nigéria Rwanda 113 171 169 109 41 34 4 129 135 Rwanda Sao Tome and Principe 26 42 43 7 8 10 19 34 33 Sao Tomé-et-Principe Senegal 1 671 1 962 2 124 ... ... ... 1 669 1 958 2 124 Sénégal Seychelles 188 252 271 ... ... ... 188 252 271 Seychelles Sierra Leone 95 41 60 16 4 18 79 37 42 Sierra Leone Somalia 250 307 326 ... 12 15 250 295 311 Somalie South Africa 210 670 253 798 263 479 3 934 5 581 3 908 193 726 236 384 248 201 Afrique du Sud Sudan 2 450 4 209 4 541 1 183 1 370 1 451 1 267 2 839 3 090 Soudan Swaziland 470 436 454 192 156 173 277 280 281 Swaziland Tanzania 2 479 2 776 4 175 2 145 1 436 2 511 334 1 340 1 664 Tanzanie Togo 275 221 196 199 91 92 76 130 104 Togo Tunisia 10 095 14 122 14 060 64 92 49 10 008 13 992 13 968 Tunisie Uganda 1 582 1 615 1 952 1 576 1 239 1 412 6 376 540 Ouganda Zambia 7 798 9 385 9 853 7 750 9 329 9 796 48 56 57 Zambie Zimbabwe 6 995 9 776 9 180 3 260 5 552 5 213 3 735 4 224 3 967 Zimbabwe Africa 434 500 592 830 619 258 77 223 95 875 97 508 343 633 483 224 508 228 Afrique African Statistical Yearbook 2011 / Annuaire Statistique pour l'Afrique 2011
  • 54.
    53 African Statistical Yearbook2011 / Annuaire Statistique pour l'Afrique 2011
  • 55.
    3 54 Section Monetary and Financial Statistics Statistiques monétaires et financières African Statistical Yearbook 2011 / Annuaire Statistique pour l'Afrique 2011
  • 56.
    2011 Principaux faits sur le Main facts about Africa’s commerce extérieur africain de external trade of goods in 2009 marchandises en 2009 Africa’s share in world trade is about 3.2%. La part de l’Afrique dans le commerce mondial était d’environ 3,2%. Energy products contribute to more than half of Africa’s exports products (see figure 1), almost the same level Les produits énergétiques contribuaient à plus de la over the past years, showing the lack of diversification moitié des exportations totales africaines (cf. Graphique of Africa’s exports. 1), à l’instar des années précédentes, indiquant la faible diversification des exportations. Figure 1 - Africa: Main products exported (As % of total exports) Graphique 1 - Afrique: Principaux produits exportés, 2009 (En % des exportations totales) Petroleum oils and oils obtained from bituminous 44.8% minerals, crude. Huiles de pétrole ou minéraux bitumineux, brut. 44.8% Natural gas, liquefied 3.9% Gaz naturel, liquéfiés 3.9% Natural gas, in gaseous state 3.7% Petroleum oils & oils obtained from bituminous minerals Gaz naturel à l'état gazeux 3.7% 1.9% (other than crude) & preparations Huiles de pétrole ou minéraux bitumineux, autre que Light Petroleum oils and preparations 1.8% 1.9% brut& preparations Huiles de pétrole léger et préparations 1.8% The share of Africa in crude petroleum and natural gas world trade is around 18 %. Le commerce africain de pétrole brut et de gaz naturel 55 China (see figure 2) is the top partner of Africa in terms représentaient environ 18% du commerce mondial de ces of total trade (12.5% of total trade), followed by the USA mêmes produits. (12.2%), France (8.5%), Italy (8.2%) and Germany (6%). En termes de principaux partenaires au commerce total Figure 2 - Africa: Main trade partners de marchandises, la Chine (cf. Graphique 2) venait en tête (exports and imports) (As % of total trade) (12,5% du commerce total) suivi des Etats-Unis (12,2%), de la France (8,5%), de l’Italie (8,2%) et de l’Allemagne (6%). China 12.5% United States 12.2% Graphique 2 - Afrique: Principaux partenaires commerciaux (En% du total des échanges) France 8.2% Chine 12.5% Italy 7.7% Etats-Unis 12.2% Germany 6.0% France 8.2% Spain 5.0% India Italie 7.7% 4.7% Allemagne 6.0% United Kingdom 3.6% Espagne 5.0% Netherlands 3.4% Inde 4.7% Royaume-Uni 3.6% Pays-Bas 3.4% African Statistical Yearbook 2011 / Annuaire Statistique pour l'Afrique 2011
  • 57.
    Principaux faits surle Main facts about Africa’s commerce extérieur africain de external trade of goods in 2009 marchandises en 2009 However, the USA took the lead in term of exports des- S’agissant des partenaires à l’exportation, les Etats-Unis tination of African countries (see Figure 3), while China venaient en tête (cf. Graphique 3), alors que la China était was the main supplier to Africa, accounting for 13.3% of le principal pays d’importation de l’Afrique, comptant Africa’s imports followed by the USA, 11.7%. pour 13,3% des importations totales africaines, suivi des Etats-Unis avec 11,7%. Figure 3 - Africa: Main destinations of exports, 2009 (As % of total exports) Graphique 3 - Afrique: Principales destinations des exportations, 2009 (En % des exportations totales) United States China 17.4% Etats-Unis 17.4% 11.7% Italy 9.2% Chine 11.7% France 7.5% Italie 9.2% Spain 6.2% France 7.5% India 5.7% Espagne 6.2% Germany 5.3% Inde 5.7% United Kingdom 3.7% Allemagne 5.3% Netherlands 3.2% Royaume-Uni 3.7% Japan 2.5% Pays-Bas 3.2% Japon 2.5% Figure 4 – Africa: Main origins of imports, 2009 Graphique 4 - Afrique: Principales origines des China importations, 2009 (En % des importations totales) 13.3% France 9.0% Chine 56 United States 6.8% 13.3% Germany 6.7% France 9.0% Italy 6.2% Etats-Unis 6.8% India 3.7% Allemagne 6.7% Spain 3.6% Italie 6.2% Korea, Rep. 3.6% Inde 3.7% Netherlands 3.6% Espagne 3.6% United Kingdom 3.4% Corée, Rép 3.6% Pays-Bas 3.6% Royaume-Uni 3.4% Analysis of Africa’s imports by categories of products indicate that Machinery and transport equipment con- stitute the largest share of imports (36.7%) followed by L’analyse des importations africaines par catégorie de manufactured goods (17.9%), while Food and live animals produits indiquait la prédominance des machines et maté- accounted for 10.7% (Figure 5). riel de transport (36,7% des importations totales) suivi des produits manufacturés (17,9%), alors que l’importation de produits alimentaires et d’animaux vivants venait en troisième position et comptait environ pour 10,7% (cf. Graphique 5). African Statistical Yearbook 2011 / Annuaire Statistique pour l'Afrique 2011
  • 58.
    2011 Principaux faits sur le Main facts about Africa’s commerce extérieur africain de external trade of goods in 2009 marchandises en 2009 Figure 5 - Africa: Imports by Main Categories of Graphique 5 - Afrique: Principales catégories de produits products, 2009 importés, 2009 (En % des importations totales) Machinery and transport equipment Machines et matériel de transport 36.7% 36.7% Manufact goods classified chiefly by material 17.9% Produits manufacturés classés principalement par 17.9% matériel Food and live animals 10.7% Alimentation et animaux vivants 10.7% Chemicals 9.6% Produits chimiques 9.6% Mineral fuels, lubricants and related materials 9.6% Combustibles minéraux, lubrifiants et produits connexes 9.6% Miscellaneous manufactured articles 7.8% Divers produits manufacturés 7.8% Commod. & transacts. Not class. Accord. To Kind 2.8% Produits de base & transacts. Non classé. Selon leur 2.8% type Crude materials, inedible, except fuels 2.6% Matières brutes non comestibles, sauf les carburants 2.6% Animal and vegetable oils and fats 1.4% Huiles animales et végétales et de graisses 1.4% Beverages and tobacco 1.0% Boissons et tabac 1.0% 57 African Statistical Yearbook 2011 / Annuaire Statistique pour l'Afrique 2011
  • 59.
    MONETARY STATISTICS -STATISTIQUES MONETAIRES 3-1. Broad Money Supply (M2) / Masse monétaire (M2) Income Velocity of Money Amount (billions nat. currency) / Annual % Growth / Acr. Annuel (GDP/M2) / Vitesse de circ. de la Montant (milliards de mon. nat.) en % monnaie (PIB/M2) Country 2005 2009 2010 2005 2009 2010 2005 2009 2010 Pays Algeria 3 794.4 6 600.2 7 323.2 8.8 1.6 11.0 2.0 1.5 1.5 Algérie Angola 391.2 2 303.8 2 411.0 60.5 62.6 4.7 6.8 2.6 3.3 Angola Benin 634.7 1 188.6 1 204.2 26.3 8.0 1.3 3.6 2.6 2.7 Bénin Botswana 14.7 38.7 42.9 10.6 - 1.3 10.7 3.6 2.1 2.3 Botswana Burkina Faso 555.6 1 048.1 1 219.4 - 4.8 22.3 16.3 5.2 3.8 3.7 Burkina Faso Burundi 277.4 638.4 713.8 24.4 14.5 11.8 3.1 2.4 2.4 Burundi Cameroon 1 517.6 2 323.8 2 491.7 4.9 6.3 7.2 5.8 4.8 4.6 Cameroun Cape Verde 72.4 105.3 109.2 15.8 3.5 3.7 1.2 1.2 1.4 Cap-Vert Central African Republic 128.4 156.4 170.7 16.5 13.3 9.2 5.5 6.0 5.7 République Centrafricaine Chad 247.8 475.9 599.7 31.3 1.1 26.0 12.5 7.1 6.6 Tchad Comoros 36.9 57.6 66.4 7.1 13.3 15.4 4.1 3.4 3.2 Comores Congo 458.2 1 028.6 1 227.3 37.1 5.0 19.3 7.0 4.0 4.4 Congo Côte d'Ivoire 2 081.1 3 511.8 3 983.9 7.7 17.2 13.4 1.7 2.6 3.8 Côte d'Ivoire Democratic Republic of Congo 267.3 1 501.9 1 832.0 24.2 50.4 22.0 32.3 7.2 6.1 République Démocratique du Congo Djibouti 97.7 167.2 182.7 11.3 17.5 9.3 1.3 1.1 1.1 Djibouti Egypt 522.9 866.4 963.3 11.5 9.5 11.2 1.0 1.2 1.3 Egypte Equatorial Guinea 279.1 695.4 1 019.0 34.7 18.8 46.5 13.6 6.9 5.4 Guinée équatoriale Eritrea 21.8 34.7 37.8 10.7 15.7 9.0 ... ... ... Erythrée Ethiopia 47.0 ... ... 18.6 ... ... 2.3 ... ... Ethiopie Gabon 840.4 1 165.2 1 221.9 27.5 2.1 4.9 5.4 4.4 5.2 Gabon Gambia 6.1 11.7 ... 13.1 19.4 ... 2.9 2.2 ... Gambie Ghana 3.1 10.6 13.7 19.5 27.8 29.0 3.1 1.9 1.8 Ghana Guinea 2 000.5 ... ... 33.4 ... ... 5.4 ... ... Guinée Guinea-Bissau 52.8 95.3 121.9 21.3 6.9 27.9 5.7 4.1 3.4 Guinée-Bissau Kenya 550.6 1 044.1 1 249.2 9.9 16.5 19.6 2.6 2.2 2.2 Kenya Lesotho 2.6 5.7 6.6 9.1 17.7 14.5 3.1 2.5 2.2 Lesotho Liberia 6.4 25.0 29.0 34.1 43.4 16.1 4.8 2.4 3.2 Libéria Libyan Arab Jamahiriya 16.5 45.4 43.6 29.0 17.4 - 4.0 3.6 1.6 2.2 Jamahiriya Arabe Libyenne 58 Madagascar 2 031.9 3 900.7 4 277.1 2.2 11.3 9.6 5.0 4.4 4.0 Madagascar Malawi 54.0 174.0 ... 16.2 24.6 ... 6.0 3.8 ... Malawi Mali 841.9 1 144.8 1 204.4 9.8 14.6 5.2 3.4 3.7 3.5 Mali Mauritania 153.8 278.0 292.7 14.3 15.5 5.3 3.2 2.9 4.1 Mauritanie Mauritius 187.3 295.7 297.6 7.5 8.4 0.6 1.0 1.0 1.1 Maurice Morocco 468.9 779.3 809.5 15.7 4.9 3.9 1.1 0.9 1.0 Maroc Mozambique 42.4 107.1 128.8 24.3 33.0 20.3 3.6 2.5 3.1 Mozambique Namibia 17.4 31.0 ... 9.8 5.9 ... 2.7 2.5 ... Namibie Niger 248.4 472.5 545.7 7.0 18.7 15.5 7.2 5.2 5.1 Niger Nigeria 2 612.9 10 210.7 10 844.3 22.6 14.4 6.2 5.6 2.5 2.8 Nigéria Rwanda 253.1 ... ... 18.0 ... ... 5.7 ... ... Rwanda Sao Tome and Principe 433.5 1 133.3 1 315.7 45.4 8.2 16.1 2.8 2.7 3.0 Sao Tomé-et-Principe Senegal 1 549.3 2 234.4 2 469.0 8.2 11.4 10.5 3.0 2.7 2.4 Sénégal Seychelles 4.9 6.4 7.3 1.7 7.8 13.7 1.0 1.7 1.7 Seychelles Sierra Leone 724.2 1 685.0 2 236.5 31.3 27.5 32.7 4.8 3.8 3.7 Sierra Leone Somalia ... ... ... ... ... ... ... ... ... Somalie South Africa 937.1 1 577.4 1 690.9 19.9 0.4 7.2 1.7 1.5 1.6 Afrique du Sud Sudan 13.5 28.3 ... 43.4 23.7 ... 5.0 4.2 ... Soudan Swaziland 3.5 7.7 8.3 9.7 26.8 7.9 4.6 3.5 3.4 Swaziland Tanzania, United Republic of 4 250.7 8 780.1 11 012.6 34.8 17.7 25.4 3.8 3.2 2.9 Tanzanie, République Unie de Togo 314.0 616.7 690.6 2.2 16.0 12.0 3.5 2.4 2.4 Togo Tunisia 22.4 36.3 40.4 11.0 12.5 11.4 1.9 1.6 1.6 Tunisie Uganda 3 103.4 6 797.7 9 354.7 17.2 17.5 37.6 5.8 5.0 4.2 Ouganda Zambia 5 757.8 13 796.9 17 597.2 3.2 7.7 27.5 5.6 4.7 4.9 Zambie Zimbabwe 58.4 ... ... 532.7 ... ... 0.1 ... ... Zimbabwe ... ... ... ... ... ... ... ... ... Africa ... ... ... ... ... ... ... ... ... Afrique African Statistical Yearbook 2011 / Annuaire Statistique pour l'Afrique 2011
  • 60.
    MONETARY STATISTICS -STATISTIQUES MONETAIRES 3-2. Exchange Rate - Taux de change Nominal Exchange Rate Index (2000 = 100) / Indice du taux de change nominal (2000 = 100) Country 2002 2003 2004 2005 2006 2007 2008 2009 2010 Pays Algeria 105.9 102.8 95.7 97.4 96.5 92.1 85.8 96.5 98.8 Algérie Angola 433.5 743.1 832.0 868.1 800.4 764.0 747.3 790.1 915.3 Angola Benin 97.9 81.6 74.2 74.1 73.4 67.3 62.9 66.3 69.6 Bénin Botswana 124.0 97.0 92.0 100.2 114.4 120.3 133.8 140.2 133.2 Botswana Burkina Faso 97.9 81.6 74.2 74.1 73.4 67.3 62.9 66.3 69.6 Burkina Faso Burundi 129.1 150.2 152.8 150.1 142.7 150.1 164.5 170.7 170.7 Burundi Cameroon 97.9 81.6 74.2 74.1 73.4 67.3 62.9 66.3 69.6 Cameroun Cape Verde 97.9 81.6 74.2 74.1 73.4 67.3 62.9 66.3 69.6 Cap-Vert Central African Republic 97.9 81.6 74.2 74.1 73.4 67.3 62.9 66.3 69.6 République Centrafricaine Chad 97.9 81.6 74.2 74.1 73.4 67.3 62.9 66.3 69.6 Tchad Comoros 97.9 81.6 74.2 74.1 73.4 67.3 62.9 66.3 69.6 Comores Congo 97.9 81.6 74.2 74.1 73.4 67.3 62.9 66.3 69.6 Congo Congo, Dem. Republic 97.9 81.6 74.2 74.1 73.4 67.3 62.9 66.3 69.6 Rép. Démocratique du Congo Côte d'Ivoire 1 588.0 1 857.0 1 829.8 2 170.8 2 145.0 2 367.0 2 561.9 3 709.3 4 149.6 Côte d'Ivoire Djibouti … … … … … … … … … Djibouti Egypt 129.6 168.5 178.5 166.4 165.1 162.3 156.5 159.7 161.5 Egypte Equatorial Guinea 97.9 81.6 74.2 74.1 73.4 67.3 62.9 66.3 69.6 Guinée Equatoriale Eritrea 145.0 144.2 143.2 159.7 159.7 159.7 159.7 159.7 159.7 Erythrée Ethiopia 104.3 104.7 105.1 105.5 105.9 109.1 116.8 143.3 … Ethiopie Gabon 97.9 81.6 74.2 74.1 73.4 67.3 62.9 66.3 69.6 Gabon Gambia 155.8 213.5 234.8 223.5 219.5 194.5 173.5 208.4 0.0 Gambie Ghana 145.4 159.1 165.1 166.3 168.2 171.6 194.1 258.5 262.6 Ghana Guinea 113.1 113.6 127.4 208.6 306.3 236.0 314.8 … … Guinée Guinea-Bissau 97.9 81.6 74.2 74.1 73.4 67.3 62.9 66.3 69.6 Guinée-Bissau Kenya 103.4 99.7 103.9 99.2 94.7 88.4 90.8 101.5 104.0 Kenya Lesotho 151.9 109.0 93.1 91.6 97.6 101.5 119.0 122.1 105.5 Lesotho Liberia 150.8 145.0 134.1 139.4 141.7 149.6 154.3 166.7 174.7 Libéria Libyan Arab Jamahiriya 248.1 252.4 254.8 255.4 256.5 246.5 238.9 244.7 248.1 Jamahiriya Arabe Libyenne 59 Madagascar 101.0 91.5 138.1 148.0 158.3 138.4 126.2 144.5 154.4 Madagascar Malawi 128.8 163.6 182.9 198.9 228.4 235.0 236.0 237.1 … Malawi Mali 97.9 81.6 74.2 74.1 73.4 67.3 62.9 66.3 69.6 Mali Mauritania 113.7 110.1 … 111.1 112.4 108.2 99.7 109.8 114.5 Mauritanie Mauritius 114.1 106.3 104.8 112.4 120.8 119.3 108.4 121.8 117.3 Maurice Morocco 103.7 90.1 83.5 83.4 82.8 77.1 72.9 75.8 79.2 Maroc Mozambique 155.5 156.2 148.3 151.4 166.8 169.7 159.6 180.7 223.0 Mozambique Namibia 151.9 109.0 93.1 91.6 97.6 101.5 119.0 122.1 105.5 Namibie Niger 97.9 81.6 74.2 74.1 73.4 67.3 62.9 66.3 69.6 Niger Nigeria 118.6 127.1 130.7 129.1 126.5 123.7 116.6 146.4 147.8 Nigéria Rwanda 122.0 138.0 148.2 143.1 141.6 140.4 140.3 145.8 149.6 Rwanda Sao Tome and Principe 113.9 117.2 124.1 132.3 156.0 169.7 184.2 203.2 231.9 Sao Tomé-et-Principe Senegal 97.9 81.6 74.2 74.1 73.4 67.3 62.9 66.3 69.6 Sénégal Seychelles 95.9 94.5 96.3 96.3 96.6 117.3 165.5 238.2 211.2 Seychelles Sierra Leone 100.3 112.2 129.1 138.1 141.6 142.7 142.5 161.8 … Sierra Leone Somalia … … … … … … … … … Somalie South Africa 151.9 109.0 93.1 91.6 97.6 101.5 119.0 122.1 105.5 Afrique du Sud Sudan 102.4 101.5 100.3 94.7 84.5 78.4 81.3 89.5 … Soudan Swaziland 151.9 109.0 93.1 91.6 97.6 101.5 119.0 122.1 105.5 Swaziland Tanzania 120.8 129.7 136.1 141.0 156.4 155.6 149.5 165.0 176.1 Tanzanie Togo 97.9 81.6 74.2 74.1 73.4 67.3 62.9 66.3 69.6 Togo Tunisia 103.7 94.0 90.9 94.7 97.1 93.5 89.9 98.5 104.4 Tunisie Uganda 109.3 119.4 110.1 108.3 111.4 104.8 104.6 123.5 132.4 Ouganda Zambia 141.4 152.2 153.6 143.5 115.8 128.7 120.4 162.2 154.2 Zambie Zimbabwe … … … … … … … … … Zimbabwe African Statistical Yearbook 2011 / Annuaire Statistique pour l'Afrique 2011
  • 61.
    FINANCE 3-3. Government Finance - Finances Publiques % of GDP % du PIB Revenue / Recette Expenditure / Depense Fiscal Balance / Solde budgetaire Country 2005 2009 2010 2005 2009 2010 2005 2009 2010 Pays Algeria 40.8 36.7 40.3 27.2 43.5 44.4 13.6 -6.8 -4.1 Algérie Angola 40.7 30.9 38.8 32.2 39.5 33.9 8.5 -8.6 5.0 Angola Benin 18.9 21.7 25.4 21.3 25.9 26.9 -2.4 -4.2 -1.5 Bénin Botswana 34.3 36.6 30.3 33.2 42.2 39.8 1.1 -5.6 -9.5 Botswana Burkina Faso 17.3 18.6 20.5 22.3 25.0 24.9 -5.0 -6.4 -4.5 Burkina Faso Burundi 32.5 27.1 30.5 34.7 34.9 33.7 -2.3 -7.8 -3.2 Burundi Cameroon 18.2 17.1 17.0 14.4 17.5 17.3 3.8 -0.4 -0.4 Cameroun Cape Verde 30.9 29.3 30.5 35.0 35.7 44.2 -4.1 -6.3 -13.7 Cap-Vert Central African Republic 12.4 16.1 15.6 16.9 15.4 28.7 -4.5 0.7 -13.1 République Centrafricaine Chad 12.7 19.7 20.0 13.0 30.6 32.5 -0.4 -10.9 -12.5 Tchad Comoros 20.0 22.7 26.8 19.9 22.0 22.7 0.1 0.7 4.1 Comores Congo 38.8 32.5 51.0 23.2 27.1 21.3 15.6 5.4 29.7 Congo Côte d'Ivoire 18.1 19.5 19.3 19.0 21.1 21.7 -3.1 -6.4 -2.0 Côte d'Ivoire Democratic Republic of Congo 16.4 24.1 24.8 19.5 30.6 26.9 -0.8 -1.6 -2.5 République Démocratique du Congo Djibouti 37.1 38.7 36.1 36.9 43.8 39.4 0.2 -5.1 -3.3 Djibouti Egypt 20.4 26.7 18.6 29.4 33.3 26.8 -9.0 -6.6 -8.2 Egypte Equatorial Guinea 37.1 49.5 51.2 16.0 59.1 49.7 21.1 -9.6 1.5 Guinée équatoriale Eritrea ... ... ... ... ... ... ... ... ... Erythrée Ethiopia 18.9 16.3 15.6 23.1 17.2 16.8 -4.2 -0.9 -1.2 Ethiopie Gabon 29.8 25.0 26.9 20.4 24.8 27.8 9.4 0.2 -0.9 Gabon Gambia 15.7 19.0 16.2 22.1 22.0 16.7 -6.3 -3.0 -0.5 Gambie Ghana 29.1 34.0 32.3 30.7 41.5 43.9 -1.6 -7.6 -11.6 Ghana Guinea 15.2 16.7 16.7 16.0 25.1 28.7 -0.9 -8.4 -12.0 Guinée Guinea-Bissau 14.2 16.9 18.0 17.2 19.8 28.1 -2.9 -2.9 -10.1 Guinée-Bissau Kenya 21.5 23.4 22.2 21.1 26.2 28.6 0.4 -2.8 -6.3 Kenya Lesotho 52.5 62.4 65.9 44.4 54.0 70.8 8.2 8.4 -4.9 Lesotho Liberia 14.8 26.7 22.7 14.1 28.3 21.8 0.8 -1.6 0.9 Libéria Libyan Arab Jamahiriya 62.9 60.2 68.3 33.5 53.1 47.4 29.4 7.1 20.9 Jamahiriya Arabe Libyenne Madagascar 12.3 12.1 14.8 21.0 14.6 16.9 -8.7 -2.5 -2.1 Madagascar 60 Malawi 26.0 31.3 31.9 29.8 34.8 33.0 -3.8 -3.5 -1.1 Malawi Mali 19.9 21.3 22.9 24.6 26.0 27.1 -4.7 -4.7 -4.2 Mali Mauritania 26.6 25.5 23.3 33.7 30.6 27.0 -7.1 -5.1 -3.7 Mauritanie Mauritius 21.2 19.3 19.1 23.6 26.1 23.6 -2.4 -6.8 -4.5 Maurice Morocco 25.1 25.9 ... 22.6 27.0 ... 2.5 -1.1 ... Maroc Mozambique 20.0 20.0 ... 23.5 22.4 ... -3.5 -2.3 ... Mozambique Namibia 24.0 30.1 25.8 26.9 28.1 28.3 -2.8 2.0 -2.5 Namibie Niger 18.2 18.9 15.7 20.2 25.5 22.4 -2.0 -6.6 -6.7 Niger Nigeria 38.1 19.3 20.1 13.0 13.8 13.4 25.1 5.5 6.8 Nigéria Rwanda 24.0 24.6 25.2 23.7 26.8 25.7 0.3 -2.2 -0.5 Rwanda Sao Tome and Principe 34.3 31.3 32.8 45.2 62.0 42.0 -10.9 -30.7 -9.2 Sao Tomé-et-Principe Senegal 20.8 22.0 23.8 24.0 26.4 29.2 -3.2 -4.5 -5.3 Sénégal Seychelles 43.0 38.8 34.5 36.0 33.8 32.0 7.0 5.1 2.5 Seychelles Sierra Leone 23.1 19.8 16.4 23.6 22.9 20.4 -0.5 -3.2 -3.9 Sierra Leone Somalia ... ... ... ... ... ... ... ... ... Somalie South Africa 22.1 25.4 21.8 23.4 26.5 28.1 -1.2 -1.1 -6.3 Afrique du Sud Sudan 18.3 16.8 ... 10.2 15.5 ... 8.1 1.3 ... Soudan Swaziland 35.4 37.9 ... 37.5 37.3 ... -2.1 0.5 ... Swaziland Tanzania, United Republic of 17.3 19.7 22.6 19.8 24.1 27.3 -2.5 -4.5 -4.7 Tanzanie, République Unie de Togo 16.9 16.4 21.1 19.7 19.8 20.6 -2.9 -3.5 0.6 Togo Tunisia 22.2 23.1 23.1 24.5 25.8 25.7 -2.3 -2.7 -2.6 Tunisie Uganda 17.3 13.6 13.2 18.0 13.5 14.8 -0.7 0.1 -1.6 Ouganda Zambia 23.3 20.3 16.4 26.0 22.4 19.5 -2.7 -2.1 -3.1 Zambie Zimbabwe ... ... ... ... ... ... ... ... ... Zimbabwe Africa 29.2 26.5 27.5 26.7 31.7 30.8 2.6 -5.2 -3.3 Afrique African Statistical Yearbook 2011 / Annuaire Statistique pour l'Afrique 2011
  • 62.
    EXTERNAL SECTOR 3-4. External Debt - Dette extérieure Debt outstanding / Encours de la dette Debt service / Service de la dette (As % of GDP) (En % du PIB) (As % of Exports) (En % des exportations) Country 2000 2006 2007 2008 2009 2010 2000 2006 2007 2008 2009 2010 Pays Algeria 46.1 5.0 4.2 3.5 3.8 3.1 20.3 23.8 2.4 1.8 1.1 2.6 Algérie Angola 99.8 20.7 19.5 19.7 23.7 22.2 36.5 8.7 9.7 4.3 12.5 10.0 Angola Benin 55.9 11.6 12.7 15.7 17.9 20.8 16.8 175.0 9.6 3.2 4.5 6.3 Bénin Botswana 42.7 12.5 10.2 8.5 20.5 18.5 18.5 17.2 16.6 7.2 10.2 9.2 Botswana Burkina Faso 62.6 20.0 19.7 19.8 23.1 27.0 20.3 6.2 2.6 6.0 4.8 4.9 Burkina Faso Burundi 155.1 162.0 149.9 129.6 29.3 31.1 70.1 11.5 6.7 10.4 1.9 2.6 Burundi Cameroon 74.3 6.0 5.5 4.9 4.7 5.9 38.2 20.7 7.8 7.3 9.5 7.1 Cameroun Cape Verde 63.9 71.5 67.3 61.1 65.3 65.0 27.8 19.7 16.7 15.5 18.8 21.7 Cap-Vert Central African Rep. 87.0 73.8 58.1 52.9 13.3 15.2 13.8 19.6 15.0 19.9 25.7 39.3 République Centrafricaine Chad 72.6 28.5 24.7 19.3 23.8 26.5 13.2 2.0 1.5 3.5 2.8 3.0 Tchad Comoros 110.9 71.2 61.7 52.8 51.9 39.5 6.5 6.2 63.3 12.3 10.6 7.4 Comores Congo, Republic of 164.9 86.0 94.7 53.1 58.0 16.5 5.2 8.5 6.1 2.5 2.1 9.4 Congo Côte d'Ivoire 178.3 107.3 96.6 79.6 77.0 75.0 1.5 9.8 10.9 11.0 10.6 10.9 Côte d'Ivoire Congo, Dem. Rep. of 293.0 122.5 129.7 115.9 122.3 26.6 83.6 20.8 14.0 14.1 21.2 2.3 République Démocratique du Congo Djibouti 52.0 56.8 63.6 64.1 62.5 58.1 7.6 7.4 7.6 7.2 7.2 7.5 Djibouti Egypt 28.0 27.5 22.9 20.8 16.7 14.1 22.9 15.2 10.5 8.4 12.0 9.7 Egypte Equatorial Guinea 34.4 1.8 1.3 0.8 6.3 9.8 0.8 1.2 0.4 0.1 0.2 0.3 Guinée équatoriale Eritrea 46.6 59.3 58.0 61.9 47.8 40.8 9.3 30.3 34.9 45.0 35.9 34.1 Erythrée Ethiopia 67.3 41.8 12.1 11.6 14.1 15.5 53.0 4.5 3.6 2.9 2.4 3.8 Ethiopie Gabon 58.3 32.7 35.3 15.7 18.7 14.9 15.5 10.8 10.4 25.4 7.4 6.7 Gabon Gambia, The 76.3 101.7 36.2 31.7 34.2 32.5 26.3 31.2 30.5 30.8 30.9 31.2 Gambie Ghana 145.4 31.4 39.2 38.7 50.5 48.0 23.1 11.8 3.7 5.1 4.5 3.8 Ghana Guinea 104.8 108.1 78.3 68.9 68.8 67.4 15.3 12.2 11.1 10.6 8.3 12.2 Guinée Guinea-Bissau 205.7 17.7 14.9 12.3 12.7 1.9 2.5 8.6 5.2 2.5 6.4 458.0 Guinée-Bissau Kenya 41.0 27.3 23.2 24.0 26.6 25.0 27.3 8.3 5.0 4.5 5.0 5.4 Kenya Lesotho 80.4 56.1 58.6 45.9 44.5 46.5 19.1 5.6 10.5 3.9 4.3 4.3 Lesotho Liberia 781.0 783.7 427.1 231.6 188.9 11.6 0.0 29.5 26.6 204.4 335.7 126.0 Libéria Libya 13.8 10.1 7.5 6.9 9.4 7.5 0.0 0.0 0.0 0.0 0.0 0.0 Jamahiriya Arabe Libyenne Madagascar 116.0 31.5 25.9 24.2 26.9 29.3 13.4 133.2 4.4 5.2 6.7 7.1 Madagascar Malawi 153.4 14.5 15.0 16.8 19.1 18.8 19.9 14.3 2.0 1.2 1.2 0.9 Malawi 61 Mali 132.5 32.0 30.4 32.8 36.4 43.1 12.0 5.4 3.9 2.6 3.3 2.5 Mali Mauritania 249.8 94.1 96.8 82.2 103.2 54.0 13.5 5.5 3.2 3.7 3.7 5.5 Mauritanie Mauritius 24.9 13.1 10.9 12.1 15.1 12.8 7.8 5.7 3.9 3.1 4.5 4.2 Maurice Morocco 48.6 23.9 23.7 20.6 23.2 23.0 32.4 10.8 9.9 7.8 7.5 7.2 Maroc Mozambique 143.0 63.2 60.4 48.9 53.0 46.5 74.2 70.7 8.5 8.5 20.0 17.1 Mozambique Namibia 20.4 28.1 25.7 22.3 24.6 19.3 16.0 28.0 30.9 24.7 14.8 10.9 Namibie Niger 88.8 15.8 15.9 14.0 15.8 17.2 73.4 4.4 1.9 1.8 2.0 1.7 Niger Nigeria 65.2 2.4 2.4 2.2 2.6 2.4 6.9 29.5 1.9 0.7 1.0 0.7 Nigéria Rwanda 82.5 15.6 15.3 14.4 14.2 20.2 15.8 26.0 2.4 1.3 1.8 3.0 Rwanda São Tomé & Príncipe 400.7 287.6 104.0 63.8 66.7 67.8 21.8 27.5 10.5 5.5 7.9 22.4 Sao Tomé-et-Principe Senegal 70.6 24.0 24.0 22.3 29.5 30.3 18.9 14.6 6.5 4.6 5.5 5.4 Sénégal Seychelles 45.2 51.1 69.2 82.4 76.7 47.7 9.6 13.9 10.7 6.8 14.1 8.3 Seychelles Sierra Leone 199.5 109.9 31.8 31.1 34.1 29.3 45.9 76.3 144.2 3.2 4.7 4.0 Sierra Leone Somalia ... ... ... ... ... ... ... ... ... ... ... ... Somalie South Africa 27.8 21.9 26.3 26.1 28.0 24.8 52.8 32.6 29.7 38.9 46.6 39.4 Afrique du Sud Sudan 153.7 78.1 68.5 57.7 68.9 58.4 4.5 5.1 1.9 2.5 3.7 5.9 Soudan Swaziland 20.8 15.0 16.6 14.9 16.8 14.6 3.9 1.9 2.0 2.8 2.5 2.8 Swaziland Tanzania 70.2 57.4 27.7 28.2 33.4 30.9 18.5 15.8 131.9 4.3 5.0 3.6 Tanzanie, République Unie de Togo 9.6 84.8 83.8 56.3 55.0 12.6 3.3 0.6 0.7 4.1 5.9 6.1 Togo Tunisia 52.9 53.9 51.8 45.9 49.3 44.3 55.7 57.5 45.1 40.1 55.3 58.4 Tunisie Uganda 57.7 40.5 10.8 11.5 14.4 15.0 27.5 17.0 174.7 2.5 1.8 2.8 Ouganda Zambia 224.8 5.0 9.6 8.6 12.3 9.7 15.7 1.6 1.4 1.9 1.9 1.3 Zambie Zimbabwe ... 80.3 93.3 111.0 121.8 116.7 22.7 24.5 24.9 32.4 26.5 23.5 Zimbabwe Africa 54.4 25.6 23.8 21.1 23.6 20.2 25.8 20.6 12.8 11.0 14.7 12.6 Afrique African Statistical Yearbook 2011 / Annuaire Statistique pour l'Afrique 2011
  • 63.
    EXTERNAL SECTOR 3-5. Balance of payments - Balance des paiements As % of GDP En % du PIB Current account / Trade balance / Solde commercial Solde du compte courant balance Country 2000 2006 2007 2008 2009 2010 2000 2006 2007 2008 2009 2010 Pays Algeria 22.5 29.1 25.2 23.4 5.6 6.8 16.7 24.7 22.5 19.8 0.3 5.5 Algérie Angola 53.4 51.1 50.8 51.0 24.1 33.3 8.7 25.2 15.6 8.5 -10.0 1.0 Angola Benin -8.7 -10.5 -14.4 -13.7 -12.5 -11.2 -4.4 -5.7 -10.2 -8.1 -7.7 -7.1 Bénin Botswana 16.0 16.9 13.9 3.3 -5.9 -1.9 9.7 17.2 15.4 6.9 -5.7 1.5 Botswana Burkina Faso -11.9 -8.0 -8.8 -10.9 -5.8 -2.8 -12.2 -9.1 -8.3 -11.7 -4.6 -2.7 Burkina Faso Burundi -8.3 -20.5 -24.7 -24.2 -15.6 -19.3 -8.6 -14.7 -15.7 -12.3 -15.5 -9.4 Burundi Cameroon 5.8 3.7 3.6 2.0 -1.1 -2.7 -1.4 1.2 1.4 -1.9 -3.3 -3.6 Cameroun Cape Verde -34.8 -41.7 -49.6 -46.5 -40.0 -43.8 -10.9 -5.4 -14.7 -12.9 -9.9 -18.4 Cap-Vert Central African Rep. 4.6 -3.0 -4.2 -7.6 -7.4 -8.3 -1.4 -3.2 -6.4 -9.9 -9.2 -9.9 République Centrafricaine Chad -4.1 31.6 26.2 28.8 5.1 12.3 -15.4 5.9 -3.6 3.2 -16.9 -11.3 Tchad Comoros -14.7 -21.7 -24.7 -33.4 -25.8 -27.3 1.7 -6.1 -7.6 -11.6 -7.6 -10.2 Comores Congo, Republic of 63.2 52.6 39.7 49.7 36.5 43.8 13.5 1.6 -18.2 -1.1 -20.8 -2.6 Congo Côte d'Ivoire 13.8 17.9 13.0 14.2 18.2 19.6 -2.8 2.8 -0.7 2.1 7.2 5.9 Côte d'Ivoire Congo, Dem. Rep. of 5.6 0.4 8.9 -1.1 -5.2 -4.4 -4.0 -2.1 -1.5 -15.9 -10.1 -14.3 République Démocratique du Congo Djibouti -31.5 -43.8 -50.1 -66.9 -50.6 -51.4 -9.0 -14.7 -25.7 -41.8 -17.5 -9.1 Djibouti Egypt -11.6 -11.2 -12.5 -14.4 -13.3 -11.5 -1.2 1.6 1.7 0.5 -2.3 -2.0 Egypte Equatorial Guinea 57.5 72.6 68.7 76.6 37.5 43.3 -15.8 9.1 1.1 10.4 -7.6 1.3 Guinée équatoriale Eritrea -41.3 -29.2 -24.2 -22.0 -17.0 -15.5 -0.6 -3.6 -6.1 -5.5 -5.0 -1.4 Erythrée Ethiopia -13.8 -23.7 -20.1 -19.9 -19.5 -22.5 -4.1 -9.1 -4.5 -5.6 -5.0 -6.6 Ethiopie Gabon 49.8 47.1 47.0 51.8 38.4 46.3 19.7 17.4 17.9 23.5 13.6 14.3 Gabon Gambia, The -5.9 -20.8 -20.8 -21.4 -21.0 -22.3 -5.7 -8.8 -9.7 -12.6 -10.1 -12.2 Gambie Ghana -16.5 -24.1 -26.5 -31.0 -15.1 -9.2 -7.8 -8.3 -14.6 -22.0 -8.1 -7.6 Ghana Guinea 2.7 2.6 -0.3 -0.5 -0.2 3.3 -6.4 -7.5 -11.0 -9.4 -9.2 -8.3 Guinée Guinea-Bissau 1.0 -9.1 -4.1 -8.4 -9.5 -8.2 2.2 -5.6 -5.3 -4.1 -4.1 -5.6 Guinée-Bissau Kenya -10.2 -14.5 -15.7 -18.8 -19.5 -20.9 -2.3 -2.1 -3.8 -6.6 -5.3 -7.8 Kenya Lesotho -69.2 -48.4 -50.6 -50.9 -54.6 -48.0 -20.6 4.8 13.4 9.4 -0.2 -14.9 Lesotho Liberia -6.0 -46.3 -39.3 -53.5 -46.6 -50.2 -24.9 -13.9 -31.4 -57.4 -33.2 -40.9 Libéria Libya 34.3 49.6 39.2 50.6 25.6 32.9 29.8 46.7 37.5 47.0 18.5 28.4 Jamahiriya Arabe Libyenne Madagascar -2.7 -10.2 -13.6 -20.2 -19.3 -17.4 -5.8 -10.1 -11.9 -18.7 -20.9 -17.0 Madagascar 62 Malawi -8.0 -24.0 -24.7 -18.6 -17.1 -15.7 -5.3 -7.2 -9.6 -0.3 -2.1 1.1 Malawi Mali -1.9 1.2 -4.1 -7.8 -3.0 -1.4 -9.6 -6.3 -9.8 -12.7 -7.5 -8.8 Mali Mauritania -9.2 7.4 0.8 -4.3 -2.7 12.0 -9.0 -1.3 -10.5 -15.6 -12.6 -8.8 Mauritanie Mauritius -8.5 -16.7 -18.0 -20.6 -17.4 -17.6 -0.7 -9.4 -5.4 -10.1 -7.4 -7.9 Maurice Morocco -8.7 -15.0 -22.0 -21.9 -18.1 -21.1 -1.3 2.0 -3.4 -2.5 2.2 4.9 Maroc Mozambique -16.6 -7.8 -8.3 -11.6 -13.3 -10.3 -16.7 -16.2 -15.9 -16.4 -11.1 -12.1 Mozambique Namibia 0.2 2.7 -2.3 0.3 -8.4 -8.9 7.9 15.9 9.4 11.0 1.5 -2.9 Namibie Niger -2.9 -6.6 -5.9 -8.1 -11.8 -15.3 -6.7 -8.6 -8.2 -13.0 -23.4 -18.1 Niger Nigeria 30.4 23.9 23.0 22.7 17.5 22.4 12.5 26.5 18.7 15.4 13.1 13.3 Nigéria Rwanda -9.2 -10.0 -10.8 -14.6 -15.8 -18.6 -3.3 -7.1 -2.2 -6.0 -8.4 -6.6 Rwanda São Tomé & Príncipe -29.3 -41.0 -41.8 -47.6 -37.5 -41.2 -15.1 -28.6 -38.6 -38.4 -26.2 -28.1 Sao Tomé-et-Principe Senegal -8.8 -17.1 -22.0 -25.6 -19.3 -20.5 -7.0 -9.2 -11.6 -14.2 -7.7 -9.2 Sénégal Seychelles -14.8 -28.5 -41.6 -55.1 -33.8 -32.6 -6.1 -13.1 -28.9 -48.8 -30.3 -33.2 Seychelles Sierra Leone -10.0 -6.6 -5.7 -10.0 -9.3 -10.0 -8.6 -3.5 -3.4 -11.4 -8.7 -9.0 Sierra Leone Somalia ... ... ... ... ... ... ... ... ... ... ... ... Somalie South Africa 3.5 -1.7 -2.0 -1.6 0.1 0.8 -0.1 -5.3 -7.2 -7.1 -4.1 2.8 Afrique du Sud Sudan 1.9 -3.5 2.5 5.6 2.1 3.3 -8.4 -15.2 -12.5 -9.1 -10.1 -8.3 Soudan Swaziland -9.0 -8.5 -3.3 -0.3 -4.2 -4.1 -4.5 -6.7 -4.6 -2.8 -12.0 -16.6 Swaziland Tanzania -6.9 -13.6 -15.7 -16.4 -12.5 -13.2 -4.3 -8.0 -9.4 -11.3 -8.2 -10.3 Tanzanie, République Unie de Togo -13.6 -15.0 -16.2 -14.7 -12.7 -13.2 -9.0 -8.6 -9.1 -7.4 -6.6 -6.8 Togo Tunisia -10.5 -7.3 -7.4 -8.9 -8.5 -10.9 -3.8 -1.8 -2.4 -3.8 -2.8 -4.7 Tunisie Uganda -7.5 -8.4 -7.3 -5.6 -7.4 -9.1 -6.5 -2.9 -2.3 -2.2 -3.7 -9.0 Ouganda Zambia -6.8 12.2 7.8 2.8 7.1 13.7 -18.3 -0.4 -6.5 -7.1 -3.2 -1.5 Zambie Zimbabwe ... -7.8 -5.2 -18.6 -28.8 -25.9 ... -6.0 -4.3 -14.9 -16.5 -19.9 Zimbabwe Africa 5.5 7.9 6.5 7.4 0.3 2.8 3.2 7.3 4.4 4.1 -1.2 0.9 Afrique African Statistical Yearbook 2011 / Annuaire Statistique pour l'Afrique 2011
  • 64.
    EXTERNAL SECTOR 3-6. Financial Flows - Flux financiers US $ per Capita $ EU par habitant Official development / Aide publique au Foreign direct investment/ Investissement direct assistance (ODA) développement (APD) (FDI) inflows étranger (IDE) entrant Country 2000 2005 2006 2007 2008 2009 2000 2005 2006 2007 2008 2009 Pays Algeria 6.5 11.4 6.8 12.8 10.5 10.5 14.4 35.4 58.9 54.5 86.7 93.3 Algérie Angola 21.2 29.0 11.5 17.3 25.8 16.8 61.5 475.8 634.7 686.0 1,161.2 917.4 Angola Benin 36.6 52.1 56.8 71.2 96.3 102.5 9.0 8.0 8.2 39.2 26.1 13.9 Bénin Botswana 17.8 27.9 39.9 62.5 418.1 162.3 33.2 161.7 282.4 287.1 302.4 136.1 Botswana Burkina Faso 15.4 59.4 74.9 81.5 85.7 92.8 2.0 2.9 2.9 29.4 11.7 14.7 Burkina Faso Burundi 14.4 56.2 66.6 73.4 78.6 84.8 1.8 0.1 0.0 0.1 2.1 1.5 Burundi Cameroon 23.7 26.0 107.4 121.4 34.6 40.9 10.0 14.2 19.5 17.9 17.0 21.3 Cameroun Cape Verde 213.5 369.5 315.4 376.3 505.2 446.4 99.0 185.8 297.6 432.9 482.2 272.4 Cap-Vert Central African Republic 20.1 23.6 35.7 47.2 68.5 63.2 0.2 8.7 9.2 15.1 31.3 11.3 République Centrafricaine Chad 15.5 45.2 34.3 42.6 49.8 66.8 13.7 -11.8 -33.2 -8.3 27.8 55.0 Tchad Comoros 33.9 41.3 55.5 80.6 67.5 91.7 0.2 1.0 1.0 13.6 13.6 16.5 Comores Congo 10.6 469.6 85.1 39.1 159.8 93.2 53.4 485.8 634.1 749.6 818.1 686.4 Congo Côte d'Ivoire 20.3 5.3 14.3 9.9 36.1 136.9 13.6 18.0 18.5 24.7 27.9 23.7 Côte d'Ivoire Democratic Republic of Congo 3.5 37.0 43.2 26.7 34.8 46.3 1.4 5.0 35.6 34.0 18.7 République Démocratique du Congo Djibouti 97.8 101.4 157.6 154.1 165.7 222.3 4.5 80.9 224.2 267.8 320.7 137.1 Djibouti Egypt 18.9 14.2 12.4 15.8 19.2 13.2 17.6 76.6 143.1 165.0 135.3 95.6 Egypte Equatorial Guinea 40.2 72.1 49.6 59.3 60.7 59.7 292.1 1,454.3 887.7 2,349.7 -1,501.0 3,093.7 Guinée équatoriale Eritrea 48.1 95.5 34.4 43.3 39.3 39.6 7.6 -0.3 0.1 0.0 -0.1 0.0 Erythrée Ethiopia 10.5 29.4 30.2 39.3 50.8 58.3 2.1 4.0 8.3 3.4 1.7 1.4 Ethiopie Gabon 9.5 49.0 23.6 41.5 50.3 62.9 -34.6 196.5 217.1 218.4 169.5 26.6 Gabon Gambia 38.1 46.4 56.2 56.2 72.1 98.3 33.4 34.3 54.7 58.7 53.9 36.4 Gambie Ghana 30.6 58.8 62.1 59.6 66.8 81.0 8.5 7.4 32.6 43.8 62.5 86.3 Ghana Guinea 18.2 23.6 20.2 27.2 39.1 25.6 1.2 12.5 14.9 46.0 45.6 16.8 Guinée Guinea-Bissau 62.2 50.6 66.7 93.8 101.0 111.6 0.5 6.1 13.3 14.3 4.6 10.7 Guinée-Bissau Kenya 16.2 23.9 30.0 42.1 43.3 56.6 3.5 0.7 1.6 23.2 3.0 4.5 Kenya Lesotho 19.4 35.7 37.4 68.2 76.1 65.2 16.7 30.3 46.9 51.2 29.4 25.4 Lesotho Liberia 23.9 78.8 92.2 248.1 442.4 178.8 7.4 29.3 38.2 46.6 70.8 133.8 Libéria Libyan Arab Jamahiriya 4.4 7.0 3.6 11.3 7.4 26.4 194.2 376.5 877.0 768.9 500.2 Jamahiriya Arabe Libyenne Madagascar 21.0 59.8 49.6 58.5 55.2 29.2 5.4 5.6 19.3 50.9 77.2 35.5 Madagascar Malawi 37.7 48.5 59.0 62.9 78.1 65.3 3.3 4.4 6.1 7.8 14.4 5.1 Malawi 63 Mali 27.4 66.9 79.0 96.9 91.6 93.6 7.8 21.4 7.8 6.2 17.1 10.4 Mali Mauritania 84.8 71.9 79.7 133.0 122.8 110.1 15.4 312.7 40.5 53.1 130.0 -14.7 Mauritanie Mauritius 16.9 28.4 16.1 57.6 91.8 130.2 231.6 34.8 88.1 283.7 320.4 215.4 Maurice Morocco 14.5 24.0 36.2 37.2 36.9 31.6 14.6 57.4 85.0 97.3 86.3 46.2 Maroc Mozambique 49.7 71.1 88.0 97.4 109.4 110.3 7.6 5.9 8.4 23.4 32.4 48.3 Mozambique Namibia 83.5 68.6 83.2 119.2 115.2 178.8 102.2 190.8 211.9 401.9 394.9 283.1 Namibie Niger 18.9 47.1 47.7 49.1 55.0 42.6 0.8 2.7 4.6 11.7 51.3 67.0 Niger Nigeria 1.4 51.3 91.5 15.7 10.3 13.3 10.5 39.9 111.8 48.8 54.6 46.9 Nigéria Rwanda 40.4 72.5 74.0 90.8 117.3 117.4 1.0 1.8 3.8 10.3 13.0 14.9 Rwanda Sao Tome and Principe 249.0 231.5 163.6 256.8 337.8 219.2 27.1 111.8 267.7 251.9 231.9 255.5 Sao Tomé-et-Principe Senegal 43.4 70.5 84.7 88.1 107.5 102.8 6.4 5.3 21.3 27.5 27.5 21.0 Sénégal Seychelles 223.1 181.6 168.1 107.6 154.3 286.0 299.9 1,058.6 1,794.5 2,941.1 3,105.9 2,993.8 Seychelles Sierra Leone 42.7 80.3 82.2 129.0 86.8 103.4 9.2 19.7 13.9 22.8 12.5 7.9 Sierra Leone Somalia 13.7 32.0 52.9 52.0 102.5 89.5 0.0 3.2 13.0 19.1 11.8 14.6 Somalie South Africa 10.8 15.4 15.9 18.0 25.1 24.0 19.8 148.1 -11.7 126.9 200.7 126.9 Afrique du Sud Sudan 6.3 52.2 58.6 60.5 68.3 65.6 11.2 66.0 101.5 69.8 74.5 86.9 Soudan Swaziland 12.2 43.2 32.2 46.9 64.7 53.7 98.0 -42.5 112.1 34.7 97.9 60.8 Swaziland Tanzania, United Republic of 31.1 43.9 53.9 82.6 68.3 86.0 8.3 14.5 17.5 19.0 19.9 18.9 Tanzanie, République Unie de Togo 13.3 15.7 15.1 23.1 62.8 95.1 7.9 14.7 14.7 9.4 4.6 9.6 Togo Tunisia 23.4 38.3 45.6 34.0 35.1 50.1 82.5 82.8 350.0 171.0 291.8 178.5 Tunisie Uganda 34.9 48.8 63.6 71.1 67.2 73.1 7.4 15.5 26.4 30.0 32.2 32.7 Ouganda Zambia 75.9 112.0 138.4 96.3 106.6 121.2 11.6 34.1 58.8 126.5 89.7 91.7 Zambie Zimbabwe 14.1 29.9 22.3 38.4 49.2 59.2 1.9 8.3 3.2 5.5 4.1 4.8 Zimbabwe Africa 19 43 53 47 53 57 12.0 46.7 67.7 77.1 88.2 71.6 Afrique African Statistical Yearbook 2011 / Annuaire Statistique pour l'Afrique 2011
  • 65.
    EXTERNAL SECTOR 3-7. Intra-African Trade by Economic Grouping in 2009 - Commerce intra-africain par zone économique en 2009 AMU CAEMC ECCAS ECOWAS FRANC ZONE WAEMU AFRICA WORLD Economic Grouping COMESA SADC Zone économique UMA CEMAC CEEAC CEDEAO ZONE FRANC UEMOA AFRIQUE MONDE <===== Exportations Exports to =====> (Millions of US $) / (Millions de $ EU) vers AMU 3422 187 1854 227 761 735 92 546 5277 109422 UMA CAEMC 101 300 64 364 279 400 175 100 864 25630 CEMAC COMESA 2825 87 6091 1386 356 231 3681 129 10393 85890 COMESA ECCAS 118 313 745 440 292 415 2134 101 3020 64560 CEEAC ECOWAS 288 1196 138 1374 7312 5243 2377 4047 11219 73577 CEDEAO FRANC ZONE 346 663 180 849 4244 2690 359 2027 5649 40281 ZONE FRANC SADC 381 196 8068 2130 1552 564 15390 354 19253 111066 SADC WAEMU 245 363 116 486 3964 2290 185 1927 4785 14623 UEMOA AFRICA 6183 1952 14269 4930 10216 7100 19180 5123 43141 358585 AFRIQUE WORLD 103537 11982 115046 32397 82367 36622 108388 24479 386218 12360200 MONDE <===== Exportations Exports to =====> (% of Total Exports) / (% des exportations totales) vers AMU 3.1 0.2 1.7 0.2 0.7 0.7 0.1 0.5 4.8 100.0 UMA CAEMC 0.4 1.2 0.3 1.4 1.1 1.6 0.7 0.4 3.4 100.0 CEMAC COMESA 3.3 0.1 7.1 1.6 0.4 0.3 4.3 0.2 12.1 100.0 COMESA ECCAS 0.2 0.5 1.2 0.7 0.5 0.6 3.3 0.2 4.7 100.0 CEEAC ECOWAS 0.4 1.6 0.2 1.9 9.9 7.1 3.2 5.5 15.2 100.0 CEDEAO FRANC ZONE 0.9 1.6 0.4 2.1 10.5 6.7 0.9 5.0 14.0 100.0 ZONE FRANC SADC 0.3 0.2 7.3 1.9 1.4 0.5 13.9 0.3 17.3 100.0 SADC WAEMU 1.7 2.5 0.8 3.3 27.1 15.7 1.3 13.2 32.7 100.0 UEMOA AFRICA 1.7 0.5 4.0 1.4 2.8 2.0 5.3 1.4 12.0 100.0 AFRIQUE WORLD 0.8 0.1 0.9 0.3 0.7 0.3 0.9 0.2 3.1 100.0 MONDE AMU CAEMC ECCAS ECOWAS FRANC ZONE WAEMU AFRICA WORLD Economic Grouping COMESA SADC Zone économique UMA CEMAC CEEAC CEDEAO ZONE FRANC UEMOA AFRIQUE MONDE =====> Importations Imports <===== from (Millions of US $) / (Millions de $ EU) de AMU 3765 111 3207 130 308 373 392 261 6868 115616 UMA CAEMC 206 331 91 345 879 730 228 399 1719 12977 CEMAC 64 COMESA 1897 73 6679 816 152 201 9136 127 15786 119652 COMESA ECCAS 251 402 1517 485 1072 935 2354 532 4992 35478 CEEAC ECOWAS 836 252 391 267 7950 4515 1759 4263 11139 97775 CEDEAO FRANC ZONE 807 441 249 457 5232 2862 658 2421 7305 38439 ZONE FRANC SADC 83 164 3750 2312 2602 353 13029 190 17107 124135 SADC WAEMU 600 110 141 112 4353 2132 414 2022 5561 25280 UEMOA AFRICA 5642 867 11268 3226 11789 6011 17542 5143 43043 430618 AFRIQUE WORLD 119139 27133 92863 69904 77282 41436 129541 14272 395637 12743400 MONDE =====> Importations Imports <===== from (% of Total Imports) / (% des importations totales) de AMU 3.3 0.1 2.8 0.1 0.3 0.3 0.3 0.2 5.9 100.0 UMA CAEMC 1.6 2.5 0.7 2.7 6.8 5.6 1.8 3.1 13.2 100.0 CEMAC COMESA 1.6 0.1 5.6 0.7 0.1 0.2 7.6 0.1 13.2 100.0 COMESA ECCAS 0.7 1.1 4.3 1.4 3.0 2.6 6.6 1.5 14.1 100.0 CEEAC ECOWAS 0.9 0.3 0.4 0.3 8.1 4.6 1.8 4.4 11.4 100.0 CEDEAO FRANC ZONE 2.1 1.1 0.6 1.2 13.6 7.4 1.7 6.3 19.0 100.0 ZONE FRANC SADC 0.1 0.1 3.0 1.9 2.1 0.3 10.5 0.2 13.8 100.0 SADC WAEMU 2.4 0.4 0.6 0.4 17.2 8.4 1.6 8.0 22.0 100.0 UEMOA AFRICA 1.3 0.2 2.6 0.7 2.7 1.4 4.1 1.2 10.0 100.0 AFRIQUE WORLD 0.9 0.2 0.7 0.5 0.6 0.3 1.0 0.1 3.1 100.0 MONDE African Statistical Yearbook 2011 / Annuaire Statistique pour l'Afrique 2011
  • 66.
    65 African Statistical Yearbook2011 / Annuaire Statistique pour l'Afrique 2011
  • 67.
    4 66 Section Economic Infrastructure and Investment Climate Infrastructures économiques et climat des affaires African Statistical Yearbook 2011 / Annuaire Statistique pour l'Afrique 2011
  • 68.
    ECONOMIC INFRASTRUCTURE /INFRASTRUCTURE ECONOMIQUE 4-1. Tourism and Infrastructure / Tourisme et Infrastructure Arrival of tourists Paved (% of Main Telephone Lines per Mobile Cellular Subscribers (Thousands) / total) Routes 1,000 inhabitants/ Lignes per 1,000 inhabitants/ Arrivée des asphaltées (% téléphoniques fixes pour Abonnés aux téléphones touristes (Milliers) du total) 1000 habitants mobiles pour 1000 habitants Year/ Country 2003 2009 % 2003 2009 2003 2009 Pays A é Algeria 1 166 1 912 2008 73.5 65.2 73.8 45.4 937.9 Algérie Angola 107 366 2001 10.4 5.4 16.4 22.4 438.4 Angola Benin 175 190 2004 9.5 9.0 14.2 32.1 563.3 Bénin Botswana 1 406 1 553 2005 32.6 73.3 70.5 248.1 961.2 Botswana Burkina Faso 163 269 2004 4.2 5.2 9.7 18.5 242.7 Burkina Faso Burundi 74 ... 2008 31.7 3.4 3.8 9.2 101.0 Burundi Cameroon ... ... 2004 8.4 5.7 22.3 63.3 410.0 Cameroun Cape Verde 150 287 2000 69.0 155.1 142.2 115.3 574.8 Cap-Vert Central African Republic 6 52 2009 3.4 2.4 2.7 10.1 135.7 République Centrafricaine Chad 21 ... 2006 0.8 1.3 5.2 6.9 203.6 Tchad Comoros 21 ... 2009 0.8 22.5 31.8 3.4 184.9 Comores Congo 35 53 2009 6.0 2.1 6.6 101.2 589.4 Congo Congo, Dem. Republic 23 85 2006 7.1 0.2 0.6 22.4 143.3 Rép. Démocratique du Congo Côte d'Ivoire ... ... 2009 7.9 12.9 13.4 69.4 625.6 Côte d'Ivoire Djibouti 23 ... 2009 16.0 13.1 19.5 29.6 149.0 Djibouti Egypt 5 746 11 914 2008 86.9 117.6 124.2 78.0 666.9 Egypte Equatorial Guinea ... ... 2000 ... 16.7 14.8 72.0 295.7 Guinée Equatoriale Eritrea 80 79 2000 21.8 9.2 9.6 0.0 27.8 Erythrée Ethiopia 180 ... 2007 13.7 5.7 11.0 0.7 48.9 Ethiopie Gabon 222 ... 2004 10.2 29.2 18.0 228.0 931.1 Gabon Gambia 89 142 2007 20.7 29.2 28.7 103.9 840.4 Gambie Ghana 531 803 2005 14.9 13.9 11.2 38.0 633.8 Ghana Guinea 44 ... 2003 9.8 2.9 2.2 12.6 346.5 Guinée Guinea-Bissau ... ... 2009 37.8 7.5 3.0 0.9 347.9 Guinée-Bissau Kenya 927 1 392 2009 14.0 9.7 16.7 46.8 486.5 Kenya Lesotho ... 320 2009 19.8 17.9 19.4 64.3 319.8 Lesotho Liberia ... ... 2000 6.2 … 0.5 15.1 212.9 Libéria Libyan Arab Jamahiriya ... ... 2009 44.0 131.9 171.5 22.3 779.4 Jamahiriya Arabe Libyenne Madagascar 139 163 2004 20.3 3.6 9.5 17.0 320.2 Madagascar 67 Malawi 424 755 2009 26.0 6.6 11.5 10.5 157.2 Malawi Mali 110 160 2009 31.7 5.4 6.5 21.9 341.7 Mali Mauritania ... ... 2007 58.5 13.5 22.6 124.0 663.2 Mauritanie Mauritius 702 871 2009 100.0 282.9 296.3 375.7 843.6 Maurice Morocco 4 761 8 341 2009 61.6 40.9 109.9 246.8 791.1 Maroc Mozambique 441 2 224 2008 20.8 3.9 3.2 22.0 260.8 Mozambique Namibia 695 ... 2002 12.8 65.8 65.4 115.6 560.5 Namibie Niger 55 ... 2007 20.7 1.9 4.3 6.7 170.0 Niger Nigeria 924 ... 2005 30.8 6.6 9.2 23.5 481.6 Nigéria Rwanda ... 699 2004 19.0 2.9 3.3 15.1 243.0 Rwanda Sao Tome and Principe 10 15 2000 68.1 47.2 47.9 32.6 393.2 Sao Tomé-et-Principe Senegal 495 ... 2006 29.3 21.4 22.2 73.1 550.6 Sénégal Seychelles 122 158 2007 96.5 257.7 309.5 598.6 1313.6 Seychelles Sierra Leone 38 ... 2002 8.0 5.3 5.8 23.9 203.6 Sierra Leone Somalia ... ... 2000 11.8 12.5 10.9 25.1 70.2 Somalie South Africa 6 505 9 934 2001 17.3 102.9 86.2 359.9 926.7 Afrique du Sud Sudan 52 420 2009 32.0 25.2 8.8 14.2 362.9 Soudan Swaziland 461 908 2009 37.6 41.7 37.1 76.7 553.6 Swaziland Tanzania 552 714 2008 7.4 4.0 4.0 52.6 399.4 Tanzanie Togo 61 150 2007 21.0 10.7 27.0 42.8 330.5 Togo Tunisia 5 114 6 901 2008 75.2 119.9 124.5 197.6 953.8 Tunisie Uganda 305 817 2003 23.0 2.3 7.1 28.9 286.9 Ouganda Zambia 413 710 2009 11.2 7.9 7.0 21.5 340.7 Zambie Zimbabwe 2 256 ... 2002 19.0 24.1 30.8 29.1 238.8 Zimbabwe Africa ... ... ... ... 28.0 31.2 60.4 438.6 Afrique African Statistical Yearbook 2011 / Annuaire Statistique pour l'Afrique 2011
  • 69.
    DOING BUSINESS IN2010 / CLIMAT DES AFFAIRES EN 2010 5-1. Doing Business in 2010 (Rank over 183countries )/ Climat des affaires en 2010 (Rang sur 183 pays) Ease of Doing Dealing with Enforcing Registering Getting Protecting Paying Trading Across Closing a Business Licenses Contracts Property Credit Investors Taxes Borders Business Facilité de Exécution Protection Paiement Fermeture Enregistrement Obtention Commerce faire des Agréments des des des d'une de biens de crédits transfrontalier affaires contrats investisseurs impôts entreprise Country Pays Algeria 136 113 127 165 138 74 168 124 51 Algérie Angola 163 128 181 174 116 59 142 166 147 Angola Benin 170 125 177 129 152 154 167 127 118 Bénin Botswana 52 127 70 44 46 44 21 151 27 Botswana Burkina Faso 151 77 108 118 152 147 148 175 100 Burkina Faso Burundi 181 175 171 115 168 154 141 176 183 Burundi Cameroon 168 118 173 149 138 120 169 155 141 Cameroun Cape Verde 132 89 38 104 152 132 100 55 183 Cap-Vert Central African Republic 182 148 173 141 138 132 182 182 183 République Centrafricaine Chad 183 101 164 137 152 154 179 171 183 Tchad Comoros 159 68 152 99 168 132 96 135 183 Comores Congo 177 83 158 133 138 154 180 180 128 Congo Congo, Dem. Republic 175 81 172 118 168 154 163 172 155 Rép. Démocratique du Congo Côte d'Ivoire 169 165 126 151 152 154 153 160 76 Côte d'Ivoire Djibouti 158 125 160 140 176 179 60 38 137 Djibouti Egypt 94 154 143 93 72 74 136 21 131 Egypte Equatorial Guinea 164 109 72 79 138 147 170 137 183 Guinée Equatoriale Eritrea 180 183 48 178 176 109 113 165 183 Erythrée Ethiopia 104 53 57 109 128 120 47 157 82 Ethiopie Gabon 156 67 148 132 138 154 140 134 139 Gabon Gambia 146 80 67 121 138 173 176 87 121 Gambie Ghana 67 151 45 36 46 44 78 89 109 Ghana Guinea 179 171 130 166 168 173 173 129 123 Guinée Guinea-Bissau 176 103 139 175 152 132 133 117 183 Guinée-Bissau Kenya 98 35 125 129 6 93 162 144 85 Kenya Lesotho 138 163 116 146 128 147 64 140 69 Lesotho Liberia 155 135 166 176 138 147 84 116 148 Libéria Libyan Arab Jamahiriya Jamahiriya Arabe Libyenne Madagascar 140 110 153 162 176 59 72 106 183 Madagascar 68 Malawi 133 174 121 81 116 74 25 173 126 Malawi Mali 153 87 133 88 152 147 159 154 106 Mali Mauritania 165 153 83 73 152 147 172 163 144 Mauritanie Mauritius 20 39 61 69 89 12 12 22 71 Maurice Morocco 114 98 106 124 89 154 124 80 59 Maroc Mozambique 126 155 132 144 128 44 101 133 129 Mozambique Namibia 69 36 41 136 15 74 99 153 53 Namibie Niger 173 162 138 84 152 154 144 174 136 Niger Nigeria 137 167 97 179 89 59 134 146 99 Nigéria Rwanda 58 82 39 41 32 28 43 159 183 Rwanda Sao Tome and Principe 178 113 179 161 176 154 135 92 183 Sao Tomé-et-Principe Senegal 152 117 148 167 152 167 170 67 79 Sénégal Seychelles 95 61 69 62 152 59 38 36 183 Seychelles Sierra Leone 143 166 144 169 128 28 159 136 149 Sierra Leone Somalia Somalie South Africa 34 52 85 91 2 10 24 149 74 Afrique du Sud Sudan 154 139 146 40 138 154 94 143 183 Soudan Swaziland 118 40 170 156 46 120 52 147 63 Swaziland Tanzania 128 179 32 151 89 93 120 109 113 Tanzanie Togo 160 152 151 158 152 147 157 93 84 Togo Tunisia 55 106 78 64 89 74 58 30 37 Tunisie Uganda 122 133 113 150 46 132 62 148 56 Ouganda Zambia 76 158 86 83 6 74 37 150 97 Zambie Zimbabwe 157 172 110 82 128 120 131 168 156 Zimbabwe African Statistical Yearbook 2011 / Annuaire Statistique pour l'Afrique 2011
  • 70.
    69 African Statistical Yearbook2011 / Annuaire Statistique pour l'Afrique 2011
  • 71.
    5 70 Section Millennium Development Goals Objectifs du millénaire pour le développement African Statistical Yearbook 2011 / Annuaire Statistique pour l'Afrique 2011
  • 72.
    MILLENIUM DEVELOPMENT GOALS- OBJECTIFS DU MILLENAIRE POUR LE DEVELOPPEMENT Goal 1. Eradicate Extreme Poverty and Hunger/ Eradiquer la pauvreté extrême et la faim Share of Income or Prevalence of People Living below $ 1 a Poverty Gap at $1 a day Consumption Held by GINI Index undernourishment in day Poorest 20% total population Prévalence de la Population vivant en Ecart de pauvreté au % du revenu/consom. Indice de GINI malnutrition dans la dessous d'1$ par jour seuil de 1$ par jour des 20% les + pauvres population totale (%) Pays Country year % year % year % year % 2000-02 2005-2007 Algeria 2000 0.9 2000 1.4 2000 6.9 2007 35.3 5.0 ... Algérie Angola 2000 54.3 2000 29.9 2000 2.0 2007 … 52.0 41.0 Angola Benin 2003 47.3 2003 15.7 2003 6.9 2007 36.5 15.0 12.0 Bénin Botswana 1994 31.2 1994 11.0 1994 3.1 2007 60.5 27.0 25.0 Botswana Burkina Faso 2003 56.5 2003 20.3 2003 7.0 2007 39.5 12.0 9.0 Burkina Faso Burundi 2006 81.3 2006 36.4 2006 9.0 2007 42.4 59.0 62.0 Burundi Cameroon 2001 32.8 2001 10.2 2001 5.6 2007 44.6 26.0 21.0 Cameroun Cape Verde 2001 20.6 2001 5.9 2001 4.4 2007 … 15.0 10.0 Cap-Vert Cent. Afr. Rep. 2003 62.4 2003 28.3 2003 5.2 2007 61.3 43.0 40.0 République Centrafricaine Chad 2003 61.9 2003 25.6 2003 6.3 2007 … 43.0 37.0 Tchad Comoros 2004 46.1 2004 20.8 2004 2.6 2007 … 54.0 46.0 Comores Congo 2005 54.1 2005 22.8 2005 5.0 2007 … 20.0 15.0 Congo Congo, Dem. Republic 2006 59.2 2006 25.3 2006 5.5 2007 … 70.0 69.0 Rép. Démocratique du Congo Côte d'Ivoire 2002 23.3 2002 6.8 2002 5.0 2007 44.6 17.0 14.0 Côte d'Ivoire Djibouti 2002 18.8 2002 5.3 2002 6.0 2007 0.0 40.0 28.0 Djibouti Egypt 2000 2.0 2005 0.5 2005 9.0 2007 34.4 ... ... Egypte Equat. Guinea … … … … ... ... 2007 … ... ... Guinée Equatoriale Eritrea … … … … ... ... 2007 … 70.0 64.0 Erythrée Ethiopia 2005 39.0 2005 9.6 2005 9.3 2007 30.0 48.0 41.0 Ethiopie Gabon 2005 4.8 2005 0.9 2005 6.1 2007 … ... ... Gabon Gambia 2003 34.3 2003 12.1 2003 4.8 2007 50.2 21.0 19.0 Gambie Ghana 2006 30.0 2006 10.5 2006 5.2 2007 40.8 9.0 5.0 Ghana Guinea 2003 70.1 2003 32.2 2003 5.8 2007 38.6 20.0 17.0 Guinée Guinea Bissau 2002 48.8 2002 16.5 2002 7.2 2007 47.0 25.0 22.0 Guinée-Bissau Kenya 2005 19.7 2005 6.1 2005 4.7 2007 42.5 32.0 31.0 Kenya Lesotho 2003 43.4 2003 20.8 2003 3.0 2007 63.2 14.0 14.0 Lesotho Liberia 2007 83.7 2007 40.8 2007 6.4 2007 … 36.0 33.0 Libéria Libya … … … … ... ... 2007 … ... ... Jamahiriya Arabe Libyenne 71 Madagascar 2005 67.8 2005 26.5 2005 6.2 2007 47.5 28.0 25.0 Madagascar Malawi 2004 73.9 2004 32.3 2004 7.0 2007 39.0 30.0 28.0 Malawi Mali 2006 51.4 2006 18.8 2006 6.5 2007 40.1 18.0 12.0 Mali Mauritania 2000 21.2 2000 5.7 2000 6.2 2007 39.0 8.0 7.0 Mauritanie Mauritius … … … … ... ... 2007 … 5.0 5.0 Maurice Morocco 2007 2.5 2007 0.5 2007 6.5 2007 39.5 6.0 ... Maroc Mozambique 2003 74.7 2003 35.4 2003 5.4 2007 47.3 46.0 38.0 Mozambique Namibia 1993 49.1 2004 24.6 2004 1.5 2007 74.3 21.0 19.0 Namibie Niger 2005 65.9 2005 28.1 2005 5.9 2007 50.5 27.0 20.0 Niger Nigeria 2004 64.4 2004 29.6 2004 5.1 2007 43.7 9.0 6.0 Nigéria Rwanda 2000 76.6 2006 38.2 2006 5.4 2007 46.8 38.0 34.0 Rwanda São T. & Principe 1987 36.0 … … ... ... 2007 … 8.0 ... Sao Tomé-et-Principe Senegal 2005 33.5 2005 10.8 2005 6.2 2007 41.3 26.0 17.0 Sénégal Seychelles … … … … ... ... 2007 … 8.0 7.0 Seychelles Sierra Leone 2003 53.4 2003 20.3 2003 6.1 2007 62.9 43.0 35.0 Sierra Leone Somalia … … … … ... ... 2007 … ... ... Somalie South Africa 2000 26.2 2000 8.2 2000 3.1 2007 57.8 ... ... Afrique du Sud Sudan … … … … ... ... 2007 … 28.0 22.0 Soudan Swaziland 2001 62.9 2001 29.4 2001 4.5 2007 50.4 18.0 18.0 Swaziland Tanzania 2000 88.5 2000 46.8 2000 7.3 2007 34.6 39.0 34.0 Tanzanie Togo 2006 38.7 2006 11.4 2006 7.6 2007 … 36.0 30.0 Togo Tunisia 2000 2.6 2000 0.5 2000 5.9 2007 39.8 ... ... Tunisie Uganda 2005 51.5 2005 19.1 2005 6.1 2007 45.7 19.0 21.0 Ouganda Zambia 2004 64.3 2004 32.8 2004 3.6 2007 50.8 43.0 43.0 Zambie Zimbabwe 2004 61.9 2004 24.2 1995 4.6 2007 50.1 41.0 30.0 Zimbabwe Africa ... ... ... ... ... ... ... ... 28.9 27.2 Afrique African Statistical Yearbook 2011 / Annuaire Statistique pour l'Afrique 2011
  • 73.
    MILLENIUM DEVELOPMENT GOALS- OBJECTIFS DU MILLENAIRE POUR LE DEVELOPPEMENT Goal 2. Achieve universal primary education/ Assurer l'éducation primaire pour tous Net Primary Enrolment Ratios % of Cohort Reaching Grade 5 Youth Literacy Rates (% 15-24) % de la cohorte atteignant la 5ème Taux net de scolarisation au primaire Taux d'alphabétisation des jeunes année d'études (percentage/pourcentage) (% of ages 15-24/% des 15-24 ans) Target/Cible Target/Cible Target/Cible Pays Country 1990 2006-10 2015 1990 2007-09 2015 1990 2006-08 2015 Algeria 87.5 93.8 100.0 79.5 94.5 100.0 77.6 91.8 100.0 Algérie Angola ... … ... 34.7 ... 100.0 ... 72.9 100.0 Angola Benin 41.2 94.7 100.0 20.7 ... 100.0 44.2 53.3 100.0 Bénin Botswana 86.9 86.9 100.0 89.5 ... 100.0 83.3 95.1 100.0 Botswana Burkina Faso ... 63.3 100.0 19.5 75.1 100.0 24.9 39.3 100.0 Burkina Faso Burundi ... 98.9 100.0 45.9 72.6 100.0 51.8 75.9 100.0 Burundi Cameroon 71.1 91.6 100.0 53.0 77.7 100.0 87.4 85.8 100.0 Cameroun Cape Verde 92.7 82.6 100.0 ... 89.7 100.0 82.2 98.0 100.0 Cap-Vert Cent. Afr. Rep. 57.9 66.7 100.0 26.7 53.6 100.0 52.0 64.2 100.0 République Centrafricaine Chad ... … 100.0 17.9 ... 100.0 48.0 45.4 100.0 Tchad Comoros ... 87.3 100.0 ... ... 100.0 61.9 84.9 100.0 Comores Congo ... 58.9 100.0 54.3 76.9 100.0 92.5 ... 100.0 Congo Congo, Dem. Republic ... … 100.0 45.9 77.6 100.0 68.9 65.3 100.0 Rép. Démocratique du Congo Côte d'Ivoire ... 57.2 100.0 43.4 66.1 100.0 50.2 66.1 100.0 Côte d'Ivoire Djibouti 29.3 44.4 100.0 26.9 64.3 100.0 73.2 ... 100.0 Djibouti Egypt ... 93.6 100.0 ... ... 100.0 61.4 84.9 100.0 Egypte Equat. Guinea ... 53.5 100.0 ... 60.9 100.0 92.7 97.8 100.0 Guinée Equatoriale Eritrea ... 35.7 100.0 ... 73.1 100.0 60.9 87.8 100.0 Erythrée Ethiopia ... 82.7 100.0 ... 45.9 100.0 42.2 49.9 100.0 Ethiopie Gabon ... … 100.0 ... ... ... ... 97.4 ... Gabon Gambia 51.4 67.2 100.0 ... 71.5 ... 42.2 64.1 100.0 Gambie Ghana ... 75.9 100.0 61.2 79.0 100.0 81.6 79.3 100.0 Ghana Guinea 24.9 72.9 100.0 17.4 68.6 100.0 ... 58.7 100.0 Guinée Guinea Bissau ... … ... ... ... ... 45.4 69.6 100.0 Guinée-Bissau Kenya ... 82.6 100.0 ... ... 100.0 89.8 92.3 100.0 Kenya Lesotho 70.7 73.1 100.0 58.9 ... 100.0 87.0 91.9 100.0 Lesotho Liberia ... … 100.0 ... 59.8 ... 57.7 74.8 100.0 Libéria 72 Libya ... … ... ... ... ... 91.1 99.8 100.0 Jamahiriya Arabe Libyenne Madagascar 70.3 98.5 100.0 33.3 49.4 100.0 72.2 70.2 100.0 Madagascar Malawi ... 90.8 100.0 28.7 50.7 100.0 63.2 85.7 100.0 Malawi Mali ... 72.9 100.0 12.6 86.9 100.0 45.3 38.8 100.0 Mali Mauritania ... 76.3 100.0 34.1 49.4 100.0 45.8 67.0 100.0 Mauritanie Mauritius 97.2 94.0 100.0 106.6 97.2 100.0 91.2 96.4 100.0 Maurice Morocco 56.2 89.7 100.0 48.1 84.2 100.0 55.3 76.6 100.0 Maroc Mozambique 44.0 92.3 100.0 26.4 53.7 100.0 48.8 69.9 100.0 Mozambique Namibia 79.1 89.1 100.0 ... 91.5 100.0 87.4 92.9 100.0 Namibie Niger 22.8 57.4 100.0 17.6 64.3 100.0 17.0 ... 100.0 Niger Nigeria ... 61.4 100.0 ... ... 100.0 73.5 71.5 100.0 Nigéria Rwanda ... 95.9 100.0 35.4 48.5 100.0 72.6 77.1 100.0 Rwanda São T. & Principe 96.0 98.4 100.0 ... 79.2 100.0 ... 95.2 100.0 Sao Tomé-et-Principe Senegal 45.1 73.1 100.0 ... 69.8 100.0 40.1 50.9 100.0 Sénégal Seychelles ... 94.4 100.0 ... 94.9 100.0 ... 99.1 100.0 Seychelles Sierra Leone ... … ... ... ... ... ... 55.7 100.0 Sierra Leone Somalia ... … ... ... ... ... ... ... ... Somalie South Africa ... 84.7 100.0 75.8 ... 100.0 88.5 96.8 100.0 Afrique du Sud Sudan ... … ... 42.0 86.0 100.0 65.1 85.2 100.0 Soudan Swaziland 74.3 82.8 100.0 59.9 ... 100.0 85.1 93.2 100.0 Swaziland Tanzania 51.4 96.4 100.0 62.4 80.9 100.0 62.8 77.5 100.0 Tanzanie Togo 62.3 93.5 100.0 34.9 75.7 100.0 84.1 83.5 100.0 Togo Tunisia 92.6 97.9 100.0 74.2 96.1 100.0 70.2 96.8 100.0 Tunisie Uganda ... 92.2 100.0 ... 57.7 100.0 83.7 87.3 100.0 Ouganda Zambia ... 90.7 100.0 ... 71.0 100.0 81.0 74.8 100.0 Zambie Zimbabwe ... … 100.0 97.2 ... 100.0 94.0 98.9 100.0 Zimbabwe Africa 60.6 83.5 100.0 49.7 67.9 100.0 66.5 74.9 100.0 Afrique African Statistical Yearbook 2011 / Annuaire Statistique pour l'Afrique 2011
  • 74.
    MILLENIUM DEVELOPMENT GOALS- OBJECTIFS DU MILLENAIRE POUR LE DEVELOPPEMENT Goal 3. Promote gender equality and empower women/Promouvoir l'égalité des sexes et l'autonomisation des femmes Primary /Primaire Secondary /Secondary 15-24 Year Olds Literacy Female to Girls to Boys Ratio Girls to Boys Ratio Male Ratio/ Ratio d'alphabétisation Rapport Filles-garcons (%) Rapport Filles-garcons des jeunes de 15-24 ans : fille/garçon Target/Cible Target/Cible Target/Cible Pays Country 1990 2004-10 2015 1990 2004-10 2015 1990 2000-07 2015 Algeria 84.5 89.7 100.0 80.2 103.0 100.0 0.8 96.2 100.0 Algérie Angola 92.1 82.0 100.0 65.8 … 100.0 ... 75.4 ... Angola Benin 50.0 85.3 100.0 41.2 54.9 100.0 0.4 64.9 100.0 Bénin Botswana 107.1 95.9 100.0 111.7 104.2 100.0 1.1 102.6 100.0 Botswana Burkina Faso 63.1 87.9 100.0 53.2 73.9 100.0 0.4 70.9 100.0 Burkina Faso Burundi 83.4 96.7 100.0 57.1 72.4 100.0 0.8 91.6 100.0 Burundi Cameroon 85.8 85.4 100.0 70.1 82.5 100.0 0.9 ... 100.0 Cameroun Cape Verde 95.9 91.9 100.0 94.9 118.0 100.0 0.9 101.4 100.0 Cap-Vert Cent. Afr. Rep. 63.8 71.8 100.0 41.4 56.6 100.0 0.6 66.6 100.0 République Centrafricaine Chad 44.6 70.0 100.0 23.3 40.9 100.0 0.6 66.4 100.0 Tchad Comoros 72.6 89.1 100.0 67.6 73.9 100.0 0.8 94.2 100.0 Comores Congo 88.2 92.2 100.0 69.5 85.3 100.0 1.0 ... 100.0 Congo Congo, Dem. Republic 61.9 85.0 100.0 48.0 55.7 100.0 0.7 80.9 100.0 Rép. Démocratique du Congo Côte d'Ivoire 70.8 80.8 100.0 47.3 … 100.0 0.7 73.6 100.0 Côte d'Ivoire Djibouti 70.9 87.7 100.0 65.3 72.4 100.0 0.8 ... 100.0 Djibouti Egypt 84.6 90.8 100.0 81.0 90.1 100.0 0.7 93.1 100.0 Egypte Equat. Guinea ... 95.3 100.0 ... 57.3 100.0 0.9 100.2 100.0 Guinée Equatoriale Eritrea 95.7 81.8 100.0 93.3 70.8 100.0 0.7 80.6 100.0 Erythrée Ethiopia 67.2 90.6 100.0 76.9 76.9 100.0 0.8 61.9 100.0 Ethiopie Gabon ... 97.8 100.0 ... … ... ... 97.9 ... Gabon Gambia 67.6 101.1 100.0 43.3 96.2 100.0 0.7 ... 100.0 Gambie Ghana 83.4 94.4 100.0 64.3 84.6 100.0 0.9 95.1 100.0 Ghana Guinea 47.3 82.7 100.0 33.6 56.9 100.0 ... 57.4 ... Guinée Guinea Bissau 58.1 … 100.0 45.3 … 100.0 0.3 ... 100.0 Guinée-Bissau Kenya 96.3 96.7 100.0 73.3 89.6 100.0 0.9 101.1 100.0 Kenya Lesotho 123.0 98.4 100.0 147.8 138.0 100.0 1.3 ... 100.0 Lesotho Liberia 68.6 88.4 100.0 39.8 71.4 100.0 0.5 111.6 100.0 Libéria Libya 94.4 91.0 100.0 103.0 112.3 100.0 0.8 98.3 100.0 Jamahiriya Arabe Libyenne 73 Madagascar 100.1 97.5 100.0 97.0 94.2 100.0 0.9 93.9 100.0 Madagascar Malawi 83.7 101.0 100.0 28.8 86.5 100.0 0.7 98.3 100.0 Malawi Mali 57.1 82.3 100.0 47.7 64.0 100.0 0.7 65.0 100.0 Mali Mauritania 73.9 101.7 100.0 48.1 83.8 100.0 0.6 89.3 100.0 Mauritanie Mauritius 100.4 96.7 100.0 100.4 99.3 100.0 1.0 102.0 100.0 Maurice Morocco 68.7 88.8 100.0 73.9 83.5 100.0 0.6 79.3 100.0 Maroc Mozambique 74.9 89.6 100.0 61.9 81.8 100.0 0.5 81.2 100.0 Mozambique Namibia 109.9 97.5 100.0 127.3 116.4 100.0 1.0 103.8 100.0 Namibie Niger 56.4 77.9 100.0 42.6 66.2 100.0 0.4 44.2 100.0 Niger Nigeria 76.0 85.2 100.0 72.8 75.4 100.0 0.8 95.7 100.0 Nigéria Rwanda 97.9 103.2 100.0 77.8 96.4 100.0 0.9 ... 100.0 Rwanda São T. & Principe ... 97.5 100.0 ... 100.6 100.0 ... 100.5 ... Sao Tomé-et-Principe Senegal 73.5 102.5 100.0 51.9 78.2 100.0 0.6 76.6 100.0 Sénégal Seychelles ... 97.9 100.0 ... 100.3 100.0 ... 100.6 ... Seychelles Sierra Leone 69.0 90.6 100.0 56.8 69.4 100.0 ... 68.1 ... Sierra Leone Somalia 52.0 54.9 100.0 53.3 45.9 100.0 ... ... ... Somalie South Africa 98.0 95.1 100.0 115.5 104.2 100.0 1.0 101.8 100.0 Afrique du Sud Sudan 75.0 86.8 100.0 79.7 85.1 100.0 0.7 84.4 100.0 Soudan Swaziland 95.5 92.0 100.0 99.3 89.0 100.0 1.0 103.2 100.0 Swaziland Tanzania 98.3 98.7 100.0 70.7 78.0 100.0 0.9 96.5 100.0 Tanzanie Togo 65.2 93.8 100.0 34.3 52.9 100.0 0.6 76.0 100.0 Togo Tunisia 88.9 91.6 100.0 80.3 102.4 100.0 0.8 97.2 100.0 Tunisie Uganda 79.7 99.9 100.0 53.9 82.7 100.0 0.8 95.4 100.0 Ouganda Zambia 92.9 98.1 100.0 60.7 … 100.0 0.9 82.3 100.0 Zambie Zimbabwe 98.5 … 100.0 87.3 … 100.0 0.9 93.9 100.0 Zimbabwe Africa 81.3 89.4 100.0 77.2 84.6 100.0 0.8 0.9 100.0 Afrique African Statistical Yearbook 2011 / Annuaire Statistique pour l'Afrique 2011
  • 75.
    MILLENIUM DEVELOPMENT GOALS- OBJECTIFS DU MILLENAIRE POUR LE DEVELOPPEMENT Goal 4. Reduce child mortality/Réduire la mortalité infantile Infant Mortality / Mortalité infantile Under 5 Mortality / Mortalité des < 5 ans Current Status/statut actuel Current Status/statut actuel (per/pour 1000) (per/pour 1000) Target/Cible Target/Cible Country 1990 2010 2015 1990 2010 2015 Pays Algeria 58.8 28.2 19.6 67.5 30.1 22.5 Algérie Angola 147.6 110.9 49.2 257.2 192.5 85.7 Angola Benin 116.3 80.8 38.8 183.8 113.0 61.3 Bénin Botswana 51.4 32.2 17.1 70.5 44.3 23.5 Botswana Burkina Faso 106.9 77.8 35.6 207.3 150.4 69.1 Burkina Faso Burundi 122.5 94.6 40.8 208.8 159.0 69.6 Burundi Cameroon 84.1 83.7 28.0 139.6 138.3 46.5 Cameroun Cape Verde 45.8 23.4 15.3 58.7 27.6 19.6 Cap-Vert Cent. Afr. Rep. 109.5 101.4 36.5 185.8 172.2 61.9 République Centrafricaine Chad 126.3 127.0 42.1 205.0 205.2 68.3 Tchad Comoros 87.9 44.1 29.3 124.7 56.0 41.6 Comores Congo 64.5 79.1 21.5 102.7 128.2 34.2 Congo Congo, Dem. Republic 114.4 113.9 38.1 199.3 193.7 66.4 Rép. Démocratique du Congo Côte d'Ivoire 101.3 83.3 33.8 151.2 116.9 50.4 Côte d'Ivoire Djibouti 115.8 80.1 38.6 174.6 117.4 58.2 Djibouti Egypt 70.8 32.5 23.6 89.6 37.7 29.9 Egypte Equat. Guinea 122.3 95.4 40.8 213.3 161.0 71.1 Guinée Equatoriale Eritrea 97.7 51.0 32.6 147.2 69.6 49.1 Erythrée Ethiopia 120.7 74.9 40.2 211.2 123.1 70.4 Ethiopie Gabon 59.4 47.2 19.8 96.0 73.3 32.0 Gabon Gambia 111.6 74.0 37.2 166.5 111.6 55.5 Gambie Ghana 74.4 70.9 24.8 121.5 113.7 40.5 Ghana Guinea 138.1 93.0 46.0 231.5 136.4 77.2 Guinée Guinea Bissau 136.4 109.4 45.5 240.0 187.8 80.0 Guinée-Bissau Kenya 65.8 60.4 21.9 104.8 96.9 34.9 Kenya Lesotho 73.9 65.0 24.6 108.5 96.2 36.2 Lesotho Liberia 138.4 91.3 46.1 229.7 132.1 76.6 Libéria Libya 34.0 16.9 11.3 39.5 18.3 13.2 Jamahiriya Arabe Libyenne 74 Madagascar 103.5 61.0 34.5 169.1 92.8 56.4 Madagascar Malawi 135.6 78.4 45.2 224.4 110.8 74.8 Malawi Mali 132.1 102.9 44.0 251.0 181.7 83.7 Mali Mauritania 74.4 71.0 24.8 129.8 116.5 43.3 Mauritanie Mauritius 21.5 14.0 7.2 28.9 17.0 9.6 Maurice Morocco 64.6 27.7 21.5 88.6 32.5 29.5 Maroc Mozambique 140.4 83.3 46.8 242.2 140.2 80.7 Mozambique Namibia 61.1 30.4 20.4 86.1 43.1 28.7 Namibie Niger 154.1 83.7 51.4 291.0 161.5 97.0 Niger Nigeria 133.4 106.6 44.5 230.5 181.4 76.8 Nigéria Rwanda 124.8 95.9 41.6 205.7 148.2 68.6 Rwanda São T. & Principe 81.7 70.1 27.2 110.5 91.1 36.8 Sao Tomé-et-Principe Senegal 75.5 57.0 25.2 156.5 115.5 52.2 Sénégal Seychelles … … … … … … Seychelles Sierra Leone 154.5 101.5 51.5 259.8 142.6 86.6 Sierra Leone Somalia 134.9 105.9 45.0 225.3 173.4 75.1 Somalie South Africa 50.2 42.8 16.7 67.9 60.5 22.6 Afrique du Sud Sudan 95.4 65.7 31.8 161.1 105.1 53.7 Soudan Swaziland 68.0 58.9 22.7 98.7 88.1 32.9 Swaziland Tanzania 100.5 59.8 33.5 168.7 96.5 56.2 Tanzanie Togo 100.8 68.3 33.6 150.1 92.0 50.0 Togo Tunisia 41.0 18.5 13.7 48.4 20.7 16.1 Tunisie Uganda 99.5 70.3 33.2 170.1 115.2 56.7 Ouganda Zambia 102.1 86.5 34.0 170.6 146.5 56.9 Zambie Zimbabwe 53.4 51.4 17.8 83.3 82.9 27.8 Zimbabwe Africa 102.3 78.6 34.1 168.3 127.2 56.1 Afrique African Statistical Yearbook 2011 / Annuaire Statistique pour l'Afrique 2011
  • 76.
    MILLENIUM DEVELOPMENT GOALS- OBJECTIFS DU MILLENAIRE POUR LE DEVELOPPEMENT Goal 5. Improve maternal health/Améliorer la santé maternelle Births Attended by Skilled Health Staff Contraceptive Prevalence Rate Maternal Mortality Naissances assistées par un personnel de Taux de prévalence Mortalité maternelle santé qualifié (%) contraceptive (% of women ages 15-49/ % des femmes agées de 15 à 49 (per/pour 100000) ans) Target/Cible Pays Country 1990-99 2005-08 2005-08 Year/année Value/Valeur 1990-99 2008 2015 Algeria 77.0 95.2 95.2 2006 61.4 117.4 120.0 29.4 Algérie Angola 22.5 47.3 47.3 2001 6.2 1 300.0 610.0 325.0 Angola Benin 59.8 74.0 74.0 2006 17.0 498.0 410.0 124.5 Bénin Botswana 96.0 … … 2000 48.0 ... 190.0 ... Botswana Burkina Faso 31.0 53.5 53.5 2006 17.4 484.0 560.0 121.0 Burkina Faso Burundi 19.0 33.6 33.6 2005 9.1 499.0 970.0 124.8 Burundi Cameroon 59.3 63.0 63.0 2006 29.2 ... 600.0 ... Cameroun Cape Verde 88.5 77.5 77.5 2005 61.0 42.0 94.0 10.5 Cap-Vert Cent. Afr. Rep. 45.9 53.4 53.4 2006 19.0 649.0 850.0 162.3 République Centrafricaine Chad 24.0 … … 2004 2.8 900.0 1 200.0 225.0 Tchad Comoros 51.6 … … 2000 25.7 460.0 340.0 115.0 Comores Congo 50.0 83.4 83.4 2007 20.6 890.0 580.0 222.5 Congo Congo, Dem. Republic ... 74.0 74.0 2007 20.6 ... 670.0 ... Rép. Démocratique du Congo Côte d'Ivoire 46.9 56.8 56.8 2006 12.9 597.0 470.0 149.3 Côte d'Ivoire Djibouti ... 92.9 92.9 2006 17.8 570.0 300.0 142.5 Djibouti Egypt 58.1 78.9 78.9 2008 60.3 96.0 82.0 24.0 Egypte Equat. Guinea 5.0 … … … … 820.0 280.0 205.0 Guinée Equatoriale Eritrea 20.6 … … 1995 8.0 1 400.0 280.0 350.0 Erythrée Ethiopia 7.9 5.7 5.7 2005 14.7 1 400.0 470.0 350.0 Ethiopie Gabon 80.0 … … 2000 32.7 500.0 260.0 125.0 Gabon Gambia 44.1 56.8 56.8 2001 17.5 1 000.0 400.0 250.0 Gambie Ghana 44.3 58.7 58.7 2006 16.7 740.0 350.0 185.0 Ghana Guinea 54.8 38.0 38.0 2005 9.1 528.0 680.0 132.0 Guinée Guinea Bissau 18.0 38.8 38.8 2006 10.3 822.0 1 000.0 205.5 Guinée-Bissau Kenya 42.7 … … 2003 39.3 570.0 530.0 142.5 Kenya Lesotho 49.6 … … 2004 37.3 610.0 530.0 152.5 Lesotho Liberia 70.0 46.3 46.3 2007 11.4 560.0 990.0 140.0 Libéria Libya 94.0 … … 1995 45.2 220.0 64.0 55.0 Jamahiriya Arabe Libyenne 75 Madagascar 47.3 … … 2004 27.1 488.0 440.0 122.0 Madagascar Malawi 55.0 53.6 53.6 2006 41.7 620.0 510.0 155.0 Malawi Mali 23.7 45.1 45.1 2006 8.2 580.0 830.0 145.0 Mali Mauritania 58.0 … … 2001 8.0 800.0 550.0 200.0 Mauritanie Mauritius 99.7 99.2 99.2 2002 75.9 34.0 36.0 8.5 Maurice Morocco 43.0 … … 2004 63.0 228.0 110.0 57.0 Maroc Mozambique 43.7 … … 2003 16.5 1 500.0 550.0 375.0 Mozambique Namibia 59.8 81.4 81.4 2006 55.1 220.0 180.0 55.0 Namibie Niger 16.7 32.9 32.9 2006 11.2 593.0 820.0 148.3 Niger Nigeria 41.6 … … 2003 12.6 704.0 840.0 176.0 Nigéria Rwanda 31.2 38.6 38.6 2005 17.4 2 300.0 540.0 575.0 Rwanda São T. & Principe 52.0 80.7 80.7 2006 30.3 106.4 26.6 Sao Tomé-et-Principe Senegal 46.6 51.9 51.9 2005 11.8 510.0 410.0 127.5 Sénégal Seychelles 47.0 … … … … ... … ... Seychelles Sierra Leone 33.4 43.2 43.2 2005 5.3 1 800.0 970.0 450.0 Sierra Leone Somalia 34.2 33.0 33.0 2006 14.6 1 600.0 1 200.0 400.0 Somalie South Africa 84.4 … … 2003 60.3 150.0 410.0 37.5 Afrique du Sud Sudan 82.0 49.2 49.2 2006 7.6 370.0 750.0 92.5 Soudan Swaziland 70.5 69.0 69.0 2007 50.6 560.0 420.0 140.0 Swaziland Tanzania 35.8 43.4 … 2005 26.4 530.0 790.0 132.5 Tanzanie Togo 49.6 62.4 62.4 2006 16.8 640.0 350.0 160.0 Togo Tunisia 83.4 … … 2001 62.6 68.9 60.0 17.2 Tunisie Uganda 37.8 41.9 41.9 2006 23.7 550.0 430.0 137.5 Ouganda Zambia 47.1 46.5 46.5 2007 40.8 649.0 470.0 162.3 Zambie Zimbabwe 72.5 68.5 68.5 2006 60.2 280.0 790.0 70.0 Zimbabwe Africa 45.0 50.5 50.2 n.a. n.a. 717.0 530.2 179.2 Afrique African Statistical Yearbook 2011 / Annuaire Statistique pour l'Afrique 2011
  • 77.
    MILLENIUM DEVELOPMENT GOALS- OBJECTIFS DU MILLENAIRE POUR LE DEVELOPPEMENT Goal 6. Combat HIV/AIDS /Combattre le VIH/Sida Number of women (15+) Prevalence of tuberculosis adult HIV prevalence rate (aged 15-49) living with HIV (per 100 000 population) Nbre de femmes (+15) vivant avec le VIH Incidence de la tuberculose pour 100 000) Prévalence du VIH parmi 15-49 (thousand) Country 2009 2000 2009 1990 2009 Pays Algeria 5.2 64.0 67.0 ... 0.1 Algérie Angola 110.0 423.0 389.0 0.5 2.0 Angola Benin 32.0 131.0 146.0 0.2 1.2 Bénin Botswana 170.0 457.0 531.0 3.5 24.8 Botswana Burkina Faso 56.0 298.0 51.0 3.9 1.2 Burkina Faso Burundi 90.0 447.0 397.0 3.9 3.3 Burundi Cameroon 320.0 224.0 549.0 0.6 5.3 Cameroun Cape Verde … 307.0 191.0 ... ... Cap-Vert Cent. Afr. Rep. 67.0 341.0 227.0 3.1 4.7 République Centrafricaine Chad 110.0 435.0 395.0 1.1 3.4 Tchad Comoros <0.1 105.0 456.0 ... 0.1 Comores Congo 40.0 397.0 68.0 5.2 3.4 Congo Congo, Dem. Republic … 492.0 461.0 ... ... Rép. Démocratique du Congo Côte d'Ivoire 220.0 636.0 606.0 2.4 3.4 Côte d'Ivoire Djibouti 7.4 702.0 645.0 0.9 2.5 Djibouti Egypt 2.4 42.0 869.0 ... <0.1 Egypte Equat. Guinea 11.0 119.0 30.0 0.1 5.0 Guinée Equatoriale Eritrea 13.0 138.0 129.0 0.3 0.8 Erythrée Ethiopia … 528.0 142.0 ... ... Ethiopie Gabon 25.0 293.0 572.0 0.9 5.2 Gabon Gambia 9.7 375.0 603.0 0.1 2.0 Gambie Ghana 140.0 368.0 425.0 0.3 1.8 Ghana Guinea 41.0 337.0 329.0 1.1 1.3 Guinée Guinea Bissau 12.0 296.0 562.0 0.3 2.5 Guinée-Bissau Kenya 760.0 390.0 305.0 3.9 6.3 Kenya Lesotho 160.0 364.0 282.0 0.8 23.6 Lesotho Liberia 19.0 510.0 405.0 0.3 1.5 Libéria Libya … 61.0 518.0 ... ... Jamahiriya Arabe Libyenne 76 Madagascar 7.3 377.0 55.0 0.2 0.2 Madagascar Malawi 470.0 300.0 478.0 7.2 11.0 Malawi Mali 40.0 549.0 243.0 0.4 1.0 Mali Mauritania 4.0 499.0 628.0 0.2 0.7 Mauritanie Mauritius 2.5 43.0 676.0 0.0 1.0 Maurice Morocco 8.1 132.0 40.0 ... 0.1 Maroc Mozambique 760.0 425.0 109.0 1.2 11.5 Mozambique Namibia 95.0 525.0 323.0 1.6 13.1 Namibie Niger 28.0 285.0 588.0 0.1 0.8 Niger Nigeria 1700.0 477.0 328.0 1.3 3.6 Nigéria Rwanda 88.0 436.0 497.0 5.2 2.9 Rwanda São T. & Principe … 189.0 565.0 ... ... Sao Tomé-et-Principe Senegal 32.0 450.0 162.0 0.2 0.9 Sénégal Seychelles … 57.0 545.0 ... ... Seychelles Sierra Leone 28.0 753.0 61.0 ... 1.6 Sierra Leone Somalia 15.0 586.0 1193.0 0.1 0.7 Somalie South Africa 3300.0 535.0 494.0 0.7 17.8 Afrique du Sud Sudan 140.0 186.0 808.0 0.1 1.1 Soudan Swaziland 100.0 506.0 206.0 2.3 25.9 Swaziland Tanzania 730.0 647.0 673.0 4.8 5.6 Tanzanie Togo 67.0 30.0 796.0 0.6 3.2 Togo Tunisia <1 285.0 30.0 ... <0.1 Tunisie Uganda 610.0 217.0 278.0 10.2 6.5 Ouganda Zambia 490.0 425.0 170.0 12.7 13.5 Zambie Zimbabwe 620.0 329.0 309.0 10.1 14.3 Zimbabwe Africa 11755.6 371.5 410.8 2.4 4.9 Afrique African Statistical Yearbook 2011 / Annuaire Statistique pour l'Afrique 2011
  • 78.
    MILLENIUM DEVELOPMENT GOALS- OBJECTIFS DU MILLENAIRE POUR LE DEVELOPPEMENT Goal 7. Ensure environmental sustainability/ Assurer un environnement durable Status of National % Population with Nationally Protected Forest Area (% of land Environmental Action Access to an Improved Areas (% of total land CO2 Emissions per Capita (Metric tons) area) Plans Water Source area) Statut national des plans % de la population ayant Surfaces nationales Superficie forêstière( % d'action sur accès aux sources d'eau protégées (% du total Emissions de CO2 par habt (T. métrique) des terres) l'environnement potable des terres) Pays Country 2008 2010 1999-2005 2005 2009 Algeria No data 83.0 0.6 2.5 2.7 3.3 Algérie Angola No data 50.0 46.9 6.6 1.2 1.3 Angola Benin Completed 75.0 41.2 7.0 0.3 0.4 Bénin Botswana Completed 95.0 20.0 18.5 2.3 2.3 Botswana Burkina Faso Completed 76.0 20.6 10.4 0.1 0.1 Burkina Faso Burundi Completed 72.0 6.7 5.7 0.1 0.0 Burundi Cameroon Completed 74.0 42.1 4.5 0.4 0.4 Cameroun Cape Verde Completed 84.0 21.1 0.0 0.5 0.7 Cap-Vert Cent. Afr. Rep. Being prepared 67.0 36.3 8.2 0.1 0.1 République Centrafricaine Chad No data 50.0 9.2 9.1 0.0 0.0 Tchad Comoros Completed 95.0 1.6 0.0 0.2 0.2 Comores Congo Completed 71.0 65.6 4.5 1.6 1.7 Congo Congo, Dem. Republic Completed 46.0 68.0 4.5 0.0 0.0 Rép. Démocratique du Congo Côte d'Ivoire Completed 80.0 32.7 6.2 0.3 0.3 Côte d'Ivoire Djibouti No data 92.0 0.3 0.4 2.4 2.0 Djibouti Egypt Completed 99.0 0.1 0.8 2.1 2.3 Egypte Equat. Guinea Completed … 58.0 0.0 8.0 6.8 Guinée Equatoriale Eritrea Completed 61.0 15.2 5.0 0.2 0.2 Erythrée Ethiopia Completed 38.0 11.2 5.5 0.1 0.1 Ethiopie Gabon Completed 87.0 85.4 2.8 3.6 3.1 Gabon Gambia Completed 92.0 48.0 2.3 0.2 0.3 Gambie Ghana Completed 82.0 21.7 4.9 0.3 0.3 Ghana Guinea Completed 71.0 26.6 0.7 0.1 0.1 Guinée Guinea Bissau Completed 61.0 71.9 0.0 0.3 0.3 Guinée-Bissau Kenya Completed 59.0 6.1 6.2 0.3 0.3 Kenya Lesotho Completed 85.0 1.4 0.2 0.1 0.1 Lesotho Liberia No data 68.0 44.9 1.3 0.2 0.2 Libéria Libya No data … 0.1 0.1 9.1 8.6 Jamahiriya Arabe Libyenne Madagascar Completed 41.0 21.6 1.9 0.1 0.2 Madagascar 77 Malawi Completed 80.0 34.4 11.3 0.1 0.1 Malawi Mali Completed 56.0 10.2 3.7 0.1 0.1 Mali Mauritania Completed 49.0 0.2 1.7 1.1 0.9 Mauritanie Mauritius Completed 99.0 17.2 7.7 3.3 3.5 Maurice Morocco No data 81.0 11.5 0.7 1.1 1.1 Maroc Mozambique Completed 47.0 49.6 6.1 0.1 0.1 Mozambique Namibia Completed 92.0 8.9 12.9 1.3 1.9 Namibie Niger Completed 48.0 1.0 7.7 0.1 0.1 Niger Nigeria Completed 58.0 9.9 3.3 0.8 0.5 Nigéria Rwanda Completed 65.0 17.6 14.7 0.1 0.1 Rwanda São T. & Principe Completed 89.0 28.1 0.0 0.6 0.9 Sao Tomé-et-Principe Senegal Completed 69.0 44.0 11.3 0.5 0.5 Sénégal Seychelles Completed … 89.1 99.8 10.7 12.9 Seychelles Sierra Leone Completed 49.0 38.1 1.1 0.2 0.2 Sierra Leone Somalia No data 30.0 10.8 0.3 0.1 0.1 Somalie South Africa Completed 91.0 7.6 5.4 9.1 9.0 Afrique du Sud Sudan No data 57.0 29.4 3.6 0.3 0.3 Soudan Swaziland Completed 69.0 32.7 2.0 0.9 1.2 Swaziland Tanzania Completed 54.0 37.7 15.6 0.1 0.2 Tanzanie Togo Completed 60.0 5.3 7.9 0.4 0.4 Togo Tunisia Completed 94.0 6.5 0.3 2.3 2.2 Tunisie Uganda Completed 67.0 15.2 9.6 0.1 0.1 Ouganda Zambia Completed 60.0 66.5 8.6 0.2 0.2 Zambie Zimbabwe Being prepared 82.0 40.4 7.9 0.9 0.8 Zimbabwe Africa 64.9 22.9 5.2 1.1 1.1 Afrique African Statistical Yearbook 2011 / Annuaire Statistique pour l'Afrique 2011
  • 79.
    78 African Statistical Yearbook 2011 / Annuaire Statistique pour l'Afrique 2011
  • 80.
    2 Part 79 Partie Country Tables Tableaux par pays African Statistical Yearbook 2011 / Annuaire Statistique pour l'Afrique 2011
  • 81.
    Algeria Algérie AREA (KM 2) 2 381 741 SUPERFICIE (KM 2) CAPITAL CITY Algiers Alger CAPITALE CURRENCY Algerian Dinar Dinar algérien MONNAIE I SOCIAL AND DEMOGRAPHIC INDICATORS — INDICATEURS DEMOGRAPHIQUES ET SOCIAUX 2002 2003 2004 2005 2006 2007 2008 2009 2010 Population Population Population au milieu de l'année - Mid-year population - Total (Million) 31.4 31.9 32.4 32.9 33.4 33.9 34.4 34.9 35.4 Total (million) Population au milieu de l'année - Mid-year population - Urban (%) 61.2 61.9 63.0 63.3 63.9 64.6 65.2 65.8 66.5 Urbaine (%) Female (%) 49.5 49.5 49.5 49.5 49.5 49.5 49.5 49.5 49.5 Femme (%) Population by Age Group Population par groupe d'âge 0-14 10084 779 9955 721 9841 441 9740 664 9653 164 9583 156 9538 392 9528 693 9559 767 0-14 15-64 19958 223 20514 293 21068 104 21620 091 22171 533 22718 490 23250 035 23751 851 24214 222 15-64 65+ 1371 112 1415 421 1456 580 1493 780 1526 781 1556 522 1584 999 1614 926 1648 600 65+ Active Population (000) 11 986.0 12 377.3 12 789.7 13 197.2 13 649.9 14 076.5 14 486.3 14 841.6 15 196.2 Population active (000) Female (%) 29.3 29.6 29.9 30.2 30.7 31.0 31.2 31.6 31.9 Femme (%) Taux brut de natalité - Total (par Crude birth rate - Total (per 1000) 21.0 21.0 21.0 20.7 21.0 21.0 21.0 21.0 20.8 1000) Taux brut de mortalité - Total (par Crude death rate - Total (per 1000) 5.0 5.0 5.0 5.0 5.0 5.0 5.0 5.0 4.9 1000) Life expectancy at birth - Total Espérance de vie à la naissance - 71.0 71.0 71.0 71.7 72.0 72.0 72.0 73.0 72.3 (years) Total (années) Net reproduction rate - (per Taux net de reproduction - (par ... ... ... 1.1 ... ... ... ... 1.1 woman) femme) Indice synthétique de fécondité - Total fertility rate - (per woman) 3.0 2.0 2.0 2.4 2.0 2.0 2.0 2.0 2.4 (par femme) Education Enseignement Teaching staff at first level - Total Personnel enseignant - 1er degré - 170.04 167.5 170.0 171.5 171.4 170.8 169.7 141.4 ... (thousands) Total (milliers) Teaching staff at second level - Personnel enseignant - 2ème degré - ... 170.3 176.4 ... ... ... ... ... ... Total (thousands) T t l (th d ) Total (milliers) T t l ( illi ) Teaching staff at third level - Total Personnel enseignant - 3ème degré - 20.3 21.7 26.1 28.4 30.0 31.7 ... 37.2 ... (thousands) Total (milliers) First level student enrollment - Total Elèves inscrits - 1er degré - Total 4 692 4 613 4 508 4 362 4 197 4 087 3 942 3 253 ... (thousands) (milliers) First level student enrollment - Elèves inscrits - 1er degré - 80 Female (thousands) 2 204 2 166 2 119 2 050 1 974 1 931 1 865 1 538 ... Femmes (milliers) Second level student enrollment - Elèves inscrits - 2ème degré - Total 3 424 3 548 3 677 3 756 ... ... ... ... ... Total (thousands) (milliers) Second level student enrollment - Elèves inscrits - 2ème degré - 1 716 1 793 1 863 1 906 ... ... ... ... ... Female (thousands) Femmes (milliers) Third level student enrollment - Elèves inscrits - 3ème degré - Total 624.8 682.8 716.5 792.1 818.0 901.6 ... 1 149.7 ... Total (thousands) (milliers) Third level student enrollment - Elèves inscrits - 3ème degré - ... ... 365.4 437.4 448.1 517.4 ... 667.7 ... Female (thousands) Femmes (milliers) Public expenditure on education (% Dépenses publiques consacrées à ... ... ... ... ... ... ... ... ... of budget) l'enseignement (% du budget) Health Santé Hospital beds - Total (per 10 000 Nombre de lits d'hôpitaux - Total ... 170 170 ... ... ... ... 170 ... population) (pour 10 000) Nurses - Total (per 10 000 Nombre d'infirmières - Total (pour 247 245 242 238 ... 283 ... 190 ... population) 10 000) Physicians - Total (per 10 000 Nombre de médecins - Total (pour 11 11 12 9 ... ... ... 12 ... population) 10 000) Public expenditure on Health (% of Dépenses publiques consacrées à la 8 9 9 10 12 ... ... ... ... budget) santé (% du budget) African Statistical Yearbook 2011 / Annuaire Statistique pour l'Afrique 2011
  • 82.
    Algeria Algérie II NATIONAL ACCOUNTS — COMPTES NATIONAUX 2002 2003 2004 2005 2006 2007 2008 2009 2010 Gross domestic product by kind of economic activity at current prices Produit intérieur brut par branche d'activité économique aux prix courants Algerian Dinar (Millions) Dinar algérien (Millions) Agriculture 417 225 515 282 580 506 581 616 641 285 704 201 711 754 926 372 ... Agriculture Mining and quarrying 1 482 514 1 874 508 2 325 456 3 359 015 3 890 723 4 099 814 5 014 471 3 125 108 ... Industries extractives Manufacturing 276 614 287 978 314 772 337 349 358 336 381 614 408 879 465 826 ... Industries manufacturières Electricity, gas & water 55 461 61 775 67 789 74 809 82 658 87 691 93 706 91 211 ... Electricité, gaz et eau Construction 409 938 445 214 507 968 564 416 674 337 825 090 956 708 1 094 822 ... Bâtiments et travaux publics Wholesale & retail trade, Commerce de gros et de détail, 562 776 610 700 669 749 737 758 803 569 943 955 1 094 375 1 257 075 ... restaurants, hotels restaurants et hôtels Banques, assurances, affaires Finance, insurance, real estate, etc. 195 214 231 849 246 421 288 648 316 565 328 895 372 759 416 677 ... immobilières Transport and communications 340 983 390 551 512 570 645 029 743 534 822 407 863 566 914 362 ... Transport(s) et communications Administrations publiques et Public administration and defense 479 619 532 145 584 384 612 256 652 257 777 113 1 057 430 1 193 930 ... défense Other services ... ... ... ... ... ... ... ... ... Autres services Moins Services d’intermédiation Less Imputed Service Charges - 75 074 - 100 752 - 106 677 - 132 929 - 139 959 - 140 544 - 158 551 - 178 986 ... financière Gross domestic product at factor Produit intérieur brut aux couts des 4 145 271 4 849 251 5 702 938 7 067 966 8 023 304 8 830 236 10 415 096 9 306 397 ... cost / basic prices facteurs / prix de base Plus: Indirect Taxes / taxes on Plus taxes indirectes/impôts sur les 377 502 403 071 446 179 494 018 491 535 532 454 653 929 711 118 ... products, less subsidies produits, moins les subventions Expenditure on Gross domestic product at current purchaser's values Emploi du produit intérieur brut aux prix courants d'acquisition Algerian Dinar (Millions) Dinar algérien (Millions) Consommation finale des Government final consumption 700 447 777 522 846 896 865 879 954 867 1 089 003 1 458 770 1 642 959 ... administrations publiques Private final consumption 1 944 325 2 126 300 2 371 025 2 526 030 2 695 581 2 963 820 3 338 767 3 748 081 ... Consommation finale privée Gross fixed capital formation 1 111 309 1 265 165 1 476 903 1 691 640 1 969 458 2 462 124 3 228 343 3 811 419 ... Formation brute de capital fixe Increase in inventories 275 073 328 425 568 511 702 213 608 728 771 571 915 889 874 427 ... Variation des stocks Exports of goods and services 1 650 790 2 008 951 2 462 920 3 596 649 4 149 707 4 402 232 5 298 034 3 524 401 ... Exportations de biens et services Moins importations de biens et Less imports of goods and services 1 159 170 1 254 041 1 577 138 1 820 427 1 863 501 2 326 059 3 170 777 3 583 772 ... services GDP at purchasers' values 4 522 773 5 252 321 6 149 117 7 561 984 8 514 839 9 362 690 11 069 025 10 017 515 ... PIB aux prix d'acquisition Gross domestic product by kind of economic activity at constant prices Produit intérieur brut par branche d'activité economique aux prix constants 81 Annual Growth Rates (%) Taux de croissance annuel (%) Agriculture -1.3 19.7 3.1 1.9 4.9 5.0 3.5 20.0 ... Agriculture Mining and quarrying 3.7 8.8 3.3 5.8 -2.5 -0.9 3.0 -6.0 ... Industries extractives Manufacturing 1.3 3.3 -0.2 -2.6 -0.9 -3.6 2.0 0.7 ... Industries manufacturières Electricity, gas & water 6.1 11.4 9.7 9.5 3.4 6.0 7.9 7.2 ... Electricité, gaz et eau Construction 8.2 5.5 8.0 7.1 11.6 9.5 10.0 8.7 ... Bâtiments et travaux publics Wholesale & retail trade, Commerce de gros et de 5.1 6.7 5.3 5.1 2.0 3.1 2.4 2.6 ... restaurants, hotels détail,restaurants et hôtels Banques, assurances, affaires Finance, insurance, real estate, etc. 5.1 10.0 7.9 14.0 8.7 1.0 5.8 11.2 ... immobilières Transport and communications 4.7 6.9 5.1 5.1 2.0 3.0 2.4 2.4 ... Transport(s) et communications Administrations publiques et Public administartion and defense 3.0 4.5 4.0 3.0 3.1 6.5 5.0 0.0 ... défense Other services ... ... ... ... ... ... ... ... ... Autres services Moins Services d’intérmediation Less Imputed Service Charges -2.1 58.2 -9.5 8.4 -4.8 -13.0 72.8 5.5 ... financière Gross domestic product at factor Produit intérieur brut aux couts des 3.9 7.2 4.8 5.0 1.9 2.8 2.3 2.0 ... cost / basic prices facteurs / prix de base Plus: Indirect Taxes / taxes on Plus taxes indirectes/impôts sur les 16.7 2.3 10.2 5.9 2.7 5.5 3.0 6.8 ... products, less subsidies produits, moins les subventions Gross domestic product at market Produit intérieur brut aux prix du 4.7 6.9 5.1 5.1 2.0 3.0 2.4 2.4 ... prices marché 2008: semi-final 2009: Provisional 2008: semi-définitif 2009: provisoire African Statistical Yearbook 2011 / Annuaire Statistique pour l'Afrique 2011
  • 83.
    Algeria Algérie Expenditure on Gross domestic product at constant purchasers' values Emplois du produit intérieur brut aux prix constants d'acquisition Annual Growth Rates (%) Taux de croissance annuel (%) Consommation finale des Government final consumption 5.5 4.2 4.5 2.1 4.8 7.1 8.7 6.0 ... administrations publiques Private final consumption 3.8 4.0 5.8 4.8 2.9 2.5 4.9 5.8 ... Consommation finale privée Gross fixed capital formation 7.6 5.1 8.1 9.0 2.4 12.4 14.2 14.4 ... Formation brute de capital fixe Exports of goods and services 5.6 7.2 4.2 6.1 -2.5 -0.6 -2.9 -10.7 ... Exportations de biens et services Moins importations de biens et Less imports of goods and services 19.5 2.4 13.1 9.5 -1.8 11.1 17.7 9.1 ... services III INFLATION 2002 2003 2004 2005 2006 2007 2008 2009 2010 Annual Growth Rates (%) Taux de croissance annuel (%) All Item 1.4 2.6 3.6 1.6 2.3 3.6 4.9 5.7 4.1 Ensemble Food 0.3 3.9 3.7 -0.7 4.3 6.5 7.3 ... 4.2 Alimentation Health 2.6 1.0 0.0 1.1 1.0 3.0 2.1 ... 3.3 Santé Energy 0.0 1.7 1.7 13.4 3.2 1.0 1.3 ... ... Energie Transport 2.9 5.6 10.6 9.8 1.5 -0.5 0.7 ... 3.3 Transport IV AGRICULTURAL PRODUCTION - PRODUCTION AGRICOLE 2002 2003 2004 2005 2006 2007 2008 2009 2010 Tons (Thousand) Tonnes (milliers) Wheat, Tons (thousands) 1 502 2 965 2 731 2 415 2 688 2 319 1 111 2 953 ... Blé, tonnes (milliers) Potato, Tons (thousands) 1 333 1 880 1 896 2 157 2 181 1 507 2 171 2 636 ... Pomme de terre, tonnes (milliers) Barely, Tons (thousands) 416 1 222 1 212 1 033 1 236 1 187 396 2 203 ... Orge, tonnes (milliers) Tomato, Tons (thousands) 815 887 1 092 1 023 796 567 559 641 ... Tomates, tonnes (milliers) Dates, Tones (thousands) 418 492 443 516 491 527 553 601 ... Dattes, tonnes (milliers) V MINING PRODUCTION - PRODUCTION MINIERE 2002 2003 2004 2005 2006 2007 2008 2009 2010 Crude Petroleum, metric tons Pétrole brut, tonnes métriques 45 601.0 54 869.0 59 340.0 62 545.0 63 865.0 64 085.0 ... ... ... (thousands) (milliers) 82 Natural gas, terajoules (thousands) 3 213.7 3 248.4 3 216.3 3 586.3 3 844.9 3 424.7 ... ... ... Gaz naturel, térajoules (milliers) Iron ores and concentrates, metric Minerai de fer et concentrés, tonnes 1 200.0 1 378.0 1 415.0 1 950.0 2 000.0 1 982.1 ... ... ... tons (thousands) métriques (milliers) VI ENERGY - ENERGIE 2002 2003 2004 2005 2006 2007 2008 2009 2010 Electricity - total hydro production, Électricité - production hydraulique 57.0 265.0 251.0 555.0 218.0 226.0 ... ... ... kilowatt hours (millions) totale, kilowatt-heures (millions) Electricity - total thermal production, Électricité - production thermique 27 590.0 29 306.0 30 999.0 32 320.0 35 008.0 36 970.0 ... ... ... kilowatt hours (millions) totale, kilowatt-heures (millions) Electricity - total production, self- Electricité - Production totale privée 245 379 365 390 452 477 ... ... ... producer (Million Kilowatt Hours) (million de kilowatt heures) Electricité - Production totale Electricity - total production, public 27 402 29 192 30 885 32 485 34 774 36 719 ... ... ... publique (million de kilowatt (Million Kilowatt Hours) heures) African Statistical Yearbook 2011 / Annuaire Statistique pour l'Afrique 2011
  • 84.
    Algeria Algérie VII TOURISM AND INFRASTRUCTURE - TOURISME ET INFRASTUCTURE 2002 2003 2004 2005 2006 2007 2008 2009 2010 Arrivals - Tourists (thousands) ... ... ... ... ... ... ... ... ... Arrivées - touristes (milliers) Rooms in hotels and similar Chambres d'hotels et establishments (thousands) établissements assimilés (milliers) ... ... ... ... ... ... ... ... ... Paved Road (% of total) ... ... 70 ... ... ... ... ... ... Routes asphaltées (% du total) Total Network (Railways-km) ... ... 3 572 3 572 3 572 3 572 ... ... ... Réseau total voies ferrées-Km Main Telephone Lines (per 1,000 Lignes téléphoniques fixes (pour 60 70 80 80 90 90 90 70 ... inhabitants) 1000 habitants) Mobile Cellular Subscribers (per Abonnés aux téléphones mobiles 10 50 150 420 630 810 790 940 ... 1,000 inhabitants) (pour 1000 habitants) VII FINANCIAL AND MONETARY STATISTICS - FINANCES ET STATISTIQUES MONETAIRES 2002 2003 2004 2005 2006 2007 2008 2009 2010 VII-1 Monetary Statistics VII-1 Statistiques monétaires Algerian Dinar (Billions) Dinar algérien (Milliards) Money supply (M1) 1 240 1 414 1 851 2 032 2 725 3 689 4 335 4 371 4 868 Masse monétaire (M1) Quasi-money 1 487 1 755 1 635 1 762 1 809 1 927 2 161 2 229 2 456 Quasi-monnaie of which Demand Deposit ... ... ... ... ... ... ... ... ... dont Monnaie scripturale Net foreign assets 1 725 2 309 3 073 4 157 5 502 7 402 10 247 10 758 11 756 Avoirs extérieurs nets Domestic credit 1 710 1 641 1 331 555 310 - 340 - 1 402 - 892 - 913 Crédit intérieur of which claims on private sector 552 589 676 902 1 030 1 215 1 413 1 621 1 818 dont créances sur le secteur privé of which Claims on government dont créances nettes sur le 426 233 - 233 - 1 255 - 1 674 - 2 602 - 4 092 - 4 079 - 4 376 sector, net gouvernement International reserves (millions of Réserves internationales (millions 23 238 33 125 43 246 56 303 77 914 110 318 143 243 149 041 162 614 US $) de $ EU) Average Exchange Rate (National Taux de change (moyen) (monnaie 79.68 77.40 72.06 73.28 72.65 69.29 64.58 72.65 74.39 Currency per us $) nationale par dollars) VII-2 Public Finance VII-2 Finances publiques Algerian Dinar (Billions) Dinar algérien (Milliards) Total Revenues and Grants 1 603 1 974 2 230 3 083 3 640 3 689 5 191 3 675 4 503 Recettes totales et dons Tax Revenue 1 491 1 875 2 151 2 993 3 520 3 564 5 054 3 559 4 337 Recettes fiscales Non Tax Revenue 112 99 72 84 120 117 137 116 166 Recettes non fiscales Grants 0 0 7 6 0 8 0 0 0 Dons Total Expenditures and Net Lending p g 1 582 1 723 1 904 2 057 2 485 3 250 4 315 4 360 4 956 Dépenses totales et prêts nets p p Current expenditure 976 1 123 1 251 1 241 1 434 1 661 2 218 2 299 3 013 Dépenses courantes Of which Wages and Salaries 301 330 391 492 531 629 827 880 1 330 Dont rémunérations et salaires Capital expenditure 575 567 641 811 1 019 1 442 1 973 1 926 1 943 Dépenses d'équipement Net Lending 31 33 12 5 32 147 124 135 0 Prêts nets 83 Fiscal Balance 22 252 326 1 025 1 155 438 876 - 685 - 453 Solde global y compris les dons VII-3 Balance of Payments VII-3 Balance des paiements Algerian Dinar (Billions) Dinar algérien (Milliards) Trade balance 534 860 1 029 1 942 2 474 2 363 2 487 565 760 Balance commerciale Services Balance - 94 - 104 - 144 - 167 - 160 - 284 - 536 - 631 - 328 Balance des services Net Income - 178 - 208 - 260 - 373 - 329 - 128 - 187 - 95 - 68 Revenus nets Current transfers, net total 86 134 176 151 117 153 142 191 253 Transferts courants Current account balance 348 683 801 1 554 2 102 2 105 1 906 30 617 Solde du compte courant VII-4 External Debt and Financial Flows VII-4 Dette extérieure et flux financiers US $ (Millions) $ E.U (Millions) Total external debt 22 642 23 353 21 821 17 437 5 911 5 667 5 976 5 268 4 627 Dette extérieure totale Private 3 400 2 300 1 900 1 600 1 300 1 300 1 300 1 300 1 300 Privée Public 19 242 21 053 19 921 15 837 4 611 4 367 4 676 3 968 3 327 Publique Total external debt service 4 530 4 650 6 010 6 120 13 630 1 510 1 460 520 1 596 Service de la dette extérieure Net Foreign Direct Investment Investissements étranger direct 1 065 634 882 1 081 1 795 1 662 2 646 2 847 ... Inflows (flux nets entrants) Net Total Official Development Aide publique au développement 190 238 315 346 209 390 319 319 ... assistance (nette totale) African Statistical Yearbook 2011 / Annuaire Statistique pour l'Afrique 2011
  • 85.
    Algeria Algérie 2002 2003 2004 2005 2006 2007 2008 2009 2010 US $ (Millions) Dinar algérien Exports, fob Exportations, fàb Exports - Total 18 296 24 256 31 582 45 422 53 709 59 348 78 120 44 575 ... Exportations - Total Main Products Principaux produits Petroleum oils, oils from bituminous Les huiles de pétrole, les huiles de 8 022 11 577 18 349 24 915 31 344 33 623 43 028 21 525 ... minerals, crude minéraux bitumineux, brut Oils petroleum, bituminous, Huiles de pétrole, bitumineux, 2 577 3 381 3 262 4 003 4 438 5 581 7 000 5 172 ... distillates, except crude distilles, sauf brut Natural gas, liquefied 2 542 3 410 3 391 4 635 5 274 5 145 6 656 4 967 ... Gaz naturel, liquéfiés Natural gas in gaseous state 1 151 862 1 025 1 959 2 853 3 278 4 954 9 638 ... Gaz naturel en état gazeux Propane, liquefied 1 019 1 169 1 298 1 611 1 721 2 361 2 854 1 569 ... Propane, liquéfié Main Destinations Principales destinations United States 2 560.0 5 126.4 7 926.5 10 834.9 16 088.9 18 432.0 20 032.3 11 150.5 ... États-Unis Spain 2 804.3 3 082.8 3 599.7 5 072.0 5 766.6 6 145.3 9 503.1 5 288.8 ... Espagne France 1 099.0 1 716.6 2 391.0 3 446.8 4 373.3 4 739.4 7 251.6 3 310.4 ... France Canada 2 555.4 3 474.2 3 574.4 4 582.2 5 190.5 4 627.2 7 082.5 3 817.9 ... Canada Netherlands 1 039.0 874.0 1 284.9 1 829.3 2 018.0 3 081.4 3 746.3 2 479.1 ... Pays-Bas 2002 2003 2004 2005 2006 2007 2008 2009 2010 Imports, cif Importations, cif Imports - Total 11 809 15 356 18 170 19 848 21 360 27 295 39 335 40 703 ... Importations - Total (millions) Principaux produits Main Products Bars & rods,i/nas,hr,hd or he,cntg Barres, i / nas, hr, hd ou he, ,cntg 153 306 426 492 639 632 1 734 1 186 ... 84 indent,ribs,etc,prod dur rp/tar,nes indent,ribs, etc, prod dur rp/tar, nda Wheat nes and meslin 352 262 517 464 462 825 1 503 832 ... Blé nda et méteil Durum wheat 426 421 299 374 340 405 1 224 614 ... Blé dur Medicaments nes, in dosage 391 511 598 647 683 992 1 168 1 015 ... Médicaments nda, en dosage Automobiles w reciprocatg piston Automobiles w reciprocatg moteur à engine displacg > 1000 cc to 1500 257 363 529 591 596 887 1 367 1 015 ... piston displacg> 1500 cc à 3000 cc cc Main Origin Principales provenances France 3 543.0 4 183.4 5 258.2 5 809.6 5 057.7 5 695.7 8 108.2 6 959.6 ... France Italy 1 170.7 1 320.4 1 533.5 1 662.2 1 948.0 2 518.7 4 402.7 3 598.0 ... Italie China 351.9 645.9 980.5 1 404.4 1 947.5 2 742.0 3 751.9 4 180.2 ... Chine Spain 710.7 864.9 1 030.0 1 541.0 1 351.5 1 851.2 3 191.8 2 922.3 ... Canada Germany 835.0 777.8 1 215.2 1 345.8 1 351.1 1 647.1 2 169.6 2 040.0 ... Allemagne African Statistical Yearbook 2011 / Annuaire Statistique pour l'Afrique 2011
  • 86.
    Angola Angola AREA (KM 2) 1 246 700 SUPERFICIE (KM 2) CAPITAL CITY Luanda Luanda CAPITALE CURRENCY Angola Kwanza Kwanza Angolais MONNAIE I SOCIAL AND DEMOGRAPHIC INDICATORS — INDICATEURS DEMOGRAPHIQUES ET SOCIAUX 2002 2003 2004 2005 2006 2007 2008 2009 2010 Population Population Population au milieu de l'année - Mid-year population - Total (Million) 15.2 15.6 16.1 16.6 17.1 17.6 18.0 18.5 19.0 Total (million) Population au milieu de l'année - Mid-year population - Urban (%) 51.0 52.0 53.0 54.0 54.9 55.8 56.7 57.6 58.5 Urbaine (%) Female (%) 50.7 50.7 50.7 50.7 50.7 50.7 50.7 50.7 50.7 Femme (%) Population by Age Group Population par groupe d'âge 0-14 7095 591 7299 014 7497 923 7683 863 7853 334 8009 879 8160 554 8315 777 8482 773 0-14 15-64 7695 644 7964 229 8242 679 8527 227 8817 222 9113 605 9416 062 9724 566 10039 155 15-64 65+ 372 791 383 589 394 863 406 499 418 555 431 101 444 052 457 289 470 779 65+ Active Population (000) 6 646.4 6 879.6 7 108.4 7 325.8 7 549.4 7 773.2 8 010.9 8 275.4 8 532.5 Population active (000) Female (%) 46.6 46.7 46.7 46.7 46.7 46.7 46.8 46.8 46.9 Femme (%) Taux brut de natalité - Total (par Crude birth rate - Total (per 1000) 48.0 47.0 46.0 45.0 44.0 44.0 43.0 42.0 43.0 1000) Taux brut de mortalité - Total (par Crude death rate - Total (per 1000) 20.0 19.0 19.0 18.0 18.0 17.0 17.0 16.0 17.0 1000) Life expectancy at birth - Total Espérance de vie à la naissance - 44.0 45.0 45.0 46.0 46.0 47.0 47.0 48.0 47.0 (years) Total (années) Net reproduction rate - (per Taux net de reproduction - (par ... ... ... 2.0 ... ... ... ... 2.0 woman) femme) Indice synthétique de fécondité - Total fertility rate - (p woman) y (per ) 7.0 7.0 6.0 6.0 6.0 6.0 6.0 6.0 6.0 (par femme) Education Enseignement Teaching staff at first level - Total Personnel enseignant - 1er degré - ... ... ... ... ... ... ... ... ... (thousands) Total (milliers) Teaching staff at second level - Total Personnel enseignant - 2ème degré - ... ... ... ... ... ... ... ... ... 85 (thousands) Total (milliers) Teaching staff at third level - Total Personnel enseignant - 3ème degré - 1.3 ... ... ... 1.3 ... ... ... ... (thousands) Total (milliers) First level student enrollment - Total Elèves inscrits - 1er degré - Total ... ... ... ... 3 370 3 559 3 932 ... ... (thousands) (milliers) First level student enrollment - Elèves inscrits - 1er degré - Femmes ... ... ... ... 1 630 1 721 1 771 ... ... Female (thousands) (milliers) Second level student enrollment - Elèves inscrits - 2ème degré - Total 462 ... ... ... 458 ... ... ... ... Total (thousands) (milliers) Second level student enrollment - Elèves inscrits - 2ème degré - 211 ... ... ... ... ... ... ... ... Female (thousands) Femmes (milliers) Third level student enrollment - Total Elèves inscrits - 3ème degré - Total 12.6 48.2 37.5 48.2 48.7 ... ... ... ... (thousands) (milliers) Third level student enrollment - Elèves inscrits - 3ème degré - 5.0 ... ... ... ... ... ... ... ... Female (thousands) Femmes (milliers) Public expenditure on education (% Dépenses publiques consacrées à ... ... ... ... ... ... ... ... ... of budget) l'enseignement (% du budget) Health Santé Hospital beds - Total (per 10 000 Nombre de lits d'hôpitaux - Total 14 15 16 16 ... ... ... ... ... population) (pour 10 000) Nurses - Total (per 10 000 Nombre d'infirmières - Total (pour 213 223 234 245 ... ... ... ... ... population) 10 000) Physicians - Total (per 10 000 Nombre de médecins - Total (pour 14 15 16 16 ... ... 10 ... ... population) 10 000) Public expenditure on Health (% of Dépenses publiques consacrées à la 4 5 4 5 5 ... ... ... ... budget) santé (% du budget) African Statistical Yearbook 2011 / Annuaire Statistique pour l'Afrique 2011
  • 87.
    Angola Angola II NATIONAL ACCOUNTS — COMPTES NATIONAUX 2002 2003 2004 2005 2006 2007 2008 2009 2010 Gross domestic product by kind of economic activity at current prices Produit intérieur brut par branche d'activité économique aux prix courants Angola Kwanza (Millions) Kwanza Angolais(Millions) Agriculture 39 079 86 700 142 500 204 300 322 900 424 070 488 112 477 014 ... Agriculture Mining and quarrying 304 093 605 100 999 300 1 792 500 2 475 240 3 185 046 4 435 571 3 830 608 ... Industries extractives Manufacturing 18 227 40 400 66 100 94 200 32 437 41 313 51 907 48 228 ... Industries manufacturières Electricity, gas & water ... ... ... ... ... ... ... ... ... Electricité, gaz et eau Construction 16 994 37 900 62 100 89 400 20 924 26 707 97 001 49 499 ... Bâtiments et travaux publics Wholesale & retail trade, Commerce de gros et de détail, 58 409 127 118 202 084 277 891 357 690 476 741 720 507 583 229 ... restaurants, hotels restaurants et hôtels Banques, assurances, affaires Finance, insurance, real estate, etc. ... ... ... ... ... ... ... ... ... immobilières Transport and communications 17 638 38 382 61 016 83 909 108 002 143 948 217 554 176 102 ... Transport(s) et communications Administrations publiques et Public administration and defense 37 260 86 700 128 000 164 300 235 066 313 304 457 302 378 602 ... défense Other services ... ... ... ... ... ... ... ... ... Autres services Moins Services d’intermédiation Less Imputed Service Charges ... ... ... ... ... ... ... ... ... financière Gross domestic product at factor Produit intérieur brut aux couts des 491 700 1 022 300 1 661 100 2 706 500 3 552 258 4 611 130 6 467 955 5 543 281 ... cost / basic prices facteurs / prix de base Plus: Indirect Taxes / taxes on Plus taxes indirectes/impôts sur les ... ... ... ... ... ... ... ... ... products, less subsidies produits, moins les subventions Expenditure on Gross domestic product at current purchaser's values Emploi du produit intérieur brut aux prix courants d'acquisition Angola Kwanza (Millions) Kwanza Angolais(Millions) Consommation finale des Government final consumption 174 338 350 462 501 068 686 219 770 156 1 017 251 1 667 255 1 442 455 ... administrations publiques Private final consumption 197 260 491 140 736 485 971 052 1 077 991 1 480 719 2 111 973 2 481 784 ... Consommation finale privée Gross fixed capital formation 59 442 125 307 143 067 204 829 390 403 604 638 959 465 918 327 ... Formation brute de capital fixe Increase in inventories 3 106 6 552 7 481 10 708 20 412 31 613 50 163 48 014 ... Variation des stocks Exports of goods and services 372 997 724 394 1 151 280 2 116 781 2 679 690 3 429 315 4 820 382 2 933 215 ... Exportations de biens et services 86 Moins importations de biens et Less imports of goods and services 309 517 656 629 887 331 1 319 969 1 308 984 2 017 677 3 235 538 2 294 924 ... services GDP at purchasers' values 497 626 1 041 226 1 652 049 2 669 619 3 629 668 4 545 860 6 373 700 5 528 871 ... PIB aux prix d'acquisition Gross domestic product by kind of economic activity at constant Produit intérieur brut par branche d'activité economique aux prix constants prices Annual Growth Rates (%) Taux de croissance annuel (%) Agriculture 8.1 2.5 10.7 15.8 23.5 16.6 14.0 0.1 ... Agriculture Mining and quarrying 16.7 11.5 13.4 18.6 0.2 36.8 10.2 -2.7 ... Industries extractives Manufacturing 8.7 2.4 10.6 15.7 23.0 17.1 13.8 0.1 ... Industries manufacturières Electricity, gas & water ... ... ... ... ... ... ... ... ... Electricité, gaz et eau Construction 9.0 3.3 10.9 16.0 21.1 18.5 13.5 -0.1 ... Bâtiments et travaux publics Wholesale & retail trade, Commerce de gros et de 9.5 2.3 10.6 16.2 21.8 17.8 13.7 0.0 ... restaurants, hotels détail,restaurants et hôtels Banques, assurances, affaires Finance, insurance, real estate, etc. ... ... ... ... ... ... ... ... ... immobilières Transport and communications 11.1 4.0 13.1 12.5 19.1 21.6 12.2 -0.2 ... Transport(s) et communications Administrations publiques et Public administartion and defense 10.5 4.4 8.9 12.6 23.8 21.4 10.9 0.6 ... défense Other services ... ... ... ... ... ... ... ... ... Autres services Moins Services d’intérmediation Less Imputed Service Charges ... ... ... ... ... ... ... ... ... financière Gross domestic product at factor Produit intérieur brut aux couts des 13.9 8.3 12.4 17.4 7.7 29.8 11.2 -1.7 ... cost / basic prices facteurs / prix de base Plus: Indirect Taxes / taxes on Plus taxes indirectes/impôts sur les ... ... ... ... ... ... ... ... ... products, less subsidies produits, moins les subventions Gross domestic product at market Produit intérieur brut aux prix du 14.5 3.3 11.2 20.6 18.6 20.3 13.2 -0.4 ... prices marché 2008: semi-final 2009: Provisional 2008: semi-définitif 2009: provisoire African Statistical Yearbook 2011 / Annuaire Statistique pour l'Afrique 2011
  • 88.
    Angola Angola Expenditure on Gross domestic product at constant purchasers' Emplois du produit intérieur brut aux prix constants d'acquisition values Annual Growth Rates (%) Taux de croissance annuel (%) Consommation finale des Government final consumption 16.1 -0.7 0.2 2.2 -2.2 26.9 32.3 -0.7 ... administrations publiques Private final consumption -12.0 22.9 5.1 -1.6 -3.2 31.9 15.1 34.9 ... Consommation finale privée Gross fixed capital formation 7.4 4.1 -20.0 6.8 66.2 48.7 28.1 9.9 ... Formation brute de capital fixe Exports of goods and services 13.9 -4.1 11.4 37.2 10.4 22.9 13.5 -30.1 ... Exportations de biens et services Moins importations de biens et Less imports of goods and services -4.9 4.7 -5.3 11.0 -13.5 48.0 29.4 -18.6 ... services III INFLATION 2002 2003 2004 2005 2006 2007 2008 2009 2010 Annual Growth Rates (%) Taux de croissance annuel (%) All Item 108.9 98.3 43.6 23.0 13.3 12.2 12.5 13.7 14.7 Ensemble Food ... ... ... ... ... ... ... ... ... Alimentation Health ... ... ... ... ... ... ... ... ... Santé Energy ... ... ... ... ... ... ... ... ... Energie Transport ... ... ... ... ... ... ... ... ... Transport IV AGRICULTURAL PRODUCTION - PRODUCTION AGRICOLE 2002 2003 2004 2005 2006 2007 2008 2009 2010 Tons (Thousand) Tonnes (milliers) Cassava, Tons (thousands) 6 523 6 892 8 587 8 606 8 810 9 730 10 057 12 828 ... Manioc, tonnes (milliers) Maize, Tons (thousands) 547 619 531 720 566 616 702 970 ... Maïs, tonnes (milliers) Sweet Potato, Tons (thousands) 423 543 630 659 685 949 820 983 ... Patates douces, tonnes (milliers) Banana, Tons (thousands) 300 300 300 300 300 300 300 ... ... Banane, tonnes (milliers) Potato, Tons (thousands) 179 269 242 307 593 491 402 823 ... Pomme de terre, tonnes (milliers) V MINING PRODUCTION - PRODUCTION MINIERE 87 2002 2003 2004 2005 2006 2007 2008 2009 2010 Crude Petroleum, metric tons Pétrole brut, tonnes métriques 44 758.0 43 733.0 49 443.0 62 314.0 70 494.0 84 908.0 ... ... ... (thousands) (milliers) Natural gas (terajoules) 23 560.0 24 700.0 29 266.0 25 364.0 26 534.0 32 387.0 ... ... ... Gaz naturel (térajoules) Diamonds and other precious stones, Diamants et autres pierres 5 400.0 6 300.0 6 146.0 7 079.0 9 175.0 ... ... ... ... unworked, carat (thousands) précieuses, brut, carat (milliers) VI ENERGY - ENERGIE 2002 2003 2004 2005 2006 2007 2008 2009 2010 Electricity - total hydro production, Électricité - production hydraulique 1 143.0 1 241.0 1 750.0 2 219.0 2 665.0 2 583.0 ... ... ... kilowatt hours (millions) totale, kilowatt-heures (millions) Electricity - total thermal production, Électricité - production thermique 622.0 754.0 490.0 413.0 294.0 588.0 ... ... ... kilowatt hours (millions) totale, kilowatt-heures (millions) Electricity - total production, self- Electricité - Production totale privée 101 149 97 82 58 116 ... ... ... producer (Million Kilowatt Hours) (million de kilowatt heures) Electricity - total production, public Electricité - Production totale 1 664 1 846 2 143 2 550 2 901 3 055 ... ... ... (Million Kilowatt Hours) publique (million de kilowatt heures) African Statistical Yearbook 2011 / Annuaire Statistique pour l'Afrique 2011
  • 89.
    Angola Angola VII TOURISM AND INFRASTRUCTURE - TOURISME ET INFRASTUCTURE 2002 2003 2004 2005 2006 2007 2008 2009 2010 Arrivals - Tourists (thousands) 91 107 194 210 121 195 294 ... ... Arrivées - touristes (milliers) Rooms in hotels and similar Chambres d'hotels et établissements establishments (thousands) 8 9 9 10 ... ... ... ... ... assimilés (milliers) Paved Road (% of total) ... ... ... ... ... ... ... ... ... Routes asphaltées (% du total) Total Network (Railways-km) ... ... ... ... ... ... ... ... ... Réseau total voies ferrées-Km Main Telephone Lines (per 1,000 Lignes téléphoniques fixes (pour 5 5 6 6 6 5 6 ... ... inhabitants) 1000 habitants) Mobile Cellular Subscribers (per Abonnés aux téléphones mobiles 10 20 50 100 180 280 380 440 ... 1,000 inhabitants) (pour 1000 habitants) VII FINANCIAL AND MONETARY STATISTICS - FINANCES ET STATISTIQUES MONETAIRES 2002 2003 2004 2005 2006 2007 2008 2009 2010 VII-1 Monetary Statistics VII-1 Statistiques monétaires Angola Kwanza (Millions) Kwanza Angolais(Millions) Money supply (M1) 31 856 69 075 96 059 152 910 195 448 311 539 634 872 776 770 771 800 Masse monétaire (M1) Quasi-money 75 128 108 847 147 646 238 335 420 133 541 363 782 273 1 527 070 1 639 230 Quasi-monnaie of which Demand Deposit ... ... ... ... ... ... ... ... ... dont Monnaie scripturale Net foreign assets 93 550 142 167 223 703 386 670 923 042 1 019 500 1 508 240 1 179 830 1 395 520 Avoirs extérieurs nets Domestic credit 26 770 65 002 74 481 61 588 - 132 264 88 290 594 999 1 750 340 1 742 520 Crédit intérieur of which claims on private sector 23 241 53 064 88 471 137 329 272 149 479 431 794 282 1 266 890 1 492 040 dont créances sur le secteur privé of which Claims on government dont créances nettes sur le 2 092 6 076 - 23 577 - 88 385 - 421 847 - 416 041 - 263 902 417 325 120 040 sector, net gouvernement International reserves (millions of US Réserves internationales (millions de 376 634 1 374 3 197 8 599 11 197 17 869 13 664 19 667 $) $ EU) Average Exchange Rate (National Taux de change (moyen) (monnaie 43.53 74.61 83.54 87.16 80.37 76.71 75.03 79.33 91.91 Currency per us $) nationale par dollars) VII-2 Public Finance VII-2 Finances publiques Angola Kwanza (Millions) Kwanza Angolais(Millions) Total Revenues and Grants 190 770 394 967 609 670 1 085 790 1 685 000 2 124 800 3 217 400 1 847 900 3 071 200 Recettes totales et dons Tax Revenue 188 800 382 041 596 600 1 050 260 1 589 500 2 052 900 3 070 200 1 703 700 3 009 300 Recettes fiscales Non Tax Revenue 1 970 4 900 5 570 29 170 95 500 69 600 145 300 142 900 60 000 Recettes non fiscales 88 Grants 0 8 026 7 500 6 360 0 2 300 1 900 1 300 1 900 Dons Total Expenditures and Net Lending 225 930 467 484 591 890 859 670 1 288 300 1 599 500 2 653 800 2 363 400 2 679 000 Dépenses totales et prêts nets Current expenditure 191 780 390 794 506 350 724 950 852 300 1 068 200 1 761 200 1 620 100 1 733 200 Dépenses courantes Of which Wages and Salaries 53 100 129 000 170 400 246 700 311 300 364 500 543 000 660 200 866 600 Dont rémunérations et salaires Capital expenditure 34 150 76 690 73 300 134 720 436 000 531 300 892 600 743 300 945 800 Dépenses d'équipement Net Lending 0 0 12 240 0 0 0 0 0 ... Prêts nets Fiscal Balance - 35 160 - 72 517 17 780 226 120 396 700 525 300 563 600 - 515 500 392 200 Solde global y compris les dons VII-3 Balance of Payments VII-3 Balance des paiements Angola Kwanza (Millions) Kwanza Angolais(Millions) Trade balance 199 627 300 517 637 751 1 373 304 1 855 051 2 357 577 3 221 306 1 441 235 2 636 206 Balance commerciale Services Balance - 136 147 - 232 752 - 373 803 - 576 493 - 484 346 - 945 938 -1 636 463 -1 471 221 -1 702 461 Balance des services Net Income - 71 441 - 128 806 - 207 231 - 351 328 - 440 751 - 673 327 -1 088 263 - 541 256 - 814 836 Revenus nets Current transfers, net total 1 399 7 379 542 2 327 - 15 268 - 17 029 - 15 757 - 29 351 - 37 957 Transferts courants Current account balance - 6 563 - 53 663 57 260 447 810 914 686 721 283 480 824 - 600 594 80 952 Solde du compte courant VII-4 External Debt and Financial Flows VII-4 Dette extérieure et flux financiers US $ (Millions) $ E.U (Millions) Total external debt 8 574 8 565 10 161 12 091 9 364 11 781 16 604 17 902 19 116 Dette extérieure totale Private 2 508 2 377 3 562 4 813 3 896 5 920 8 993 9 601 11 038 Privée Public 6 066 6 188 6 599 7 277 5 468 5 860 7 610 8 301 8 078 Publique Total external debt service 2 167 2 324 2 285 2 646 2 909 4 323 2 750 4 881 4 862 Service de la dette extérieure Net Foreign Direct Investment Investissements étranger direct (flux 3 133 5 685 5 606 6 794 9 064 9 796 16 581 13 101 ... Inflows nets entrants) Net Total Official Development Aide publique au développement 414 494 1 144 415 164 248 369 239 ... assistance (nette totale) African Statistical Yearbook 2011 / Annuaire Statistique pour l'Afrique 2011
  • 90.
    Angola Angola 2002 2003 2004 2005 2006 2007 2008 2009 2010 US $ (Millions) Kwanza Angolais Exports, fob Exportations, fàb Exports - Total 8 328 9 508 13 475 24 109 32 982 43 489 ... ... ... Exportations - Total Main Products Principaux produits Crude oil 7 539 8 530 12 442 22 583 29 929 42 352 ... ... ... Pétrole brut Diamond 638 788 790 1 092 1 155 1 182 ... ... ... Diamond Refined oil 96 139 148 242 295 324 ... ... ... Pétrole raffiné Gas 10 16 30 30 260 328 ... ... ... Gaz Coffee 1 0 0 0 0 0 ... ... ... Café Main Destinations Principales destinations United States 3 275.3 4 506.2 4 796.8 8 846.5 12 174.6 12 926.0 19 497.7 9 703.1 ... États-Unis China 1 087.0 2 205.9 4 717.3 6 581.8 10 933.3 12 888.7 22 382.5 14 675.8 ... Chine France 635.7 694.0 815.4 1 749.1 1 553.2 2 370.5 4 010.3 3 270.5 ... France Taiwan, China 598.5 754.8 859.1 983.5 1 866.9 2 121.5 1 926.2 1 058.6 ... Taiwan, Chine Chile 0.0 64.5 430.8 1 197.1 1 317.2 962.5 1 671.2 42.5 ... Chili 2002 2003 2004 2005 2006 2007 2008 2009 2010 Imports, cif Importations, cif Imports - Total 3 066 4 467 7 055 8 221 11 307 13 085 21 806 17 447 ... Importations - Total (millions) 89 Principaux produits Main Products Flottantes ou submersibles de Floating or submersible drilling or ... 338 989 708 171 ... 940 2 ... forage ou de production des plates- production platforms formes Parts of boring or sinking machinery, Pièces du forage ou de fonçage, 225 267 384 442 479 538 593 442 ... whether or not self-propelled qu'ils soient ou non autopropulsés Petroleum oils&oils obtained from Huiles de pétrole, bitumineux, bituminous minerals,o/than crude 27 68 39 44 151 279 539 755 ... distilles, sauf brut etc Aircraft nes of an unladen weight Aéronefs nda d'un poids à vide > 3 1 3 71 702 339 485 58 ... exceeding 15,000 kg 2.000 kg mais pas sup 15.000 kg Diesel powered trucks with a GVW Diesel chariots de manutention d'un 14 27 26 31 89 180 379 204 ... exceeding twenty tonnes PTAC n'excédant pas cinq tonnes Main Origin Principales provenances Portugal 536.9 738.6 833.5 996.0 1 518.5 2 302.1 3 339.1 3 126.7 ... Portugal United States 372.5 491.7 594.2 927.9 1 550.2 1 280.2 2 117.0 1 422.9 ... États-Unis Korea, Rep. 18.5 24.8 1 814.1 1 517.4 1 037.1 173.7 1 266.3 325.3 ... Corée, Rép China 61.3 145.8 193.5 372.8 894.2 1 234.5 2 942.5 2 386.0 ... Taiwan, Chine Brazil 199.6 235.5 357.2 520.8 836.7 1 218.1 1 974.6 1 333.0 ... Brésil African Statistical Yearbook 2011 / Annuaire Statistique pour l'Afrique 2011
  • 91.
    Benin Bénin AREA (KM 2) 114 763 SUPERFICIE (KM 2) CAPITAL CITY Porto Novo Porto-Novo CAPITALE CURRENCY CFA Franc Franc CFA MONNAIE I SOCIAL AND DEMOGRAPHIC INDICATORS — INDICATEURS DEMOGRAPHIQUES ET SOCIAUX 2002 2003 2004 2005 2006 2007 2008 2009 2010 Population Population Population au milieu de l'année - Mid-year population - Total (Million) 7.1 7.4 7.6 7.9 8.1 8.4 8.7 8.9 9.2 Total (million) Population au milieu de l'année - Mid-year population - Urban (%) 39.0 39.3 39.6 40.0 40.4 40.8 41.2 41.6 42.0 Urbaine (%) Female (%) 51.5 51.5 51.5 51.5 51.5 51.5 51.6 51.6 51.6 Femme (%) Population by Age Group Population par groupe d'âge 0-14 3156 140 3248 808 3343 659 3440 667 3539 711 3640 591 3743 072 3846 864 3951 633 0-14 15-64 3733 456 3878 814 4028 587 4179 656 4331 431 4484 859 4640 189 4798 063 4959 038 15-64 65+ 223 330 230 520 238 484 247 303 257 066 267 682 278 825 290 058 301 070 65+ Active Population (000) 2 853.6 2 969.4 3 090.1 3 212.4 3 334.2 3 456.5 3 579.5 3 698.2 3 825.2 Population active (000) Female (%) 45.9 45.9 45.9 45.8 45.8 45.8 45.8 46.3 46.4 Femme (%) Taux brut de natalité - Total (par Crude birth rate - Total (per 1000) 41.0 41.0 41.0 40.0 40.0 40.0 39.0 39.0 40.0 1000) Taux brut de mortalité - Total (par Crude death rate - Total (per 1000) 11.0 10.0 10.0 10.0 10.0 9.0 9.0 9.0 9.0 1000) Life expectancy at birth - Total Espérance de vie à la naissance - 59.0 59.0 60.0 60.0 61.0 61.0 61.0 62.0 61.0 (years) Total (années) Net reproduction rate - (per Taux net de reproduction - (par ... ... ... 2.0 ... ... ... ... 2.0 woman) femme) Indice synthétique de fécondité - Total fertility rate - (p woman) y (per ) 6.0 6.0 6.0 6.0 6.0 6.0 5.0 5.0 5.0 (par femme) Education Enseignement Teaching staff at first level - Total Personnel enseignant - 1er degré - ... ... ... ... ... ... ... ... ... (thousands) Total (milliers) Teaching staff at second level - Total Personnel enseignant - 2ème degré - 90 ... ... ... ... ... ... ... ... ... (thousands) Total (milliers) Teaching staff at third level - Total Personnel enseignant - 3ème degré - ... ... ... ... ... ... ... ... ... (thousands) Total (milliers) First level student enrollment - Total Elèves inscrits - 1er degré - Total ... ... ... ... ... ... ... ... ... (thousands) (milliers) First level student enrollment - Elèves inscrits - 1er degré - Femmes 476 516 565 574 603 ... 729 ... ... Female (thousands) (milliers) Second level student enrollment - Elèves inscrits - 2ème degré - Total 287 312 345 435 ... ... ... ... ... Total (thousands) (milliers) Second level student enrollment - Elèves inscrits - 2ème degré - 91 98 109 154 ... ... ... ... ... Female (thousands) Femmes (milliers) Third level student enrollment - Total Elèves inscrits - 3ème degré - Total 34.3 39.4 41.3 42.2 42.6 ... ... ... ... (thousands) (milliers) Third level student enrollment - Elèves inscrits - 3ème degré - ... ... ... ... ... ... ... ... ... Female (thousands) Femmes (milliers) Public expenditure on education (% Dépenses publiques consacrées à ... ... 17.1 ... 18.0 ... ... ... ... of budget) l'enseignement (% du budget) Health Santé Hospital beds - Total (per 10 000 Nombre de lits d'hôpitaux - Total 12 12 10 11 32 ... ... ... ... population) (pour 10 000) Nurses - Total (per 10 000 Nombre d'infirmières - Total (pour 36 37 38 39 5 ... ... ... ... population) 10 000) Physicians - Total (per 10 000 Nombre de médecins - Total (pour 12 12 10 11 1 ... ... ... ... population) 10 000) Public expenditure on Health (% of Dépenses publiques consacrées à la 11 11 13 12 11 ... ... ... ... budget) santé (% du budget) African Statistical Yearbook 2011 / Annuaire Statistique pour l'Afrique 2011
  • 92.
    Benin Bénin II NATIONAL ACCOUNTS — COMPTES NATIONAUX 2002 2003 2004 2005 2006 2007 2008 2009 2010 Gross domestic product by kind of economic activity at current prices Produit intérieur brut par branche d'activité économique aux prix courants CFA Franc (Millions) Franc CFA (Millions) Agriculture 660 564 663 523 690 255 742 225 798 012 830 521 956 250 1 056 337 1 171 602 Agriculture Mining and quarrying 4 339 4 691 4 976 5 329 5 762 6 289 7 132 7 783 8 495 Industries extractives Manufacturing 166 056 171 165 167 603 180 289 185 427 198 962 218 412 244 404 281 262 Industries manufacturières Electricity, gas & water 20 648 25 510 25 859 27 658 28 391 29 004 29 149 34 127 40 311 Electricité, gaz et eau Construction 74 296 82 225 86 771 92 900 100 448 109 848 124 806 139 041 151 809 Bâtiments et travaux publics Wholesale & retail trade, Commerce de gros et de détail, 256 942 277 179 283 364 306 900 326 632 353 516 398 280 433 311 490 517 restaurants, hotels restaurants et hôtels Banques, assurances, affaires Finance, insurance, real estate, etc. 233 903 250 671 264 015 282 758 305 273 331 544 360 885 388 122 420 931 immobilières Transport and communications 137 494 160 997 163 704 175 328 195 076 222 201 254 257 278 123 309 482 Transport(s) et communications Administrations publiques et Public administration and defense 245 276 264 595 270 500 292 967 311 802 337 466 380 198 413 639 468 248 défense Other services ... ... ... ... ... ... ... ... ... Autres services Moins Services d’intermédiation Less Imputed Service Charges - 32 373 - 35 001 - 36 059 - 39 207 - 41 991 - 45 529 - 50 333 - 55 447 - 64 248 financière Gross domestic product at factor Produit intérieur brut aux couts des 1 767 146 1 865 555 1 920 989 2 067 146 2 214 834 2 373 822 2 679 035 2 939 442 3 278 409 cost / basic prices facteurs / prix de base Plus: Indirect Taxes / taxes on Plus taxes indirectes/impôts sur les 189 758 201 908 219 024 231 569 245 410 267 482 295 621 321 953 351 866 products, less subsidies produits, moins les subventions Expenditure on Gross domestic product at current purchaser's values Emploi du produit intérieur brut aux prix courants d'acquisition CFA Franc (Millions) Franc CFA (Millions) Consommation finale des Government final consumption 241 069 261 009 258 736 275 834 297 902 323 720 351 936 376 865 403 561 administrations publiques Private final consumption 1 525 769 1 595 144 1 622 894 1 765 750 1 884 542 2 002 340 2 262 436 2 431 175 2 647 962 Consommation finale privée Gross fixed capital formation 370 223 404 061 415 452 444 949 481 079 526 031 596 519 663 807 724 479 Formation brute de capital fixe Increase in inventories - 9 164 15 732 26 951 - 27 582 24 613 21 909 13 385 44 343 28 470 Variation des stocks Exports of goods and services 434 811 433 669 428 657 495 939 454 530 515 832 583 342 644 803 797 371 Exportations de biens et services Moins importations de biens et 91 Less imports of goods and services 605 803 642 151 612 676 656 176 682 423 748 529 832 963 899 600 971 567 services GDP at purchasers' values 1 956 904 2 067 463 2 140 013 2 298 715 2 460 244 2 641 304 2 974 656 3 261 395 3 630 275 PIB aux prix d'acquisition Gross domestic product by kind of economic activity at constant Produit intérieur brut par branche d'activité economique aux prix constants prices Annual Growth Rates (%) Taux de croissance annuel (%) Agriculture 2.5 2.2 6.3 -0.8 5.6 4.2 4.3 7.5 8.9 Agriculture Mining and quarrying 6.0 6.0 4.0 5.0 6.0 7.0 8.0 7.0 7.0 Industries extractives Manufacturing 6.3 0.7 -2.1 5.3 -3.6 3.0 4.2 9.4 14.9 Industries manufacturières Electricity, gas & water 16.9 8.7 0.4 6.7 2.4 1.9 -0.4 14.8 15.8 Electricité, gaz et eau Construction 5.3 7.4 3.5 5.0 6.0 7.2 8.2 7.1 7.0 Bâtiments et travaux publics Wholesale & retail trade, Commerce de gros et de 4.4 6.0 -0.1 6.0 3.2 5.3 6.8 5.2 10.2 restaurants, hotels détail,restaurants et hôtels Banques, assurances, affaires Finance, insurance, real estate, etc. 4.8 6.3 0.0 6.1 3.5 5.5 6.7 5.7 10.7 immobilières Transport and communications 4.8 7.4 -0.8 5.7 4.0 5.9 8.2 6.2 8.0 Transport(s) et communications Administrations publiques et Public administartion and defense 4.1 4.7 3.7 4.0 4.8 4.6 5.0 4.7 5.2 défense Other services ... ... ... ... ... ... ... ... ... Autres services Moins Services d’intérmediation Less Imputed Service Charges 6.0 6.0 1.0 6.6 5.0 6.3 6.3 8.0 13.6 financière Gross domestic product at factor Produit intérieur brut aux couts des 4.0 3.9 2.8 2.8 3.8 4.6 5.3 6.8 9.4 cost / basic prices facteurs / prix de base Plus: Indirect Taxes / taxes on Plus taxes indirectes/impôts sur les 9.8 3.2 6.7 3.8 3.3 4.9 5.0 5.7 6.7 products, less subsidies produits, moins les subventions Gross domestic product at market Produit intérieur brut aux prix du 4.4 3.9 3.1 2.9 3.8 4.6 5.3 6.7 9.2 prices marché 2008: semi-final 2009: Provisional 2008: semi-définitif 2009: provisoire African Statistical Yearbook 2011 / Annuaire Statistique pour l'Afrique 2011
  • 93.
    Benin Bénin Expenditure on Gross domestic product at constant purchasers' Emplois du produit intérieur brut aux prix constants d'acquisition values Annual Growth Rates (%) Taux de croissance annuel (%) Consommation finale des Government final consumption 4.3 7.1 -3.1 3.5 3.5 4.1 4.9 4.6 5.0 administrations publiques Private final consumption 5.6 4.9 0.4 2.4 2.6 2.6 3.5 3.8 10.5 Consommation finale privée Gross fixed capital formation 7.5 9.0 1.6 4.0 5.0 6.0 8.3 7.0 7.0 Formation brute de capital fixe Exports of goods and services 4.0 1.9 -1.5 13.4 -5.0 13.3 11.0 6.7 11.7 Exportations de biens et services Moins importations de biens et Less imports of goods and services 3.0 10.0 -6.0 2.4 2.0 8.0 6.7 4.7 9.7 services III INFLATION 2002 2003 2004 2005 2006 2007 2008 2009 2010 Annual Growth Rates (%) Taux de croissance annuel (%) All Item 2.5 1.5 0.9 5.4 3.8 1.3 7.9 2.2 2.1 Ensemble Food 2.4 1.5 0.9 5.4 3.8 1.3 7.9 2.2 1.2 Alimentation Health 2.5 1.0 0.6 -0.5 -1.6 1.1 2.4 0.4 0.0 Santé Energy 3.3 5.3 1.4 7.7 7.0 -0.4 4.9 2.7 0.4 Energie Transport 2.5 1.0 0.6 -0.5 -1.6 1.1 2.4 0.4 0.0 Transport IV AGRICULTURAL PRODUCTION - PRODUCTION AGRICOLE 2002 2003 2004 2005 2006 2007 2008 2009 2010 Tons (Thousand) Tonnes (milliers) Cassava, Tons (thousands) 2 452 3 055 2 955 2 861 2 524 2 284 2 629 ... ... Manioc, tonnes (milliers) Yams, Tons (thousands) 1 875 2 011 2 257 2 084 2 240 1 682 1 803 ... ... Igname, tonnes (milliers) Maize, Tons (thousands) 622 788 843 865 672 932 1 030 ... ... Maïs, tonnes (milliers) Seed cotton, Tons (thousands) 486 420 425 341 250 269 245 229 ... Graines de coton, tonnes (millers) Sorghum, Tons (thousands) 195 163 164 169 156 117 132 ... ... Sorgho, tonnes (milliers) V MINING PRODUCTION - PRODUCTION MINIERE 92 2002 2003 2004 2005 2006 2007 2008 2009 2010 Gold ores and concentrantes Minerais d'or et concentrés 20.0 20.0 20.0 ... ... ... ... ... ... (Kilograms) (kilogrammes) Salt and pure sodium chloride, 15.0 15.0 15.0 15.0 15.0 15.0 ... ... ... Sel et chlorure de sodium pur, metric tons (thousands) tonnes métriques (milliers) ... ... ... ... ... ... ... ... ... VI ENERGY - ENERGIE 2002 2003 2004 2005 2006 2007 2008 2009 2010 Electricity - total hydro production, Électricité - production hydraulique 2.0 2.0 1.0 1.0 1.0 1.0 ... ... ... kilowatt hours (millions) totale, kilowatt-heures (millions) Electricity - total thermal production, Électricité - production thermique 61.0 78.0 80.0 106.0 127.0 131.0 ... ... ... kilowatt hours (millions) totale, kilowatt-heures (millions) Electricity - total production, self- Electricité - Production totale privée 10 11 10 25 27 27 ... ... ... producer (Million Kilowatt Hours) (million de kilowatt heures) Electricity - total production, public Electricité - Production totale 53 69 71 82 101 105 ... ... ... (Million Kilowatt Hours) publique (million de kilowatt heures) African Statistical Yearbook 2011 / Annuaire Statistique pour l'Afrique 2011
  • 94.
    Benin Bénin VII TOURISM AND INFRASTRUCTURE - TOURISME ET INFRASTUCTURE 2002 2003 2004 2005 2006 2007 2008 2009 2010 Arrivals - Tourists (thousands) 72 175 174 176 180 186 ... ... ... Arrivées - touristes (milliers) Rooms in hotels and similar Chambres d'hotels et établissements establishments (thousands) 6.956 6.682 13.364 20.32 20.32 ... ... ... ... assimilés (milliers) Paved Road (% of total) ... ... 10 ... ... ... ... ... ... Routes asphaltées (% du total) Total Network (Railways-km) ... ... ... ... ... ... ... ... ... Réseau total voies ferrées-Km Main Telephone Lines (per 1,000 Lignes téléphoniques fixes (pour 10 10 10 10 10 10 10 10 ... inhabitants) 1000 habitants) Mobile Cellular Subscribers (per Abonnés aux téléphones mobiles 30 30 60 80 130 240 420 560 ... 1,000 inhabitants) (pour 1000 habitants) VII FINANCIAL AND MONETARY STATISTICS - FINANCES ET STATISTIQUES MONETAIRES 2002 2003 2004 2005 2006 2007 2008 2009 2010 VII-1 Monetary Statistics VII-1 Statistiques monétaires CFA Franc (Millions) Franc CFA (Millions) Money supply (M1) 367 349 407 517 337 230 449 393 503 066 589 865 750 172 764 252 756 385 Masse monétaire (M1) Quasi-money 133 270 146 924 165 414 185 262 223 606 279 472 350 100 424 330 447 856 Quasi-monnaie of which Demand Deposit ... ... ... ... ... ... ... ... ... dont Monnaie scripturale Net foreign assets 438 177 395 519 335 907 378 844 525 485 671 945 700 332 657 785 642 243 Avoirs extérieurs nets Domestic credit 109 070 197 363 213 225 299 242 255 787 231 973 442 261 599 334 606 034 Crédit intérieur of which claims on private sector 222 228 293 849 312 052 375 102 415 821 519 922 624 350 698 548 724 485 dont créances sur le secteur privé of which Claims on government dont créances nettes sur le - 113 158 - 96 486 - 98 827 - 75 860 - 160 034 - 287 949 - 182 089 - 99 214 - 118 451 sector, net gouvernement International reserves (millions of US Réserves internationales (millions de 616 718 640 657 912 1 209 1 263 1 230 1 021 $) $ EU) Average Exchange Rate (National Taux de change (moyen) (monnaie 696.99 581.20 528.29 527.47 522.89 479.27 447.81 472.19 495.28 Currency per us $) nationale par dollars) VII-2 Public Finance VII-2 Finances publiques CFA Franc (Millions) Franc CFA (Millions) Total Revenues and Grants 337 047 385 389 407 100 435 103 472 600 626 900 633 300 675 900 827 500 Recettes totales et dons Tax Revenue 282 425 311 527 311 409 334 020 378 797 446 740 512 200 500 400 575 600 Recettes fiscales Non Tax Revenue 35 680 37 090 39 980 49 420 38 103 101 260 69 100 75 400 106 300 Recettes non fiscales Grants 18 942 36 772 55 711 51 663 55 700 78 900 52 000 100 100 145 600 Dons 93 Total Expenditures and Net Lending 382 115 426 336 429 499 489 247 483 800 585 300 684 500 805 400 876 000 Dépenses totales et prêts nets Current expenditure 259 264 287 209 297 751 345 881 369 189 386 656 465 000 490 400 555 100 Dépenses courantes Of which Wages and Salaries 90 050 107 960 118 300 130 280 134 996 143 100 182 400 225 900 243 200 Dont rémunérations et salaires Capital expenditure 119 617 141 127 131 048 144 167 113 400 198 444 174 700 302 300 320 900 Dépenses d'équipement Net Lending 3 234 - 2 000 700 - 800 1 211 200 44 800 12 700 0 Prêts nets Fiscal Balance - 45 068 - 40 946 - 22 399 - 54 144 - 11 200 41 600 - 51 200 - 129 500 - 48 500 Solde global y compris les dons VII-3 Balance of Payments VII-3 Balance des paiements CFA Franc (Millions) Franc CFA (Millions) Trade balance - 161 226 - 161 759 - 235 547 - 214 567 - 257 201 - 378 900 - 406 400 - 376 476 - 367 186 Balance commerciale Services Balance - 28 740 - 33 032 - 26 316 - 24 785 - 23 491 - 33 900 9 300 - 29 249 - 8 299 Balance des services Net Income - 18 125 - 15 015 - 20 513 - 20 287 - 15 394 - 4 300 - 5 100 - 4 537 - 5 900 Revenus nets Current transfers, net total 96 335 99 998 128 080 111 031 154 840 148 700 162 000 177 716 147 887 Transferts courants Current account balance - 111 756 - 109 808 - 154 296 - 148 608 - 141 246 - 268 400 - 240 200 - 232 546 - 233 497 Solde du compte courant VII-4 External Debt and Financial Flows VII-4 Dette extérieure et flux financiers US $ (Millions) $ E.U (Millions) Total external debt 1 344 1 301 1 370 1 626 544 698 1 040 1 141 1 373 Dette extérieure totale Private 0 0 0 0 0 0 0 71 67 Privée Public 1 344 1 301 1 370 1 626 544 698 1 040 1 070 1 306 Publique Total external debt service 62 66 58 38 1 112 90 37 45 60 Service de la dette extérieure Net Foreign Direct Investment Investissements étranger direct (flux 14 45 65 53 55 261 174 93 ... Inflows nets entrants) Net Total Official Development Aide publique au développement 219 300 394 347 378 474 641 683 ... assistance (nette totale) African Statistical Yearbook 2011 / Annuaire Statistique pour l'Afrique 2011
  • 95.
    Benin Bénin 2002 2003 2004 2005 2006 2007 2008 2009 2010 US $ (Millions) Franc CFA Exports, fob Exportations, fàb Exports - Total 312 314 300 305 385 502 530 478 ... Exportations - Total Main Products Principaux produits Cotton 127 184 203 167 91 61 70 ... ... Coton, non card‚ ni peign‚ Coconuts, cashew nuts 12 8 9 11 9 8 12 ... ... Noix de coco, noix de cajou Tobacco 4 9 19 19 35 15 6 ... ... Tabacs Or (y compris l'or platine), sous Gold (incl. Gold platine), crude, 9 3 0 4 4 4 0 ... ... formes brutes ou mi-ouvré ou en worked or in powder poudre Fruits oilseeds 3 5 3 3 3 3 1 ... ... Autres graines et fruits oléagineux Main Destinations Principales destinations China 11.3 36.2 49.5 55.4 28.0 31.4 31.3 ... ... Chine India 29.4 16.0 11.7 10.6 10.1 16.4 17.2 ... ... Inde Brasil 0.6 0.5 0.3 0.1 2.5 2.0 0.0 ... ... Brésil Nigeria 24.9 7.4 7.2 8.8 10.2 19.0 39.5 ... ... Nigeria Indonesia 16.7 14.7 12.9 5.6 2.0 4.3 11.0 ... ... Indonésie 2002 2003 2004 2005 2006 2007 2008 2009 2010 Imports, cif Importations, cif 94 Imports - Total 1 427 1 635 1 713 2 423 3 234 4 623 6 298 5 311 ... Importations - Total (millions) Principaux produits Main Products Plain weave cotton fabric,>/=85%, 61 115 103 148 242 428 702 575 ... Tissus de coton à armure toile >100 g/m2 to 200 g/m2, printed Petroleum oils&oils obtained from Huiles de pétrole, bitumineux, bituminous minerals,o/than crude 12 38 89 165 141 271 650 479 ... distilles, sauf brut etc Rice, semi-milled or wholly milled, Riz semi-blanchi ou blanchi, même 14 62 105 179 205 297 505 462 ... whether or not polished or glazed poli ou glacé Automobiles w reciprocatg piston Automobiles w recipro catg moteur engine displacg > 1500 cc to 3000 66 80 83 103 145 273 495 265 ... à piston displacg> 1500 cc à 3000 cc cc Huile de palme et ses fractions, Palm oil and its fractions refined but 9 24 20 30 105 222 424 308 ... raffinées, mais non chimiquement not chemically modified modifiées Main Origin Principales provenances France 120.5 124.8 102.5 87.3 91.5 148.8 128.9 ... ... France China 32.3 36.4 31.4 41.7 44.8 73.4 101.8 ... ... Chine Cote d'Ivoire 28.2 27.6 32.9 32.9 36.1 36.7 21.3 ... ... Côte d'Ivoire United Kingdom 24.9 24.0 24.6 27.1 33.1 44.6 22.5 ... ... Royaume-Uni Ghana 27.9 31.6 33.7 33.9 35.8 3.7 11.5 ... ... Ghana African Statistical Yearbook 2011 / Annuaire Statistique pour l'Afrique 2011
  • 96.
    Botswana Botswana AREA (KM 2) 581 730 SUPERFICIE (KM 2) CAPITAL CITY Gaborone Gaberone CAPITALE CURRENCY Botswana Pula Botswana Pula MONNAIE I SOCIAL AND DEMOGRAPHIC INDICATORS — INDICATEURS DEMOGRAPHIQUES ET SOCIAUX 2002 2003 2004 2005 2006 2007 2008 2009 2010 Population Population Population au milieu de l'année - Mid-year population - Total (Million) 1.8 1.8 1.8 1.8 1.9 1.9 1.9 1.9 2.0 Total (million) Population au milieu de l'année - Mid-year population - Urban (%) 54.9 55.7 56.5 57.3 58.1 58.9 59.7 60.4 61.1 Urbaine (%) Female (%) 50.4 50.3 50.3 50.2 50.2 50.1 50.1 50.0 ... Femme (%) Population by Age Group Population par groupe d'âge 0-14 652 804 650 446 648 310 646 845 646 241 646 468 647 454 649 029 651 065 0-14 15-64 1062 575 1084 132 1105 720 1128 299 1152 198 1177 031 1202 196 1226 758 1250 035 15-64 65+ 56 664 59 042 61 462 63 906 66 392 68 927 71 472 73 993 76 469 65+ Active Population (000) 841.9 861.6 881.5 902.9 924.5 947.0 971.4 996.3 1 018.9 Population active (000) Female (%) 47.3 47.3 47.3 47.4 47.4 47.5 47.5 47.4 47.4 Femme (%) Taux brut de natalité - Total (par Crude birth rate - Total (per 1000) 26.0 26.0 25.0 25.0 25.0 25.0 25.0 24.0 25.0 1000) Taux brut de mortalité - Total (par Crude death rate - Total (per 1000) 14.0 15.0 14.0 14.0 13.0 13.0 12.0 12.0 12.0 1000) Life expectancy at birth - Total Espérance de vie à la naissance - 49.0 49.0 50.0 51.0 52.0 53.0 54.0 55.0 55.0 (years) Total (années) Net reproduction rate - (per Taux net de reproduction - (par ... ... ... 1.0 ... ... ... ... 1.0 woman) femme) Indice synthétique de fécondité - Total fertility rate - (p woman) y (per ) 3.0 3.0 3.0 3.0 3.0 3.0 3.0 3.0 3.0 (par femme) Education Enseignement Teaching staff at first level - Total Personnel enseignant - 1er degré - 12.53 12.7 12.7 13.5 13.0 13.0 ... ... ... (thousands) Total (milliers) Teaching staff at second level - Total Personnel enseignant - 2ème degré - 10.82 11.6 11.8 12.4 12.5 12.8 ... ... ... 95 (thousands) Total (milliers) Teaching staff at third level - Total Personnel enseignant - 3ème degré - ... ... ... 0.5 ... ... ... ... ... (thousands) Total (milliers) First level student enrollment - Total Elèves inscrits - 1er degré - Total 331 330 329 329 330 328 ... ... ... (thousands) (milliers) First level student enrollment - Elèves inscrits - 1er degré - Femmes 164 163 162 162 162 160 ... ... ... Female (thousands) (milliers) Second level student enrollment - Elèves inscrits - 2ème degré - Total 166 168 170 171 175 178 ... ... ... Total (thousands) (milliers) Second level student enrollment - Elèves inscrits - 2ème degré - 85 86 87 87 89 91 ... ... ... Female (thousands) Femmes (milliers) Third level student enrollment - Total Elèves inscrits - 3ème degré - Total 13.2 15.6 15.7 15.7 16.2 ... ... ... ... (thousands) (milliers) Third level student enrollment - Elèves inscrits - 3ème degré - 6.6 7.9 8.2 8.3 8.6 ... ... ... ... Female (thousands) Femmes (milliers) Public expenditure on education (% Dépenses publiques consacrées à ... ... ... 21.5 ... 21.0 ... ... ... of budget) l'enseignement (% du budget) Health Santé Hospital beds - Total (per 10 000 Nombre de lits d'hôpitaux - Total 210 213 214 ... ... 240 ... ... ... population) (pour 10 000) Nurses - Total (per 10 000 Nombre d'infirmières - Total (pour 234 248 262 242 239 ... ... ... ... population) 10 000) Physicians - Total (per 10 000 Nombre de médecins - Total (pour 30 29 39 29 28 28 ... ... ... population) 10 000) Public expenditure on Health (% of Dépenses publiques consacrées à la 11 11 16 18 18 ... ... ... ... budget) santé (% du budget) African Statistical Yearbook 2011 / Annuaire Statistique pour l'Afrique 2011
  • 97.
    Botswana Botswana II NATIONAL ACCOUNTS — COMPTES NATIONAUX 2002 2003 2004 2005 2006 2007 2008 2009 2010 Gross domestic product by kind of economic activity at current prices Produit intérieur brut par branche d'activité économique aux prix courants Botswana Pula(Millions) Botswana Pula(Millions) Agriculture 751 945 904 918 1 162 1 492 2 025 1 947 2 348 Agriculture Mining and quarrying 16 170 14 526 17 492 19 896 27 915 30 552 37 515 21 464 31 561 Industries extractives Manufacturing 1 420 1 580 1 728 1 839 2 109 2 716 3 111 3 343 3 857 Industries manufacturières Electricity, gas & water 869 943 1 200 1 276 1 641 2 065 2 341 2 409 2 824 Electricité, gaz et eau Construction 2 064 2 004 2 252 2 297 2 622 3 199 3 571 4 313 5 169 Bâtiments et travaux publics Wholesale & retail trade, Commerce de gros et de détail, 3 932 4 720 5 037 5 412 6 752 8 185 10 102 11 327 13 110 restaurants, hotels restaurants et hôtels Banques, assurances, affaires Finance, insurance, real estate, etc. 3 880 4 295 4 811 5 517 6 295 7 523 9 462 10 302 11 586 immobilières Transport and communications 1 221 1 318 1 544 1 895 2 388 2 766 3 401 4 050 4 443 Transport(s) et communications Administrations publiques et Public administration and defense 5 827 6 695 7 773 8 926 9 913 11 353 13 676 15 364 16 782 défense Other services 1 279 1 454 1 753 2 088 2 369 2 657 3 156 3 766 4 194 Autres services Moins Services d’intermédiation Less Imputed Service Charges - 1 274 - 1 604 - 1 575 - 1 994 - 2 550 - 3 181 - 4 160 - 4 563 - 4 835 financière Gross domestic product at factor Produit intérieur brut aux couts des 36 138 36 875 42 918 48 068 60 615 69 326 84 199 73 722 91 039 cost / basic prices facteurs / prix de base Plus: Indirect Taxes / taxes on Plus taxes indirectes/impôts sur les 2 408 3 154 4 237 4 341 5 079 6 652 7 781 8 374 9 896 products, less subsidies produits, moins les subventions Expenditure on Gross domestic product at current purchaser's values Emploi du produit intérieur brut aux prix courants d'acquisition Botswana Pula(Millions) Botswana Pula(Millions) Consommation finale des Government final consumption 7 971 8 938 9 971 11 763 12 467 14 726 17 339 20 077 21 141 administrations publiques Private final consumption 15 888 14 689 18 094 18 066 26 948 31 316 42 813 46 277 58 836 Consommation finale privée Gross fixed capital formation 9 455 10 417 11 704 12 861 14 187 18 161 21 252 23 372 26 052 Formation brute de capital fixe Increase in inventories 937 1 591 3 929 919 1 351 2 317 7 050 1 726 2 068 Variation des stocks Exports of goods and services 17 950 18 155 20 856 26 860 30 886 36 612 38 657 26 273 32 949 Exportations de biens et services 96 Moins importations de biens et Less imports of goods and services 13 656 13 760 17 396 18 059 20 144 27 155 35 131 35 629 40 111 services GDP at purchasers' values 38 546 40 029 47 155 52 410 65 695 75 978 91 981 82 096 100 935 PIB aux prix d'acquisition Gross domestic product by kind of economic activity at constant Produit intérieur brut par branche d'activité economique aux prix constants prices Annual Growth Rates (%) Taux de croissance annuel (%) Agriculture -6.8 15.1 -8.9 -4.6 -0.9 8.9 4.9 6.0 15.8 Agriculture Mining and quarrying 11.5 6.7 1.8 1.9 7.9 -2.0 -3.8 -21.0 7.0 Industries extractives Manufacturing -3.3 4.4 6.1 6.1 3.3 17.5 2.0 -4.8 6.6 Industries manufacturières Electricity, gas & water 8.4 5.9 7.5 0.4 6.0 4.8 5.4 0.8 5.5 Electricité, gaz et eau Construction 33.4 -12.4 8.6 -6.1 2.3 14.5 -2.8 8.6 15.4 Bâtiments et travaux publics Wholesale & retail trade, Commerce de gros et de 7.2 11.1 3.7 -4.8 9.4 10.8 6.2 3.3 9.0 restaurants, hotels détail,restaurants et hôtels Banques, assurances, affaires Finance, insurance, real estate, etc. 5.7 0.9 3.2 9.1 7.4 8.4 15.0 3.9 4.4 immobilières Transport and communications 6.1 -2.9 4.4 12.8 10.5 11.1 14.7 12.0 3.6 Transport(s) et communications Administrations publiques et Public administartion and defense 11.9 8.0 7.8 5.1 -1.2 4.2 7.8 3.7 0.4 défense Other services -1.4 5.4 12.1 10.0 2.0 5.4 5.5 10.2 3.6 Autres services Moins Services d’intérmediation Less Imputed Service Charges 9.5 15.0 -10.3 15.1 14.9 22.4 24.9 4.6 -2.5 financière Gross domestic product at factor Produit intérieur brut aux couts des 9.8 5.0 4.5 2.3 5.3 3.2 1.9 -5.8 6.4 cost / basic prices facteurs / prix de base Plus: Indirect Taxes / taxes on Plus taxes indirectes/impôts sur les -1.2 26.9 25.5 -5.6 3.5 23.9 12.3 3.3 13.6 products, less subsidies produits, moins les subventions Gross domestic product at market Produit intérieur brut aux prix du 9.1 6.3 6.0 1.6 5.1 4.8 2.9 -4.9 7.2 prices marché 2008: semi-final 2009: Provisional 2010:Estimates 2008: semi-définitif 2009: provisoire 2010:Estimée African Statistical Yearbook 2011 / Annuaire Statistique pour l'Afrique 2011
  • 98.
    Botswana Botswana Expenditure on Gross domestic product at constant purchasers' Emplois du produit intérieur brut aux prix constants d'acquisition values Annual Growth Rates (%) Taux de croissance annuel (%) Consommation finale des Government final consumption 6.3 5.2 5.7 13.7 -2.6 6.0 9.6 1.0 -0.5 administrations publiques Private final consumption 7.5 9.6 5.7 -1.1 5.2 13.0 -2.7 34.0 22.9 Consommation finale privée Gross fixed capital formation 5.4 2.5 4.3 -4.8 -2.8 18.8 8.1 4.9 8.8 Formation brute de capital fixe Exports of goods and services 7.6 -6.7 7.2 17.9 2.9 10.0 -5.5 -33.6 23.2 Exportations de biens et services Moins importations de biens et Less imports of goods and services 1.4 -6.9 17.8 -4.9 -0.1 26.3 17.8 -7.9 5.6 services III INFLATION 2002 2003 2004 2005 2006 2007 2008 2009 2010 Annual Growth Rates (%) Taux de croissance annuel (%) All Item 8.0 9.2 7.0 8.6 11.6 7.1 12.6 8.2 7.0 Ensemble Food ... ... 4.7 5.4 12.5 11.3 20.3 14.3 3.1 Alimentation Health ... ... 4.1 4.0 8.0 5.1 11.0 5.5 2.3 Santé Energy ... ... 6.1 17.5 24.7 4.8 8.0 ... ... Energie Transport ... ... 11.4 14.9 14.0 3.3 21.1 -8.9 11.3 Transport IV AGRICULTURAL PRODUCTION - PRODUCTION AGRICOLE 2002 2003 2004 2005 2006 2007 2008 2009 2010 Tons (Thousand) Tonnes (milliers) Sorghum, tons (thousands) 16 32 17 18 26 25 25 ... ... Sorgho, tonnes (milliers) Maize, tons (thousands) 16 2 2 2 11 12 12 ... ... Maïs, tonnes (milliers) Sunflower, tons (thousands) 7 7 7 7 7 7 7 ... ... Tournesols, tonnes (milliers) Seed cotton, tons (thousands) 3 3 3 3 3 3 3 ... ... Graines de coton, tonnes (milliers) Cereals, nec, tons (thousands) 2 2 2 2 2 2 2 ... ... Céréales, nda, tonnes (milliers) V MINING PRODUCTION - PRODUCTION MINIERE 97 2002 2003 2004 2005 2006 2007 2008 2009 2010 Hard Coal, metric tons (thousands) 953.0 823.0 911.0 967.0 1 000.0 1 038.0 ... ... ... Houille, tonnes métriques (milliers) Gold ores and concentrates 8.0 9.0 162.0 2 709.0 2 547.0 2 722.0 ... ... ... Minerais d'or et concentrés (Kilograms) (Kilogrammes) Diamonds and other precious stones, Diamants et autres pierres 21 702.0 22 800.0 31 125.0 31 890.0 34 293.0 ... ... ... ... unworked, carat (thousands) précieuses, bruts, carat (milliers) VI ENERGY - ENERGIE 2002 2003 2004 2005 2006 2007 2008 2009 2010 Electricity - total hydro production, Électricité - production hydraulique ... ... ... ... ... ... ... ... ... kilowatt hours (millions) totale, kilowatt-heures (millions) Electricity - total thermal production, Électricité - production thermique 1 060.0 1 133.0 991.0 971.0 1 042.0 1 119.0 ... ... ... kilowatt hours (millions) totale, kilowatt-heures (millions) Electricity - total production, self- Electricité - Production totale privée 73 97 100 104 112 120 ... ... ... producer (Million Kilowatt Hours) (million de kilowatt heures) Electricity - total production, public Electricité - Production totale 987 1 036 891 867 930 999 583 ... ... (Million Kilowatt Hours) publique (million de kilowatt heures) African Statistical Yearbook 2011 / Annuaire Statistique pour l'Afrique 2011
  • 99.
    Botswana Botswana VII TOURISM AND INFRASTRUCTURE - TOURISME ET INFRASTUCTURE 2002 2003 2004 2005 2006 2007 2008 2009 2010 Arrivals - Tourists (thousands) 1274 1406 1523 1675 1843 1990 2131 ... ... Arrivées - touristes (milliers) Rooms in hotels and similar Chambres d'hotels et établissements establishments (thousands) 3 4 ... ... ... ... ... ... ... assimilés (milliers) Paved Road (% of total) ... ... ... 33 ... ... ... ... ... Routes asphaltées (% du total) Total Network (Railways-km) ... ... ... ... ... ... ... ... ... Réseau total voies ferrées-Km Main Telephone Lines (per 1,000 Lignes téléphoniques fixes (pour 70 70 70 70 70 70 74 ... ... inhabitants) 1000 habitants) Mobile Cellular Subscribers (per Abonnés aux téléphones mobiles 190 250 290 310 440 610 770 960 ... 1,000 inhabitants) (pour 1000 habitants) VII FINANCIAL AND MONETARY STATISTICS - FINANCES ET STATISTIQUES MONETAIRES 2002 2003 2004 2005 2006 2007 2008 2009 2010 VII-1 Monetary Statistics VII-1 Statistiques monétaires Botswana Pula(Millions) Botswana Pula(Millions) Money supply (M1) 2 581 2 882 4 225 3 998 5 157 6 238 7 768 7 108 9 264 Masse monétaire (M1) Quasi-money 7 318 8 763 9 037 10 676 19 411 26 058 31 459 31 609 33 596 Quasi-monnaie of which Demand Deposit ... ... ... ... ... ... ... ... ... dont Monnaie scripturale Net foreign assets 31 025 24 925 25 240 35 869 48 773 60 545 72 780 59 270 52 550 Avoirs extérieurs nets Domestic credit - 9 889 - 2 516 152 - 2 777 - 8 817 - 12 383 - 10 233 - 818 9 440 Crédit intérieur of which claims on private sector 6 635 7 428 9 221 10 030 12 108 15 220 19 268 21 254 23 622 dont créances sur le secteur privé of which Claims on government dont créances nettes sur le - 17 016 - 10 338 - 9 510 - 13 161 - 21 224 - 27 833 - 29 730 - 22 404 - 14 580 sector, net gouvernement International reserves (millions of US Réserves internationales (millions de 5 474 5 340 5 661 6 309 7 992 9 790 9 119 8 704 8 126 $) $ EU) Average Exchange Rate (National Taux de change (moyen) (monnaie 6.33 4.95 4.69 5.11 5.84 6.14 6.83 7.16 6.79 Currency per us $) nationale par dollars) VII-2 Public Finance VII-2 Finances publiques Botswana Pula(Millions) Botswana Pula(Millions) Total Revenues and Grants 12 709 14 318 16 197 17 957 22 267 27 398 28 629 30 455 30 023 Recettes totales et dons Tax Revenue 10 583 12 259 14 146 16 245 20 130 25 231 25 831 27 185 26 774 Recettes fiscales Non Tax Revenue 2 067 1 974 1 990 1 364 2 024 1 719 2 221 2 647 2 480 Recettes non fiscales 98 Grants 59 84 61 348 113 448 577 623 769 Dons Total Expenditures and Net Lending 13 671 15 710 16 276 17 383 17 632 19 737 24 822 35 151 39 489 Dépenses totales et prêts nets Current expenditure 9 935 11 581 12 935 13 765 14 155 15 954 18 579 23 889 25 732 Dépenses courantes Of which Wages and Salaries 3 446 3 947 4 142 5 129 5 216 5 801 6 850 8 701 9 547 Dont rémunérations et salaires Capital expenditure 3 698 4 200 4 256 3 910 3 783 4 055 6 548 11 458 13 006 Dépenses d'équipement Net Lending 38 - 71 - 916 - 293 - 306 - 272 - 305 - 197 752 Prêts nets Fiscal Balance - 962 - 1 392 - 78 574 4 635 7 660 3 808 - 4 696 - 9 466 Solde global y compris les dons VII-3 Balance of Payments VII-3 Balance des paiements Botswana Pula(Millions) Botswana Pula(Millions) Trade balance 4 477 4 441 3 904 8 982 11 115 10 561 2 982 - 4 870 - 1 836 Balance commerciale Services Balance - 182 - 46 - 236 - 154 - 372 - 1 104 544 - 4 500 - 29 Balance des services Net Income - 4 418 - 3 543 - 4 503 - 4 270 - 4 512 - 4 531 - 4 315 287 - 591 Revenus nets Current transfers, net total 1 368 1 436 2 469 3 437 5 086 6 785 7 103 4 319 3 895 Transferts courants Current account balance 1 244 2 288 1 633 7 994 11 317 11 710 6 314 - 4 764 1 439 Solde du compte courant VII-4 External Debt and Financial Flows VII-4 Dette extérieure et flux financiers US $(Millions) $ E.U(Millions) Total external debt 1 223 1 276 1 192 1 413 1 411 1 257 1 146 2 381 2 708 Dette extérieure totale Private 876 742 698 949 1 014 901 829 2 102 944 Privée Public 347 534 494 465 397 355 317 278 1 763 Publique Total external debt service 550 482 671 649 911 982 413 449 467 Service de la dette extérieure Net Foreign Direct Investment Investissements étranger direct (flux 403 418 391 279 486 495 521 234 ... Inflows nets entrants) Net Total Official Development Aide publique au développement 37 28 50 48 69 108 720 280 ... assistance (nette totale) African Statistical Yearbook 2011 / Annuaire Statistique pour l'Afrique 2011
  • 100.
    Botswana Botswana 2002 2003 2004 2005 2006 2007 2008 2009 2010 US $(Millions) Botswana Pula Exports, fob Exportations, fàb Exports - Total 2 346 3 024 3 696 4 444 4 521 5 025 4 707 ... ... Exportations - Total Main Products Principaux produits Diamonds 2 090 2 158 2 650 3 300 3 329 3 265 3 045 ... ... Diamants Copper Nickel Matte 112 270 336 454 678 1 103 868 ... ... Nickel de Cuivre Mat Textiles 45 50 120 219 157 356 266 ... ... Textiles Meat & Meat Products 44 58 51 74 82 113 89 ... ... Viande et Produits de Viande Vehicle & Parts 84 100 121 112 31 23 34 ... ... Véhicule et Parties Main Destinations Principales destinations United Kingdom 1 419.2 1 665.4 2 293.2 2 899.0 2 186.6 1 069.8 448.0 355.0 ... Royaume-Uni Norway 76.3 161.5 182.5 329.6 391.2 541.0 607.7 284.6 ... Norvège Zimbabwe 47.2 ... 88.9 104.6 212.1 409.0 214.8 198.6 ... Zimbabwe United States 30.2 14.2 74.2 179.7 253.6 188.8 219.7 132.7 ... États-Unis South Africa 0.0 4.0 0.3 302.6 265.3 218.6 182.7 104.1 ... Afrique du Sud 2002 2003 2004 2005 2006 2007 2008 2009 2010 Imports, cif Importations, cif Imports - Total 299 291 446 464 648 803 897 956 691 Importations - Total (millions) 99 Principaux produits Main Products Diamonds non-industrial unworked Diamants non-industriels bruts ou 2 5 1 19 55 108 143 90 ... or simply sawn, cleaved or bruted simplement sciés, clivés ou débrutés Diesel powered trucks with a GVW Diesel chariots de manutention d'un 1 0 1 1 1 13 58 1 ... not exceeding five tonnes PTAC n'excédant pas cinq tonnes Cotton yarn >85% multiple combed Fils de coton> 85% coton peigné 1 ... 1 0 1 1 47 0 ... <83.33 dtex,not ret. multiples <83,33 dtex, non ret Cuirs et peaux de chèvre ou de Goat or kid skin leather, nes ... ... 0 ... ... ... 31 31 ... chevreau, nda Medicaments nes, in dosage 4 5 17 14 11 21 19 14 ... Médicaments nda, en dosage Main Origin Principales provenances Zimbabwe 68.0 ... 48.3 29.6 290.4 201.0 157.0 36.9 ... Zimbabwe China 19.0 22.8 49.5 58.5 61.8 119.9 169.2 165.4 ... Chine United States 31.7 25.9 54.0 67.3 26.9 53.9 62.2 93.3 ... États-Unis Sweden 37.1 59.6 76.3 73.4 8.2 16.6 13.9 15.7 ... États-Unis United Kingdom 25.3 21.6 28.8 28.4 25.7 40.9 28.3 18.1 ... Royaume-Uni African Statistical Yearbook 2011 / Annuaire Statistique pour l'Afrique 2011
  • 101.
    Burkina Faso Burkina Faso AREA (KM 2) 274 000 SUPERFICIE (KM 2) CAPITAL CITY Ouagadougou Ouagadougou CAPITALE CURRENCY CFA Franc Franc CFA MONNAIE I SOCIAL AND DEMOGRAPHIC INDICATORS — INDICATEURS DEMOGRAPHIQUES ET SOCIAUX 2002 2003 2004 2005 2006 2007 2008 2009 2010 Population Population Population au milieu de l'année - Mid-year population - Total (Million) 12.2 12.6 13.0 13.4 14.0 14.3 14.7 15.2 15.7 Total (million) Population au milieu de l'année - Mid-year population - Urban (%) 15.5 15.5 15.5 15.5 22.7 22.7 22.7 22.7 ... Urbaine (%) Female (%) 51.7 51.7 51.7 51.7 51.7 51.7 51.7 51.7 ... Femme (%) Population by Age Group Population par groupe d'âge 0-14 5852 860 6018 863 6189 918 6366 188 6499 211 6799 311 7051 619 7304 574 7556 226 0-14 15-64 5610 729 5769 652 5933 432 6102 218 6969 953 6990 825 7216 477 7451 832 7695 681 15-64 65+ 721 271 778 165 839 400 905 264 473 611 461 876 463 071 468 374 479 070 65+ Active Population (000) 5 508.0 5 716.0 5 935.0 6 162.0 6 396.0 6 645.0 6 897.0 7 157.0 ... Population active (000) Female (%) 47.2 47.2 47.1 47.0 47.0 47.0 47.0 47.1 ... Femme (%) Taux brut de natalité - Total (par Crude birth rate - Total (per 1000) 46.1 46.1 46.1 46.1 46.1 46.0 46.0 46.0 ... 1000) Taux brut de mortalité - Total (par Crude death rate - Total (per 1000) 14.8 14.8 14.8 14.8 11.8 11.8 11.8 11.8 ... 1000) Life expectancy at birth - Total Espérance de vie à la naissance - 53.8 53.8 53.8 53.8 56.7 56.7 56.7 56.7 ... (years) Total (années) Net reproduction rate - (per Taux net de reproduction - (par ... ... ... 2.2 ... ... ... ... ... woman) femme) Indice synthétique de fécondité - Total fertility rate - (p woman) y (per ) 6.8 6.2 6.2 6.2 6.2 6.2 5.9 5.8 ... (par femme) Education Enseignement Teaching staff at first level - Total Personnel enseignant - 1er degré - 20.68 22.7 23.9 26.9 30.3 32.8 35.6 39.0 42.8 (thousands) Total (milliers) Teaching staff at second level - Total Personnel enseignant - 2ème degré - 100 7.07 7.6 5.2 4.6 5.2 5.9 6.7 7.3 8.3 (thousands) Total (milliers) Teaching staff at third level - Total Personnel enseignant - 3ème degré - ... ... ... 0.6 0.5 0.6 0.7 0.7 ... (thousands) Total (milliers) First level student enrollment - Total Elèves inscrits - 1er degré - Total 938 1 012 1 139 1 270 1 390 1 561 1 742 1 906 2 047 (thousands) (milliers) First level student enrollment - Elèves inscrits - 1er degré - Femmes 392 426 492 555 614 699 794 879 957 Female (thousands) (milliers) Second level student enrollment - Elèves inscrits - 2ème degré - Total 213 238 266 295 320 352 424 468 ... Total (thousands) (milliers) Second level student enrollment - Elèves inscrits - 2ème degré - 84 96 107 120 132 146 177 196 ... Female (thousands) Femmes (milliers) Third level student enrollment - Total Elèves inscrits - 3ème degré - Total 15.5 18.2 18.9 27.9 30.5 33.5 41.8 ... ... (thousands) (milliers) Third level student enrollment - Elèves inscrits - 3ème degré - 3.9 4.1 4.2 8.6 9.4 10.3 13.6 ... ... Female (thousands) Femmes (milliers) Public expenditure on education (% Dépenses publiques consacrées à 14.5 15.2 15.9 16.6 17.4 18.2 19.1 20.0 ... of budget) l'enseignement (% du budget) Health Santé Hospital beds - Total (per 10 000 Nombre de lits d'hôpitaux - Total 31 31 31 29 ... ... ... ... ... population) (pour 10 000) Nurses - Total (per 10 000 Nombre d'infirmières - Total (pour ... ... ... ... ... ... ... ... ... population) 10 000) Physicians - Total (per 10 000 Nombre de médecins - Total (pour 4 3 3 3 2 ... ... ... ... population) 10 000) Public expenditure on Health (% of Dépenses publiques consacrées à la 7 7 7 12 8 ... 8 ... ... budget) santé (% du budget) African Statistical Yearbook 2011 / Annuaire Statistique pour l'Afrique 2011
  • 102.
    Burkina Faso Burkina Faso II NATIONAL ACCOUNTS — COMPTES NATIONAUX 2002 2003 2004 2005 2006 2007 2008 2009 2010 Gross domestic product by kind of economic activity at current prices Produit intérieur brut par branche d'activité économique aux prix courants CFA Franc(Billions) Franc CFA (Milliards) Agriculture 799 840 808 1 017 1 033 971 1 170 1 230 ... Agriculture Mining and quarrying 8 12 13 14 11 15 66 100 ... Industries extractives Manufacturing 230 323 337 305 322 328 417 425 ... Industries manufacturières Electricity, gas & water 28 32 32 32 25 35 46 48 ... Electricité, gaz et eau Construction 97 113 113 118 140 179 238 260 ... Bâtiments et travaux publics Wholesale & retail trade, Commerce de gros et de détail, 313 349 399 434 325 359 405 405 ... restaurants, hotels restaurants et hôtels Banques, assurances, affaires Finance, insurance, real estate, etc. 40 39 39 54 44 46 50 53 ... immobilières Transport and communications 105 98 111 118 133 172 158 188 ... Transport(s) et communications Administrations publiques et Public administration and defense 421 426 452 486 631 723 582 601 ... défense Other services 58 61 64 67 164 172 230 225 ... Autres services Moins Services d’intermédiation Less Imputed Service Charges - 27 - 27 - 27 - 38 - 44 - 48 - 38 - 40 ... financière Gross domestic product at factor Produit intérieur brut aux couts des 2 074 2 266 2 341 2 606 2 784 2 953 3 325 3 495 ... cost / basic prices facteurs / prix de base Plus: Indirect Taxes / taxes on Plus taxes indirectes/impôts sur les 161 179 215 276 257 285 335 346 ... products, less subsidies produits, moins les subventions Expenditure on Gross domestic product at current purchaser's values Emploi du produit intérieur brut aux prix courants d'acquisition CFA Franc(Billions) Franc CFA (Milliards) Consommation finale des Government final consumption 473 486 531 570 659 774 748 778 ... administrations publiques Private final consumption 1 649 1 763 1 841 2 080 2 172 2 214 2 687 2 764 ... Consommation finale privée Gross fixed capital formation 378 444 497 567 584 688 728 824 ... Formation brute de capital fixe Increase in inventories 13 76 57 127 50 27 114 50 ... Variation des stocks Exports of goods and services 205 213 290 281 347 342 336 434 ... Exportations de biens et services Moins importations de biens et 101 Less imports of goods and services 485 538 660 743 772 807 953 1 010 ... services GDP at purchasers' values 2 234 2 444 2 556 2 881 3 041 3 238 3 660 3 840 ... PIB aux prix d'acquisition Gross domestic product by kind of economic activity at constant Produit intérieur brut par branche d'activité economique aux prix constants prices Annual Growth Rates (%) Taux de croissance annuel (%) Agriculture 0.3 6.9 -3.5 10.2 3.5 -3.7 -2.1 1.9 ... Agriculture Mining and quarrying 16.2 40.5 8.1 5.8 -15.7 30.2 393.7 40.0 ... Industries extractives Manufacturing 5.2 26.6 1.9 2.2 2.5 8.7 10.6 0.4 ... Industries manufacturières Electricity, gas & water -1.4 34.5 4.5 0.3 3.7 1.3 20.6 3.1 ... Electricité, gaz et eau Construction -2.2 -2.6 1.2 3.9 17.2 7.3 -9.6 4.8 ... Bâtiments et travaux publics Wholesale & retail trade, Commerce de gros et de 5.2 11.5 11.1 7.8 -31.1 10.5 -17.1 1.4 ... restaurants, hotels détail,restaurants et hôtels Banques, assurances, affaires Finance, insurance, real estate, etc. 30.2 1.0 1.5 40.5 6.7 3.4 -35.0 -1.2 ... immobilières Transport and communications 25.4 -3.4 24.3 3.7 12.1 26.9 -12.0 14.1 ... Transport(s) et communications Administrations publiques et Public administartion and defense 5.7 -0.3 6.3 8.5 27.1 4.0 13.0 1.1 ... défense Other services ... Autres services Moins Services d’intérmediation Less Imputed Service Charges 14.9 0.8 0.8 39.8 12.4 10.0 -27.8 -1.2 ... financière Gross domestic product at factor Produit intérieur brut aux couts des 3.9 7.8 3.5 7.5 8.2 3.7 2.8 3.3 ... cost / basic prices facteurs / prix de base Plus: Indirect Taxes / taxes on Plus taxes indirectes/impôts sur les 10.8 8.5 17.7 22.7 -13.2 9.1 0.1 0.3 ... products, less subsidies produits, moins les subventions Gross domestic product at market Produit intérieur brut aux prix du 4.4 7.8 4.5 8.7 6.3 4.1 2.6 3.1 ... prices marché 2008: semi-final 2009: Provisional 2008: semi-définitif 2009: provisoire African Statistical Yearbook 2011 / Annuaire Statistique pour l'Afrique 2011
  • 103.
    Burkina Faso Burkina Faso Expenditure on Gross domestic product at constant purchasers' Emplois du produit intérieur brut aux prix constants d'acquisition values Annual Growth Rates (%) Taux de croissance annuel (%) Consommation finale des Government final consumption 6.1 2.6 8.4 8.6 13.2 6.2 -0.5 2.1 ... administrations publiques Private final consumption 4.3 8.1 4.3 6.9 2.6 1.8 4.5 0.8 ... Consommation finale privée Gross fixed capital formation 1.8 14.9 11.2 16.0 2.1 9.0 6.7 -4.8 ... Formation brute de capital fixe Exports of goods and services -2.7 -0.5 26.3 2.5 25.0 5.3 15.7 27.2 ... Exportations de biens et services Moins importations de biens et Less imports of goods and services -0.3 10.0 20.2 9.8 1.5 3.4 4.0 2.8 ... services III INFLATION 2002 2003 2004 2005 2006 2007 2008 2009 2010 Annual Growth Rates (%) Taux de croissance annuel (%) All Item 2.3 2.0 -0.4 6.4 2.3 -0.2 10.7 2.6 1.2 Ensemble Food 3.1 -2.0 -4.9 15.5 -0.3 -1.3 23.4 2.5 6.7 Alimentation Health 1.2 9.0 0.8 1.0 2.3 0.1 1.7 0.6 0.0 Santé Energy 6.4 5.2 4.5 9.2 9.8 -4.7 9.2 -1.0 -0.3 Energie Transport 2.9 2.4 3.8 9.7 6.0 -1.9 5.7 -1.7 2.8 Transport IV AGRICULTURAL PRODUCTION - PRODUCTION AGRICOLE 2002 2003 2004 2005 2006 2007 2008 2009 2010 Tons (Thousand) Tonnes (milliers) Sorghum, Tons (thousands) 1 373 1 610 1 134 1 553 1 516 1 507 1 875 1 521 ... Sorgho, tonnes (milliers) Millet, Tons (thousands) 995 1 184 938 1 196 1 175 966 1 255 971 ... Millet, tonnes (milliers) Maize, Tons (thousands) 653 666 481 799 867 534 1 014 895 ... Maïs, tonnes (milliers) Cotton lint, Tons (thousands) 439 472 535 713 760 377 721 484 ... Fibres de coton, tonnes (milliers) Cow pea, Tons (thousands) 330 457 276 445 436 253 538 454 ... Niébé, tonnes (milliers) V MINING PRODUCTION - PRODUCTION MINIERE 102 2002 2003 2004 2005 2006 2007 2008 2009 2010 Gold ores and concentrates Minerais d'or et concentrés 189.0 246.0 230.0 190.0 225.0 753.0 5 500.0 6 293.0 ... (Kilograms) (Kilogrammes) Natural phosphates, P205 content, 2.0 1.0 1.0 1.0 2.0 2.0 ... ... ... Phosphates, naturels, teneur en metric tons (thousands) P205 tonnes métriques (milliers) Abrasives, natural, metric tons Abrasifs naturels, tonnes métriques, 10.0 10.0 10.0 10.0 ... ... ... ... ... (thousands) (milliers) VI ENERGY - ENERGIE 2002 2003 2004 2005 2006 2007 2008 2009 2010 Electricity - total hydro production, Électricité - production hydraulique 364.7 440.2 473.2 516.2 548.4 612.7 619.4 ... ... kilowatt hours (millions) totale, kilowatt-heures (millions) Electricity - total thermal production, Électricité - production thermique 17.5 21.8 21.4 19.5 14.7 18.2 21.9 ... ... kilowatt hours (millions) totale, kilowatt-heures (millions) Electricity - total production, self- Electricité - Production totale privée 83 78 79 81 85 82 78 ... ... producer (Million Kilowatt Hours) (million de kilowatt heures) Electricity - total production, public Electricité - Production totale 365 445 473 516 548 612 ... ... ... (Million Kilowatt Hours) publique (million de kilowatt heures) African Statistical Yearbook 2011 / Annuaire Statistique pour l'Afrique 2011
  • 104.
    Burkina Faso Burkina Faso VII TOURISM AND INFRASTRUCTURE - TOURISME ET INFRASTUCTURE 2002 2003 2004 2005 2006 2007 2008 2009 2010 Arrivals - Tourists (thousands) 198.376 216.653 290.005 324.342 358.683 374.265 375.564 401.308 ... Arrivées - touristes (milliers) Rooms in hotels and similar Chambres d'hotels et établissements establishments (thousands) ... ... ... ... ... 5.771 ... ... ... assimilés (milliers) Paved Road (% of total) 15 15 15 15 15 15 ... ... ... Routes asphaltées (% du total) Total Network (Railways-km) ... ... ... ... ... ... ... ... ... Réseau total voies ferrées-Km Main Telephone Lines (per 1,000 Lignes téléphoniques fixes (pour 5 5 6 7 7 8 9 10 ... inhabitants) 1000 habitants) Mobile Cellular Subscribers (per Abonnés aux téléphones mobiles 9 19 30 46 71 109 168 ... ... 1,000 inhabitants) (pour 1000 habitants) VII FINANCIAL AND MONETARY STATISTICS - FINANCES ET STATISTIQUES MONETAIRES 2002 2003 2004 2005 2006 2007 2008 2009 2010 VII-1 Monetary Statistics VII-1 Statistiques monétaires CFA Franc(Billions) Franc CFA (Milliards) Money supply (M1) 244 452 378 352 367 468 503 615 645 Masse monétaire (M1) Quasi-money 153 185 206 204 250 295 354 433 575 Quasi-monnaie of which Demand Deposit ... ... ... ... ... ... ... ... ... dont Monnaie scripturale Net foreign assets 163 344 292 178 237 423 382 575 609 Avoirs extérieurs nets Domestic credit 276 333 345 441 466 403 552 584 674 Crédit intérieur of which claims on private sector 294 340 381 473 540 546 662 671 733 dont créances sur le secteur privé of which Claims on government dont créances nettes sur le - 19 - 8 - 37 - 33 - 75 - 143 - 112 - 88 - 60 sector, net gouvernement International reserves (millions of US Réserves internationales (millions de 313 752 669 438 555 1 029 928 1 296 1 019 $) $ EU) Average Exchange Rate (National Taux de change (moyen) (monnaie 696.99 581.20 528.29 527.47 522.89 479.27 447.81 472.19 495.28 Currency per us $) nationale par dollars) VII-2 Public Finance VII-2 Finances publiques CFA Franc(Billions) Franc CFA (Milliards) Total Revenues and Grants 394 435 462 497 562 651 631 733 921 Recettes totales et dons Tax Revenue 241 270 318 337 362 405 445 460 ... Recettes fiscales Non Tax Revenue 19 31 26 28 29 35 39 38 ... Recettes non fiscales Grants 135 133 117 132 170 210 147 235 ... Dons 103 Total Expenditures and Net Lending 503 509 577 642 738 835 792 985 1 122 Dépenses totales et prêts nets Current expenditure 254 257 284 332 387 450 455 504 ... Dépenses courantes Of which Wages and Salaries 103 113 119 141 160 188 199 229 ... Dont rémunérations et salaires Capital expenditure 252 229 298 323 366 383 325 484 ... Dépenses d'équipement Net Lending - 3 24 - 5 - 13 - 15 1 12 - 3 ... Prêts nets Fiscal Balance - 109 - 74 - 115 - 145 - 177 - 184 - 161 - 252 - 201 Solde global y compris les dons VII-3 Balance of Payments VII-3 Balance des paiements CFA Franc(Billions) Franc CFA (Milliards) Trade balance - 211 - 212 - 245 - 294 - 254 - 287 - 401 - 437 ... Balance commerciale Services Balance - 73 - 109 - 121 - 154 - 167 - 174 - 212 - 184 ... Balance des services Net Income - 15 - 15 - 16 - 11 - 1 - 1 - 2 - 7 ... Revenus nets Current transfers, net total 90 122 101 124 133 193 183 211 ... Transferts courants Current account balance - 208 - 213 - 281 - 335 - 289 - 268 - 431 - 416 ... Solde du compte courant VII-4 External Debt and Financial Flows VII-4 Dette extérieure et flux financiers US $(Millions) $ E.U(Millions) Total external debt 1 677 1 789 2 106 2 115 1 216 1 337 1 633 1 931 2 464 Dette extérieure totale Private 1 11 0 0 0 0 0 0 0 Privée Public 1 676 1 778 2 106 2 115 1 216 1 337 1 633 1 931 2 464 Publique Total external debt service 33 49 46 45 41 19 49 48 67 Service de la dette extérieure Net Foreign Direct Investment Investissements étranger direct (flux 15 29 14 34 34 344 137 171 ... Inflows nets entrants) Net Total Official Development Aide publique au développement 440 528 642 693 874 951 1 001 1 084 ... assistance (nette totale) African Statistical Yearbook 2011 / Annuaire Statistique pour l'Afrique 2011
  • 105.
    Burkina Faso Burkina Faso 2002 2003 2004 2005 2006 2007 2008 2009 2010 CFA Franc(Millions) Franc CFA Exports, fob Exportations, fàb Exports - Total 170 791 186 271 257 154 246 470 307 638 298 542 310 407 382 950 ... Exportations - Total Main Products Principaux produits Cotton, not carded, or combed 72 191 131 732 159 903 121 876 161 418 144 633 87 902 108 094 ... coton, non cardé ni peigné Gold (including Gold Platinum), , or (y compris l'or platine), sous 832 1 336 1 519 1 621 4 676 4 615 55 643 136 571 ... unwrought formes brutes ou mi Other seeds and fruits oleaginous, Autres graines et fruits oleagineux, 9 648 4 580 6 221 9 144 14 021 28 656 18 428 21 616 ... even crush meme concasses Live bovine 3 658 2 430 2 424 2 319 2 430 1 233 8 074 5 386 ... Animaux vivants de l'espèce bovine Cigars (including those has ends Cigares (y compris ceux a bouts 1 639 8 722 5 858 3 332 3 773 4 703 4 291 2 540 ... cups(cuttings)) coupes) Main Destinations Principales destinations Switzerland 12 106.1 7 419.8 20 479.3 47 046.0 57 694.8 60 901.1 86 795.5 114 605.9 ... Suisse France 54 518.9 8 506.7 14 692.4 34 230.1 39 367.7 32 219.3 19 259.4 41 860.0 ... France Belgium, Luxembourg 4 669.6 935.8 188.1 15 398.6 19 911.6 25 673.7 8 605.4 18 799.4 ... Belgique, Luxembourg Singapore 6 369.6 21.6 502.9 12 946.1 11 693.6 15 985.0 23 789.7 19 576.4 ... Singapour Ivory Coast 8 609.2 3 618.2 18 132.5 7 681.6 8 151.5 9 203.3 13 467.2 5 619.3 ... Côte d'Ivoire 2002 2003 2004 2005 2006 2007 2008 2009 2010 Imports, cif Importations, cif 104 Imports - Total 453 622 481 927 591 353 656 149 689 455 717 780 873 042 ... ... Importations - Total (millions) Principaux produits Main Products Petroleum oils&oils obtained from Huiles et préparations de pétrole ou 67 908 76 568 93 942 106 592 144 217 150 687 188 092 144 816 ... bituminous minerals minéraux bitumin Rice 26 426 18 612 22 698 33 663 37 807 33 096 40 889 20 956 ... Riz Medicaments (excluding goods n° Medicaments (a l'exclusion des 18 662 16 225 18 930 21 311 23 182 28 093 40 127 31 572 ... 3002) produits des n° 3002, Hydroliques cement (including Ciments hydroliques (y compris les 17 212 17 970 21 451 24 018 23 812 27 443 30 977 23 409 ... cement not pulver ciments non pulver Voitures de tourisme et autres Motor cars and other vehicles 14 429 16 361 13 887 18 255 20 921 22 729 28 584 23 444 ... vehicules automobiles Main Origin Principales provenances Ivory Coast 79 951.3 39 912.6 85 190.3 103 518.5 136 245.8 126 903.0 131 181.1 94 399.8 ... Côte-d'Ivoire France 89 823.7 97 759.9 112 887.0 107 617.0 117 581.6 116 096.4 122 388.4 89 108.9 ... France China 17 178.2 12 039.1 21 158.5 24 878.4 31 594.6 62 687.2 89 544.0 67 008.5 ... Chine United States of America 12 922.1 9 136.5 11 449.0 26 860.1 25 259.2 49 618.8 59 830.4 50 194.0 ... Etats-Unis India 9 719.0 10 630.2 9 094.2 20 259.5 31 107.6 49 459.2 50 011.7 30 178.8 ... Inde African Statistical Yearbook 2011 / Annuaire Statistique pour l'Afrique 2011
  • 106.
    Burundi Burundi AREA (KM 2) 27 834 SUPERFICIE (KM 2) CAPITAL CITY Bujumbura Bujumbura CAPITALE CURRENCY Burundi Franc Franc Burundais MONNAIE I SOCIAL AND DEMOGRAPHIC INDICATORS — INDICATEURS DEMOGRAPHIQUES ET SOCIAUX 2002 2003 2004 2005 2006 2007 2008 2009 2010 Population Population Population au milieu de l'année - Mid-year population - Total (Million) 7.0 7.2 7.4 7.6 7.8 7.9 8.1 8.2 8.4 Total (million) Population au milieu de l'année - Mid-year population - Urban (%) 8.7 8.9 9.2 9.5 9.7 10.0 10.1 10.5 10.7 Urbaine (%) Female (%) 51.4 51.4 51.2 51.1 50.9 51.0 50.8 50.8 50.8 Femme (%) Population by Age Group Population par groupe d'âge 0-14 3164 000 3213 000 3262 000 3311 000 3361 000 3412 000 3635 000 3720 000 3808 000 0-14 15-64 3611 000 3736 000 3921 096 4113 605 4308 916 4506 988 4292 000 4884 131 ... 15-64 65+ 254 000 262 000 202 639 207 862 213 536 219 696 284 000 232 660 ... 65+ Active Population (000) 3 258.0 3 380.0 3 510.0 3 643.0 3 777.0 3 917.0 4 044.0 4 191.0 ... Population active (000) Female (%) 52.5 52.3 52.2 37.7 51.9 51.7 51.6 51.5 ... Femme (%) Taux brut de natalité - Total (par Crude birth rate - Total (per 1000) 42.4 42.4 42.3 42.3 42.2 42.2 42.2 42.2 42.2 1000) Taux brut de mortalité - Total (par Crude death rate - Total (per 1000) 15.5 15.5 15.4 15.4 15.3 15.3 16.2 16.2 16.2 1000) Life expectancy at birth - Total Espérance de vie à la naissance - 47.6 46.3 46.1 44.8 44.6 44.6 49.3 49.3 49.3 (years) Total (années) Net reproduction rate - (per Taux net de reproduction - (par 2.3 2.3 2.3 2.4 2.4 2.4 2.4 2.4 2.4 woman) femme) Indice synthétique de fécondité - Total fertility rate - (p woman) y (per ) 6.3 6.3 6.3 6.3 6.3 6.3 6.0 6.0 6.0 (par femme) Education Enseignement Teaching staff at first level - Total Personnel enseignant - 1er degré - 17.30 18.4 20.7 23.8 27.1 29.5 33.1 36.6 ... (thousands) Total (milliers) Teaching staff at second level - Total Personnel enseignant - 2ème degré - 4.50 4.6 5.2 5.1 5.7 6.3 7.5 16.8 ... (thousands) Total (milliers) 105 Teaching staff at third level - Total Personnel enseignant - 3ème degré - 0.4 0.4 0.3 0.3 0.4 0.4 0.3 1.8 ... (thousands) Total (milliers) First level student enrollment - Total Elèves inscrits - 1er degré - Total 880 953 1 023 1 309 1 474 1 586 1 720 1 850 ... (thousands) (milliers) First level student enrollment - Elèves inscrits - 1er degré - Femmes 392 432 471 623 709 772 845 919 ... Female (thousands) (milliers) Second level student enrollment - Elèves inscrits - 2ème degré - Total 115 139 153 172 196 220 259 352 ... Total (thousands) (milliers) Second level student enrollment - Elèves inscrits - 2ème degré - 48 58 62 70 79 88 101 ... ... Female (thousands) Femmes (milliers) Third level student enrollment - Total Elèves inscrits - 3ème degré - Total 9.5 10.7 10.2 10.5 10.2 10.1 114.0 29.3 ... (thousands) (milliers) Third level student enrollment - Elèves inscrits - 3ème degré - 3.2 3.8 4.4 4.7 5.5 ... ... ... ... Female (thousands) Femmes (milliers) Public expenditure on education (% Dépenses publiques consacrées à 13.3 15.4 14.9 12.4 13.7 17.2 22.1 22.1 ... of budget) l'enseignement (% du budget) Health Santé Hospital beds - Total (per 10 000 Nombre de lits d'hôpitaux - Total 64 3 3 2 7 6 ... ... ... population) (pour 10 000) Nurses - Total (per 10 000 Nombre d'infirmières - Total (pour 6 7 ... ... 70 ... ... ... ... population) 10 000) Physicians - Total (per 10 000 Nombre de médecins - Total (pour 1 1 1 1 1 1 ... ... ... population) 10 000) Public expenditure on Health (% of Dépenses publiques consacrées à la 2 3 5 5 6 6 7 8 ... budget) santé (% du budget) African Statistical Yearbook 2011 / Annuaire Statistique pour l'Afrique 2011
  • 107.
    Burundi Burundi II NATIONAL ACCOUNTS — COMPTES NATIONAUX 2002 2003 2004 2005 2006 2007 2008 2009 2010 Gross domestic product by kind of economic activity at current prices Produit intérieur brut par branche d'activité économique aux prix courants Burundi Franc (Billions) Franc Burundais(Milliards) Agriculture ... ... ... 501 539 566 583 646 ... Agriculture Mining and quarrying ... ... ... 10 6 6 6 7 ... Industries extractives Manufacturing ... ... ... 120 117 126 127 139 ... Industries manufacturières Electricity, gas & water ... ... ... 11 8 9 9 9 ... Electricité, gaz et eau Construction ... ... ... 40 40 19 47 51 ... Bâtiments et travaux publics Wholesale & retail trade, Commerce de gros et de détail, ... ... ... 110 123 141 144 160 ... restaurants, hotels restaurants et hôtels Banques, assurances, affaires Finance, insurance, real estate, etc. ... ... ... 175 192 221 218 225 ... immobilières Transport and communications ... ... ... 28 29 33 34 37 ... Transport(s) et communications Administrations publiques et Public administration and defense ... ... ... 89 105 116 114 123 ... défense Other services ... ... ... 16 19 22 23 25 ... Autres services Moins Services d’intermédiation Less Imputed Service Charges ... ... ... - 38 - 35 - 40 - 38 - 46 ... financière Gross domestic product at factor Produit intérieur brut aux couts des ... ... ... 1 062 1 143 1 219 1 266 1 375 ... cost / basic prices facteurs / prix de base Plus: Indirect Taxes / taxes on Plus taxes indirectes/impôts sur les ... ... ... 99 109 170 207 163 ... products, less subsidies produits, moins les subventions Expenditure on Gross domestic product at current purchaser's values Emploi du produit intérieur brut aux prix courants d'acquisition Burundi Franc( Billions) Franc Burundais(Milliards) Consommation finale des Government final consumption ... ... ... 154 155 156 156 163 ... administrations publiques Private final consumption ... ... ... 1 082 1 249 1 286 1 292 1 361 ... Consommation finale privée Gross fixed capital formation ... ... ... 198 194 198 201 210 ... Formation brute de capital fixe Increase in inventories ... ... ... 1 18 18 18 18 ... Variation des stocks Exports of goods and services ... ... ... 75 96 91 86 71 ... Exportations de biens et services 106 Moins importations de biens et Less imports of goods and services ... ... ... 349 460 360 281 285 ... services GDP at purchasers' values ... ... ... 1 161 1 252 1 389 1 473 1 539 ... PIB aux prix d'acquisition Gross domestic product by kind of economic activity at constant Produit intérieur brut par branche d'activité economique aux prix constants prices Annual Growth Rates (%) Taux de croissance annuel (%) Agriculture ... ... ... ... 1.8 -0.1 4.3 3.5 ... Agriculture Mining and quarrying ... ... ... ... -40.0 7.3 2.3 7.8 ... Industries extractives Manufacturing ... ... ... ... 20.8 7.3 2.3 6.3 ... Industries manufacturières Electricity, gas & water ... ... ... ... -27.3 7.3 2.3 -3.2 ... Electricité, gaz et eau Construction ... ... ... ... -2.5 2.5 5.6 3.5 ... Bâtiments et travaux publics Wholesale & retail trade, Commerce de gros et de ... ... ... ... 1.8 8.4 4.8 3.0 ... restaurants, hotels détail,restaurants et hôtels Banques, assurances, affaires Finance, insurance, real estate, etc. ... ... ... ... 5.7 8.4 4.8 3.3 ... immobilières Transport and communications ... ... ... ... -7.1 8.4 4.8 5.0 ... Transport(s) et communications Administrations publiques et Public administartion and defense ... ... ... ... 23.6 5.3 5.8 3.6 ... défense Other services ... ... ... ... 0.0 8.4 4.8 3.4 ... Autres services Moins Services d’intérmediation Less Imputed Service Charges ... ... ... ... 5.3 8.4 4.8 3.2 ... financière Gross domestic product at factor Produit intérieur brut aux couts des ... ... ... ... 5.2 3.9 4.3 3.8 ... cost / basic prices facteurs / prix de base Plus: Indirect Taxes / taxes on Plus taxes indirectes/impôts sur les ... ... ... ... 8.1 3.8 40.5 -1.6 ... products, less subsidies produits, moins les subventions Gross domestic product at market Produit intérieur brut aux prix du ... ... ... ... 5.4 3.8 7.5 3.2 ... prices marché 2008: semi-final 2009: Estimated 2008: semi-définitif 2009: Estimée African Statistical Yearbook 2011 / Annuaire Statistique pour l'Afrique 2011
  • 108.
    Burundi Burundi Expenditure on Gross domestic product at constant purchasers' Emplois du produit intérieur brut aux prix constants d'acquisition values Annual Growth Rates (%) Taux de croissance annuel (%) Consommation finale des Government final consumption ... ... ... ... 0.0 -0.8 -3.0 3.2 ... administrations publiques Private final consumption ... ... ... ... 13.4 -4.0 5.5 3.2 ... Consommation finale privée Gross fixed capital formation ... ... ... ... -3.5 -10.2 57.7 3.2 ... Formation brute de capital fixe Exports of goods and services ... ... ... ... 10.7 5.2 -24.2 3.2 ... Exportations de biens et services Moins importations de biens et Less imports of goods and services ... ... ... ... 28.9 -25.1 12.6 3.2 ... services III INFLATION 2002 2003 2004 2005 2006 2007 2008 2009 2010 Annual Growth Rates (%) Taux de croissance annuel (%) All Item -8.8 19.8 8.3 13.2 2.7 8.4 24.4 10.5 6.5 Ensemble Food -5.1 12.6 10.6 17.1 0.1 8.8 33.0 10.1 6.9 Alimentation Health 7.5 13.9 8.6 8.7 4.2 8.5 11.2 24.2 0.2 Santé Energy 3.4 3.9 4.5 9.9 8.0 10.8 15.8 11.8 9.9 Energie Transport 1.3 29.6 7.9 8.8 7.0 12.0 25.9 -8.7 2.6 Transport IV AGRICULTURAL PRODUCTION - PRODUCTION AGRICOLE 2002 2003 2004 2005 2006 2007 2008 2009 2010 Tons (Thousand) Tonnes (milliers) Banana, Tons (thousands) 1 603 1 760 1 587 1 616 1 607 1 701 1 760 1 806 ... Banane (000 Tonnes) Sweet Potato, Tons (thousands) 813 808 834 867 837 874 900 484 ... Patate douce (000 Tonnes) Cassava, Tons (thousands) 750 742 710 631 571 559 577 235 ... Manioc (000 Tonnes) Beans, Tons (thousands) 245 230 220 214 209 205 190 203 ... Haricot (000 Tonnes) Maize, Tons (thousands) 127 121 123 123 117 116 118 120 ... Maïs (000 Tonnes) V MINING PRODUCTION - PRODUCTION MINIERE 107 2002 2003 2004 2005 2006 2007 2008 2009 2010 Gold ores and concentrates 483.0 2 855.0 3 229.0 3 905.0 4 312.6 2 422.8 2 170.2 979.6 ... Minerais d'or et concentrés (kg) (Kilograms) Cassiterit (Kilograms) 483.0 8 767.0 18 612.0 8 100.0 78 893.0 50 600.0 96 384.0 20 250.0 ... Cassitérite (kg) Colombo-Tantalit (Kilograms) 72 441.0 23 315.0 24 382.0 42 592.0 16 177.0 51 550.0 116 600.0 44 207.0 ... Colombo-tantalite (kg) VI ENERGY - ENERGIE 2002 2003 2004 2005 2006 2007 2008 2009 2010 Electricity - total hydro production, Électricité - production hydraulique 127.2 104.6 91.6 100.3 93.3 117.5 111.8 ... ... kilowatt hours (millions) totale, kilowatt-heures (millions) Electricity - total thermal production, Électricité - production thermique 0.1 0.1 0.1 0.1 0.1 0.1 0.1 ... ... kilowatt hours (millions) totale, kilowatt-heures (millions) Electricity - total production, self- Electricité - Production totale privée ... ... ... ... ... ... ... ... ... producer (Million Kilowatt Hours) (million de kilowatt heures) Electricity - total production, public Electricité - Production totale 129 105 94 102 95 119 112 ... ... (Million Kilowatt Hours) publique (million de kilowatt heures) African Statistical Yearbook 2011 / Annuaire Statistique pour l'Afrique 2011
  • 109.
    Burundi Burundi VII TOURISM AND INFRASTRUCTURE - TOURISME ET INFRASTUCTURE 2002 2003 2004 2005 2006 2007 2008 2009 2010 Arrivals - Tourists (thousands) 74.4 74.1 133.2 148.4 201.2 ... ... ... ... Arrivées - touristes (milliers) Rooms in hotels and similar Chambres d'hotels et établissements establishments (thousands) assimilés (milliers) 0.64 0.64 0.817 0.689 0.805 ... ... ... ... Paved Road (% of total) 4 4 4 4 4 4 4 4 ... Routes asphaltées (% du total) Total Network (Railways-km) 29 29 29 29 29 29 32 ... ... Réseau total voies ferrées-Km Main Telephone Lines (per 1,000 Lignes téléphoniques fixes (pour 3 3 4 4 5 5 5 ... ... inhabitants) 1000 habitants) Mobile Cellular Subscribers (per Abonnés aux téléphones mobiles 8 9 14 21 30 34 60 ... ... 1,000 inhabitants) (pour 1000 habitants) VII FINANCIAL AND MONETARY STATISTICS - FINANCES ET STATISTIQUES MONETAIRES 2002 2003 2004 2005 2006 2007 2008 2009 2010 VII-1 Monetary Statistics VII-1 Statistiques monétaires Burundi Franc (Billions) Franc Burundais(Milliards) Money supply (M1) 117 144 171 205 252 294 446 510 566 Masse monétaire (M1) Quasi-money 45 58 52 73 90 98 112 128 148 Quasi-monnaie of which Demand Deposit ... ... ... ... ... ... ... ... ... dont Monnaie scripturale Net foreign assets 17 45 37 74 81 138 266 276 194 Avoirs extérieurs nets Domestic credit 202 224 258 282 374 377 451 570 708 Crédit intérieur of which claims on private sector 156 171 175 176 207 217 261 321 412 dont créances sur le secteur privé of which Claims on government dont créances nettes sur le 30 44 75 101 156 152 167 240 282 sector, net gouvernement International reserves (millions of US Réserves internationales (millions de 59 67 66 100 131 176 266 322 331 $) $ EU) Average Exchange Rate (National Taux de change (moyen) (monnaie 930.75 1 082.62 1 100.90 1 081.58 1 028.68 1 081.87 1 185.69 1 230.18 1 230.36 Currency per us $) nationale par dollars) VII-2 Public Finance VII-2 Finances publiques Burundi Franc (Billions) Franc Burundais(Milliards) Total Revenues and Grants 186 201 256 280 288 363 398 417 527 Recettes totales et dons Tax Revenue 96 106 134 159 164 186 237 279 ... Recettes fiscales Non Tax Revenue 16 15 14 18 19 31 23 23 ... Recettes non fiscales 108 Grants 63 65 108 103 105 162 138 107 ... Dons Total Expenditures and Net Lending 236 242 298 299 319 393 439 537 581 Dépenses totales et prêts nets Current expenditure 159 153 178 221 227 344 363 432 ... Dépenses courantes Of which Wages and Salaries 45 53 59 73 90 186 155 180 ... Dont rémunérations et salaires Capital expenditure 66 99 120 78 91 149 77 105 ... Dépenses d'équipement Net Lending 2 2 3 2 4 0 0 0 ... Prêts nets Fiscal Balance - 50 - 42 - 42 - 19 - 31 - 30 - 41 - 121 - 55 Solde global y compris les dons VII-3 Balance of Payments VII-3 Balance des paiements Burundi Franc Franc Burundais Trade balance - 69 - 100 - 107 - 143 - 191 - 222 - 318 - 557 ... Balance commerciale Services Balance - 33 - 41 - 78 - 107 - 173 - 158 - 148 - 156 ... Balance des services Net Income - 11 - 19 - 21 - 19 - 9 - 6 - 5 - 29 ... Revenus nets Current transfers, net total 109 133 170 259 236 261 221 316 ... Transferts courants Current account balance - 4 - 27 - 36 - 10 - 137 - 125 - 251 - 426 ... Solde du compte courant VII-4 External Debt and Financial Flows VII-4 Dette extérieure et flux financiers US $ $ E.U Total external debt 1 174 1 371 1 458 1 245 1 325 1 500 1 568 561 ... Dette extérieure totale Private 0 0 0 0 0 0 0 0 ... Privée Public 1 174 1 371 1 458 1 245 1 325 1 500 1 568 561 ... Publique Total external debt service 20 32 468 393 50 58 61 1 103 ... Service de la dette extérieure Net Foreign Direct Investment Investissements étranger direct (flux 0 5 49 632 33 541 4 545 429 ... Inflows nets entrants) Net Total Official Development Aide publique au développement 148 274 365 515 490 416 541 ... ... assistance (nette totale) African Statistical Yearbook 2011 / Annuaire Statistique pour l'Afrique 2011
  • 110.
    Burundi Burundi 2002 2003 2004 2005 2006 2007 2008 2009 2010 Burundi Franc (Millions) Franc Burundais Exports, fob Exportations, fàb Exports - Total 28 900 40 600 52 700 61 500 60 400 57 300 ... ... ... Exportations - Total Main Products Principaux produits Trade Coffee 15 584 24 838 33 032 46 611 40 372 41 684 47 184 43 677 ... Café marchand Tea 8 182 11 115 11 246 9 565 10 238 9 925 15 531 18 429 ... Thé Granulated sugar 1 698 1 330 3 272 970 466 1 221 1 465 2 211 ... Sucre cristallisé Beers 1 166 1 106 2 067 1 433 604 873 1 822 1 596 ... Bières Cigarettes 405 747 791 870 807 986 1 796 1 774 ... Cigarettes Main Destinations Principales destinations United Kingdom 5 472.1 6 649.8 6 348.3 7 696.9 7 393.3 6 916.9 9 107.7 7 598.5 ... Royaume -Uni Switzerland 5 643.0 12 993.9 15 222.5 22 419.6 20 338.6 19 590.0 23 018.7 20 802.8 ... Suisse Netherlands 1 500.4 1 811.4 371.0 211.6 314.0 322.7 826.8 1 227.0 ... Pays Bas Kenya 5 399.9 34.5 400.2 403.5 1 220.2 233.0 1 767.9 488.3 ... Kenya Rwanda 2 906.5 2 315.7 4 628.4 2 921.6 3 212.0 2 366.7 4 104.3 3 745.3 ... Rwanda 2002 2003 2004 2005 2006 2007 2008 2009 2010 Imports, cif Importations, cif Imports - Total ... ... ... ... ... ... ... ... ... Importations - Total (millions) 109 Principaux produits Main Products Pharmaceutical products 9 340 14 328 18 278 18 546 28 984 27 014 36 539 37 687 ... Produits pharmaceutiques Gas oil 5 804 6 686 11 665 15 084 26 002 28 284 53 941 23 706 ... Gas oil Vehicles 5 557 5 450 8 565 8 667 25 566 15 657 14 858 16 375 ... Voitures automobiles Gasoline Engine 5 972 7 405 10 017 13 075 23 631 25 160 37 545 18 073 ... Essence pour moteur Engins mécaniques et pièces de Mechanical appliances and parts 8 920 10 321 11 788 32 211 18 713 16 876 47 580 33 466 ... rechange Main Origin Principales provenances Kenya 14 613.6 24 368.9 30 275.9 36 824.3 36 463.7 31 835.3 35 881.4 41 701.0 ... Kenya Belgium 19 882.8 25 196.2 26 359.0 35 451.4 51 820.5 48 476.2 61 033.0 56 185.2 ... Belgique France 8 507.5 8 222.4 12 431.1 15 115.5 19 597.8 11 699.8 26 423.6 21 114.6 ... France Tanzania 12 510.6 19 900.1 16 402.1 13 934.8 7 803.0 10 601.9 19 957.7 22 191.9 ... Tanzanie China 5 992.3 7 066.5 6 987.6 12 740.8 19 312.2 15 047.3 28 646.4 41 117.9 ... Chine African Statistical Yearbook 2011 / Annuaire Statistique pour l'Afrique 2011
  • 111.
    Cameroon Cameroun AREA (KM 2) 475 650 SUPERFICIE (KM 2) CAPITAL CITY Yaounde Yaoundé CAPITALE CURRENCY CFA Franc Franc CFA MONNAIE I SOCIAL AND DEMOGRAPHIC INDICATORS — INDICATEURS DEMOGRAPHIQUES ET SOCIAUX 2002 2003 2004 2005 2006 2007 2008 2009 2010 Population Population Population au milieu de l'année - Mid-year population - Total (Million) 16.2 16.6 17.0 17.5 17.8 18.2 18.6 18.9 19.4 Total (million) Population au milieu de l'année - Mid-year population - Urban (%) ... ... ... 48.8 49.4 50.1 50.7 51.4 52.0 Urbaine (%) Female (%) 50.7 50.7 51.0 50.6 50.6 50.6 50.6 50.5 50.5 Femme (%) Population by Age Group Population par groupe d'âge 0-14 6958 430 7120 916 7582 000 7614 232 7777 321 7943 903 8114 053 8287 847 8465 364 0-14 15-64 8673 390 8953 101 8772 000 9255 834 9454 992 9658 424 9866 220 10005 122 10295 330 15-64 65+ 531 780 551 983 646 000 593 770 603 756 613 909 624 234 634 731 645 406 65+ Active Population (000) 6 202.0 6 362.0 6 528.0 6.1 6 880.0 7 006.0 7 205.0 7 410.0 ... Population active (000) Female (%) 41.1 41.1 41.1 43.8 41.2 41.3 41.4 41.6 ... Femme (%) Taux brut de natalité - Total (par Crude birth rate - Total (per 1000) 37.7 37.8 37.8 37.7 37.5 37.2 36.9 36.4 ... 1000) Taux brut de mortalité - Total (par Crude death rate - Total (per 1000) 10.2 8.8 8.3 10.3 ... 10.3 ... ... 10.4 1000) Life expectancy at birth - Total Espérance de vie à la naissance - 59.0 61.3 50.6 61.2 61.2 61.2 51.1 51.4 ... (years) Total (années) Net reproduction rate - (per Taux net de reproduction - (par ... ... ... 1.6 ... ... ... ... ... woman) femme) Indice synthétique de fécondité - Total fertility rate - (p woman) y (per ) 5.1 4.8 5.0 4.8 4.8 4.7 4.6 4.5 ... (par femme) Education Enseignement Teaching staff at first level - Total Personnel enseignant - 1er degré - ... 49.0 ... ... 55.7 72.8 69.5 72.1 ... (thousands) Total (milliers) Teaching staff at second level - Total Personnel enseignant - 2ème degré - 110 ... 38.1 ... ... 34.3 35.1 50.0 60.0 ... (thousands) Total (milliers) Teaching staff at third level - Total Personnel enseignant - 3ème degré - ... ... ... 2.2 2.2 2.2 2.7 3.2 ... (thousands) Total (milliers) First level student enrollment - Total Elèves inscrits - 1er degré - Total 2 742 2 799 2 907 2 950 2 988 3 120 3 201 3 347 ... (thousands) (milliers) First level student enrollment - Elèves inscrits - 1er degré - Femmes 1 259 1 279 1 364 1 347 1 357 1 432 1 469 1 542 ... Female (thousands) (milliers) Second level student enrollment - Elèves inscrits - 2ème degré - Total ... 806 901 918 698 809 1 003 1 264 ... Total (thousands) (milliers) Second level student enrollment - Elèves inscrits - 2ème degré - ... 368 329 344 307 ... 498 ... ... Female (thousands) Femmes (milliers) Third level student enrollment - Total Elèves inscrits - 3ème degré - Total 77.7 81.3 83.9 99.9 120.3 132.1 150.9 174.1 ... (thousands) (milliers) Third level student enrollment - Elèves inscrits - 3ème degré - 30.1 31.5 32.5 39.4 50.2 58.0 66.8 ... ... Female (thousands) Femmes (milliers) Public expenditure on education (% Dépenses publiques consacrées à 14.5 17.3 17.2 15.9 16.8 13.1 15.4 ... ... of budget) l'enseignement (% du budget) Health Santé Hospital beds - Total (per 10 000 Nombre de lits d'hôpitaux - Total 41 42 22 44 ... ... ... ... ... population) (pour 10 000) Nurses - Total (per 10 000 Nombre d'infirmières - Total (pour 41 42 5 44 ... ... ... ... ... population) 10 000) Physicians - Total (per 10 000 Nombre de médecins - Total (pour 7 7 2 18 ... ... ... ... ... population) 10 000) Public expenditure on Health (% of Dépenses publiques consacrées à la 5 4 5 5 7 ... ... ... ... budget) santé (% du budget) African Statistical Yearbook 2011 / Annuaire Statistique pour l'Afrique 2011
  • 112.
    Cameroon Cameroun II NATIONAL ACCOUNTS — COMPTES NATIONAUX 2002 2003 2004 2005 2006 2007 2008 2009 2010 Gross domestic product by kind of economic activity at current prices Produit intérieur brut par branche d'activité économique aux prix courants CFA Franc (Billions) Franc CFA (Milliards) Agriculture 1 551 1 594 1 580 1 666 1 816 2 066 2 257 2 391 ... Agriculture Mining and quarrying 547 499 555 748 966 958 926 807 ... Industries extractives Manufacturing 1 446 1 484 1 489 1 510 1 536 1 340 1 447 1 653 ... Industries manufacturières Electricity, gas & water 46 50 76 78 95 99 102 100 ... Electricité, gaz et eau Construction 204 214 248 253 274 293 315 485 ... Bâtiments et travaux publics Wholesale & retail trade, Commerce de gros et de détail, 1 458 1 579 1 798 1 799 1 852 1 976 2 053 2 059 ... restaurants, hotels restaurants et hôtels Banques, assurances, affaires Finance, insurance, real estate, etc. 447 469 488 529 512 513 609 648 ... immobilières Transport and communications 356 392 391 362 417 470 518 534 ... Transport(s) et communications Administrations publiques et Public administration and defense 348 362 383 351 315 342 458 507 ... défense Other services 654 739 790 851 916 1 011 1 007 1 060 ... Autres services Moins Services d’intermédiation Less Imputed Service Charges - 51 - 52 - 58 - 58 - 59 - 47 - 61 - 60 ... financière Gross domestic product at factor Produit intérieur brut aux couts des 7 005 7 330 7 741 8 088 8 642 9 021 9 633 10 185 ... cost / basic prices facteurs / prix de base Plus: Indirect Taxes / taxes on Plus taxes indirectes/impôts sur les 578 587 593 662 746 772 811 856 ... products, less subsidies produits, moins les subventions Expenditure on Gross domestic product at current purchaser's values Emploi du produit intérieur brut aux prix courants d'acquisition CFA Franc( Billions) Franc CFA (Milliards) Consommation finale des Government final consumption 775 790 847 872 901 993 1 127 1 243 ... administrations publiques Private final consumption 5 367 5 716 5 947 6 298 6 715 7 170 7 840 8 304 ... Consommation finale privée Gross fixed capital formation 1 503 1 431 1 521 1 547 1 565 1 702 1 842 1 965 ... Formation brute de capital fixe Increase in inventories - 2 - 46 55 121 14 - 7 60 80 ... Variation des stocks Exports of goods and services 1 512 1 602 1 617 1 790 2 160 2 343 2 520 1 770 ... Exportations de biens et services Moins importations de biens et 111 Less imports of goods and services 1 571 1 576 1 653 1 879 1 967 2 409 2 946 2 322 ... services GDP at purchasers' values 7 583 7 917 8 334 8 750 9 387 9 792 10 444 11 040 ... PIB aux prix d'acquisition Gross domestic product by kind of economic activity at constant Produit intérieur brut par branche d'activité economique aux prix constants prices Annual Growth Rates (%) Taux de croissance annuel (%) Agriculture 3.7 3.5 4.4 2.7 3.0 5.9 5.2 2.9 ... Agriculture Mining and quarrying -4.3 -4.9 -9.1 -9.4 7.6 -7.7 -1.8 -13.1 ... Industries extractives Manufacturing 3.0 2.4 2.3 2.0 -0.6 0.5 3.5 -1.0 ... Industries manufacturières Electricity, gas & water -4.6 7.2 6.9 2.1 3.3 4.5 5.6 -0.6 ... Electricité, gaz et eau Construction 5.7 4.3 8.4 1.1 4.0 0.5 -8.2 12.5 ... Bâtiments et travaux publics Wholesale & retail trade, Commerce de gros et de 7.4 9.9 7.0 2.7 1.8 2.0 0.3 -0.1 ... restaurants, hotels détail,restaurants et hôtels Banques, assurances, affaires Finance, insurance, real estate, etc. 6.6 5.7 3.8 2.8 0.8 3.7 3.7 5.3 ... immobilières Transport and communications 9.8 2.8 3.1 -10.5 1.7 1.7 1.1 5.4 ... Transport(s) et communications Administrations publiques et Public administartion and defense 5.9 3.1 6.9 0.4 2.9 5.5 4.2 3.8 ... défense Other services 6.5 7.4 9.0 11.5 8.9 11.4 4.6 7.3 ... Autres services Moins Services d’intérmediation Less Imputed Service Charges 3.4 3.0 2.1 3.2 -3.8 -7.0 5.5 -6.0 ... financière Gross domestic product at factor Produit intérieur brut aux couts des 4.2 4.2 3.9 1.7 2.9 3.3 2.6 1.7 ... cost / basic prices facteurs / prix de base Plus: Indirect Taxes / taxes on Plus taxes indirectes/impôts sur les 1.3 1.4 0.7 10.5 7.3 2.9 6.0 4.9 ... products, less subsidies produits, moins les subventions Gross domestic product at market Produit intérieur brut aux prix du 4.0 4.0 3.7 2.3 3.2 3.3 2.9 1.9 ... prices marché 2009: Provisional 2009: provisoire African Statistical Yearbook 2011 / Annuaire Statistique pour l'Afrique 2011
  • 113.
    Cameroon Cameroun Expenditure on Gross domestic product at constant purchasers' Emplois du produit intérieur brut aux prix constants d'acquisition values Annual Growth Rates (%) Taux de croissance annuel (%) Consommation finale des Government final consumption 3.5 3.4 3.9 0.7 3.0 9.1 6.3 4.6 ... administrations publiques Private final consumption 4.3 6.0 3.2 3.1 3.7 4.6 3.2 3.1 ... Consommation finale privée Gross fixed capital formation 4.0 -5.9 11.1 0.5 0.2 11.7 4.6 3.5 ... Formation brute de capital fixe Exports of goods and services -1.8 -0.1 9.0 1.4 1.3 5.3 -3.7 -12.5 ... Exportations de biens et services Moins importations de biens et Less imports of goods and services -7.6 3.6 12.2 1.9 2.3 15.2 4.0 -2.1 ... services III INFLATION 2002 2003 2004 2005 2006 2007 2008 2009 2010 Annual Growth Rates (%) Taux de croissance annuel (%) All Item 2.8 0.6 0.2 1.9 5.0 1.1 5.3 3.0 1.3 Ensemble Food 4.8 -0.7 -1.9 0.8 6.6 1.6 9.1 5.9 1.2 Alimentation Health 1.3 1.0 2.0 0.5 1.9 0.4 0.7 0.0 -0.6 Santé Energy 0.1 7.3 4.8 12.6 15.3 0.5 1.7 -4.2 -0.1 Energie Transport -0.5 1.5 1.6 7.0 8.6 2.3 0.4 -0.7 0.9 Transport IV AGRICULTURAL PRODUCTION - PRODUCTION AGRICOLE 2002 2003 2004 2005 2006 2007 2008 2009 2010 Tons (Thousand) Tonnes (milliers) Cassava, Tons (thousands) 2 004 2 048 2 093 2 394 2 652 2 767 2 883 2 941 ... Manioc, tonnes (milliers) Plantains, Tons (thousands) 1 237 1 275 1 315 2 013 2 175 2 338 2 501 2 550 ... Banane-Plantain, tonnes (milliers) Taro, Tons (thousands) 1 080 1 103 1 128 1 240 1 267 1 398 1 428 1 491 ... Macabo/Taro, tonnes (milliers) Maize, tons (thousands) 861 912 966 1 050 1 249 1 322 1 395 1 662 ... Maïs, tonnes (milliers) Banana, Tons (thousands) 693 743 798 930 970 1 024 1 078 933 ... Banane, tonnes (milliers) V MINING PRODUCTION - PRODUCTION MINIERE 112 2002 2003 2004 2005 2006 2007 2008 2009 2010 Crude petroleum, metric tons Pétrole brut, tonnes métriques 37 400.0 35 600.0 32 700.0 30 100.0 31 800.0 31 200.0 30 700.0 26 700.0 ... (thousands) (milliers) Gold ores and concentrates, 700.0 700.0 600.0 600.0 600.0 600.0 ... ... ... Minerais d'or et concentrés, Kilograms Kilogrammes Marble, travertines, etc., metric tons Marbles, travertins, etc., tonnes 0.3 0.4 ... ... ... ... ... ... ... (thousands) métriques (milliers) VI ENERGY - ENERGIE 2002 2003 2004 2005 2006 2007 2008 2009 2010 Electricity - total hydro production, Électricité - production hydraulique 3 413.1 3 686.4 3 919.7 4 003.8 4 147.0 4 256.0 4 503.0 4 720.0 ... kilowatt hours (millions) totale, kilowatt-heures (millions) Electricity - total thermal production, Électricité - production thermique 96.8 95.7 95.1 94.2 93.9 90.4 94.0 ... ... kilowatt hours (millions) totale, kilowatt-heures (millions) Electricity - total production, self- Electricité - Production totale privée 3 4 5 6 6 10 6 ... ... producer (Million Kilowatt Hours) (million de kilowatt heures) Electricity - total production, public Electricité - Production totale 3 300 3 684 4 110 4 004 4 147 4 256 ... ... ... (Million Kilowatt Hours) publique (million de kilowatt heures) African Statistical Yearbook 2011 / Annuaire Statistique pour l'Afrique 2011
  • 114.
    Cameroon Cameroun VII TOURISM AND INFRASTRUCTURE - TOURISME ET INFRASTUCTURE 2002 2003 2004 2005 2006 2007 2008 2009 2010 Arrivals - Tourists (thousands) 226 ... 190 176 185 327 340 342 ... Arrivées - touristes (milliers) Rooms in hotels and similar Chambres d'hotels et établissements establishments (thousands) ... ... ... 22.112 ... ... 25.672 23.45 ... assimilés (milliers) Paved Road (% of total) ... ... 51 55 58 60 ... ... ... Routes asphaltées (% du total) Total Network (Railways-km) 1 016 1 016 1 016 1 016 982 974 ... ... ... Réseau total voies ferrées-Km Main Telephone Lines (per 1,000 Lignes téléphoniques fixes (pour 7 6 6 7 7 9 13 19 ... inhabitants) 1000 habitants) Mobile Cellular Subscribers (per Abonnés aux téléphones mobiles 43 63 88 125 173 245 340 406 ... 1,000 inhabitants) (pour 1000 habitants) VII FINANCIAL AND MONETARY STATISTICS - FINANCES ET STATISTIQUES MONETAIRES 2002 2003 2004 2005 2006 2007 2008 2009 2010 VII-1 Monetary Statistics VII-1 Statistiques monétaires CFA Franc (Billions) Franc CFA (Milliards) Money supply (M1) 814 771 830 833 936 1 166 1 358 1 451 1 486 Masse monétaire (M1) Quasi-money 528 588 617 685 737 757 828 872 1 006 Quasi-monnaie of which Demand Deposit ... ... ... ... ... ... ... ... ... dont Monnaie scripturale Net foreign assets 211 153 250 415 1 014 1 494 1 726 1 726 1 695 Avoirs extérieurs nets Domestic credit 1 080 1 158 1 157 1 102 781 579 603 719 801 Crédit intérieur of which claims on private sector 676 740 755 832 859 910 1 088 1 188 1 246 dont créances sur le secteur privé of which Claims on government dont créances nettes sur le 308 313 310 187 - 156 - 442 - 617 - 597 - 539 sector, net gouvernement International reserves (millions of US Réserves internationales (millions de 630 640 829 949 1 716 2 907 3 087 3 676 3 516 $) $ EU) Average Exchange Rate (National Taux de change (moyen) (monnaie 696.99 581.20 528.29 527.47 522.89 479.27 447.81 472.19 495.28 Currency per us $) nationale par dollars) VII-2 Public Finance VII-2 Finances publiques CFA Franc (Billions) Franc CFA (Milliards) Total Revenues and Grants 1 383 1 340 1 310 1 594 4 473 1 963 2 215 1 887 1 960 Recettes totales et dons Tax Revenue 1 218 1 166 1 154 1 352 1 635 1 700 1 970 1 640 1 699 Recettes fiscales Non Tax Revenue 138 135 147 195 174 161 153 160 174 Recettes non fiscales Grants 27 40 9 47 2 664 102 92 87 87 Dons 113 Total Expenditures and Net Lending 1 216 1 223 1 159 1 261 1 367 1 537 1 984 1 933 2 001 Dépenses totales et prêts nets Current expenditure 693 742 692 751 798 871 1 073 1 170 1 108 Dépenses courantes Of which Wages and Salaries 390 421 450 414 418 435 561 629 632 Dont rémunérations et salaires Capital expenditure 192 165 187 206 271 389 589 441 502 Dépenses d'équipement Net Lending 17 7 0 0 0 0 0 0 0 Prêts nets Fiscal Balance 167 118 151 333 3 105 426 231 - 46 - 41 Solde global y compris les dons VII-3 Balance of Payments VII-3 Balance des paiements CFA Franc (Billions) Franc CFA (Milliards) Trade balance 106 101 86 198 350 352 206 - 118 177 Balance commerciale Services Balance - 197 - 518 - 434 - 257 - 228 - 189 - 527 - 445 - 442 Balance des services Net Income - 263 - 310 - 274 - 327 - 173 - 239 - 147 - 62 - 42 Revenus nets Current transfers, net total 39 111 81 125 164 213 268 256 396 Transferts courants Current account balance - 315 - 617 - 540 - 261 112 137 - 201 - 369 88 Solde du compte courant VII-4 External Debt and Financial Flows VII-4 Dette extérieure et flux financiers US $ (Millions) $ E.U (Millions) Total external debt 5 447 6 443 3 682 3 652 1 083 990 932 975 ... Dette extérieure totale Private 0 0 123 257 81 44 1 1 ... Privée Public 5 447 6 443 3 559 3 395 1 002 946 932 974 ... Publique Total external debt service 156 165 137 162 136 101 111 97 ... Service de la dette extérieure Net Foreign Direct Investment Investissements étranger direct (flux 419 128 45 129 9 208 188 0 ... Inflows nets entrants) Net Total Official Development Aide publique au développement 657 896 791 413 1 691 1 908 525 0 ... assistance (nette totale) African Statistical Yearbook 2011 / Annuaire Statistique pour l'Afrique 2011
  • 115.
    Cameroon Cameroun 2002 2003 2004 2005 2006 2007 2008 2009 2010 CFA Franc (Millions) Franc CFA Exports, fob Exportations, fàb Exports - Total 1 369 030 1 406 119 1 469 782 1 670 200 1 952 600 2 045 400 2 284 700 1 700 200 ... Exportations - Total Main Products Principaux produits Petroleum oils, crude 573 398 579 317 489 961 661 157 928 046 909 003 1 115 069 681 814 ... Huiles brutes de pétrole Fuel, lubricant 42 840 63 958 109 485 197 041 225 989 313 536 295 836 93 448 ... Carburants et lubrifiants Woods 137 660 156 930 190 801 177 378 183 935 234 087 219 004 99 821 ... Bois sciés Cocoa beans 133 263 104 033 121 367 111 042 115 562 87 954 120 361 255 012 ... Cacao brut en fèves Aluminium, crude 44 513 47 377 45 348 57 827 79 106 78 692 74 301 22 146 ... Aluminium brut Main Destinations Principales destinations Spain 249 628.0 284 633.0 269 039.0 290 491.0 483 152.0 ... ... ... ... Espagne Italy 238 053.0 175 116.0 149 945.0 173 305.0 430 180.0 ... ... ... ... Italie France 161 068.0 139 820.0 184 365.0 186 836.0 197 019.0 ... ... ... ... France Netherlands 160 460.0 138 133.0 111 575.0 112 549.0 118 120.0 ... ... ... ... Pays bas USA 84 987.0 98 044.0 94 669.0 98 871.0 118 651.0 ... ... ... ... USA 2002 2003 2004 2005 2006 2007 2008 2009 2010 Imports, cif Importations, cif 114 Imports - Total 1 262 600 1 305 300 1 383 800 1 524 180 1 648 110 1 773 200 2 096 000 2 012 600 ... Importations - Total (millions) Principaux produits Main Products Hydrocarbons 190 394 223 084 229 436 457 443 526 510 733 523 713 828 369 846 ... Hydrocarbures Cereals 87 984 69 661 89 779 113 117 120 878 124 027 199 087 181 530 ... Céréales Machinery, mechanical 167 199 127 997 121 603 101 003 100 546 172 470 186 964 197 899 ... Machines et app. Mécaniques Vehicles; tractors 112 052 116 567 113 639 102 034 96 318 126 056 143 594 146 442 ... Véhicules automobiles; tracteurs Machinery, electrical 84 269 63 027 113 669 75 313 83 896 95 967 116 863 136 306 ... Machines et appareils électriques Main Origin Principales provenances Nigeria 139 084.0 158 372.0 204 399.0 320 521.0 383 314.0 ... ... ... ... Nigéria France 314 780.0 227 749.0 285 746.0 269 611.0 287 881.0 ... ... ... ... France China 54 197.0 56 932.0 58 332.0 75 796.0 104 151.0 ... ... ... ... Chine USA 108 433.0 59 316.0 67 050.0 70 581.0 47 081.0 ... ... ... ... USA Belgium 51 866.0 49 166.0 62 284.0 56 134.0 66 530.0 ... ... ... ... Belgique African Statistical Yearbook 2011 / Annuaire Statistique pour l'Afrique 2011
  • 116.
    Cape Verde Cap-Vert AREA (KM 2) 4 033 SUPERFICIE (KM 2) CAPITAL CITY Praia Praia CAPITALE CURRENCY Escudo Escudo MONNAIE I SOCIAL AND DEMOGRAPHIC INDICATORS — INDICATEURS DEMOGRAPHIQUES ET SOCIAUX 2002 2003 2004 2005 2006 2007 2008 2009 2010 Population Population Population au milieu de l'année - Mid-year population - Total (Million) 0.5 0.5 0.5 0.5 0.5 0.5 0.5 0.5 0.5 Total (million) Population au milieu de l'année - Mid-year population - Urban (%) 55.0 55.8 56.6 57.4 58.2 58.9 59.7 60.4 61.1 Urbaine (%) Female (%) 52.4 52.4 52.4 52.3 52.3 52.3 52.2 52.2 52.2 Femme (%) Population by Age Group Population par groupe d'âge 0-14 189 772 189 333 188 657 187 780 186 719 185 510 184 234 182 982 181 825 0-14 15-64 244 465 252 087 259 915 267 940 276 143 284 485 292 913 301 353 309 751 15-64 65+ 20 469 21 020 21 456 21 718 21 797 21 722 21 525 21 271 21 006 65+ Active Population (000) 167.8 173.9 180.7 187.2 193.5 200.2 207.0 214.2 221.2 Population active (000) Female (%) 40.5 40.9 41.4 41.8 42.2 42.5 42.9 43.2 43.4 Femme (%) Taux brut de natalité - Total (par Crude birth rate - Total (per 1000) 28.0 27.0 27.0 26.0 25.0 25.0 24.0 24.0 24.0 1000) Taux brut de mortalité - Total (par Crude death rate - Total (per 1000) 6.0 5.0 5.0 5.0 5.0 5.0 5.0 5.0 5.0 1000) Life expectancy at birth - Total Espérance de vie à la naissance - 70.0 70.0 70.0 71.0 71.0 71.0 71.0 72.0 71.0 (years) Total (années) Net reproduction rate - (per Taux net de reproduction - (par ... ... ... 2.0 ... ... ... ... 1.0 woman) femme) Indice synthétique de fécondité - Total fertility rate - (p woman) y (per ) 3.0 3.0 3.0 3.0 3.0 3.0 3.0 3.0 3.0 (par femme) Education Enseignement Teaching staff at first level - Total Personnel enseignant - 1er degré - 3.12 3.1 3.2 3.2 3.2 3.2 3.1 3.1 ... (thousands) Total (milliers) Teaching staff at second level - Total Personnel enseignant - 2ème degré - 1.96 2.1 2.2 2.2 3.2 3.2 3.4 3.3 ... 115 (thousands) Total (milliers) Teaching staff at third level - Total Personnel enseignant - 3ème degré - 0.3 0.3 0.4 0.5 0.5 0.6 0.8 0.9 ... (thousands) Total (milliers) First level student enrollment - Total Elèves inscrits - 1er degré - Total 90 88 85 83 81 79 76 74 ... (thousands) (milliers) First level student enrollment - Elèves inscrits - 1er degré - Femmes 44 43 41 40 40 38 37 35 ... Female (thousands) (milliers) Second level student enrollment - Elèves inscrits - 2ème degré - Total 48 50 50 51 61 61 62 61 ... Total (thousands) (milliers) Second level student enrollment - Elèves inscrits - 2ème degré - 24 26 26 26 33 33 32 33 ... Female (thousands) Femmes (milliers) Third level student enrollment - Total Elèves inscrits - 3ème degré - Total 1.8 2.2 3.0 3.9 4.6 5.3 6.7 8.5 ... (thousands) (milliers) Third level student enrollment - Elèves inscrits - 3ème degré - 0.9 1.2 1.6 2.0 2.4 2.9 3.7 4.8 ... Female (thousands) Femmes (milliers) Public expenditure on education (% Dépenses publiques consacrées à 17.0 ... 20.7 25.4 15.6 16.4 ... ... ... of budget) l'enseignement (% du budget) Health Santé Hospital beds - Total (per 10 000 Nombre de lits d'hôpitaux - Total 210 200 210 210 ... ... ... 210 ... population) (pour 10 000) Nurses - Total (per 10 000 Nombre d'infirmières - Total (pour ... ... 83 ... 91 ... ... 130 ... population) 10 000) Physicians - Total (per 10 000 Nombre de médecins - Total (pour ... ... 47 ... 42 ... ... 60 ... population) 10 000) Public expenditure on Health (% of Dépenses publiques consacrées à la 11 11 12 10 11 ... ... ... ... budget) santé (% du budget) African Statistical Yearbook 2011 / Annuaire Statistique pour l'Afrique 2011
  • 117.
    Cape Verde Cap-Vert II NATIONAL ACCOUNTS — COMPTES NATIONAUX 2002 2003 2004 2005 2006 2007 2008 2009 2010 Gross domestic product by kind of economic activity at current prices Produit intérieur brut par branche d'activité économique aux prix courants Escudo (Millions) Escudo(Millions) Agriculture 7 546 8 083 8 113 7 773 8 120 7 722 ... ... ... Agriculture Mining and quarrying 1 193 1 285 1 804 2 112 3 035 3 266 ... ... ... Industries extractives Manufacturing 3 214 3 278 3 048 3 174 3 178 3 235 ... ... ... Industries manufacturières Electricity, gas & water 407 1 016 1 179 705 338 184 ... ... ... Electricité, gaz et eau Construction 5 898 6 105 6 312 7 537 9 067 10 118 ... ... ... Bâtiments et travaux publics Wholesale & retail trade, Commerce de gros et de détail, 15 472 16 941 17 727 17 539 20 494 24 634 ... ... ... restaurants, hotels restaurants et hôtels Banques, assurances, affaires Finance, insurance, real estate, etc. 7 326 7 404 7 924 8 404 9 873 11 544 ... ... ... immobilières Transport and communications 15 101 17 222 17 343 18 330 20 555 22 360 ... ... ... Transport(s) et communications Administrations publiques et Public administration and defense 9 367 10 322 11 106 11 779 12 521 13 134 ... ... ... défense Other services 1 532 1 705 1 775 2 227 2 546 3 138 ... ... ... Autres services Moins Services d’intermédiation Less Imputed Service Charges - 2 209 - 2 510 - 2 578 - 2 655 - 3 323 - 4 741 ... ... ... financière Gross domestic product at factor Produit intérieur brut aux couts des 64 846 70 851 73 753 76 924 86 404 94 595 ... ... ... cost / basic prices facteurs / prix de base Plus: Indirect Taxes / taxes on Plus taxes indirectes/impôts sur les 7 912 8 676 8 334 9 262 10 981 12 658 ... ... ... products, less subsidies produits, moins les subventions Expenditure on Gross domestic product at current purchaser's values Emploi du produit intérieur brut aux prix courants d'acquisition Escudo (Millions) Escudo(Millions) Consommation finale des Government final consumption 13 410 15 948 17 472 18 522 19 002 21 573 ... ... ... administrations publiques Private final consumption 61 402 65 323 65 326 70 067 80 107 84 084 ... ... ... Consommation finale privée Gross fixed capital formation 26 151 24 735 31 962 30 858 37 646 49 812 ... ... ... Formation brute de capital fixe Increase in inventories - 89 - 63 435 197 - 595 573 ... ... ... Variation des stocks Exports of goods and services 18 230 15 034 14 733 16 184 19 401 22 250 ... ... ... Exportations de biens et services 116 Moins importations de biens et Less imports of goods and services 46 345 41 450 47 840 49 642 58 176 71 040 ... ... ... services GDP at purchasers' values 72 758 79 527 82 087 86 186 97 384 107 252 ... ... ... PIB aux prix d'acquisition Gross domestic product by kind of economic activity at constant Produit intérieur brut par branche d'activité economique aux prix constants prices Annual Growth Rates (%) Taux de croissance annuel (%) Agriculture -5.5 1.7 -0.2 -5.7 0.3 0.0 ... ... ... Agriculture Mining and quarrying 3.8 7.8 6.3 9.3 15.4 9.6 ... ... ... Industries extractives Manufacturing -1.4 0.0 -6.0 8.7 -1.6 6.2 ... ... ... Industries manufacturières Electricity, gas & water 27.2 11.1 35.3 -13.0 22.4 -16.8 ... ... ... Electricité, gaz et eau Construction 15.6 0.3 0.5 15.2 16.2 8.5 ... ... ... Bâtiments et travaux publics Wholesale & retail trade, Commerce de gros et de 11.1 6.6 6.4 6.9 8.6 18.7 ... ... ... restaurants, hotels détail,restaurants et hôtels Banques, assurances, affaires Finance, insurance, real estate, etc. 5.7 -4.3 0.9 -2.9 27.5 25.0 ... ... ... immobilières Transport and communications 0.0 5.2 7.8 -0.2 14.5 7.0 ... ... ... Transport(s) et communications Administrations publiques et Public administartion and defense 4.2 7.5 6.5 3.5 2.7 2.3 ... ... ... défense Other services 5.4 7.0 11.2 13.0 7.2 8.1 ... ... ... Autres services Moins Services d’intérmediation Less Imputed Service Charges 14.1 12.4 5.0 2.8 18.5 38.4 ... ... ... financière Gross domestic product at factor Produit intérieur brut aux couts des 5.2 4.6 6.2 4.4 9.8 8.4 ... cost / basic prices facteurs / prix de base Plus: Indirect Taxes / taxes on Plus taxes indirectes/impôts sur les 6.1 5.4 -20.6 44.6 14.3 11.4 ... ... ... products, less subsidies produits, moins les subventions Gross domestic product at market Produit intérieur brut aux prix du 5.3 4.7 4.3 6.5 10.1 8.6 ... ... ... prices marché 2007: Provisional 2007: provisoire African Statistical Yearbook 2011 / Annuaire Statistique pour l'Afrique 2011
  • 118.
    Cape Verde Cap-Vert Expenditure on Gross domestic product at constant purchasers' Emplois du produit intérieur brut aux prix constants d'acquisition values Annual Growth Rates (%) Taux de croissance annuel (%) Consommation finale des Government final consumption 9.6 16.8 10.3 6.6 -2.8 11.4 ... ... ... administrations publiques Private final consumption 6.8 7.9 8.6 1.4 7.0 3.7 ... ... ... Consommation finale privée Gross fixed capital formation 20.7 -0.5 24.4 -6.6 18.3 37.0 ... ... ... Formation brute de capital fixe Exports of goods and services 12.2 -17.6 2.5 8.6 13.8 14.7 ... ... ... Exportations de biens et services Moins importations de biens et Less imports of goods and services 17.9 1.9 22.1 -6.6 7.0 23.7 ... ... ... services III INFLATION 2002 2003 2004 2005 2006 2007 2008 2009 2010 Annual Growth Rates (%) Taux de croissance annuel (%) All Item 1.9 1.2 -1.9 0.4 4.8 4.4 6.8 1.0 2.0 Ensemble Food ... ... -3.5 -0.1 6.5 5.0 9.1 1.9 2.2 Alimentation Health ... ... 4.7 1.4 0.4 0.3 4.7 6.2 2.3 Santé Energy ... ... 3.5 10.1 12.1 9.4 5.5 0.0 2.7 Energie Transport ... ... 1.5 3.3 8.1 2.7 8.7 -6.1 2.7 Transport IV AGRICULTURAL PRODUCTION - PRODUCTION AGRICOLE 2002 2003 2004 2005 2006 2007 2008 2009 2010 Tons (Thousand) Tonnes (milliers) Maize, Tons (thousands) 5 12 10 4 4 3 12 ... ... Maïs, tonnes (milliers) Banane, Tons (thousands) 6 6 6 6 7 7 7 ... ... Bananes, tonnes (milliers) Coconuts, Tons (thousands) 6 6 6 6 6 6 6 ... ... Noix de coco, tonnes (milliers) Cabbages, Tones (thousands) 4 4 4 4 5 5 5 ... ... Choux, tonnes (milliers) Mango, Tons (thousands) 5 5 5 5 5 6 6 ... ... Mangues, tonnes (milliers) V MINING PRODUCTION - PRODUCTION MINIERE 117 2002 2003 2004 2005 2006 2007 2008 2009 2010 Salt and pure sodium chloride, Sel et chlorure de sodium pur, 2.0 2.0 2.0 2.0 2.0 2.0 ... ... ... metric tons (thousands) tonnes métriques (milliers) Abrasives, natural, metric tone 1.0 1.0 ... ... ... ... ... ... ... Abrasifs naturels, tonnes métriques (thousands) (milliers) ... ... ... ... ... ... ... ... ... VI ENERGY - ENERGIE 2002 2003 2004 2005 2006 2007 2008 2009 2010 Electricity - total hydro production, Électricité - production hydraulique ... ... ... ... ... ... ... ... ... kilowatt hours (millions) totale, kilowatt-heures (millions) Electricity - total thermal production, Électricité - production thermique 176.5 194.3 213.4 230.6 244.5 262.6 ... ... ... kilowatt hours (millions) totale, kilowatt-heures (millions) Electricity - total production, self- Electricité - Production totale privée 1 1 1 1 1 1 ... ... ... producer (Million Kilowatt Hours) (million de kilowatt heures) Electricity - total production, public Electricité - Production totale 181 199 219 236 251 268 ... ... ... (Million Kilowatt Hours) publique (million de kilowatt heures) African Statistical Yearbook 2011 / Annuaire Statistique pour l'Afrique 2011
  • 119.
    Cape Verde Cap-Vert VII TOURISM AND INFRASTRUCTURE - TOURISME ET INFRASTUCTURE 2002 2003 2004 2005 2006 2007 2008 2009 2010 Arrivals - Tourists (thousands) 126 150 157 198 242 267 285 ... ... Arrivées - touristes (milliers) Rooms in hotels and similar Chambres d'hotels et établissements establishments (thousands) assimilés (milliers) 3 3 3 4 ... ... ... ... ... Paved Road (% of total) ... ... ... ... ... ... ... ... ... Routes asphaltées (% du total) Total Network (Railways-km) ... ... ... ... ... ... ... ... ... Réseau total voies ferrées-Km Main Telephone Lines (per 1,000 Lignes téléphoniques fixes (pour 154 155 153 150 148 146 144 ... ... inhabitants) 1000 habitants) Mobile Cellular Subscribers (per Abonnés aux téléphones mobiles 90 120 140 170 220 310 560 ... ... 1,000 inhabitants) (pour 1000 habitants) VII FINANCIAL AND MONETARY STATISTICS - FINANCES ET STATISTIQUES MONETAIRES 2002 2003 2004 2005 2006 2007 2008 2009 2010 VII-1 Monetary Statistics VII-1 Statistiques monétaires Escudo (Millions) Escudo(Millions) Money supply (M1) 24 794 25 748 27 305 31 938 40 562 45 573 46 112 44 538 45 567 Masse monétaire (M1) Quasi-money 27 268 30 792 35 218 40 452 44 879 49 043 55 671 60 768 63 640 Quasi-monnaie of which Demand Deposit ... ... ... ... ... ... ... ... ... dont Monnaie scripturale Net foreign assets 11 071 10 233 13 716 21 864 25 189 30 998 28 991 27 376 26 594 Avoirs extérieurs nets Domestic credit 52 256 56 709 59 279 62 344 72 983 78 555 91 381 99 192 106 110 Crédit intérieur of which claims on private sector 24 703 28 344 31 061 33 699 43 683 55 559 70 443 78 761 84 301 dont créances sur le secteur privé of which Claims on government dont créances nettes sur le 26 705 27 263 27 193 27 321 27 545 21 358 19 530 18 550 19 361 sector, net gouvernement International reserves (millions of US Réserves internationales (millions de 80 94 140 174 254 364 361 366 365 $) $ EU) Average Exchange Rate (National Taux de change (moyen) (monnaie 117.17 97.70 88.81 88.67 87.90 80.57 75.28 79.38 83.26 Currency per us $) nationale par dollars) VII-2 Public Finance VII-2 Finances publiques Escudo (Millions) Escudo(Millions) Total Revenues and Grants 22 737 21 371 27 471 26 633 30 743 34 633 39 116 36 575 47 133 Recettes totales et dons Tax Revenue 14 678 15 457 16 638 18 601 22 828 26 219 29 584 25 676 ... Recettes fiscales Non Tax Revenue 1 759 1 514 1 933 2 375 2 126 2 843 3 102 4 050 ... Recettes non fiscales 118 Grants 6 300 4 400 8 900 5 657 5 789 5 572 6 430 6 850 ... Dons Total Expenditures and Net Lending 25 090 24 713 31 353 30 168 35 775 35 977 40 715 44 493 68 321 Dépenses totales et prêts nets Current expenditure 8 647 12 075 15 008 13 869 17 693 16 348 17 774 19 899 ... Dépenses courantes Of which Wages and Salaries 7 092 9 361 9 805 10 733 11 547 12 491 13 518 14 844 ... Dont rémunérations et salaires Capital expenditure 9 360 7 674 11 191 11 073 12 415 12 237 16 264 17 823 ... Dépenses d'équipement Net Lending 200 0 100 147 301 293 0 0 ... Prêts nets Fiscal Balance - 2 353 - 3 342 - 3 882 - 3 535 - 5 031 - 1 344 - 1 599 - 7 917 - 21 188 Solde global y compris les dons VII-3 Balance of Payments VII-3 Balance des paiements Escudo (Millions) Escudo(Millions) Trade balance - 27 693 - 30 065 - 33 656 - 30 960 - 40 653 - 53 290 - 53 852 - 50 035 - 68 183 Balance commerciale Services Balance 1 472 1 404 2 826 6 148 13 822 15 776 18 534 14 321 11 747 Balance des services Net Income - 1 612 - 1 419 - 1 616 - 2 984 - 3 952 - 2 586 - 3 737 - 4 225 - 5 176 Revenus nets Current transfers, net total 19 814 21 214 20 685 24 949 25 383 24 278 24 065 27 550 32 986 Transferts courants Current account balance - 8 020 - 8 866 - 11 762 - 2 847 - 5 400 - 15 822 - 14 990 - 12 389 - 28 626 Solde du compte courant VII-4 External Debt and Financial Flows VII-4 Dette extérieure et flux financiers US $ (Millions) $ E.U (Millions) Total external debt 510 661 769 747 792 897 940 1 029 1 216 Dette extérieure totale Private 123 161 228 248 206 257 278 259 245 Privée Public 388 500 542 499 586 640 662 770 971 Publique Total external debt service 53 87 91 103 99 95 110 110 125 Service de la dette extérieure Net Foreign Direct Investment Investissements étranger direct (flux 39 34 68 82 131 190 212 120 ... Inflows nets entrants) Net Total Official Development Aide publique au développement 92 147 143 162 138 165 222 196 ... assistance (nette totale) African Statistical Yearbook 2011 / Annuaire Statistique pour l'Afrique 2011
  • 120.
    Cape Verde Cap-Vert 2002 2003 2004 2005 2006 2007 2008 2009 2010 US $ (Millions) Escudo Exports, fob Exportations, fàb Exports - Total 5 5 7 60 71 81 0 7 ... Exportations - Total Main Products Principaux produits Thons, albacore, congelés à Tunas, yellowfin, frozen excluding 0 ... ... 8 11 6 18 7 ... l'exclusion du n ° 03.04, foies et heading No 03.04, livers and roes laitances Listaos ou bonites à ventre rayé, Skipjack or stripe-bellid bonito,frozen ... ... ... 3 6 6 8 4 ... congelés ex headg n ° 03.04, foies ex headg No 03.04,livers&roes et laitances Uppers and parts thereof, other than Tige et leurs parties, autres que les 4 4 5 3 3 3 4 4 ... stiffeners raidisseurs Mens/boys trousers and shorts, of Hommes, les garçons pantalon et 1 1 2 1 2 5 4 5 ... cotton, not knitted courts métrages, du coton, tricotes Hommes, les garçons pantalon et Mens/boys underpants and briefs, of 1 2 2 1 2 1 1 1 ... courts métrages, du coton, non cotton, knitted tricotes Main Destinations Principales destinations Portugal 8.7 9.9 13.5 9.1 8.9 9.8 13.1 10.1 ... Portugal Spain 0.0 0.1 0.2 11.1 18.1 13.6 22.4 24.9 ... Espagne United States 2.0 6.0 4.0 2.8 1.0 2.2 0.5 0.8 ... États-Unis Brazil 0.7 1.0 1.3 0.8 2.1 11.2 0.0 0.0 ... Brésil United Kingdom 8.0 1.7 1.5 1.4 0.2 0.1 0.6 0.2 ... Royaume-Uni 2002 2003 2004 2005 2006 2007 2008 2009 2010 Imports, cif Importations, cif Imports - Total 327 361 441 480 617 807 999 788 ... Importations - Total (millions) 119 Principaux produits Main Products Petroleum oils&oils obtained from Huiles de pétrole, bitumineux, bituminous minerals,o/than crude 14 19 18 51 78 87 142 89 ... distilles, sauf brut etc Portland cement nes 6 6 7 8 11 21 27 19 ... Ciment Portland NDA Bars & rods,i/nas,hr,hd or he,cntg Barres, i / nas, hr, hd ou he, ,cntg 2 6 8 11 15 26 22 6 ... indent,ribs,etc,prod dur rp/tar,nes indent,ribs, etc, prod dur rp/tar, nda Milk and cream powder Lait et crème en poudre non sucré 6 6 9 10 9 16 13 10 ... unsweetened exceeding 1.5% fat grasses excédant 1,5% Beer made from malt 5 8 7 6 8 9 10 9 ... Bières de malt Main Origin Principales provenances Portugal 139.7 155.0 173.5 184.2 237.9 311.3 380.9 310.1 ... Portugal Brazil 18.6 28.7 45.6 111.7 132.6 157.2 39.6 29.6 ... Brésil Netherlands 19.9 28.8 34.2 31.9 61.0 84.6 107.4 107.0 ... Pays-Bas Spain 11.5 12.7 21.6 25.9 38.8 44.7 64.0 44.0 ... Espagne Italy 10.4 10.5 17.4 35.8 31.5 35.9 34.2 31.0 ... Italie African Statistical Yearbook 2011 / Annuaire Statistique pour l'Afrique 2011
  • 121.
    Central African Republic République Centrafricaine AREA (KM 2) 622 984 SUPERFICIE (KM 2) CAPITAL CITY Bangui Bangui CAPITALE CURRENCY CFA Franc Franc CFA MONNAIE I SOCIAL AND DEMOGRAPHIC INDICATORS — INDICATEURS DEMOGRAPHIQUES ET SOCIAUX 2002 2003 2004 2005 2006 2007 2008 2009 2010 Population Population Population au milieu de l'année - Mid-year population - Total (Million) 3.9 3.9 4.0 4.1 4.1 4.2 4.3 4.4 ... Total (million) Population au milieu de l'année - Mid-year population - Urban (%) ... 18.9 38.0 38.0 38.0 38.0 18.9 38.7 ... Urbaine (%) Female (%) 50.9 18.9 50.9 50.9 50.9 50.9 19.4 50.9 ... Femme (%) Population by Age Group Population par groupe d'âge 0-14 1626 574 1684 000 1704 000 1727 000 1751 000 1774 000 1796 000 1814 000 ... 0-14 15-64 2112 289 2108 000 2163 000 2216 000 2272 000 2330 000 2391 000 2459 000 ... 15-64 65+ 151 060 103 000 105 000 108 000 110 000 113 000 115 000 117 000 ... 65+ Active Population (000) 1 718.0 1 350.0 1 387.0 1 425.0 1 464.0 1 504.0 1 545.0 1 588.0 ... Population active (000) Female (%) 45.7 42.0 41.8 41.8 41.9 41.9 41.8 41.9 ... Femme (%) Taux brut de natalité - Total (par Crude birth rate - Total (per 1000) 38.8 39.1 37.7 37.2 36.6 36.0 38.8 34.9 ... 1000) Taux brut de mortalité - Total (par Crude death rate - Total (per 1000) 18.1 20.4 17.9 17.7 17.5 17.2 18.0 16.7 ... 1000) Life expectancy at birth - Total Espérance de vie à la naissance - 46.0 42.7 46.0 46.2 46.4 46.7 47.0 47.4 ... (years) Total (années) Net reproduction rate - (per Taux net de reproduction - (par ... ... 1.6 ... ... ... ... ... ... woman) femme) Indice synthétique de fécondité - Total fertility rate - (p woman) y (per ) 5.3 5.1 5.2 5.1 5.0 4.9 4.9 4.7 ... (par femme) Education Enseignement Teaching staff at first level - Total Personnel enseignant - 1er degré - 4.80 3.6 4.4 5.1 ... 5.3 5.8 6.4 ... (thousands) Total (milliers) Teaching staff at second level - Total Personnel enseignant - 2ème degré - 120 1.00 1.0 1.0 1.5 ... ... 1.1 0.9 ... (thousands) Total (milliers) Teaching staff at third level - Total Personnel enseignant - 3ème degré - ... ... ... ... ... ... ... ... ... (thousands) Total (milliers) First level student enrollment - Total Elèves inscrits - 1er degré - Total 368 255 366 413 ... 464 522 324 ... (thousands) (milliers) First level student enrollment - Elèves inscrits - 1er degré - Femmes 149 114 147 169 171918 000 194 219 261 ... Female (thousands) (milliers) Second level student enrollment - Elèves inscrits - 2ème degré - Total 43 44 65 76 ... ... 58 86 ... Total (thousands) (milliers) Second level student enrollment - Elèves inscrits - 2ème degré - 22 17 22 28 ... ... 38 37 ... Female (thousands) Femmes (milliers) Third level student enrollment - Total Elèves inscrits - 3ème degré - Total ... ... 6.4 6.3 4.5 ... 9.6 ... ... (thousands) (milliers) Third level student enrollment - Elèves inscrits - 3ème degré - ... ... ... ... 1.0 ... 2.4 ... ... Female (thousands) Femmes (milliers) Public expenditure on education (% Dépenses publiques consacrées à 18.3 17.6 17.2 14.0 10.8 19.5 10.1 11.1 ... of budget) l'enseignement (% du budget) Health Santé Hospital beds - Total (per 10 000 Nombre de lits d'hôpitaux - Total ... 8 9 8 8 8 9 10 ... population) (pour 10 000) Nurses - Total (per 10 000 Nombre d'infirmières - Total (pour 1 1 1 1 1 1 1 2 ... population) 10 000) Physicians - Total (per 10 000 Nombre de médecins - Total (pour 1 0 0 0 0 1 1 1 ... population) 10 000) Public expenditure on Health (% of Dépenses publiques consacrées à la 12 7 9 11 12 11 9 ... ... budget) santé (% du budget) African Statistical Yearbook 2011 / Annuaire Statistique pour l'Afrique 2011
  • 122.
    Central African Republic République Centrafricaine II NATIONAL ACCOUNTS — COMPTES NATIONAUX 2002 2003 2004 2005 2006 2007 2008 2009 2010 Gross domestic product by kind of economic activity at current prices Produit intérieur brut par branche d'activité économique aux prix courants CFA Franc (Millions) Franc CFA (Millions) Agriculture 351 740 359 283 352 778 368 151 401 380 416 396 467 646 479 574 ... Agriculture Mining and quarrying 22 728 17 391 20 074 20 458 20 349 21 208 13 904 23 124 ... Industries extractives Manufacturing 40 581 38 457 38 764 42 981 47 560 50 991 56 271 56 206 ... Industries manufacturières Electricity, gas & water 4 271 5 548 5 749 5 841 6 544 6 801 5 959 6 474 ... Electricité, gaz et eau Construction 24 143 25 157 24 875 26 364 29 256 31 290 36 081 39 057 ... Bâtiments et travaux publics Wholesale & retail trade, Commerce de gros et de détail, 75 204 70 926 73 792 81 045 88 841 98 826 108 437 115 602 ... restaurants, hotels restaurants et hôtels Banques, assurances, affaires Finance, insurance, real estate, etc. ... ... ... ... ... ... ... ... ... immobilières Transport and communications 29 086 27 431 28 540 31 047 38 215 42 510 46 645 53 114 ... Transport(s) et communications Administrations publiques et Public administration and defense 46 230 41 200 38 300 39 200 37 200 36 300 36 900 39 375 ... défense Other services 61 923 45 898 50 550 55 020 58 040 62 746 66 964 83 928 ... Autres services Moins Services d’intermédiation Less Imputed Service Charges ... ... ... ... ... ... ... ... ... financière Gross domestic product at factor Produit intérieur brut aux couts des 655 906 631 291 633 422 670 107 727 385 767 068 838 807 896 454 ... cost / basic prices facteurs / prix de base Plus: Indirect Taxes / taxes on Plus taxes indirectes/impôts sur les 35 105 30 900 37 300 42 000 42 900 46 400 50 400 53 550 ... products, less subsidies produits, moins les subventions Expenditure on Gross domestic product at current purchaser's values Emploi du produit intérieur brut aux prix courants d'acquisition CFA Franc (Millions) Franc CFA (Millions) Consommation finale des Government final consumption 95 559 68 613 69 999 74 216 71 264 69 577 69 577 88 717 ... administrations publiques Private final consumption 557 850 549 556 590 230 627 173 675 177 723 842 808 394 807 055 ... Consommation finale privée Gross fixed capital formation 66 507 42 427 45 707 69 588 78 160 81 450 103 163 124 129 ... Formation brute de capital fixe Increase in inventories ... ... ... ... ... ... ... ... ... Variation des stocks Exports of goods and services 110 300 120 800 93 920 94 263 115 011 123 143 102 553 140 571 ... Exportations de biens et services Moins importations de biens et 121 Less imports of goods and services 139 205 119 205 129 134 153 133 169 327 184 544 194 480 210 468 ... services GDP at purchasers' values 691 011 662 191 670 722 712 107 770 285 813 468 889 207 950 004 ... PIB aux prix d'acquisition Gross domestic product by kind of economic activity at constant Produit intérieur brut par branche d'activité economique aux prix constants prices Annual Growth Rates (%) Taux de croissance annuel (%) Agriculture -0.5 -2.4 2.0 0.3 4.3 2.2 1.8 -8.9 ... Agriculture Mining and quarrying -9.5 -21.2 9.0 7.5 8.0 0.5 -9.2 68.7 ... Industries extractives Manufacturing 1.3 -7.0 1.0 5.0 6.5 7.0 5.5 -0.1 ... Industries manufacturières Electricity, gas & water -2.5 11.6 1.0 1.0 5.5 3.0 -6.8 8.6 ... Electricité, gaz et eau Construction 0.0 0.0 1.0 3.0 4.0 6.0 5.5 6.1 ... Bâtiments et travaux publics Wholesale & retail trade, Commerce de gros et de -2.5 -5.5 2.0 5.1 5.0 8.0 5.0 3.5 ... restaurants, hotels détail,restaurants et hôtels Banques, assurances, affaires Finance, insurance, real estate, etc. ... ... ... ... ... ... ... ... ... immobilières Transport and communications 1.5 -5.5 2.0 4.1 17.9 8.0 5.0 10.6 ... Transport(s) et communications Administrations publiques et Public administartion and defense -2.8 -13.1 -9.3 -0.1 -10.4 -4.3 -3.2 4.6 ... défense Other services -2.5 -26.1 7.9 4.7 0.8 5.2 2.0 21.0 ... Autres services Moins Services d’intérmediation Less Imputed Service Charges ... ... ... ... ... ... ... ... ... financière Gross domestic product at factor Produit intérieur brut aux couts des -1.2 -6.7 1.8 2.0 4.1 3.6 2.2 -0.6 ... cost / basic prices facteurs / prix de base Plus: Indirect Taxes / taxes on Plus taxes indirectes/impôts sur les 13.0 -14.6 22.4 8.6 -2.0 6.2 1.5 3.2 ... products, less subsidies produits, moins les subventions Gross domestic product at market Produit intérieur brut aux prix du -0.6 -7.1 2.7 2.4 3.8 3.7 2.2 -0.4 ... prices marché 2009: Provisional 2009: provisoire African Statistical Yearbook 2011 / Annuaire Statistique pour l'Afrique 2011
  • 123.
    Central African Republic République Centrafricaine Expenditure on Gross domestic product at constant purchasers' Emplois du produit intérieur brut aux prix constants d'acquisition values Annual Growth Rates (%) Taux de croissance annuel (%) Consommation finale des Government final consumption -1.9 -30.4 2.7 2.2 -7.9 -4.1 -6.6 -0.4 ... administrations publiques Private final consumption -1.1 -4.5 2.7 2.4 3.3 5.3 4.4 -0.4 ... Consommation finale privée Gross fixed capital formation -6.6 -38.1 2.7 46.8 7.8 2.3 18.4 -0.4 ... Formation brute de capital fixe Exports of goods and services -7.5 6.2 2.7 -3.2 17.1 5.2 -22.2 -0.4 ... Exportations de biens et services Moins importations de biens et Less imports of goods and services -11.3 -17.0 2.7 14.4 6.1 7.0 -1.5 -0.4 ... services III INFLATION 2002 2003 2004 2005 2006 2007 2008 2009 2010 Annual Growth Rates (%) Taux de croissance annuel (%) All Item 2.3 4.1 -2.1 2.9 6.7 1.0 9.3 3.5 1.8 Ensemble Food 2.0 5.2 -4.1 3.5 7.1 1.5 11.8 3.9 ... Alimentation Health ... ... ... ... ... ... ... ... ... Santé Energy 1.9 -0.8 -4.4 -2.0 8.2 0.0 6.3 10.2 ... Energie Transport ... ... ... ... ... ... ... ... ... Transport IV AGRICULTURAL PRODUCTION - PRODUCTION AGRICOLE 2002 2003 2004 2005 2006 2007 2008 2009 2010 Tons (Thousand) Tonnes (milliers) Cassava, Tons (thousands) 563 564 566 1 367 1 097 966 1 781 4 090 ... Manioc, tonnes (milliers) Yams, Tons (thousands) 350 330 350 1 576 7 278 1 888 2 734 1 488 ... Ignames, tonnes (milliers) Maize, Tons (thousands) 113 119 125 131 131 141 141 ... ... Maïs, tonnes (milliers) Groundnuts in shells, Tons Arachides (en coques), tonnes 128 134 140 145 140 137 ... ... ... (thousands) (milliers) Banana, Tons (thousands) 115 110 110 112 110 110 ... ... ... Bananes, tonnes (milliers) V MINING PRODUCTION - PRODUCTION MINIERE 122 2002 2003 2004 2005 2006 2007 2008 2009 2010 Diamonds, industrial, carat 414.8 332.7 460.3 470.4 415.5 417.7 377.2 310.5 ... Diamants, industriels, carat (milliers) (thousands) Diamonds and other precious stones, 311.0 300.0 354.7 383.0 420.0 ... ... ... ... Diamants et autres pierres unworked carat (thousands) précieuses brut carat (milliers) Gold ores and concentrates Minerais d'or et concentrés 15.9 0.1 3.1 10.4 8.7 12.5 37.1 61.4 ... (Kilograms) (kilogrammes) VI ENERGY - ENERGIE 2002 2003 2004 2005 2006 2007 2008 2009 2010 Electricity - total hydro production, Électricité - production hydraulique 120.5 120.4 126.5 133.6 139.6 137.1 125.7 136.4 ... kilowatt hours (millions) totale, kilowatt-heures (millions) Electricity - total thermal production, Électricité - production thermique 25.0 26.0 27.0 28.0 29.0 30.0 ... 100.0 ... kilowatt hours (millions) totale, kilowatt-heures (millions) Electricity - total production, self- Electricité - Production totale privée ... ... ... ... ... ... ... ... ... producer (Million Kilowatt Hours) (million de kilowatt heures) Electricity - total production, public Electricité - Production totale 108 110 111 128 139 160 ... ... ... (Million Kilowatt Hours) publique (million de kilowatt heures) African Statistical Yearbook 2011 / Annuaire Statistique pour l'Afrique 2011
  • 124.
    Central African Republic République Centrafricaine VII TOURISM AND INFRASTRUCTURE - TOURISME ET INFRASTUCTURE 2002 2003 2004 2005 2006 2007 2008 2009 2010 Arrivals - Tourists (thousands) 3 6 8 12 14 ... ... ... ... Arrivées - touristes (milliers) Rooms in hotels and similar Chambres d'hotels et établissements establishments (thousands) ... ... ... ... ... ... ... ... ... assimilés (milliers) Paved Road (% of total) 20 20 20 20 20 20 20 20 ... Routes asphaltées (% du total) Total Network (Railways-km) 3 3 3 3 3 3 3 3 ... Réseau total voies ferrées-Km Main Telephone Lines (per 1,000 Lignes téléphoniques fixes (pour 2 2 2 2 3 3 3 ... ... inhabitants) 1000 habitants) Mobile Cellular Subscribers (per Abonnés aux téléphones mobiles 3 10 15 24 26 31 35 ... ... 1,000 inhabitants) (pour 1000 habitants) VII FINANCIAL AND MONETARY STATISTICS - FINANCES ET STATISTIQUES MONETAIRES 2002 2003 2004 2005 2006 2007 2008 2009 2010 VII-1 Monetary Statistics VII-1 Statistiques monétaires CFA Franc (Millions) Franc CFA (Millions) Money supply (M1) 94 739 85 435 97 715 113 703 105 461 97 294 113 720 131 516 139 273 Masse monétaire (M1) Quasi-money 10 191 11 079 12 512 14 717 17 513 21 198 24 343 24 856 31 415 Quasi-monnaie of which Demand Deposit ... ... ... ... ... ... ... ... ... dont Monnaie scripturale Net foreign assets 47 921 40 153 42 498 48 782 36 003 24 986 24 513 28 664 9 313 Avoirs extérieurs nets Domestic credit 96 546 102 177 115 342 126 145 135 725 142 702 159 815 162 846 179 023 Crédit intérieur of which claims on private sector 41 320 40 977 49 645 48 461 51 251 54 884 62 010 65 860 81 626 dont créances sur le secteur privé of which Claims on government dont créances nettes sur le 47 163 52 760 58 960 72 037 79 293 83 628 95 660 95 210 95 353 sector, net gouvernement International reserves (millions of US Réserves internationales (millions de 123 132 148 139 125 83 122 211 169 $) $ EU) Average Exchange Rate (National Taux de change (moyen) (monnaie 696.99 581.20 528.29 527.47 522.89 479.27 447.81 472.19 495.28 Currency per us $) nationale par dollars) VII-2 Public Finance VII-2 Finances publiques CFA Franc (Millions) Franc CFA (Millions) Total Revenues and Grants 106 100 63 700 78 500 88 000 176 300 117 000 134 700 151 000 150 900 Recettes totales et dons Tax Revenue 61 400 45 000 48 300 50 500 60 500 59 500 70 600 81 800 89 500 Recettes fiscales Non Tax Revenue 17 000 8 600 7 500 8 000 12 900 24 100 21 800 19 800 16 400 Recettes non fiscales Grants 27 700 10 100 22 700 29 500 102 900 33 400 42 300 49 400 45 000 Dons 123 Total Expenditures and Net Lending 114 672 85 329 93 406 120 400 107 200 107 600 143 600 144 300 277 187 Dépenses totales et prêts nets Current expenditure 50 237 50 841 56 688 61 400 52 400 51 800 62 700 69 100 76 500 Dépenses courantes Of which Wages and Salaries 33 134 34 513 38 878 39 200 37 200 37 400 38 600 42 200 44 800 Dont rémunérations et salaires Capital expenditure 46 035 19 457 18 195 38 400 37 700 29 400 40 100 46 200 163 687 Dépenses d'équipement Net Lending 0 0 0 0 0 0 0 0 0 Prêts nets Fiscal Balance - 8 572 - 21 629 - 14 906 - 32 400 69 100 9 400 - 8 900 6 700 - 126 287 Solde global y compris les dons VII-3 Balance of Payments VII-3 Balance des paiements CFA Franc (Millions) Franc CFA (Millions) Trade balance 18 638 6 081 - 9 191 - 24 815 - 23 497 - 33 867 - 67 183 - 69 452 - 87 616 Balance commerciale Services Balance - 52 227 - 36 102 - 34 460 - 32 282 - 35 867 - 41 489 - 43 441 - 43 022 - 57 841 Balance des services Net Income - 6 103 - 1 328 - 7 355 - 7 178 - 7 830 - 7 457 - 9 957 - 9 957 - 1 926 Revenus nets Current transfers, net total 28 630 16 761 39 183 16 200 42 231 30 500 32 400 36 500 42 000 Transferts courants Current account balance - 11 062 - 14 588 - 11 824 - 48 075 - 24 963 - 52 313 - 88 181 - 85 931 - 105 382 Solde du compte courant VII-4 External Debt and Financial Flows VII-4 Dette extérieure et flux financiers US $ (Millions) $ E.U (Millions) Total external debt 1 048 1 241 1 080 1 073 1 087 986 1 050 264 297 Dette extérieure totale Private 42 51 56 56 0 0 0 0 0 Privée Public 1 005 1 190 1 024 1 017 1 087 986 1 050 264 297 Publique Total external debt service 28 24 23 28 41 36 43 48 83 Service de la dette extérieure Net Foreign Direct Investment Investissements étranger direct (flux 6 22 29 32 35 57 117 42 ... Inflows nets entrants) Net Total Official Development Aide publique au développement 60 51 110 89 134 177 256 237 ... assistance (nette totale) African Statistical Yearbook 2011 / Annuaire Statistique pour l'Afrique 2011
  • 125.
    Central African Republic République Centrafricaine 2002 2003 2004 2005 2006 2007 2008 2009 2010 CFA Franc (Millions) Franc CFA Exports, fob Exportations, fàb Exports - Total 102 408 74 420 70 661 67 389 82 422 85 418 66 192 52 953 ... Exportations - Total Main Products Principaux produits Diamonds 26 316 28 332 27 765 33 176 32 666 29 755 22 198 17 506 ... Diamants Rough lumber 5 735 34 600 16 582 19 301 39 800 18 578 15 858 5 527 ... Bois grume Cotton 6 400 495 1 800 59 742 555 1 035 571 ... Coton Coffee 1 323 800 992 903 779 4 189 2 069 223 ... Café Gold 71 10 37 34 55 77 252 384 ... Or Main Destinations Principales destinations Belgium 16 733.0 13 678.0 25 425.0 17 448.0 17 905.0 15 443.0 15 526.0 17 629.0 ... Belgique France 15 253.0 13 611.0 4 694.0 11 495.0 9 592.0 9 118.0 5 126.0 2 546.0 ... France Cameroon 14 483.0 10 407.0 ... 7 347.0 14 695.0 8 610.0 ... 3 339.0 ... Cameroun Germany 684.0 195.0 4 629.0 4 515.0 3 741.0 6 576.0 5 635.0 2 991.0 ... Allemagne Switzerland 581.0 156.0 8 226.0 8 421.0 3 777.0 6 100.0 2 788.0 1 079.0 ... Suisse 2002 2003 2004 2005 2006 2007 2008 2009 2010 Imports, cif Importations, cif 124 Imports - Total ... ... ... ... ... ... ... ... ... Importations - Total (millions) Principaux produits Main Products Food 10 350 12 609 13 350 14 436 18 881 18 489 19 842 29 885 ... Produits aliumentaires Textiles 5 919 3 073 4 799 9 185 3 815 4 164 5 577 3 319 ... Textiles Transport equipment 10 008 7 079 8 357 8 366 6 481 14 204 13 950 11 505 ... Matériels de transports Mineral fuels 8 868 9 133 12 399 16 596 26 000 778 4 344 508 ... Combustibles minéraux Chemical products 5 434 8 831 4 358 5 999 5 018 9 297 9 616 11 178 ... Produits chimiques Main Origin Principales provenances France 19 903.0 18 466.0 15 422.0 9 189.0 14 708.0 25 147.0 26 884.0 18 703.0 ... France Cameroun 13 284.0 8 465.0 4 890.0 30 442.0 8 154.0 9 191.0 11 081.0 6 917.0 ... Cameroun Japon 7 847.0 3 308.0 4 733.0 1 527.0 4 183.0 6 198.0 6 126.0 6 866.0 ... Japon Belgium 2 948.0 5 333.0 2 796.0 5 961.0 3 174.0 3 114.0 ... ... ... Allemagne China 2 424.0 ... 1 523.0 ... 3 131.0 5 723.0 4 767.0 5 988.0 ... Chine African Statistical Yearbook 2011 / Annuaire Statistique pour l'Afrique 2011
  • 126.
    Chad Tchad AREA (KM 2) 1 284 000 SUPERFICIE (KM 2) CAPITAL CITY N Djamena Ndjamena CAPITALE CURRENCY CFA Franc Franc CFA MONNAIE I SOCIAL AND DEMOGRAPHIC INDICATORS — INDICATEURS DEMOGRAPHIQUES ET SOCIAUX 2002 2003 2004 2005 2006 2007 2008 2009 2010 Population Population Population au milieu de l'année - Mid-year population - Total (Million) 9.0 9.4 9.7 10.0 10.3 10.6 10.9 11.2 ... Total (million) Population au milieu de l'année - Mid-year population - Urban (%) 25.4 25.3 25.2 25.4 25.4 25.3 22.7 21.7 ... Urbaine (%) Female (%) 50.4 50.4 50.4 50.4 50.4 50.4 50.3 50.7 ... Femme (%) Population by Age Group Population par groupe d'âge 0-14 4149 000 4297 000 4450 000 4609 000 4729 000 4853 000 4981 000 5112 000 ... 0-14 15-64 4592 000 4760 000 4935 000 5116 000 5270 000 5429 000 5592 000 5761 000 ... 15-64 65+ 299 000 306 000 314 000 322 000 329 000 336 000 342 000 349 000 ... 65+ Active Population (000) 3 574.0 3 747.0 3 913.0 4 053.0 4 179.0 4 299.0 4 432.0 4 280.0 ... Population active (000) Female (%) 46.3 47.6 48.6 48.9 48.8 48.6 48.8 45.2 ... Femme (%) Taux brut de natalité - Total (par Crude birth rate - Total (per 1000) 48.2 47.7 47.5 47.7 46.3 46.2 45.9 45.3 ... 1000) Taux brut de mortalité - Total (par Crude death rate - Total (per 1000) 16.2 15.6 15.0 15.6 14.7 14.4 14.2 14.1 ... 1000) Life expectancy at birth - Total Espérance de vie à la naissance - 48.7 48.7 49.5 50.2 50.2 52.2 52.2 52.2 ... (years) Total (années) Net reproduction rate - (per Taux net de reproduction - (par 2.5 2.5 2.5 2.4 2.4 2.4 2.4 2.4 ... woman) femme) Indice synthétique de fécondité - Total fertility rate - (p woman) y (per ) 6.6 6.6 6.6 6.4 6.2 6.2 6.2 6.2 ... (par femme) Education Enseignement Teaching staff at first level - Total Personnel enseignant - 1er degré - 16.14 18.5 20.0 20.7 21.8 24.5 27.4 ... ... (thousands) Total (milliers) Teaching staff at second level - Total Personnel enseignant - 2ème degré - 6.20 6.4 6.5 7.7 8.9 11.2 12.7 ... ... 125 (thousands) Total (milliers) Teaching staff at third level - Total Personnel enseignant - 3ème degré - 0.8 1.1 1.3 1.4 1.5 2.0 2.4 ... ... (thousands) Total (milliers) First level student enrollment - Total Elèves inscrits - 1er degré - Total 1 085 1 164 1 272 1 262 1 296 1 324 ... ... ... (thousands) (milliers) First level student enrollment - Elèves inscrits - 1er degré - Femmes 425 462 502 507 522 542 615 ... ... Female (thousands) (milliers) Second level student enrollment - Elèves inscrits - 2ème degré - Total 185 213 228 245 263 314 ... ... ... Total (thousands) (milliers) Second level student enrollment - Elèves inscrits - 2ème degré - 46 52 56 63 69 97 ... ... ... Female (thousands) Femmes (milliers) Third level student enrollment - Total Elèves inscrits - 3ème degré - Total ... 7.4 10.1 12.4 ... ... 19.0 ... ... (thousands) (milliers) Third level student enrollment - Elèves inscrits - 3ème degré - ... 0.8 1.3 0.7 ... ... 2.4 ... ... Female (thousands) Femmes (milliers) Public expenditure on education (% Dépenses publiques consacrées à ... ... 7.7 10.1 ... ... ... ... ... of budget) l'enseignement (% du budget) Health Santé Hospital beds - Total (per 10 000 Nombre de lits d'hôpitaux - Total 16 18 18 20 20 24 26 26 ... population) (pour 10 000) Nurses - Total (per 10 000 Nombre d'infirmières - Total (pour 7 7 6 6 6 5 5 5 ... population) 10 000) Physicians - Total (per 10 000 Nombre de médecins - Total (pour 3 3 3 3 3 3 3 ... ... population) 10 000) Public expenditure on Health (% of Dépenses publiques consacrées à la 9 9 9 7 8 ... ... ... ... budget) santé (% du budget) African Statistical Yearbook 2011 / Annuaire Statistique pour l'Afrique 2011
  • 127.
    Chad Tchad II NATIONAL ACCOUNTS — COMPTES NATIONAUX 2002 2003 2004 2005 2006 2007 2008 2009 2010 Gross domestic product by kind of economic activity at current prices Produit intérieur brut par branche d'activité économique aux prix courants CFA Franc (Millions) Franc CFA (Millions) Agriculture 476 500 457 998 484 674 586 500 647 423 586 490 626 625 648 284 754 708 Agriculture Mining and quarrying 92 300 282 225 369 383 1 510 100 1 651 020 1 643 175 1 849 471 1 163 253 1 721 183 Industries extractives Manufacturing 125 100 121 645 117 175 143 500 166 694 171 825 183 279 194 945 210 684 Industries manufacturières Electricity, gas & water 7 800 6 984 7 079 9 200 10 212 13 265 15 659 18 776 21 029 Electricité, gaz et eau Construction 20 700 24 300 27 939 30 900 34 985 57 300 61 600 66 800 79 706 Bâtiments et travaux publics Wholesale & retail trade, Commerce de gros et de détail, 295 400 302 624 310 200 336 400 378 653 363 208 397 343 422 154 461 838 restaurants, hotels restaurants et hôtels Banques, assurances, affaires Finance, insurance, real estate, etc. ... ... ... ... ... ... ... ... ... immobilières Transport and communications 42 000 40 259 44 300 54 400 59 623 55 723 59 352 61 577 65 803 Transport(s) et communications Administrations publiques et Public administration and defense 151 900 171 463 184 300 210 800 241 427 324 708 356 651 402 162 434 404 défense Other services 118 400 120 735 130 300 153 700 165 787 161 881 174 292 186 471 193 803 Autres services Moins Services d’intermédiation Less Imputed Service Charges ... ... ... ... ... ... ... ... ... financière Gross domestic product at factor Produit intérieur brut aux couts des 1 330 100 1 528 233 1 675 349 3 035 500 3 355 825 3 377 575 3 724 273 3 164 422 3 943 156 cost / basic prices facteurs / prix de base Plus: Indirect Taxes / taxes on Plus taxes indirectes/impôts sur les 55 207 53 544 56 921 65 221 72 821 80 421 84 021 91 434 101 497 products, less subsidies produits, moins les subventions Expenditure on Gross domestic product at current purchaser's values Emploi du produit intérieur brut aux prix courants d'acquisition CFA Franc (Millions) Franc CFA (Millions) Consommation finale des Government final consumption 106 155 108 239 114 486 135 406 162 800 235 400 279 100 311 100 315 312 administrations publiques Private final consumption 1 140 220 1 166 201 1 055 513 2 008 789 2 365 885 2 335 979 2 304 860 2 434 591 2 403 981 Consommation finale privée Gross fixed capital formation 1 451 374 891 977 743 660 722 004 873 958 878 071 989 551 1 222 424 1 594 111 Formation brute de capital fixe Increase in inventories 25 000 0 20 700 20 700 12 000 12 000 14 000 15 000 10 000 Variation des stocks Exports of goods and services 175 493 387 458 1 203 613 1 719 583 1 830 400 1 836 572 2 019 907 1 418 602 1 945 262 Exportations de biens et services 126 Moins importations de biens et Less imports of goods and services 1 512 936 972 098 1 405 701 1 505 761 1 816 397 1 840 025 1 799 124 2 145 862 2 224 013 services GDP at purchasers' values 1 385 307 1 581 777 1 732 270 3 100 721 3 428 646 3 457 996 3 808 294 3 255 857 4 044 652 PIB aux prix d'acquisition Gross domestic product by kind of economic activity at constant Produit intérieur brut par branche d'activité economique aux prix constants prices Annual Growth Rates (%) Taux de croissance annuel (%) Agriculture -1.0 5.1 -6.1 13.6 -0.1 -1.4 -2.6 -6.4 14.6 Agriculture Mining and quarrying 36.4 140.9 234.1 2.6 -7.9 -6.6 -9.2 -5.4 4.2 Industries extractives Manufacturing 13.0 1.0 -6.3 16.6 8.6 0.1 -0.9 -0.2 0.8 Industries manufacturières Electricity, gas & water 15.9 -14.0 -1.2 30.6 10.0 31.7 8.6 8.3 11.5 Electricité, gaz et eau Construction 13.8 23.5 15.8 12.3 11.2 64.8 -3.5 3.4 12.3 Bâtiments et travaux publics Wholesale & retail trade, Commerce de gros et de 12.5 5.0 7.0 5.9 5.1 4.3 2.8 -0.5 7.6 restaurants, hotels détail,restaurants et hôtels Banques, assurances, affaires Finance, insurance, real estate, etc. ... ... ... ... ... ... ... ... ... immobilières Transport and communications 10.9 -11.2 2.6 15.8 8.6 -6.6 -0.5 -1.3 5.9 Transport(s) et communications Administrations publiques et Public administartion and defense 6.9 18.1 11.9 10.4 9.5 24.5 5.8 11.8 0.2 défense Other services 7.3 5.2 7.1 14.9 5.9 0.6 1.5 -3.0 3.4 Autres services Moins Services d’intérmediation Less Imputed Service Charges ... ... ... ... ... ... ... ... ... financière Gross domestic product at factor Produit intérieur brut aux couts des 8.1 14.7 34.7 8.5 0.7 2.3 -1.8 -1.2 6.1 cost / basic prices facteurs / prix de base Plus: Indirect Taxes / taxes on Plus taxes indirectes/impôts sur les 19.4 4.0 9.5 9.9 4.4 11.2 -2.4 1.6 3.8 products, less subsidies produits, moins les subventions Gross domestic product at market Produit intérieur brut aux prix du 8.5 14.3 33.7 8.6 0.8 2.6 -1.8 -1.1 6.1 prices marché 2008: semi-final 2009: Provisional 2010:Estimated 2008: semi-définitif 2009: provisoire 2010:Estimée African Statistical Yearbook 2011 / Annuaire Statistique pour l'Afrique 2011
  • 128.
    Chad Tchad Expenditure on Gross domestic product at constant purchasers' Emplois du produit intérieur brut aux prix constants d'acquisition values Annual Growth Rates (%) Taux de croissance annuel (%) Consommation finale des Government final consumption 16.0 1.0 4.8 17.3 19.2 43.6 17.6 10.5 0.4 administrations publiques Private final consumption 6.5 4.5 37.2 8.6 6.2 17.5 -15.6 -4.2 -13.5 Consommation finale privée Gross fixed capital formation 162.5 -24.7 -4.6 -6.4 5.0 -4.7 6.0 21.4 26.0 Formation brute de capital fixe Exports of goods and services 13.7 -3.5 90.3 10.9 -1.5 -4.6 -8.2 24.8 -7.9 Exportations de biens et services Moins importations de biens et Less imports of goods and services 168.4 -33.9 -0.5 -6.1 15.3 19.6 -12.2 27.3 -0.2 services III INFLATION 2002 2003 2004 2005 2006 2007 2008 2009 2010 Annual Growth Rates (%) Taux de croissance annuel (%) All Item 5.2 -1.8 -5.3 7.9 8.0 -9.0 8.3 10.1 0.6 Ensemble Food 0.1 0.0 -0.1 0.1 0.1 -0.1 ... ... ... Alimentation Health 0.0 0.1 0.0 0.0 0.0 0.0 ... ... ... Santé Energy 0.2 0.1 -0.1 0.1 0.1 -0.1 ... ... ... Energie Transport 0.1 0.0 0.0 0.0 0.0 0.1 ... ... ... Transport IV AGRICULTURAL PRODUCTION - PRODUCTION AGRICOLE 2002 2003 2004 2005 2006 2007 2008 2009 2010 Tons (Thousand) Tonnes (milliers) Sorghum, Tons (thousands) 481 565 449 583 694 577 685 ... ... Sorgho, tonnes (milliers) Millet, Tons (thousands) 357 516 298 578 590 495 523 ... ... Mil, tonnes (milliers) Groundnuts, in shells, Tons Arachides, en coques, tonnes 450 450 450 450 450 450 ... ... ... (thousands) (milliers) Cereals, nes, Tons (thousands) 151 290 267 339 338 584 406 ... ... Céréales, nda, tonnes (milliers) Cassava, Tons (thousands) 322 325 325 325 325 330 ... ... ... Manioc, tonnes (milliers) V MINING PRODUCTION - PRODUCTION MINIERE 127 2002 2003 2004 2005 2006 2007 2008 2009 2010 Crude petroleum, metric tons Pétrole brut, tonnes métriques ... 1 798.1 8 505.3 8 808.0 7 873.6 7 189.6 ... ... ... (thousands) (milliers) ... ... ... ... ... ... ... ... ... ... ... ... ... ... ... ... ... ... VI ENERGY - ENERGIE 2002 2003 2004 2005 2006 2007 2008 2009 2010 Electricity - total hydro production, Électricité - production hydraulique ... ... ... ... ... ... ... ... ... kilowatt hours (millions) totale, kilowatt-heures (millions) Electricity - total thermal production, Électricité - production thermique 93.0 94.0 97.0 100.0 102.0 105.0 ... ... ... kilowatt hours (millions) totale, kilowatt-heures (millions) Electricity - total production, self- Electricité - Production totale privée ... ... ... ... ... ... ... ... ... producer (Million Kilowatt Hours) (million de kilowatt heures) Electricity - total production, public Electricité - Production totale 93 94 97 100 102 105 ... ... ... (Million Kilowatt Hours) publique (million de kilowatt heures) African Statistical Yearbook 2011 / Annuaire Statistique pour l'Afrique 2011
  • 129.
    Chad Tchad VII TOURISM AND INFRASTRUCTURE - TOURISME ET INFRASTUCTURE 2002 2003 2004 2005 2006 2007 2008 2009 2010 Arrivals - Tourists (thousands) 32 21 26 29 16 25 ... ... ... Arrivées - touristes (milliers) Rooms in hotels and similar Chambres d'hotels et établissements establishments (thousands) 1 1 1 1 ... ... ... ... ... assimilés (milliers) Paved Road (% of total) ... ... ... ... ... ... ... ... ... Routes asphaltées (% du total) Total Network (Railways-km) ... ... ... ... ... ... ... ... ... Réseau total voies ferrées-Km Main Telephone Lines (per 1,000 Lignes téléphoniques fixes (pour 1 1 1 1 1 1 1 ... ... inhabitants) 1000 habitants) Mobile Cellular Subscribers (per Abonnés aux téléphones mobiles 4 7 13 21 45 86 166 ... ... 1,000 inhabitants) (pour 1000 habitants) VII FINANCIAL AND MONETARY STATISTICS - FINANCES ET STATISTIQUES MONETAIRES 2002 2003 2004 2005 2006 2007 2008 2009 2010 VII-1 Monetary Statistics VII-1 Statistiques monétaires CFA Franc (Billions) Franc CFA (Milliards) Money supply (M1) 177 171 175 232 358 390 441 443 558 Masse monétaire (M1) Quasi-money 12 11 13 16 20 25 30 33 41 Quasi-monnaie of which Demand Deposit ... ... ... ... ... ... ... ... ... dont Monnaie scripturale Net foreign assets 71 39 49 71 259 410 616 238 299 Avoirs extérieurs nets Domestic credit 152 172 177 215 160 37 - 100 268 360 Crédit intérieur of which claims on private sector 56 67 73 88 85 98 140 167 197 dont créances sur le secteur privé of which Claims on government dont créances nettes sur le 72 74 84 85 23 - 85 - 278 64 131 sector, net gouvernement International reserves (millions of US Réserves internationales (millions de 219 187 222 226 625 955 1 345 617 712 $) $ EU) Average Exchange Rate (National Taux de change (moyen) (monnaie 696.99 581.20 528.29 527.47 522.89 479.27 447.81 472.19 495.28 Currency per us $) nationale par dollars) VII-2 Public Finance VII-2 Finances publiques CFA Franc (Billions) Franc CFA (Milliards) Total Revenues and Grants 204 260 358 394 625 814 1 043 666 785 Recettes totales et dons Tax Revenue 103 126 216 280 556 752 977 612 ... Recettes fiscales Non Tax Revenue 9 7 10 10 6 13 9 8 ... Recettes non fiscales 128 Grants 92 127 132 104 63 49 56 46 ... Dons Total Expenditures and Net Lending 287 329 412 405 542 731 842 1 034 1 278 Dépenses totales et prêts nets Current expenditure 138 134 140 187 343 464 579 716 ... Dépenses courantes Of which Wages and Salaries 49 56 62 73 85 153 184 231 ... Dont rémunérations et salaires Capital expenditure 150 195 272 218 199 245 296 318 ... Dépenses d'équipement Net Lending 0 0 0 0 0 21 - 32 0 ... Prêts nets Fiscal Balance - 83 - 69 - 54 - 11 83 84 200 - 368 - 493 Solde global y compris les dons VII-3 Balance of Payments VII-3 Balance des paiements CFA Franc (Millions) Franc CFA (Millions) Trade balance - 916 900 - 136 238 657 297 1 157 659 1 047 064 895 792 1 083 730 173 445 672 372 Balance commerciale Services Balance - 420 542 - 448 402 - 859 386 - 943 837 -1 033 061 - 899 246 - 862 946 - 900 704 - 951 124 Balance des services Net Income - 41 460 - 260 746 - 313 440 - 304 343 110 802 - 378 777 - 326 225 - 93 585 - 407 845 Revenus nets Current transfers, net total 60 350 57 238 115 794 164 287 70 935 260 034 225 497 252 117 167 697 Transferts courants Current account balance -1 318 552 - 788 148 - 399 734 73 766 195 740 - 122 197 120 056 - 568 728 - 518 900 Solde du compte courant VII-4 External Debt and Financial Flows VII-4 Dette extérieure et flux financiers US $ (Millions) $ E.U (Millions) Total external debt 1 224 1 385 1 638 1 625 1 805 1 765 1 625 1 701 2 123 Dette extérieure totale Private 0 0 0 0 0 0 0 0 0 Privée Public 1 224 1 385 1 638 1 625 1 805 1 765 1 625 1 701 2 123 Publique Total external debt service 36 53 46 57 71 57 157 80 100 Service de la dette extérieure Net Foreign Direct Investment Investissements étranger direct (flux 924 713 467 - 99 - 279 - 69 234 462 ... Inflows nets entrants) Net Total Official Development Aide publique au développement 229 252 337 380 288 358 419 561 ... assistance (nette totale) African Statistical Yearbook 2011 / Annuaire Statistique pour l'Afrique 2011
  • 130.
    Chad Tchad 2002 2003 2004 2005 2006 2007 2008 2009 2010 US $ (Millions) Franc CFA Exports, fob Exportations, fàb Exports - Total 185 602 2 199 3 142 3 410 3 677 4 275 2 160 ... Exportations - Total Main Products Principaux produits Oils petroleum, bituminous, Huiles de pétrole, bitumineux, 0 4 93 424 97 27 136 ... ... distillates, except crude distilles, sauf brut Lumber, tropical hardwood nes, Bois d'oeuvre, nda feuillus tropicaux, ... ... ... ... ... ... 0 ... ... sawn lengthwise >6mm sciés longitudinalement> 6 mm Cotton, not carded, or combed 49 64 81 68 76 64 36 ... ... Coton, non cardé ni peigné Logs, non-coniferous nes ... ... ... ... ... ... ... ... ... Grumes, non-conifères Coffee, not roasted, not ... ... ... ... ... ... ... ... ... Café, non torréfié, non décaféiné decaffeinated Main Destinations Principales destinations United States 6.3 24.7 827.8 1 580.1 2 021.3 2 239.9 3 470.8 ... ... États-Unis China 1.5 2.8 222.6 191.1 260.3 84.1 41.6 ... ... Chine United Kingdom 0.2 0.1 203.0 153.2 0.5 1.4 1.3 ... ... Royaume-Uni Japan 0.1 0.0 0.1 0.0 12.2 94.9 195.8 ... ... Japon Taiwan, China 0.7 2.9 0.8 82.4 57.1 0.5 102.5 ... ... Taiwan, Chine 2002 2003 2004 2005 2006 2007 2008 2009 2010 Imports, cif Importations, cif Imports - Total ... ... ... ... ... ... ... ... ... Importations - Total (millions) 129 Principaux produits Main Products Parts of boring or sinking machinery, Pièces du forage ou de fonçage, 12 31 31 41 41 48 43 ... ... whether or not self-propelled qu'ils soient ou non autopropulsés Wheat or meslin flour 9 10 8 8 9 18 23 ... ... Blé ou méteil Smokg tobacco,whether o not cntg Smokg tabac, si o CNTG succédanés 5 3 9 9 10 0 21 ... ... tobacco substitutes in any proportion de tabac en toute proportion Les véhicules automobiles à usages Special purpose motor vehicles nes 3 1 1 0 1 1 17 ... ... spéciaux nda Tobacco, unmanufactured, stemmed 0 0 0 0 0 0 14 ... ... Tabac, artisanal, filtre, ou emballe or stripped Main Origin Principales provenances France 126.9 88.9 81.2 93.8 90.1 132.7 144.2 ... ... France United States 127.3 64.4 40.4 53.8 60.3 71.1 62.5 ... ... États-Unis Germany 22.2 12.1 22.9 13.2 34.6 48.2 44.2 ... ... Allemagne China 1.7 1.7 5.9 14.9 14.1 69.7 79.9 ... ... Japon Cameroon 39.0 45.9 27.7 26.2 28.7 0.0 0.0 ... ... Cameroun African Statistical Yearbook 2011 / Annuaire Statistique pour l'Afrique 2011
  • 131.
    Comoros Comores AREA (KM 2) 2 235 SUPERFICIE (KM 2) CAPITAL CITY Moroni Moroni CAPITALE CURRENCY Comoros Franc Franc Comorien MONNAIE I SOCIAL AND DEMOGRAPHIC INDICATORS — INDICATEURS DEMOGRAPHIQUES ET SOCIAUX 2002 2003 2004 2005 2006 2007 2008 2009 2010 Population Population Population au milieu de l'année - Mid-year population - Total (Million) 0.6 0.6 0.6 0.6 0.6 0.6 0.7 0.7 ... Total (million) Population au milieu de l'année - Mid-year population - Urban (%) 36.0 27.9 28.6 29.4 30.1 30.8 31.5 32.3 ... Urbaine (%) Female (%) 51.4 50.4 50.3 50.3 50.3 50.2 50.2 50.2 ... Femme (%) Population by Age Group Population par groupe d'âge 0-14 257 191 265 315 268 627 271 262 273 413 275 483 277 997 282 295 ... 0-14 15-64 18 336 284 146 294 472 305 422 317 240 330 027 343 538 356 142 ... 15-64 65+ 296 241 26 199 26 650 27 762 29 099 30 159 30 667 30 890 ... 65+ Active Population (000) 158.6 145.6 133.1 141.0 149.3 158.1 167.4 177.4 ... Population active (000) Female (%) 43.3 35.6 43.4 43.3 43.3 43.5 43.6 43.6 ... Femme (%) Taux brut de natalité - Total (par Crude birth rate - Total (per 1000) 33.1 35.6 33.6 33.7 33.7 33.8 33.8 33.8 ... 1000) Taux brut de mortalité - Total (par Crude death rate - Total (per 1000) 7.7 7.9 8.4 8.1 7.8 7.6 7.4 7.2 ... 1000) Life expectancy at birth - Total Espérance de vie à la naissance - 62.8 65.5 64.6 65.0 65.4 65.8 66.2 66.5 ... (years) Total (années) Net reproduction rate - (per Taux net de reproduction - (par ... 2.6 2.7 2.5 2.5 2.5 2.4 2.4 ... woman) femme) Indice synthétique de fécondité - Total fertility rate - (p woman) y (per ) 4.2 5.3 5.2 5.2 5.1 5.0 5.0 4.9 ... (par femme) Education Enseignement Teaching staff at first level - Total Personnel enseignant - 1er degré - ... 2.1 2.2 3.0 2.4 2.1 3.7 2.5 ... (thousands) Total (milliers) Teaching staff at second level - Total Personnel enseignant - 2ème degré - 130 ... 0.3 0.3 0.4 0.4 0.4 0.5 0.5 ... (thousands) Total (milliers) Teaching staff at third level - Total Personnel enseignant - 3ème degré - ... ... ... ... ... ... ... ... ... (thousands) Total (milliers) First level student enrollment - Total Elèves inscrits - 1er degré - Total ... 76 80 84 87 91 94 96 ... (thousands) (milliers) First level student enrollment - Elèves inscrits - 1er degré - Femmes 46 46 48 49 ... ... ... ... ... Female (thousands) (milliers) Second level student enrollment - Elèves inscrits - 2ème degré - Total 34 12 13 14 16 17 19 20 ... Total (thousands) (milliers) Second level student enrollment - Elèves inscrits - 2ème degré - 15 17 18 18 ... ... ... ... ... Female (thousands) Femmes (milliers) Third level student enrollment - Total Elèves inscrits - 3ème degré - Total ... 1.7 1.8 ... ... ... ... ... ... (thousands) (milliers) Third level student enrollment - Elèves inscrits - 3ème degré - ... 0.7 0.8 ... ... ... ... ... ... Female (thousands) Femmes (milliers) Public expenditure on education (% Dépenses publiques consacrées à 18.3 15.2 15.0 15.6 17.7 13.6 ... ... ... of budget) l'enseignement (% du budget) Health Santé Hospital beds - Total (per 10 000 Nombre de lits d'hôpitaux - Total ... ... ... ... ... ... ... ... ... population) (pour 10 000) Nurses - Total (per 10 000 Nombre d'infirmières - Total (pour ... ... ... ... ... ... ... ... ... population) 10 000) Physicians - Total (per 10 000 Nombre de médecins - Total (pour ... ... ... ... ... ... ... ... ... population) 10 000) Public expenditure on Health (% of Dépenses publiques consacrées à la ... ... ... ... ... ... ... ... ... budget) santé (% du budget) African Statistical Yearbook 2011 / Annuaire Statistique pour l'Afrique 2011
  • 132.
    Comoros Comores II NATIONAL ACCOUNTS — COMPTES NATIONAUX 2002 2003 2004 2005 2006 2007 2008 2009 2010 Gross domestic product by kind of economic activity at current prices Produit intérieur brut par branche d'activité économique aux prix courants Comoros Franc (Millions) Franc Comorien(Millions) Agriculture 53 000 56 882 59 933 62 033 65 254 67 874 68 320 80 902 85 351 Agriculture Mining and quarrying ... ... ... ... ... ... ... ... ... Industries extractives Manufacturing 5 400 5 795 6 106 6 125 6 441 6 780 6 653 7 012 7 398 Industries manufacturières Electricity, gas & water 2 000 2 146 2 262 2 408 2 767 2 676 2 495 2 630 2 774 Electricité, gaz et eau Construction 7 837 8 411 8 862 9 243 9 348 8 639 9 696 10 220 10 782 Bâtiments et travaux publics Wholesale & retail trade, Commerce de gros et de détail, 33 000 35 417 37 317 38 120 42 361 45 830 54 068 48 095 50 740 restaurants, hotels restaurants et hôtels Banques, assurances, affaires Finance, insurance, real estate, etc. 5 800 6 225 6 569 6 697 6 918 6 882 7 524 7 930 8 366 immobilières Transport and communications 6 652 7 139 7 522 7 652 7 934 8 352 8 154 8 594 9 067 Transport(s) et communications Administrations publiques et Public administration and defense 17 949 19 264 20 297 21 253 21 409 22 534 21 301 22 451 23 686 défense Other services 692 743 783 853 827 869 896 944 996 Autres services Moins Services d’intermédiation Less Imputed Service Charges - 3 350 - 3 596 - 3 788 - 3 908 - 3 996 - 4 206 - 4 346 - 4 580 - 4 832 financière Gross domestic product at factor Produit intérieur brut aux couts des 128 980 138 426 145 863 150 476 159 264 166 229 174 761 184 198 194 329 cost / basic prices facteurs / prix de base Plus: Indirect Taxes / taxes on Plus taxes indirectes/impôts sur les ... ... ... ... ... ... ... ... ... products, less subsidies produits, moins les subventions Expenditure on Gross domestic product at current purchaser's values Emploi du produit intérieur brut aux prix courants d'acquisition Comoros Franc (Millions) Franc Comorien(Millions) Consommation finale des Government final consumption 20 538 19 297 19 275 19 463 21 255 21 455 20 322 21 419 22 597 administrations publiques Private final consumption 106 192 121 678 136 202 147 273 157 535 169 463 177 660 187 254 197 553 Consommation finale privée Gross fixed capital formation 13 300 13 566 14 421 15 524 18 920 16 269 21 116 22 261 23 485 Formation brute de capital fixe Increase in inventories 2 500 2 500 2 500 2 500 2 850 2 909 3 040 3 204 3 380 Variation des stocks Exports of goods and services 20 192 11 695 7 382 4 757 3 893 4 936 5 330 5 613 5 922 Exportations de biens et services Moins importations de biens et 131 Less imports of goods and services 33 743 30 311 33 917 39 041 45 189 48 803 52 707 55 553 58 609 services GDP at purchasers' values 128 980 138 426 145 863 150 476 159 264 166 229 174 761 184 198 194 329 PIB aux prix d'acquisition Gross domestic product by kind of economic activity at constant Produit intérieur brut par branche d'activité economique aux prix constants prices Annual Growth Rates (%) Taux de croissance annuel (%) Agriculture 2.7 2.9 2.7 3.0 2.6 2.3 1.7 1.1 1.8 Agriculture Mining and quarrying ... ... ... ... ... ... ... ... ... Industries extractives Manufacturing -0.6 2.5 1.0 2.7 3.0 -7.4 -3.9 2.1 1.8 Industries manufacturières Electricity, gas & water -3.0 2.5 5.0 1.9 2.1 -10.5 -8.1 1.2 1.8 Electricité, gaz et eau Construction 10.8 3.9 0.5 2.5 3.1 -0.8 -3.7 1.2 1.8 Bâtiments et travaux publics Wholesale & retail trade, Commerce de gros et de 0.8 1.8 0.5 3.6 3.3 1.6 1.3 1.2 1.8 restaurants, hotels détail,restaurants et hôtels Banques, assurances, affaires Finance, insurance, real estate, etc. 3.3 2.1 1.5 2.5 3.1 1.7 3.7 1.2 1.8 immobilières Transport and communications 2.1 2.5 3.0 2.8 3.1 -4.6 -6.5 1.2 1.8 Transport(s) et communications Administrations publiques et Public administartion and defense 2.1 -1.0 1.2 1.0 0.6 -0.8 -1.7 1.2 1.8 défense Other services 2.1 0.5 1.0 0.7 1.7 -0.3 -7.0 1.5 1.8 Autres services Moins Services d’intérmediation Less Imputed Service Charges 12.9 8.6 1.0 1.0 0.6 -199.2 8.5 -201.2 1.8 financière Gross domestic product at factor Produit intérieur brut aux couts des 2.3 2.1 1.9 2.8 2.6 5.2 0.6 -3.4 1.8 cost / basic prices facteurs / prix de base Plus: Indirect Taxes / taxes on Plus taxes indirectes/impôts sur les ... ... ... ... ... ... ... ... ... products, less subsidies produits, moins les subventions Gross domestic product at market Produit intérieur brut aux prix du 2.3 2.1 1.9 2.8 2.6 5.2 0.6 -3.4 1.8 prices marché 2009: Provisional 2010:Estimated 2009: provisoire 2010:Estimée African Statistical Yearbook 2011 / Annuaire Statistique pour l'Afrique 2011
  • 133.
    Comoros Comores Expenditure on Gross domestic product at constant purchasers' Emplois du produit intérieur brut aux prix constants d'acquisition values Annual Growth Rates (%) Taux de croissance annuel (%) Consommation finale des Government final consumption 4.1 -6.0 -3.2 -2.4 0.0 14.3 -8.9 1.2 1.8 administrations publiques Private final consumption 2.0 8.1 6.2 8.2 3.1 4.3 6.4 -3.3 1.8 Consommation finale privée Gross fixed capital formation -3.2 -22.7 14.2 3.2 15.8 -3.6 3.6 1.2 1.8 Formation brute de capital fixe Exports of goods and services 3.1 -30.1 -34.5 -38.1 -20.2 88.8 3.8 1.2 1.8 Exportations de biens et services Moins importations de biens et Less imports of goods and services -2.1 -10.1 5.4 11.6 5.6 11.9 18.7 1.2 1.8 services III INFLATION 2002 2003 2004 2005 2006 2007 2008 2009 2010 Annual Growth Rates (%) Taux de croissance annuel (%) All Item 3.6 3.7 4.5 2.0 4.5 4.4 4.9 -3.1 2.1 Ensemble Food 6.8 3.3 3.2 0.8 3.9 7.0 4.9 -7.5 ... Alimentation Health 0.0 0.0 16.5 -3.8 0.8 -14.7 4.8 20.8 ... Santé Energy ... ... ... ... ... ... ... ... ... Energie Transport -1.7 6.7 5.2 -0.6 -1.5 4.5 4.8 7.5 ... Transport IV AGRICULTURAL PRODUCTION - PRODUCTION AGRICOLE 2002 2003 2004 2005 2006 2007 2008 2009 2010 Tons (Thousand) Tonnes (milliers) Coconuts, Tons (thousands) 61 77 77 78 77 77 ... ... ... Noix de coco, tonnes (milliers) Cassava, Tons (thousands) 55 56 43 44 45 45 46 47 ... Manioc, tonnes (milliers) Sweet Potatoes, Tons (thousands) 4 16 16 17 17 18 18 18 ... Patate douce, tonnes (milliers) Taro, Tons (thousands) 9 ... ... ... ... ... ... ... ... Taro, tonnes (milliers) Yams, Tons (thousands) 1 11 20 20 21 21 22 22 ... Produit 5: igname V MINING PRODUCTION - PRODUCTION MINIERE 132 2002 2003 2004 2005 2006 2007 2008 2009 2010 ... ... ... ... ... ... ... ... ... ... ... ... ... ... ... ... ... ... ... ... ... ... ... ... ... ... ... VI ENERGY - ENERGIE 2002 2003 2004 2005 2006 2007 2008 2009 2010 Electricity - total hydro production, Électricité - production hydraulique 2.9 3.6 3.8 3.5 3.3 3.4 ... ... ... kilowatt hours (millions) totale, kilowatt-heures (millions) Electricity - total thermal production, Électricité - production thermique 30.0 31.0 39.0 43.0 46.0 48.0 ... ... ... kilowatt hours (millions) totale, kilowatt-heures (millions) Electricity - total production, self- Electricité - Production totale privée ... ... ... ... ... ... ... ... ... producer (Million Kilowatt Hours) (million de kilowatt heures) Electricity - total production, public Electricité - Production totale 33 35 44 48 51 50 ... ... ... (Million Kilowatt Hours) publique (million de kilowatt heures) African Statistical Yearbook 2011 / Annuaire Statistique pour l'Afrique 2011
  • 134.
    Comoros Comores VII TOURISM AND INFRASTRUCTURE - TOURISME ET INFRASTUCTURE 2002 2003 2004 2005 2006 2007 2008 2009 2010 Arrivals - Tourists (thousands) 18.7 14.2 17.6 19.5 17 14.5 ... ... ... Arrivées - touristes (milliers) Rooms in hotels and similar Chambres d'hotels et établissements establishments (thousands) 0.094 0.187 0.187 0.164 0.164 0.164 ... ... ... assimilés (milliers) Paved Road (% of total) ... ... ... ... ... ... ... 77 ... Routes asphaltées (% du total) Total Network (Railways-km) ... ... ... ... ... ... ... 884 ... Réseau total voies ferrées-Km Main Telephone Lines (per 1,000 Lignes téléphoniques fixes (pour 18 22 17 20 23 26 29 30 ... inhabitants) 1000 habitants) Mobile Cellular Subscribers (per Abonnés aux téléphones mobiles 0 3 14 25 59 62 64 ... ... 1,000 inhabitants) (pour 1000 habitants) VII FINANCIAL AND MONETARY STATISTICS - FINANCES ET STATISTIQUES MONETAIRES 2002 2003 2004 2005 2006 2007 2008 2009 2010 VII-1 Monetary Statistics VII-1 Statistiques monétaires Comoros Franc (Millions) Franc Comorien(Millions) Money supply (M1) 24 865 24 458 23 036 21 597 28 384 32 141 34 769 35 754 40 423 Masse monétaire (M1) Quasi-money 11 426 11 082 11 476 15 351 13 184 13 400 16 024 21 817 25 986 Quasi-monnaie of which Demand Deposit ... ... ... ... ... ... ... ... ... dont Monnaie scripturale Net foreign assets 41 018 38 553 38 011 37 799 40 166 43 156 40 203 44 114 44 156 Avoirs extérieurs nets Domestic credit 11 387 13 542 11 394 15 997 17 367 19 413 27 503 37 172 41 863 Crédit intérieur of which claims on private sector 9 980 12 067 10 255 13 381 13 449 15 282 19 460 28 048 35 266 dont créances sur le secteur privé of which Claims on government dont créances nettes sur le 1 258 450 891 1 959 2 871 2 938 5 246 7 266 4 382 sector, net gouvernement International reserves (millions of US Réserves internationales (millions de 80 94 104 86 94 117 112 150 138 $) $ EU) Average Exchange Rate (National Taux de change (moyen) (monnaie 522.74 435.90 396.21 395.60 392.17 359.45 335.85 354.14 371.46 Currency per us $) nationale par dollars) VII-2 Public Finance VII-2 Finances publiques Comoros Franc (Millions) Franc Comorien(Millions) Total Revenues and Grants 26 929 25 482 26 434 30 509 29 533 32 577 41 965 44 775 56 951 Recettes totales et dons Tax Revenue 18 038 19 622 19 407 17 797 17 259 16 678 18 288 21 089 ... Recettes fiscales Non Tax Revenue 3 483 2 713 3 038 6 175 4 296 4 482 5 091 5 313 ... Recettes non fiscales Grants 5 408 3 147 3 989 6 537 7 978 11 417 18 586 18 374 ... Dons 133 Total Expenditures and Net Lending 31 768 30 347 28 847 30 425 32 971 37 960 46 338 43 347 48 250 Dépenses totales et prêts nets Current expenditure 24 172 22 769 22 546 23 523 25 393 23 896 29 855 35 971 ... Dépenses courantes Of which Wages and Salaries 10 703 11 493 12 631 12 872 13 250 15 392 15 690 16 932 ... Dont rémunérations et salaires Capital expenditure 7 597 7 578 6 301 6 902 7 578 10 663 16 484 8 939 ... Dépenses d'équipement Net Lending - 69 ... ... ... ... ... ... ... ... Prêts nets Fiscal Balance 1 441 719 - 752 1 650 - 1 652 - 5 187 - 6 628 - 6 682 8 701 Solde global y compris les dons VII-3 Balance of Payments VII-3 Balance des paiements Comoros Franc (Millions) Franc Comorien(Millions) Trade balance - 17 397 - 15 193 - 22 729 - 30 927 - 34 288 - 40 039 - 56 009 - 54 427 ... Balance commerciale Services Balance - 1 537 - 2 760 - 2 059 - 1 227 - 3 181 - 3 392 - 4 562 - 9 947 ... Balance des services Net Income 1 042 - 1 282 - 1 520 - 1 367 - 663 598 - 965 - 4 ... Revenus nets Current transfers, net total 16 530 11 215 18 107 22 903 29 301 31 178 38 375 45 967 ... Transferts courants Current account balance - 1 362 - 8 020 - 8 201 - 10 618 - 8 831 - 11 655 - 23 161 - 18 411 ... Solde du compte courant VII-4 External Debt and Financial Flows VII-4 Dette extérieure et flux financiers US $ (Millions) $ E.U (Millions) Total external debt 147 147 147 147 148 89 87 87 ... Dette extérieure totale Private 0 0 0 0 0 0 0 0 ... Privée Public 147 147 147 147 148 89 87 87 ... Publique Total external debt service 4 4 4 4 4 4 3 3 ... Service de la dette extérieure Net Foreign Direct Investment Investissements étranger direct (flux 0 1 1 1 1 8 8 ... ... Inflows nets entrants) Net Total Official Development Aide publique au développement 32 24 26 23 31 44 37 ... ... assistance (nette totale) African Statistical Yearbook 2011 / Annuaire Statistique pour l'Afrique 2011
  • 135.
    Comoros Comores 2002 2003 2004 2005 2006 2007 2008 2009 2010 Comoros Franc (Millions) Franc Comorien Exports, fob Exportations, fàb Exports - Total ... 13 082 8 243 5 691 5 221 5 929 3 063 5 618 ... Exportations - Total Main Products Principaux produits Vanilla 7 189 3 995 2 809 1 166 543 202 264 726 ... Vanille Nails of girofle 2 809 29 157 146 276 220 998 766 ... Clous de giroffe Ylang-Ylang 1 351 664 200 747 80 193 ... ... ... Ylang-Ylang Other products 312 ... ... 101 22 ... ... ... ... Autres produits ... ... ... ... ... ... ... ... ... Main Destinations Principales destinations France 5 161.5 7 333.9 2 801.2 2 826.7 2 541.3 3 297.4 3 572.9 ... ... France United States 2 828.1 1 789.8 6 572.7 589.5 627.5 202.1 326.8 ... ... États-Unis Singapore 1 853.3 682.9 2 451.6 1 697.6 1 070.7 1 092.6 931.4 ... ... Singapour Germany 3 075.2 3 212.9 681.9 1 457.5 827.8 552.7 485.9 ... ... Allemagne Turkey 3.1 1.0 727.1 238.3 681.8 4 576.0 2 027.1 ... ... Turquie 2002 2003 2004 2005 2006 2007 2008 2009 2010 Imports, cif Importations, cif 134 Imports - Total ... 30 311 33 749 38 952 45 249 49 716 60 323 74 532 ... Importations - Total (millions) Principaux produits Main Products Rice 4 117 2 866 2 313 578 2 092 3 044 4 721 3 747 ... Riz Meat 2 361 2 790 3 099 3 781 2 588 1 700 3 293 1 846 ... Viande Petroleum Products 5 963 5 949 584 4 897 3 329 225 137 78 ... Produits Petroliers Iron and Steel 1 109 1 313 1 773 2 694 2 627 1 015 3 162 4 266 ... Fer et Acier 1 175 661 811 1 360 2 899 4 293 1 627 1 983 ... Main Origin Principales provenances France 14 529.9 14 553.7 9 693.4 9 143.8 12 566.9 9 290.7 9 684.2 ... ... France United Arab Emirates ... ... ... 7 057.7 ... 12 525.7 10 380.7 ... ... Émirats arabes unis South Africa 6 613.1 7 057.5 4 589.3 2 964.8 3 246.0 4 384.1 2 226.0 ... ... Afrique du Sud Pakistan 1 202.6 633.8 1 969.3 2 639.3 3 657.7 2 381.4 4 286.0 ... ... Allemagne China 398.6 302.2 512.9 723.1 2 428.2 2 766.7 8 561.9 ... ... Chine African Statistical Yearbook 2011 / Annuaire Statistique pour l'Afrique 2011
  • 136.
    Congo Congo AREA (KM 2) 342 000 SUPERFICIE (KM 2) CAPITAL CITY Brazzaville Brazzaville CAPITALE CURRENCY CFA Franc Franc CFA MONNAIE I SOCIAL AND DEMOGRAPHIC INDICATORS — INDICATEURS DEMOGRAPHIQUES ET SOCIAUX 2002 2003 2004 2005 2006 2007 2008 2009 2010 Population Population Population au milieu de l'année - Mid-year population - Total (Million) 3.2 3.3 3.3 3.4 3.5 3.6 3.6 3.7 3.8 Total (million) Population au milieu de l'année - Mid-year population - Urban (%) 59.1 59.4 59.8 60.2 60.6 60.9 61.3 61.7 62.1 Urbaine (%) Female (%) 50.2 50.2 50.2 50.1 50.1 50.1 50.1 50.1 50.1 Femme (%) Population by Age Group Population par groupe d'âge 0-14 1335 089 1360 034 1384 673 1408 088 1429 919 1450 474 1470 295 1490 214 1510 786 0-14 15-64 1721 655 1775 121 1828 112 1877 738 1922 878 1964 977 2006 833 2052 479 2104 774 15-64 65+ 122 916 125 614 128 267 130 828 133 276 135 654 138 024 140 489 143 118 65+ Active Population (000) 1 328.0 1 371.4 1 413.7 1 451.2 1 485.7 1 521.9 1 554.4 1 593.5 1 637.2 Population active (000) Female (%) 43.1 43.2 43.3 43.3 43.4 43.4 43.5 43.7 43.8 Femme (%) Taux brut de natalité - Total (par Crude birth rate - Total (per 1000) 37.0 37.0 36.0 35.0 36.0 35.0 34.0 35.0 35.0 1000) Taux brut de mortalité - Total (par Crude death rate - Total (per 1000) 13.0 12.0 12.0 12.0 12.0 11.0 11.0 ... 13.0 1000) Life expectancy at birth - Total Espérance de vie à la naissance - 53.0 53.0 54.0 54.0 55.0 55.0 56.0 ... 54.0 (years) Total (années) Net reproduction rate - (per Taux net de reproduction - (par ... ... ... 2.0 ... ... ... ... 2.0 woman) femme) Indice synthétique de fécondité - Total fertility rate - (p woman) y (per ) 5.0 5.0 5.0 4.0 5.0 5.0 4.0 ... 4.0 (par femme) Education Enseignement Teaching staff at first level - Total Personnel enseignant - 1er degré - 8.18 7.7 7.1 11.4 11.3 10.6 10.9 10.8 ... (thousands) Total (milliers) Teaching staff at second level - Total Personnel enseignant - 2ème degré - 7.97 6.9 6.8 6.9 15.9 15.2 15.6 15.4 ... 135 (thousands) Total (milliers) Teaching staff at third level - Total Personnel enseignant - 3ème degré - 0.7 0.7 0.6 0.6 0.6 0.5 0.6 0.5 ... (thousands) Total (milliers) First level student enrollment - Total Elèves inscrits - 1er degré - Total 525 510 584 597 617 622 619 621 ... (thousands) (milliers) First level student enrollment - Elèves inscrits - 1er degré - Femmes 254 245 281 286 291 258 295 297 ... Female (thousands) (milliers) Second level student enrollment - Elèves inscrits - 2ème degré - Total 191 199 234 263 436 284 360 322 ... Total (thousands) (milliers) Second level student enrollment - Elèves inscrits - 2ème degré - 78 80 109 114 195 128 161 145 ... Female (thousands) Femmes (milliers) Third level student enrollment - Total Elèves inscrits - 3ème degré - Total 12.2 12.5 ... ... ... ... ... ... ... (thousands) (milliers) Third level student enrollment - Elèves inscrits - 3ème degré - 1.9 2.0 ... ... ... ... ... ... ... Female (thousands) Femmes (milliers) Public expenditure on education (% Dépenses publiques consacrées à 9.9 12.0 11.2 11.5 11.4 11.4 11.4 11.4 ... of budget) l'enseignement (% du budget) Health Santé Hospital beds - Total (per 10 000 Nombre de lits d'hôpitaux - Total 62 73 86 101 119 ... ... ... ... population) (pour 10 000) Nurses - Total (per 10 000 Nombre d'infirmières - Total (pour ... ... ... ... ... ... ... ... ... population) 10 000) Physicians - Total (per 10 000 Nombre de médecins - Total (pour 19 20 21 22 ... ... ... ... ... population) 10 000) Public expenditure on Health (% of Dépenses publiques consacrées à la 4 4 5 6 5 ... ... ... ... budget) santé (% du budget) African Statistical Yearbook 2011 / Annuaire Statistique pour l'Afrique 2011
  • 137.
    Congo Congo II NATIONAL ACCOUNTS — COMPTES NATIONAUX 2002 2003 2004 2005 2006 2007 2008 2009 2010 Gross domestic product by kind of economic activity at current prices Produit intérieur brut par branche d'activité économique aux prix courants CFA Franc (Millions) Franc CFA (Millions) Agriculture 131 800 127 500 135 300 145 800 160 100 173 900 192 300 200 000 ... Agriculture Mining and quarrying 1 126 400 1 016 800 1 389 500 2 059 500 2 773 500 2 172 000 2 905 500 2 107 500 ... Industries extractives Manufacturing 112 000 122 400 122 300 128 400 144 500 162 200 181 400 199 200 ... Industries manufacturières Electricity, gas & water 18 500 18 800 19 200 22 200 25 200 28 800 31 100 32 900 ... Electricité, gaz et eau Construction 75 900 84 900 86 500 97 800 109 000 124 200 139 400 158 000 ... Bâtiments et travaux publics Wholesale & retail trade, Commerce de gros et de détail, 167 600 177 800 182 800 199 600 220 200 243 400 269 600 302 000 ... restaurants, hotels restaurants et hôtels Banques, assurances, affaires Finance, insurance, real estate, etc. ... ... ... ... ... ... ... ... ... immobilières Transport and communications 123 400 124 800 134 500 146 300 162 200 180 900 201 900 223 200 ... Transport(s) et communications Administrations publiques et Public administration and defense 147 900 147 200 152 300 159 600 172 900 181 400 191 500 205 300 ... défense Other services 129 300 146 400 165 100 185 000 203 800 222 500 242 000 264 300 ... Autres services Moins Services d’intermédiation Less Imputed Service Charges ... ... ... ... ... ... ... ... ... financière Gross domestic product at factor Produit intérieur brut aux couts des 2 032 800 1 966 600 2 387 500 3 144 200 3 971 400 3 489 300 4 354 700 3 692 400 ... cost / basic prices facteurs / prix de base Plus: Indirect Taxes / taxes on Plus taxes indirectes/impôts sur les 72 100 65 200 68 300 66 400 71 200 74 300 81 000 66 000 ... products, less subsidies produits, moins les subventions Expenditure on Gross domestic product at current purchaser's values Emploi du produit intérieur brut aux prix courants d'acquisition CFA Franc (Millions) Franc CFA (Millions) Consommation finale des Government final consumption 332 400 291 400 311 500 325 300 369 600 412 800 448 100 468 900 ... administrations publiques Private final consumption 763 000 783 800 826 800 876 900 968 900 987 500 1 269 300 1 006 100 ... Consommation finale privée Gross fixed capital formation 448 200 491 800 563 700 775 300 1 152 300 1 426 600 1 775 600 1 928 700 ... Formation brute de capital fixe Increase in inventories 18 200 12 000 13 100 12 500 8 800 20 400 12 500 9 500 ... Variation des stocks Exports of goods and services 1 556 700 1 451 500 1 829 200 2 542 200 3 207 000 2 845 700 4 086 100 3 052 700 ... Exportations de biens et services 136 Moins importations de biens et Less imports of goods and services 1 013 600 998 700 1 088 500 1 321 600 1 664 000 2 129 400 3 155 900 2 707 500 ... services GDP at purchasers' values 2 104 900 2 031 800 2 455 800 3 210 600 4 042 600 3 563 600 4 435 700 3 758 400 ... PIB aux prix d'acquisition Gross domestic product by kind of economic activity at constant Produit intérieur brut par branche d'activité economique aux prix constants prices Annual Growth Rates (%) Taux de croissance annuel (%) Agriculture 8.6 6.3 4.8 4.4 5.4 5.0 5.6 -4.6 ... Agriculture Mining and quarrying -1.5 -7.2 0.5 12.4 6.8 -17.2 8.9 14.4 ... Industries extractives Manufacturing 17.0 10.0 8.5 8.4 7.4 9.3 7.0 5.5 ... Industries manufacturières Electricity, gas & water 10.4 4.4 2.4 8.8 8.6 10.4 4.1 1.3 ... Electricité, gaz et eau Construction -0.6 2.9 2.9 5.6 7.4 10.3 7.6 8.7 ... Bâtiments et travaux publics Wholesale & retail trade, Commerce de gros et de 13.8 5.0 4.3 4.4 5.9 7.2 6.0 7.5 ... restaurants, hotels détail,restaurants et hôtels Banques, assurances, affaires Finance, insurance, real estate, etc. ... ... ... ... ... ... ... ... ... immobilières Transport and communications 18.3 10.8 7.3 6.1 6.6 8.1 6.7 6.1 ... Transport(s) et communications Administrations publiques et Public administartion and defense 2.2 0.1 2.1 4.3 4.7 4.9 3.0 2.9 ... défense Other services 2.9 10.0 7.9 6.1 5.7 5.9 4.1 4.8 ... Autres services Moins Services d’intérmediation Less Imputed Service Charges ... ... ... ... ... ... ... ... ... financière Gross domestic product at factor Produit intérieur brut aux couts des 5.0 1.1 3.6 7.9 6.3 -1.7 6.5 6.9 ... cost / basic prices facteurs / prix de base Plus: Indirect Taxes / taxes on Plus taxes indirectes/impôts sur les -5.8 -6.7 5.1 0.3 4.0 1.9 4.3 3.6 ... products, less subsidies produits, moins les subventions Gross domestic product at market Produit intérieur brut aux prix du 4.6 0.8 3.7 7.6 6.2 -1.6 6.4 6.8 ... prices marché African Statistical Yearbook 2011 / Annuaire Statistique pour l'Afrique 2011
  • 138.
    Congo Congo Expenditure on Gross domestic product at constant purchasers' Emplois du produit intérieur brut aux prix constants d'acquisition values Annual Growth Rates (%) Taux de croissance annuel (%) Consommation finale des Government final consumption 21.9 -3.1 7.4 3.6 5.4 -1.0 6.3 4.6 ... administrations publiques Private final consumption 5.1 5.6 4.6 4.1 5.1 9.1 6.5 8.5 ... Consommation finale privée Gross fixed capital formation -13.3 6.3 11.3 36.2 32.3 20.9 4.7 5.2 ... Formation brute de capital fixe Exports of goods and services 0.3 -5.8 0.9 11.9 2.7 -17.2 10.8 -5.8 ... Exportations de biens et services Moins importations de biens et Less imports of goods and services 1.3 -3.0 7.0 18.9 13.9 6.9 8.5 -0.3 ... services III INFLATION 2002 2003 2004 2005 2006 2007 2008 2009 2010 Annual Growth Rates (%) Taux de croissance annuel (%) All Item 3.0 1.7 3.7 2.5 4.7 2.6 5.9 3.8 4.8 Ensemble Food 2.4 -4.7 -4.1 3.4 6.9 5.8 5.8 5.9 ... Alimentation Health 7.4 -2.2 11.4 8.5 4.8 -3.4 0.0 -6.4 ... Santé Energy 0.1 0.7 12.1 2.1 9.1 7.3 3.6 0.6 ... Energie Transport 8.4 11.0 7.5 -1.2 -2.5 -3.4 6.0 4.3 ... Transport IV AGRICULTURAL PRODUCTION - PRODUCTION AGRICOLE 2002 2003 2004 2005 2006 2007 2008 2009 2010 Tons (Thousand) Tonnes (milliers) Tubercule de manioc, tonnes Cassava, Tons (thousands) 787 878 932 1 007 1 072 1 140 1 106 1 123 ... (milliers) Plantain, tons (thousands) 66 70 74 75 75 77 76 76 ... Banane plantain, tonnes (milliers) Mango, Tons (thousands) 26 30 30 32 34 36 35 36 ... Mangue, tonnes (milliers) Groundnuts in shells, Tons Arachides (en coques), tonnes 21 22 22 23 23 24 24 24 ... (thousands) (milliers) Yams, Tons (thousands) 10 11 11 12 12 13 12 12 ... Ignames, tonnes (milliers) V MINING PRODUCTION - PRODUCTION MINIERE 137 2002 2003 2004 2005 2006 2007 2008 2009 2010 Crude petroleum, metric tons Pétrole brut, tonnes métriques 11 674.0 10 705.0 11 209.0 12 268.0 13 899.0 11 374.0 11 000.0 ... ... (thousands) (milliers) Natural gas (terajoules) ... 650.0 769.0 890.0 923.0 824.0 ... ... ... Gaz naturel (térajoules) Gold ores and concentrates Minerais d'or et concentrés 10.0 75.0 160.0 120.0 100.0 ... 1.2 0.8 ... (Kilograms) (Kilogrammes) VI ENERGY - ENERGIE 2002 2003 2004 2005 2006 2007 2008 2009 2010 Electricity - total hydro production, Électricité - production hydraulique 761.8 747.6 801.2 851.3 864.1 855.5 863.7 955.3 ... kilowatt hours (millions) totale, kilowatt-heures (millions) Electricity - total thermal production, Électricité - production thermique 10.0 9.2 9.2 9.1 9.1 9.2 9.0 8.1 ... kilowatt hours (millions) totale, kilowatt-heures (millions) Electricity - total production, self- Electricité - Production totale privée ... ... ... ... ... ... ... ... ... producer (Million Kilowatt Hours) (million de kilowatt heures) Electricity - total production, public Electricité - Production totale 397 760 840 915 935 842 967 1 947 ... (Million Kilowatt Hours) publique (million de kilowatt heures) African Statistical Yearbook 2011 / Annuaire Statistique pour l'Afrique 2011
  • 139.
    Congo Congo VII TOURISM AND INFRASTRUCTURE - TOURISME ET INFRASTUCTURE 2002 2003 2004 2005 2006 2007 2008 2009 2010 Arrivals - Tourists (thousands) 20 23 31 35 63 56 54 ... ... Arrivées - touristes (milliers) Rooms in hotels and similar Chambres d'hotels et établissements establishments (thousands) 3.2 3.5 4 4.6 5 5.2 6.5 7 ... assimilés (milliers) Paved Road (% of total) 6 6 6 6 6 6 6 6 ... Routes asphaltées (% du total) Total Network (Railways-km) 17 795 17 795 11 795 17 795 17 795 17 795 17 795 17 795 ... Réseau total voies ferrées-Km Main Telephone Lines (per 1,000 Lignes téléphoniques fixes (pour 7 2 4 5 5 6 6 ... ... inhabitants) 1000 habitants) Mobile Cellular Subscribers (per Abonnés aux téléphones mobiles 70 101 115 163 263 363 500 ... ... 1,000 inhabitants) (pour 1000 habitants) VII FINANCIAL AND MONETARY STATISTICS - FINANCES ET STATISTIQUES MONETAIRES 2002 2003 2004 2005 2006 2007 2008 2009 2010 VII-1 Monetary Statistics VII-1 Statistiques monétaires CFA Franc (Millions) Franc CFA (Millions) Money supply (M1) 271 235 235 148 278 789 396 194 584 613 623 647 853 396 891 172 1 075 220 Masse monétaire (M1) Quasi-money 20 458 49 443 55 446 62 036 82 889 91 015 126 499 137 412 152 048 Quasi-monnaie of which Demand Deposit ... ... ... ... ... ... ... ... ... dont Monnaie scripturale Net foreign assets 29 776 - 1 510 51 007 452 840 1 035 290 1 102 660 1 870 720 1 823 930 2 166 360 Avoirs extérieurs nets Domestic credit 239 751 265 464 274 217 40 568 - 359 599 - 369 788 - 890 277 - 719 269 - 911 358 Crédit intérieur of which claims on private sector 60 624 75 055 73 022 77 121 84 093 91 045 166 910 217 596 270 777 dont créances sur le secteur privé of which Claims on government dont créances nettes sur le 173 340 183 726 189 170 - 45 567 - 456 103 - 483 901 -1 079 840 - 962 017 -1 197 950 sector, net gouvernement International reserves (millions of US Réserves internationales (millions de 32 35 120 732 1 841 2 174 3 872 3 806 4 288 $) $ EU) Average Exchange Rate (National Taux de change (moyen) (monnaie 696.99 581.20 528.29 527.47 522.89 479.27 447.81 472.19 495.28 Currency per us $) nationale par dollars) VII-2 Public Finance VII-2 Finances publiques CFA Franc (Millions) Franc CFA (Millions) Total Revenues and Grants 575 400 613 500 745 800 1 245 700 1 796 000 1 578 900 2 497 000 1 333 700 2 759 000 Recettes totales et dons Tax Revenue 558 900 598 900 729 100 1 234 700 1 767 200 1 548 500 2 431 000 1 287 000 2 693 000 Recettes fiscales Non Tax Revenue 12 800 4 700 8 800 5 100 23 800 15 200 31 000 32 200 33 000 Recettes non fiscales 138 Grants 3 700 9 900 7 900 5 900 5 000 15 200 35 000 14 500 33 000 Dons Total Expenditures and Net Lending 746 400 604 700 656 300 745 400 1 105 700 1 171 400 1 256 000 1 111 900 1 151 955 Dépenses totales et prêts nets Current expenditure 281 500 221 900 244 600 275 400 342 800 380 700 407 000 387 500 436 000 Dépenses courantes Of which Wages and Salaries 120 400 120 200 122 900 130 000 134 900 141 900 166 000 174 400 190 000 Dont rémunérations et salaires Capital expenditure 181 700 134 800 160 700 170 200 359 300 387 800 471 000 484 100 544 348 Dépenses d'équipement Net Lending 1 600 800 0 0 4 500 0 0 1 000 0 Prêts nets Fiscal Balance - 171 000 8 800 89 500 500 300 690 300 407 500 1 241 000 221 800 1 607 045 Solde global y compris les dons VII-3 Balance of Payments VII-3 Balance des paiements CFA Franc (Millions) Franc CFA (Millions) Trade balance 1 008 427 1 049 250 1 301 905 1 817 204 2 125 343 1 487 250 2 360 647 1 497 951 2 910 201 Balance commerciale Services Balance - 397 169 - 394 617 - 433 301 - 630 921 -1 130 721 -1 316 016 -1 432 314 -1 338 900 -2 015 810 Balance des services Net Income - 463 991 - 340 742 - 501 150 - 832 231 - 915 865 - 834 802 - 959 244 - 796 815 -1 176 846 Revenus nets Current transfers, net total - 15 143 - 10 917 - 11 382 16 052 - 13 380 - 18 087 - 20 987 - 20 987 - 20 987 Transferts courants Current account balance 132 124 302 975 356 071 370 104 65 377 - 681 655 - 51 897 - 658 752 - 303 442 Solde du compte courant VII-4 External Debt and Financial Flows VII-4 Dette extérieure et flux financiers US $ (Millions) $ E.U (Millions) Total external debt 6 067 7 781 9 973 6 283 6 644 7 401 5 648 5 049 1 807 Dette extérieure totale Private 1 162 1 611 1 758 1 644 1 832 558 454 486 978 Privée Public 4 905 6 169 8 215 4 639 4 812 6 842 5 194 4 564 829 Publique Total external debt service 231 158 223 608 564 389 218 143 901 Service de la dette extérieure Net Foreign Direct Investment Investissements étranger direct (flux 131 321 513 1 475 1 925 2 275 2 483 2 083 ... Inflows nets entrants) Net Total Official Development Aide publique au développement 58 69 115 1 425 258 119 485 283 ... assistance (nette totale) African Statistical Yearbook 2011 / Annuaire Statistique pour l'Afrique 2011
  • 140.
    Congo Congo 2002 2003 2004 2005 2006 2007 2008 2009 2010 CFA Franc (Millions) Franc CFA Exports, fob Exportations, fàb Exports - Total 1 479 200 1 592 400 1 813 700 2 503 000 3 412 500 2 744 500 3 628 300 2 898 800 ... Exportations - Total Main Products Principaux produits Crude oil 1 363 801 1 206 642 1 604 245 2 304 094 2 901 774 2 548 936 3 320 876 2 620 811 ... Pétrole brut Wood 111 447 121 224 132 296 115 820 104 910 103 002 79 630 84 122 ... Bois Sugar 8 876 6 064 11 477 17 401 11 538 8 098 9 014 3 933 ... Sucre Cocoa 193 101 11 25 82 92 73 82 ... Cacao Fish and Shrimp 863 592 47 276 1 833 1 578 16 ... ... Poissons et Crevettes Main Destinations Principales destinations France 108 087.0 41 062.0 49 194.0 100 581.0 75 977.0 74 784.0 193 601.0 115 962.0 ... France USA 162 358.0 136 111.0 102 533.0 205 789.0 180 304.0 725 752.0 319 602.0 106 923.0 ... Etats-Unis Italy 26 195.0 25 292.0 13 103.0 76 116.0 96 030.0 44 253.0 83 483.0 9 786.0 ... Italie Netherlands 24 131.0 5 009.0 43 535.0 1 916.0 105 578.0 5 549.0 42 314.0 30 600.0 ... Pays Bas Belgium 8 693.0 1 980.0 2 742.0 321.0 3 280.0 4 077.0 2 085.0 435.0 ... Belgique 2002 2003 2004 2005 2006 2007 2008 2009 2010 Imports, cif Importations, cif Imports - Total 326 547 361 496 441 371 480 404 616 660 806 649 998 975 787 692 ... Importations - Total (millions) 139 Principaux produits Main Products Meat and offal 17 484 20 940 16 150 16 938 11 710 16 644 25 395 5 111 ... Viandes et Abats Mechanical Machinery 79 471 58 054 56 545 3 094 126 746 134 847 94 045 56 295 ... Machine mécanique Book in Box 27 523 27 574 25 115 41 498 48 491 121 608 69 467 7 079 ... Ouvrage en Boite Electrical Machinery 34 800 30 602 28 587 77 455 52 503 58 555 56 109 20 849 ... Machine et app électrique Cars and automobile 22 642 24 053 25 542 26 986 30 396 50 962 46 198 11 060 ... Voitures et automobile Main Origin Principales provenances France 115 473.0 113 580.0 98 666.0 164 469.0 191 005.0 269 117.0 168 468.0 47 287.0 ... France USA 50 349.0 42 341.0 40 098.0 26 707.0 37 004.0 45 486.0 38 843.0 22 023.0 ... Etats-Unis Hungary 142.0 213.0 148.0 20.0 252.0 13.0 387.0 ... ... Hongrie Netherlands 20 149.0 14 861.0 10 813.0 20 710.0 19 982.0 40 528.0 73 958.0 6 147.0 ... Pays Bas Belgium and Luxembourg 22 087.0 17 709.0 9 964.0 14 668.0 73 534.0 114 642.0 122.0 16 208.0 ... Belgique et Luxembourg African Statistical Yearbook 2011 / Annuaire Statistique pour l'Afrique 2011
  • 141.
    Congo, Dem. Republic Rép. Démocratique du Congo AREA (KM 2) 2 345 409 SUPERFICIE (KM 2) CAPITAL CITY Kinshasa Kinshasa CAPITALE CURRENCY Congolese Franc Franc Congolais MONNAIE I SOCIAL AND DEMOGRAPHIC INDICATORS — INDICATEURS DEMOGRAPHIQUES ET SOCIAUX 2002 2003 2004 2005 2006 2007 2008 2009 2010 Population Population Population au milieu de l'année - Mid-year population - Total (Million) 55.7 57.6 59.6 61.6 63.7 65.8 68.1 70.4 ... Total (million) Population au milieu de l'année - Mid-year population - Urban (%) ... ... 60.0 60.0 61.0 30.0 61.0 34.6 ... Urbaine (%) Female (%) 50.5 50.5 50.5 50.5 50.5 51.0 50.5 50.4 ... Femme (%) Population by Age Group Population par groupe d'âge 0-14 26802 000 27713 000 28655 000 29629 000 30637 000 31679 000 32755 000 33869 000 ... 0-14 15-64 27397 000 28329 000 29292 000 30287 000 31318 000 32381 000 33484 000 35769 000 ... 15-64 65+ 1503 000 1554 000 1607 000 1663 000 1718 000 1777 000 1837 000 1900 000 ... 65+ Active Population (000) 20 390.0 21 033.0 21 712.0 22 381.0 23 028.0 23 584.0 24 206.0 24 838.0 ... Population active (000) Female (%) 38.7 38.7 38.8 38.9 39.0 51.9 38.6 38.5 ... Femme (%) Taux brut de natalité - Total (par Crude birth rate - Total (per 1000) 48.5 48.0 47.4 46.8 46.1 44.1 44.9 44.3 ... 1000) Taux brut de mortalité - Total (par Crude death rate - Total (per 1000) 17.9 17.6 17.4 17.3 17.2 16.1 17.0 16.8 ... 1000) Life expectancy at birth - Total Espérance de vie à la naissance - 47.1 47.4 47.6 47.6 47.6 46.0 47.7 47.8 ... (years) Total (années) Net reproduction rate - (per Taux net de reproduction - (par ... ... ... 2.3 ... ... ... ... ... woman) femme) Indice synthétique de fécondité - Total fertility rate - (p woman) y (per ) 6.7 6.6 6.5 6.4 6.3 6.3 6.0 5.9 ... (par femme) Education Enseignement Teaching staff at first level - Total Personnel enseignant - 1er degré - ... ... ... ... ... 231.0 256.0 ... ... (thousands) Total (milliers) Teaching staff at second level - Total Personnel enseignant - 2ème degré - ... ... ... ... ... 180.0 189.0 ... ... 140 (thousands) Total (milliers) Teaching staff at third level - Total Personnel enseignant - 3ème degré - ... ... ... ... ... 17.0 20.0 ... ... (thousands) Total (milliers) First level student enrollment - Total Elèves inscrits - 1er degré - Total ... ... ... ... ... 8 840 9 973 ... ... (thousands) (milliers) First level student enrollment - Elèves inscrits - 1er degré - Femmes 2 393 ... ... ... ... 3 956 4 534 ... ... Female (thousands) (milliers) Second level student enrollment - Elèves inscrits - 2ème degré - Total 1 613 ... ... ... ... 2 815 3 114 ... ... Total (thousands) (milliers) Second level student enrollment - Elèves inscrits - 2ème degré - 591 ... ... ... ... 980 1 107 ... ... Female (thousands) Femmes (milliers) Third level student enrollment - Total Elèves inscrits - 3ème degré - Total ... ... ... ... ... 237.8 306.4 ... ... (thousands) (milliers) Third level student enrollment - Elèves inscrits - 3ème degré - ... ... ... ... ... 61.5 ... ... ... Female (thousands) Femmes (milliers) Public expenditure on education (% Dépenses publiques consacrées à ... ... ... ... ... ... ... ... ... of budget) l'enseignement (% du budget) Health Santé Hospital beds - Total (per 10 000 Nombre de lits d'hôpitaux - Total ... ... 10 ... ... ... ... ... ... population) (pour 10 000) Nurses - Total (per 10 000 Nombre d'infirmières - Total (pour ... ... 51 ... ... ... ... ... ... population) 10 000) Physicians - Total (per 10 000 Nombre de médecins - Total (pour ... ... 10 ... 6 ... ... ... ... population) 10 000) Public expenditure on Health (% of Dépenses publiques consacrées à la 1 6 5 6 6 ... ... ... ... budget) santé (% du budget) African Statistical Yearbook 2011 / Annuaire Statistique pour l'Afrique 2011
  • 142.
    Congo, Dem. Republic Rép. Démocratique du Congo II NATIONAL ACCOUNTS — COMPTES NATIONAUX 2002 2003 2004 2005 2006 2007 2008 2009 2010 Gross domestic product by kind of economic activity at current prices Produit intérieur brut par branche d'activité économique aux prix courants Congolese Franc (Millions) Franc Congolais(Millions) Agriculture 962 100 1 150 600 1 226 900 1 223 565 1 435 395 1 684 031 1 918 669 2 125 509 ... Agriculture Mining and quarrying 166 100 198 700 262 400 431 187 362 609 483 748 555 171 462 171 ... Industries extractives Manufacturing 102 300 122 300 135 400 1 094 591 1 272 111 1 653 744 2 149 868 2 794 828 ... Industries manufacturières Electricity, gas & water 58 900 70 400 85 100 60 921 84 129 84 627 88 518 96 138 ... Electricité, gaz et eau Construction 78 300 93 600 110 000 215 940 293 453 417 419 406 814 481 763 ... Bâtiments et travaux publics Wholesale & retail trade, 296 900 355 100 404 200 883 661 1 072 755 1 457 338 1 979 793 2 689 549 ... Commerce de gros et de détail, restaurants, hotels restaurants et hôtels Banques, assurances, affaires Finance, insurance, real estate, etc. 124 400 95 800 110 100 ... ... ... ... ... ... immobilières Transport and communications 70 700 84 600 97 800 783 874 943 633 1 253 145 1 664 176 2 210 026 ... Transport(s) et communications Administrations publiques et Public administration and defense 21 700 26 000 44 600 253 186 394 024 544 042 817 329 989 759 ... défense Other services 4 900 58 700 58 600 540 363 602 173 464 265 513 507 978 244 ... Autres services Moins Services d’intermédiation Less Imputed Service Charges ... ... ... - 20 405 - 34 526 - 28 585 - 30 082 - 31 229 ... financière Gross domestic product at factor Produit intérieur brut aux couts des 1 886 300 2 255 800 2 535 100 5 466 883 6 425 756 8 013 774 10 063 763 12 796 758 ... cost / basic prices facteurs / prix de base Plus: Indirect Taxes / taxes on Plus taxes indirectes/impôts sur les 35 900 42 856 74 615 203 182 268 995 362 370 557 423 557 746 ... products, less subsidies produits, moins les subventions Expenditure on Gross domestic product at current purchaser's values Emploi du produit intérieur brut aux prix courants d'acquisition Congolese Franc (Millions) Franc Congolais(Millions) Consommation finale des Government final consumption 128 715 147 003 257 045 393 538 631 909 658 251 758 021 846 376 ... administrations publiques Private final consumption 1 640 923 2 020 399 2 007 956 4 786 965 5 472 234 7 138 698 7 304 458 7 886 904 ... Consommation finale privée Gross fixed capital formation 116 319 306 179 499 480 662 043 987 034 1 968 587 3 169 471 4 289 643 ... Formation brute de capital fixe Increase in inventories 120 2 961 4 726 5 885 4 160 5 039 5 302 6 342 ... Variation des stocks Exports of goods and services 311 533 718 954 934 993 1 157 523 1 294 769 1 982 307 3 657 966 4 601 750 ... Exportations de biens et services Moins importations de biens et 141 Less imports of goods and services 275 410 896 840 1 094 485 1 335 889 1 695 355 3 376 738 4 274 032 4 276 511 ... services GDP at purchasers' values 1 922 200 2 298 656 2 609 715 5 670 065 6 694 751 8 376 144 10 621 186 13 354 504 ... PIB aux prix d'acquisition Gross domestic product by kind of economic activity at constant Produit intérieur brut par branche d'activité economique aux prix constants prices Annual Growth Rates (%) Taux de croissance annuel (%) Agriculture -1.0 1.2 2.2 2.3 5.6 3.3 3.2 3.0 ... Agriculture Mining and quarrying 9.8 13.3 1.8 4.6 -10.7 2.5 11.4 -0.2 ... Industries extractives Manufacturing 7.2 -3.9 4.9 20.3 8.2 4.4 3.4 2.5 ... Industries manufacturières Electricity, gas & water 1.4 7.7 14.3 12.5 5.9 -1.1 -0.6 2.3 ... Electricité, gaz et eau Construction 11.4 24.2 25.9 24.0 9.8 10.5 -1.6 1.8 ... Bâtiments et travaux publics Wholesale & retail trade, Commerce de gros et de 2.9 2.4 13.6 6.1 8.8 3.5 9.7 11.1 ... restaurants, hotels détail,restaurants et hôtels Banques, assurances, affaires Finance, insurance, real estate, etc. ... ... ... ... ... ... ... ... ... immobilières Transport and communications 21.5 27.4 8.9 5.2 7.3 3.5 9.7 11.1 ... Transport(s) et communications Administrations publiques et Public administartion and defense 2.7 12.5 19.0 12.0 -4.8 10.8 4.2 -26.6 ... défense Other services 5.9 6.3 8.1 4.0 1.8 29.1 6.2 -5.9 ... Autres services Moins Services d’intérmediation Less Imputed Service Charges -428.6 -44.4 260.0 0.0 5.6 6.3 6.2 2.8 ... financière Gross domestic product at factor Produit intérieur brut aux couts des 5.3 6.2 7.2 8.3 4.9 6.5 5.9 2.9 ... cost / basic prices facteurs / prix de base Plus: Indirect Taxes / taxes on Plus taxes indirectes/impôts sur les 16.7 5.0 19.0 6.7 16.0 0.4 14.2 0.9 ... products, less subsidies produits, moins les subventions Gross domestic product at market Produit intérieur brut aux prix du 3.5 5.4 7.3 6.1 5.3 6.3 6.2 2.8 ... prices marché 2009: Provisional 2009: provisoire African Statistical Yearbook 2011 / Annuaire Statistique pour l'Afrique 2011
  • 143.
    Congo, Dem. Republic Rép. Démocratique du Congo Expenditure on Gross domestic product at constant purchasers' Emplois du produit intérieur brut aux prix constants d'acquisition values Annual Growth Rates (%) Taux de croissance annuel (%) Consommation finale des Government final consumption 67.7 -11.3 54.2 25.7 18.1 13.5 6.9 3.7 ... administrations publiques Private final consumption -9.4 22.7 5.2 2.7 4.0 4.6 5.5 2.5 ... Consommation finale privée Gross fixed capital formation 51.7 3.9 -5.8 18.8 25.6 11.8 6.4 2.1 ... Formation brute de capital fixe Exports of goods and services 87.5 15.4 3.3 2.3 1.9 15.8 7.6 3.3 ... Exportations de biens et services Moins importations de biens et Less imports of goods and services 44.9 111.5 -1.5 0.9 11.2 13.5 5.6 2.1 ... services III INFLATION 2002 2003 2004 2005 2006 2007 2008 2009 2010 Annual Growth Rates (%) Taux de croissance annuel (%) All Item 16.9 13.8 11.0 15.9 21.4 22.3 44.7 34.8 17.2 Ensemble Food ... ... ... ... 23.8 22.8 53.4 30.3 20.1 Alimentation Health ... ... ... ... 37.7 15.0 19.4 7.5 11.8 Santé Energy ... ... ... ... 26.8 11.5 79.1 20.2 21.4 Energie Transport ... ... ... ... 4.2 62.6 -3.9 53.6 12.5 Transport IV AGRICULTURAL PRODUCTION - PRODUCTION AGRICOLE 2002 2003 2004 2005 2006 2007 2008 2009 2010 Tons (Thousand) Tonnes (milliers) Cassava, Tons (thousands) 14 930 14 945 14 951 14 974 14 989 15 004 ... ... ... Manioc, tonnes (milliers) Maize, Tons (thousands) 1 155 1 155 1 155 1 155 1 155 1 157 ... ... ... Maïs, tonnes (milliers) Banana, Tons (thousands) 486 586 486 487 488 489 ... ... ... Banane plantain, tonnes (milliers) Groundnuts, in shells, Tons Arachides en coques, tonnes 355 360 364 368 369 369 ... ... ... (thousands) (milliers) Rice, Tons (thousands) 314 315 315 315 316 316 ... ... ... Riz, tonnes (milliers) V MINING PRODUCTION - PRODUCTION MINIERE 142 2002 2003 2004 2005 2006 2007 2008 2009 2010 Copper, Tons (thousands) 27 359.0 16 359.0 19 019.0 26 389.0 97 360.0 96 391.0 335 066.0 120 976.0 ... Cuivre, tonnes (milliers) Diamond, carats (thousands) 22 503.0 26 981.0 29 503.0 32 599.0 28 949.0 28 270.0 20 947.0 7 803.0 ... Diamants, carat (milliers) Cobalt, Tons (thousands) 11 865.0 7 929.0 10 246.0 8 234.0 15 324.0 17 886.0 42 461.0 22 538.0 ... Cobalt, tonnes (thousands) VI ENERGY - ENERGIE 2002 2003 2004 2005 2006 2007 2008 2009 2010 Electricity - total hydro production, Électricité - production hydraulique 5 937.0 5 980.0 6 922.0 7 128.0 7 629.0 7 543.0 7 495.0 3 163.0 ... kilowatt hours (millions) totale, kilowatt-heures (millions) Electricity - total thermal production, Électricité - production thermique 20.0 21.0 22.0 23.0 24.0 26.0 ... ... ... kilowatt hours (millions) totale, kilowatt-heures (millions) Electricity - total production, self- Electricité - Production totale privée 110 193 212 225 239 252 ... ... ... producer (Million Kilowatt Hours) (million de kilowatt heures) Electricity - total production, public Electricité - Production totale 5 888 6 065 6 640 7 194 7 647 8 050 ... ... ... (Million Kilowatt Hours) publique (million de kilowatt heures) African Statistical Yearbook 2011 / Annuaire Statistique pour l'Afrique 2011
  • 144.
    Congo, Dem. Republic Rép. Démocratique du Congo VII TOURISM AND INFRASTRUCTURE - TOURISME ET INFRASTUCTURE 2002 2003 2004 2005 2006 2007 2008 2009 2010 Arrivals - Tourists (thousands) 28 35 36 61 55 47 ... ... ... Arrivées - touristes (milliers) Rooms in hotels and similar Chambres d'hotels et établissements establishments (thousands) 6 6 ... ... ... ... ... ... ... assimilés (milliers) Paved Road (% of total) ... ... 2 ... ... ... ... ... ... Routes asphaltées (% du total) Total Network (Railways-km) ... ... 4 499 3 641 3 641 3 641 ... ... ... Réseau total voies ferrées-Km Main Telephone Lines (per 1,000 Lignes téléphoniques fixes (pour 0 0 0 0 0 0 1 ... ... inhabitants) 1000 habitants) Mobile Cellular Subscribers (per Abonnés aux téléphones mobiles 10 22 35 46 73 105 144 ... ... 1,000 inhabitants) (pour 1000 habitants) VII FINANCIAL AND MONETARY STATISTICS - FINANCES ET STATISTIQUES MONETAIRES 2002 2003 2004 2005 2006 2007 2008 2009 2010 VII-1 Monetary Statistics VII-1 Statistiques monétaires Congolese Franc (Millions) Franc Congolais(Millions) Money supply (M1) 57 157 72 110 117 078 138 893 211 983 300 273 392 484 479 875 573 760 Masse monétaire (M1) Quasi-money 36 196 52 393 98 192 128 399 213 516 340 964 605 961 1 021 990 1 258 200 Quasi-monnaie of which Demand Deposit ... ... ... ... ... ... ... ... ... dont Monnaie scripturale Net foreign assets - 267 173 - 306 771 - 341 297 - 327 079 - 385 390 - 241 203 - 295 990 - 763 866 28 826 Avoirs extérieurs nets Domestic credit 3 561 31 727 32 404 98 524 183 247 281 405 593 591 659 614 552 488 Crédit intérieur of which claims on private sector 13 125 19 393 39 823 63 021 117 295 192 044 466 011 657 694 786 397 dont créances sur le secteur privé of which Claims on government dont créances nettes sur le - 10 391 12 104 - 9 250 35 055 62 467 84 266 118 196 - 26 995 - 261 833 sector, net gouvernement International reserves (millions of US Réserves internationales (millions de 74 98 236 131 155 181 78 1 615 1 841 $) $ EU) Average Exchange Rate (National Taux de change (moyen) (monnaie 346.69 405.40 399.48 473.91 468.28 516.75 559.29 809.79 905.91 Currency per us $) nationale par dollars) VII-2 Public Finance VII-2 Finances publiques Congolese Franc (Millions) Franc Congolais(Millions) Total Revenues and Grants 159 640 223 322 299 357 564 898 856 866 877 100 1 356 400 2 190 063 3 718 080 Recettes totales et dons Tax Revenue 152 193 176 816 248 003 388 956 485 935 697 300 1 087 400 1 446 523 1 911 008 Recettes fiscales Non Tax Revenue 0 0 0 0 42 800 63 800 118 000 119 540 278 272 Recettes non fiscales Grants 7 447 46 506 51 354 175 942 328 131 116 000 151 000 624 000 1 528 800 Dons 143 Total Expenditures and Net Lending 198 406 319 634 405 772 670 512 883 936 1 026 400 1 624 900 2 773 121 4 023 975 Dépenses totales et prêts nets Current expenditure 112 204 151 570 213 476 387 689 523 798 606 100 804 300 1 108 393 1 494 751 Dépenses courantes Of which Wages and Salaries 39 287 57 104 93 223 146 776 218 898 357 400 452 200 547 562 744 865 Dont rémunérations et salaires Capital expenditure 10 385 61 756 72 059 113 878 134 050 121 100 243 700 703 532 1 639 368 Dépenses d'équipement Net Lending 7 986 0 0 0 0 20 000 130 000 270 000 0 Prêts nets Fiscal Balance - 38 766 - 96 312 - 106 415 - 105 614 - 27 070 - 149 300 - 268 500 - 583 058 - 305 895 Solde global y compris les dons VII-3 Balance of Payments VII-3 Balance des paiements Congolese Franc (Millions) Franc Congolais(Millions) Trade balance 39 - 220 - 57 - 92 - 451 - 203 - 71 - 1 170 ... Balance commerciale Services Balance - 161 - 99 - 371 - 314 - 355 - 883 - 915 - 932 ... Balance des services Net Income - 236 9 - 265 - 306 - 294 - 567 - 744 - 570 ... Revenus nets Current transfers, net total 359 165 437 464 530 850 694 1 270 ... Transferts courants Current account balance 1 - 146 - 256 - 247 - 571 - 803 - 1 036 - 1 403 ... Solde du compte courant VII-4 External Debt and Financial Flows VII-4 Dette extérieure et flux financiers US $ (Millions) $ E.U (Millions) Total external debt 4 013 4 857 5 582 5 902 5 411 6 535 7 153 13 822 ... Dette extérieure totale Private 3 573 4 343 5 075 5 300 4 680 5 721 6 277 0 ... Privée Public 440 515 506 602 731 814 876 13 822 ... Publique Total external debt service 373 463 380 566 825 627 595 765 ... Service de la dette extérieure Net Foreign Direct Investment Investissements étranger direct (flux 117 158 10 - 76 - 108 720 1 000 ... ... Inflows nets entrants) Net Total Official Development Aide publique au développement 1 175 5 417 1 826 1 774 2 043 1 241 1 610 ... ... assistance (nette totale) African Statistical Yearbook 2011 / Annuaire Statistique pour l'Afrique 2011
  • 145.
    Congo, Dem. Republic Rép. Démocratique du Congo 2002 2003 2004 2005 2006 2007 2008 2009 2010 Congolese Franc (Millions) Franc Congolais Exports, fob Exportations, fàb Exports - Total 542 238 718 954 934 993 1 157 523 1 294 769 1 982 307 3 657 966 4 601 750 ... Exportations - Total Main Products Principaux produits Diamonds 131 768 245 353 210 143 405 840 302 220 349 599 ... ... ... Diamants Crude oil 69 360 103 787 146 455 353 582 316 593 ... ... ... ... Pétrole brut Cobalt 26 014 7 547 55 603 94 235 73 297 98 793 ... ... ... Cobalt Copper 3 721 5 410 29 395 69 361 53 966 72 712 ... ... ... Cuivre Log 2 546 5 410 3 824 7 012 5 944 7 234 ... ... ... Grumes Main Destinations Principales destinations Belgium 347 147.7 277 635.7 230 421.7 273 436.3 238 694.8 258 862.1 286 748.8 ... ... Belgique China 4 328.7 10 618.8 39 613.6 83 393.7 172 584.2 237 450.8 892 007.4 ... ... Chine United States 72 068.6 74 186.5 52 465.7 127 685.0 40 339.7 107 551.8 152 391.0 ... ... États-Unis France 28 298.5 23 310.7 102 397.2 55 085.9 58 694.9 99 514.4 183 580.0 ... ... France Zambia 563.3 4 861.2 5 616.9 10 338.7 14 687.8 65 996.1 301 159.9 ... ... Zambie 2002 2003 2004 2005 2006 2007 2008 2009 2010 Imports, cif Importations, cif 144 Imports - Total ... 896 840 1 094 485 1 335 889 1 695 355 3 376 738 4 276 738 4 276 511 ... Importations - Total (millions) Principaux produits Main Products Durum wheat 6 698 6 668 9 159 8 666 8 366 ... ... ... ... Blé (dur) Frozen fish 16 113 10 970 13 512 8 099 9 643 ... ... ... ... Poisson congelé Rice 13 989 4 852 4 414 4 007 5 515 ... ... ... ... Riz Wheat flour 10 770 5 014 1 166 1 701 2 801 ... ... ... ... Farine de froment Meat and offal frozen 9 576 6 986 6 162 18 410 4 678 ... ... ... ... Viande et abats congelés Main Origin Principales provenances South Africa 53 390.9 66 169.6 82 689.0 130 919.0 170 305.6 320 847.4 633 675.0 ... ... Afrique du Sud Belgium 41 730.7 57 748.2 70 619.8 110 564.0 103 372.2 143 694.9 219 981.0 ... ... Belgique Zimbabwe 9 925.0 0.0 5 034.8 3 395.3 444 073.7 43 369.7 8 353.5 ... ... Zimbabwe France 27 366.4 48 772.1 48 354.3 61 882.8 82 296.6 97 663.4 103 514.1 ... ... France Zambia 13 582.6 16 853.8 42 108.6 46 220.9 62 914.7 126 906.9 161 672.0 ... ... Zambie African Statistical Yearbook 2011 / Annuaire Statistique pour l'Afrique 2011
  • 146.
    Côte d'Ivoire Côte d'Ivoire AREA (KM 2) 322 463 SUPERFICIE (KM 2) CAPITAL CITY Yamoussoukro Yamoussoukro CAPITALE CURRENCY CFA Franc Franc CFA MONNAIE I SOCIAL AND DEMOGRAPHIC INDICATORS — INDICATEURS DEMOGRAPHIQUES ET SOCIAUX 2002 2003 2004 2005 2006 2007 2008 2009 2010 Population Population Population au milieu de l'année - Mid-year population - Total (Million) 17.5 18.0 18.5 19.1 19.7 20.2 20.8 21.4 ... Total (million) Population au milieu de l'année - Mid-year population - Urban (%) 44.5 45.5 46.2 47.0 47.8 48.6 49.4 50.1 ... Urbaine (%) Female (%) 49.0 49.0 49.0 49.0 49.0 49.0 49.0 49.1 ... Femme (%) Population by Age Group Population par groupe d'âge 0-14 7353 000 7526 000 7687 000 7838 000 7988 000 8144 000 8311 000 8498 000 ... 0-14 15-64 9679 000 10034 000 10407 000 10797 000 11197 000 11500 000 11999 000 12385 000 ... 15-64 65+ 429 000 441 000 452 000 462 000 473 000 484 000 497 000 512 000 ... 65+ Active Population (000) 7 032.0 7 180.0 7 331.0 7 484.0 7 641.0 7 802.0 7 966.0 8 133.0 ... Population active (000) Female (%) 39.3 39.3 39.3 39.3 39.3 39.3 39.3 39.3 ... Femme (%) Taux brut de natalité - Total (par Crude birth rate - Total (per 1000) 39.3 39.0 38.6 38.3 37.9 37.5 37.1 36.7 ... 1000) Taux brut de mortalité - Total (par Crude death rate - Total (per 1000) 14.3 14.3 14.3 14.3 14.0 13.8 13.6 13.3 ... 1000) Life expectancy at birth - Total Espérance de vie à la naissance - 50.9 50.9 50.9 50.9 51.3 51.6 52.0 52.3 ... (years) Total (années) Net reproduction rate - (per Taux net de reproduction - (par 1.9 1.9 1.9 1.8 1.8 1.8 1.8 1.8 ... woman) femme) Indice synthétique de fécondité - Total fertility rate - (p woman) y (per ) 5.2 5.2 5.1 5.1 5.0 5.0 4.9 4.9 ... (par femme) Education Enseignement Teaching staff at first level - Total Personnel enseignant - 1er degré - 50.97 36.5 37.1 38.1 45.8 53.2 56.2 56.6 ... (thousands) Total (milliers) Teaching staff at second level - Total Personnel enseignant - 2ème degré - 22.54 15.2 18.3 19.9 19.9 20.4 22.6 28.5 ... 145 (thousands) Total (milliers) Teaching staff at third level - Total Personnel enseignant - 3ème degré - ... ... ... ... ... ... ... ... ... (thousands) Total (milliers) First level student enrollment - Total Elèves inscrits - 1er degré - Total 2 114 1 478 1 624 1 662 2 112 2 180 2 356 2 383 ... (thousands) (milliers) First level student enrollment - Elèves inscrits - 1er degré - Femmes 915 655 723 743 931 962 1 039 1 065 ... Female (thousands) (milliers) Second level student enrollment - Elèves inscrits - 2ème degré - Total 682 462 596 660 751 818 818 930 ... Total (thousands) (milliers) Second level student enrollment - Elèves inscrits - 2ème degré - 242 169 219 246 287 296 313 354 ... Female (thousands) Femmes (milliers) Third level student enrollment - Total Elèves inscrits - 3ème degré - Total ... ... ... ... 149.3 156.8 ... ... ... (thousands) (milliers) Third level student enrollment - Elèves inscrits - 3ème degré - ... ... ... ... 48.9 52.2 ... ... ... Female (thousands) Femmes (milliers) Public expenditure on education (% Dépenses publiques consacrées à ... ... ... ... ... ... ... ... ... of budget) l'enseignement (% du budget) Health Santé Hospital beds - Total (per 10 000 Nombre de lits d'hôpitaux - Total 1 2 2 2 1 2 2 ... ... population) (pour 10 000) Nurses - Total (per 10 000 Nombre d'infirmières - Total (pour ... ... 6 ... 4 4 4 ... ... population) 10 000) Physicians - Total (per 10 000 Nombre de médecins - Total (pour ... ... 1 ... 1 1 1 ... ... population) 10 000) Public expenditure on Health (% of Dépenses publiques consacrées à la 6 6 6 5 5 5 4 ... ... budget) santé (% du budget) African Statistical Yearbook 2011 / Annuaire Statistique pour l'Afrique 2011
  • 147.
    Côte d'Ivoire Côte d'Ivoire II NATIONAL ACCOUNTS — COMPTES NATIONAUX 2002 2003 2004 2005 2006 2007 2008 2009 2010 Gross domestic product by kind of economic activity at current prices Produit intérieur brut par branche d'activité économique aux prix courants CFA Franc (Millions) Franc CFA (Millions) Agriculture 2 346 767 2 560 403 2 063 033 2 036 048 2 105 934 2 144 500 2 408 072 2 605 113 ... Agriculture Mining and quarrying 138 104 283 942 282 015 319 239 501 236 409 707 498 204 411 516 ... Industries extractives Manufacturing 1 314 273 1 310 488 1 350 565 1 427 282 1 370 344 1 523 119 1 742 047 1 776 299 ... Industries manufacturières Electricity, gas & water 124 143 95 788 106 533 108 600 105 765 125 496 135 410 143 399 ... Electricité, gaz et eau Construction 239 608 184 525 185 813 201 077 213 007 210 677 238 908 231 502 ... Bâtiments et travaux publics Wholesale & retail trade, Commerce de gros et de détail, 1 122 740 1 019 242 1 077 462 1 101 893 1 091 447 1 138 852 1 228 821 1 292 597 ... restaurants, hotels restaurants et hôtels Banques, assurances, affaires Finance, insurance, real estate, etc. 1 297 040 1 215 407 1 312 007 1 508 381 1 568 467 1 552 347 1 703 496 1 823 481 ... immobilières Transport and communications 497 247 636 380 636 380 629 460 679 339 827 777 912 590 968 492 ... Transport(s) et communications Administrations publiques et Public administration and defense 617 763 655 375 666 660 653 531 612 653 646 359 658 404 633 205 ... défense Other services 335 596 349 087 397 837 410 273 432 737 448 640 452 759 513 881 ... Autres services Moins Services d’intermédiation Less Imputed Service Charges - 232 779 - 284 739 - 307 488 - 321 019 - 341 596 - 351 719 - 372 470 - 392 211 ... financière Gross domestic product at factor Produit intérieur brut aux couts des 7 800 502 8 025 898 7 770 817 8 074 765 8 339 333 8 675 755 9 606 240 10 007 275 ... cost / basic prices facteurs / prix de base Plus: Indirect Taxes / taxes on Plus taxes indirectes/impôts sur les 805 155 870 304 974 643 936 990 968 575 1 073 428 1 165 743 1 277 654 ... products, less subsidies produits, moins les subventions Expenditure on Gross domestic product at current purchaser's values Emploi du produit intérieur brut aux prix courants d'acquisition CFA Franc (Millions) Franc CFA (Millions) Consommation finale des Government final consumption 1 135 733 1 030 820 971 301 952 368 900 190 1 298 823 1 466 813 1 527 992 ... administrations publiques Private final consumption 5 684 315 6 176 677 6 274 842 6 509 197 6 801 587 6 995 110 7 507 222 7 544 758 ... Consommation finale privée Gross fixed capital formation 866 637 734 245 817 636 826 102 911 057 1 132 444 1 297 781 1 493 746 ... Formation brute de capital fixe Increase in inventories - 377 129 196 918 - 35 739 194 730 - 204 577 - 166 093 - 197 315 - 323 940 ... Variation des stocks Exports of goods and services 4 084 447 3 726 745 4 058 332 4 496 718 4 874 327 4 604 547 5 212 347 5 259 258 ... Exportations de biens et services 146 Moins importations de biens et Less imports of goods and services 2 788 346 2 969 203 3 340 912 3 967 360 3 974 676 4 115 648 4 514 866 4 216 885 ... services GDP at purchasers' values 8 605 657 8 896 202 8 745 460 9 011 755 9 307 908 9 749 183 10 771 983 11 284 929 ... PIB aux prix d'acquisition Gross domestic product by kind of economic activity at constant Produit intérieur brut par branche d'activité economique aux prix constants prices Annual Growth Rates (%) Taux de croissance annuel (%) Agriculture -1.2 2.3 0.0 3.4 3.4 -0.9 2.7 2.7 ... Agriculture Mining and quarrying 72.6 78.4 -0.4 -1.7 19.3 -25.1 -1.6 13.0 ... Industries extractives Manufacturing -2.4 -3.3 -4.2 5.3 -3.0 9.9 2.6 1.9 ... Industries manufacturières Electricity, gas & water -16.0 -12.8 12.2 0.4 0.7 22.7 2.9 2.9 ... Electricité, gaz et eau Construction 0.7 -26.4 3.5 -15.3 13.9 -9.0 8.6 -1.8 ... Bâtiments et travaux publics Wholesale & retail trade, Commerce de gros et de -3.0 -11.4 10.4 2.6 -1.4 -12.4 -13.5 -19.4 ... restaurants, hotels détail,restaurants et hôtels Banques, assurances, affaires Finance, insurance, real estate, etc. 0.0 -9.0 4.0 11.4 2.9 -9.2 -5.5 -13.4 ... immobilières Transport and communications -22.9 4.7 -26.5 -13.6 -0.4 20.7 9.6 59.9 ... Transport(s) et communications Administrations publiques et Public administartion and defense -6.7 6.7 2.7 -0.6 -6.0 3.5 1.1 -0.2 ... défense Other services -4.5 3.1 12.2 3.5 3.8 55.6 63.5 17.1 ... Autres services Moins Services d’intérmediation Less Imputed Service Charges -5.2 7.9 0.9 4.4 6.4 3.0 5.9 5.3 ... financière Gross domestic product at factor Produit intérieur brut aux couts des -2.9 -1.9 0.1 2.5 1.2 1.3 2.6 3.1 ... cost / basic prices facteurs / prix de base Plus: Indirect Taxes / taxes on Plus taxes indirectes/impôts sur les 12.5 4.0 11.9 -4.8 4.2 5.7 2.1 6.8 ... products, less subsidies produits, moins les subventions Gross domestic product at market Produit intérieur brut aux prix du -1.7 -1.4 1.2 1.7 1.5 1.8 2.5 3.5 ... prices marché 2008: semi-final 2009: Provisional 2010:Estimated 2008: semi-définitif 2009: provisoire 2010:Estimée African Statistical Yearbook 2011 / Annuaire Statistique pour l'Afrique 2011
  • 148.
    Côte d'Ivoire Côte d'Ivoire Expenditure on Gross domestic product at constant purchasers' Emplois du produit intérieur brut aux prix constants d'acquisition values Annual Growth Rates (%) Taux de croissance annuel (%) Consommation finale des Government final consumption -0.2 18.0 28.5 36.9 35.8 45.3 2.4 0.0 ... administrations publiques Private final consumption -1.5 -2.1 -4.6 -4.4 -4.1 0.1 3.3 -1.1 ... Consommation finale privée Gross fixed capital formation 24.7 -17.2 12.0 -5.5 12.0 21.0 10.1 12.7 ... Formation brute de capital fixe Exports of goods and services 10.6 -11.8 15.1 8.4 5.8 -10.6 -0.8 5.6 ... Exportations de biens et services Moins importations de biens et Less imports of goods and services 3.3 2.7 11.1 14.2 -3.9 -0.8 2.4 -1.3 ... services III INFLATION 2002 2003 2004 2005 2006 2007 2008 2009 2010 Annual Growth Rates (%) Taux de croissance annuel (%) All Item 3.1 3.3 1.5 3.9 2.5 1.9 6.3 1.0 1.4 Ensemble Food 5.2 3.7 -3.5 2.5 3.0 5.4 11.6 3.0 11.8 Alimentation Health 3.8 0.1 -0.3 1.4 1.8 2.8 1.5 0.2 -1.6 Santé Energy 6.0 13.0 -2.2 2.6 -0.1 -2.5 9.9 -5.8 2.4 Energie Transport -0.2 0.3 6.8 14.0 8.7 -0.7 7.4 0.0 2.6 Transport IV AGRICULTURAL PRODUCTION - PRODUCTION AGRICOLE 2002 2003 2004 2005 2006 2007 2008 2009 2010 Tons (Thousand) Tonnes (milliers) Coffee green, Tons (thousands) 251 251 251 230 187 117 68 145 ... Café vert ('000 tonnes) Cocoa beans, Tons (thousands) 1 277 1 371 1 388 1 360 1 409 1 230 1 382 1 305 ... Cacao en fèves ('000 tonnes) Cotton lint, Tons (thousands) 396 396 180 321 297 278 120 141 ... Coton ('000 tonnes) Caoutchouc sec (HEVEA) ('000 Natural rubber, Tons (thousands) 127 116 137 135 178 189 201 203 ... tonnes) Banana, Tons (thousands) 322 322 307 261 318 388 334 286 ... Banane poyo ('000 tonnes) V MINING PRODUCTION - PRODUCTION MINIERE 147 2002 2003 2004 2005 2006 2007 2008 2009 2010 Crude petroleum, metric tons 748.5 1 027.8 1 125.5 1 994.2 3 050.0 2 411.4 2 284.4 2 712.4 ... Pétrole brut ('000 tonnes) (thousands) Gold ores and concentrates 3 360.0 2.0 1 321.0 1 638.0 1 327.0 1 466.0 2 884.0 7 055.0 ... Or fin (kg) (Kilograms) Gaz naturel (nette, million de mètres Natural gas, cubic meters (million) 1 393.0 1 224.2 1 555.8 1 737.6 1 740.4 1 573.9 1 657.3 1 540.0 ... cube) VI ENERGY - ENERGIE 2002 2003 2004 2005 2006 2007 2008 2009 2010 Electricity - total hydro production, Électricité - production hydraulique 5 278.3 5 063.8 5 370.0 5 530.6 5 510.3 5 475.6 5 633.9 ... ... kilowatt hours (millions) totale, kilowatt-heures (millions) Electricity - total thermal production, Électricité - production thermique 32.6 36.0 32.4 25.8 27.3 32.6 33.4 ... ... kilowatt hours (millions) totale, kilowatt-heures (millions) Electricity - total production, self- Electricité - Production totale privée 67 60 68 74 73 67 67 ... ... producer (Million Kilowatt Hours) (million de kilowatt heures) Electricity - total production, public Electricité - Production totale 5 296 5 087 5 398 5 563 5 530 5 514 ... ... ... (Million Kilowatt Hours) publique (million de kilowatt heures) African Statistical Yearbook 2011 / Annuaire Statistique pour l'Afrique 2011
  • 149.
    Côte d'Ivoire Côte d'Ivoire VII TOURISM AND INFRASTRUCTURE - TOURISME ET INFRASTUCTURE 2002 2003 2004 2005 2006 2007 2008 2009 2010 Arrivals - Tourists (thousands) ... ... ... ... ... ... ... ... ... Arrivées - touristes (milliers) Rooms in hotels and similar Chambres d'hotels et établissements establishments (thousands) ... ... ... ... ... ... ... ... ... assimilés (milliers) Paved Road (% of total) 8 8 8 8 8 8 8 8 ... Routes asphaltées (% du total) Total Network (Railways-km) 82 639 82 639 82 639 82 639 82 639 82 639 82 639 82 639 ... Réseau total voies ferrées-Km Main Telephone Lines (per 1,000 Lignes téléphoniques fixes (pour 18 13 14 13 14 13 17 ... ... inhabitants) 1000 habitants) Mobile Cellular Subscribers (per Abonnés aux téléphones mobiles 57 69 89 122 207 371 507 ... ... 1,000 inhabitants) (pour 1000 habitants) VII FINANCIAL AND MONETARY STATISTICS - FINANCES ET STATISTIQUES MONETAIRES 2002 2003 2004 2005 2006 2007 2008 2009 2010 VII-1 Monetary Statistics VII-1 Statistiques monétaires CFA Franc (Millions) Franc CFA (Millions) Money supply (M1) 1 750 480 1 145 080 1 300 350 1 397 260 1 551 050 1 983 270 1 999 470 2 341 650 2 590 240 Masse monétaire (M1) Quasi-money 641 084 618 634 632 217 683 882 743 718 853 324 997 883 1 170 100 1 393 690 Quasi-monnaie of which Demand Deposit ... ... ... ... ... ... ... ... ... dont Monnaie scripturale Net foreign assets 899 006 464 347 673 402 722 979 836 117 1 060 080 1 007 950 1 157 730 1 368 020 Avoirs extérieurs nets Domestic credit 1 688 810 1 505 210 1 517 700 1 569 670 1 634 890 1 962 480 2 103 660 2 506 390 2 796 960 Crédit intérieur of which claims on private sector 1 208 640 1 087 470 1 173 980 1 190 200 1 290 080 1 531 740 1 704 020 1 883 900 1 991 800 dont créances sur le secteur privé of which Claims on government dont créances nettes sur le 472 319 412 513 343 715 379 464 344 814 430 739 399 645 621 893 802 432 sector, net gouvernement International reserves (millions of US Réserves internationales (millions de 1 863 1 304 1 694 1 322 1 798 2 519 2 253 3 267 3 542 $) $ EU) Average Exchange Rate (National Taux de change (moyen) (monnaie 696.99 581.20 528.29 527.47 522.89 479.27 447.81 472.19 495.28 Currency per us $) nationale par dollars) VII-2 Public Finance VII-2 Finances publiques CFA Franc (Millions) Franc CFA (Millions) Total Revenues and Grants 1 456 800 1 391 000 1 514 350 1 566 000 1 615 500 1 842 000 2 156 300 2 120 700 2 159 796 Recettes totales et dons Tax Revenue 1 259 300 1 190 100 1 241 350 1 251 100 1 364 000 1 438 900 1 638 000 1 795 600 ... Recettes fiscales Non Tax Revenue 169 100 161 800 197 100 220 300 236 400 349 500 338 800 262 100 ... Recettes non fiscales 148 Grants 28 400 39 100 75 900 94 600 15 100 53 600 179 500 63 000 ... Dons Total Expenditures and Net Lending 1 527 779 1 512 250 1 567 156 1 636 600 1 650 700 1 936 800 2 217 200 2 291 900 2 434 824 Dépenses totales et prêts nets Current expenditure 917 329 969 540 1 027 123 1 110 500 1 151 300 1 330 600 1 527 100 1 560 600 ... Dépenses courantes Of which Wages and Salaries 523 529 539 400 545 779 563 400 589 000 640 300 711 700 745 000 ... Dont rémunérations et salaires Capital expenditure 257 100 213 700 258 624 235 300 239 000 253 600 319 600 334 300 ... Dépenses d'équipement Net Lending 12 850 9 110 10 571 20 300 22 100 28 800 17 700 12 400 ... Prêts nets Fiscal Balance - 70 979 - 121 250 - 52 806 - 70 600 - 35 200 - 94 800 - 60 900 - 171 200 - 275 028 Solde global y compris les dons VII-3 Balance of Payments VII-3 Balance des paiements CFA Franc (Millions) Franc CFA (Millions) Trade balance 1 964 934 1 485 793 1 388 287 1 290 348 1 625 683 1 229 011 1 487 375 2 002 592 ... Balance commerciale Services Balance - 668 833 - 648 549 - 670 867 - 680 990 - 726 032 - 743 176 - 732 643 - 749 670 ... Balance des services Net Income - 438 968 - 383 306 - 344 275 - 344 546 - 371 394 - 387 928 - 403 945 - 442 499 ... Revenus nets Current transfers, net total - 321 997 - 282 766 - 245 906 - 243 885 - 277 811 - 164 545 - 148 878 - 46 620 ... Transferts courants Current account balance 535 136 171 172 127 239 20 927 250 446 - 66 638 201 909 763 803 ... Solde du compte courant VII-4 External Debt and Financial Flows VII-4 Dette extérieure et flux financiers US $ (Millions) $ E.U (Millions) Total external debt 6 437 6 142 6 071 6 220 6 459 6 397 6 449 5 856 ... Dette extérieure totale Private 1 334 1 267 1 269 1 305 1 313 1 292 1 371 1 373 ... Privée Public 5 103 4 876 4 802 4 915 5 146 5 105 5 078 4 483 ... Publique Total external debt service 805 573 565 480 442 401 375 168 ... Service de la dette extérieure Net Foreign Direct Investment Investissements étranger direct (flux 181 132 186 191 195 226 224 206 ... Inflows nets entrants) Net Total Official Development Aide publique au développement 284 40 78 95 120 83 231 ... ... assistance (nette totale) African Statistical Yearbook 2011 / Annuaire Statistique pour l'Afrique 2011
  • 150.
    Côte d'Ivoire Côte d'Ivoire 2002 2003 2004 2005 2006 2007 2008 2009 2010 CFA Franc (Millions) Franc CFA Exports, fob Exportations, fàb Exports - Total 3 676 540 3 363 702 3 655 377 4 060 120 4 432 719 4 154 669 4 652 742 5 192 300 ... Exportations - Total Main Products Principaux produits Cocoa beans 1 229 757 1 007 604 850 113 777 859 743 338 687 519 789 266 1 224 008 ... Cacao fèves Peutroleum Products 405 836 240 454 172 603 281 657 706 326 514 507 716 107 1 423 484 ... Produits pétroliers Cocoa transformed 356 155 338 911 270 834 269 424 275 653 331 088 400 461 475 378 ... Cacao transformé Lumber 157 106 136 919 160 559 157 962 148 290 153 567 153 069 84 297 ... Bois débités Cotton mass 93 444 103 143 81 466 73 708 59 056 46 829 35 879 32 085 ... Coton masse Main Destinations Principales destinations France 458 008.2 607 488.4 818 331.6 700 139.0 779 995.1 788 324.8 610 260.6 526 603.4 ... France Netherlands 656 549.5 565 709.4 374 838.7 421 011.6 411 076.0 352 318.9 495 083.1 673 344.3 ... Pays-Bas U.S.A 261 683.4 226 033.2 336 186.4 540 315.2 386 245.2 261 550.7 425 264.5 373 497.3 ... U.S.A Nigeria 325 246.0 95 451.0 260 945.4 305 122.4 307 241.5 307 929.7 281 330.1 337 374.1 ... Nigéria Italy 131 977.4 109 356.3 165 092.7 105 731.6 166 033.5 134 089.6 171 205.3 154 707.7 ... Italie 2002 2003 2004 2005 2006 2007 2008 2009 2010 Imports, cif Importations, cif Imports - Total 2 788 346 2 969 203 3 340 912 3 967 360 3 974 676 4 189 309 4 390 395 4 350 439 ... Importations - Total (millions) 149 Principaux produits Main Products Petroleum products 370 833 350 609 576 627 868 024 966 459 964 787 1 259 525 819 869 ... Produits pétroliers Electrical Machinery 120 794 101 462 151 505 148 301 156 063 214 680 231 366 211 405 ... Machines électriques Fish, crustaceans, molluscs 123 646 115 160 98 567 105 437 119 320 131 335 174 626 168 763 ... Poissons, crustacés, molusques Rice 93 178 91 265 113 211 133 920 152 293 156 034 209 506 281 480 ... Riz Vehicles and trucks 60 523 93 567 164 868 135 947 135 436 163 680 141 341 122 662 ... Véhicules et camions Main Origin Principales provenances Nigeria 254 525.5 294 962.2 504 544.1 759 645.5 837 707.1 769 285.9 1 035 048.5 676 143.9 ... Nigéria France 388 068.1 667 203.4 811 360.3 858 157.0 776 060.3 694 909.4 447 431.5 467 500.9 ... France China 43 622.9 71 404.2 68 899.7 94 583.6 131 333.2 209 666.2 242 554.2 236 081.5 ... Chine Populaire Germany 64 956.4 58 100.5 65 659.6 55 215.3 76 047.2 86 607.6 100 443.7 96 713.9 ... Allemagne U.S.A 62 352.2 66 030.9 70 375.0 63 008.3 70 558.1 86 138.4 93 573.3 107 594.3 ... U.S.A African Statistical Yearbook 2011 / Annuaire Statistique pour l'Afrique 2011
  • 151.
    Djibouti Djibouti AREA (KM 2) 23 200 SUPERFICIE (KM 2) CAPITAL CITY Djibouti Djibouti CAPITALE CURRENCY Djibouti Franc Franc Djiboutien MONNAIE I SOCIAL AND DEMOGRAPHIC INDICATORS — INDICATEURS DEMOGRAPHIQUES ET SOCIAUX 2002 2003 2004 2005 2006 2007 2008 2009 2010 Population Population Population au milieu de l'année - Mid-year population - Total (Million) 0.6 0.6 0.6 0.6 0.7 0.7 0.7 0.9 ... Total (million) Population au milieu de l'année - Mid-year population - Urban (%) ... ... 486.6 86.0 87.0 87.0 87.0 87.8 ... Urbaine (%) Female (%) 50.1 50.1 50.1 50.0 50.0 50.0 50.0 50.0 ... Femme (%) Population by Age Group Population par groupe d'âge 0-14 236 112 242 167 248 376 254 585 260 950 267 474 274 161 311 789 ... 0-14 15-64 356 271 365 407 374 776 384 145 393 749 403 593 413 683 524 434 ... 15-64 65+ 8 411 8 627 8 848 9 069 9 296 9 528 9 767 27 975 ... 65+ Active Population (000) 313.0 320.0 328.0 335.0 343.0 352.0 362.0 371.0 ... Population active (000) Female (%) 43.1 43.1 43.0 43.3 43.4 43.2 43.1 43.4 ... Femme (%) Taux brut de natalité - Total (par Crude birth rate - Total (per 1000) 31.6 39.0 39.0 39.0 29.4 28.9 28.4 28.0 ... 1000) Taux brut de mortalité - Total (par Crude death rate - Total (per 1000) 11.7 11.6 11.5 11.4 11.3 11.2 11.0 10.9 ... 1000) Life expectancy at birth - Total Espérance de vie à la naissance - 53.8 54.0 54.2 54.5 54.8 55.1 55.4 55.8 ... (years) Total (années) Net reproduction rate - (per Taux net de reproduction - (par ... ... ... 1.7 ... ... ... ... ... woman) femme) Indice synthétique de fécondité - Total fertility rate - (p woman) y (per ) 4.6 4.2 4.2 4.2 4.1 4.0 3.9 3.8 ... (par femme) Education Enseignement Teaching staff at first level - Total Personnel enseignant - 1er degré - 1.27 1.3 1.4 1.5 1.6 1.6 1.7 ... ... (thousands) Total (milliers) Teaching staff at second level - Total Personnel enseignant - 2ème degré - 0.51 0.6 0.7 0.7 0.8 0.8 1.0 ... ... 150 (thousands) Total (milliers) Teaching staff at third level - Total Personnel enseignant - 3ème degré - ... 1.3 1.4 1.5 1.6 1.6 ... ... ... (thousands) Total (milliers) First level student enrollment - Total Elèves inscrits - 1er degré - Total 39 40 41 43 47 49 49 50 ... (thousands) (milliers) First level student enrollment - Elèves inscrits - 1er degré - Femmes 23 24 18 19 20 22 22 23 ... Female (thousands) (milliers) Second level student enrollment - Elèves inscrits - 2ème degré - Total 16 18 19 21 24 27 34 38 ... Total (thousands) (milliers) Second level student enrollment - Elèves inscrits - 2ème degré - 6 7 7 8 9 11 3 4 ... Female (thousands) Femmes (milliers) Third level student enrollment - Total Elèves inscrits - 3ème degré - Total 0.7 0.9 1.1 1.7 1.9 2.2 ... ... ... (thousands) (milliers) Third level student enrollment - Elèves inscrits - 3ème degré - 0.3 0.4 0.5 0.7 0.8 0.9 ... ... ... Female (thousands) Femmes (milliers) Public expenditure on education (% Dépenses publiques consacrées à 23.1 25.2 27.4 25.9 22.4 22.8 ... ... ... of budget) l'enseignement (% du budget) Health Santé Hospital beds - Total (per 10 000 Nombre de lits d'hôpitaux - Total ... ... ... 18 18 18 17 ... ... population) (pour 10 000) Nurses - Total (per 10 000 Nombre d'infirmières - Total (pour ... ... 33 33 21 20 20 ... ... population) 10 000) Physicians - Total (per 10 000 Nombre de médecins - Total (pour 20 ... 16 ... 13 13 19 ... ... population) 10 000) Public expenditure on Health (% of Dépenses publiques consacrées à la 10 10 9 10 13 ... ... ... ... budget) santé (% du budget) African Statistical Yearbook 2011 / Annuaire Statistique pour l'Afrique 2011
  • 152.
    Djibouti Djibouti II NATIONAL ACCOUNTS — COMPTES NATIONAUX 2002 2003 2004 2005 2006 2007 2008 2009 2010 Gross domestic product by kind of economic activity at current prices Produit intérieur brut par branche d'activité économique aux prix courants Djibouti Franc (Millions) Franc Djiboutien(Millions) Agriculture 3 178 3 294 3 460 3 728 4 017 4 367 5 475 6 089 6 537 Agriculture Mining and quarrying 582 549 442 182 194 206 221 237 266 Industries extractives Manufacturing 2 344 2 432 2 556 2 742 2 940 3 168 3 422 3 687 3 951 Industries manufacturières Electricity, gas & water 4 972 5 277 5 641 6 098 6 507 7 006 7 691 8 286 8 559 Electricité, gaz et eau Construction 6 162 6 447 6 839 8 109 8 517 9 960 12 744 18 769 20 326 Bâtiments et travaux publics Wholesale & retail trade, Commerce de gros et de détail, 15 023 15 805 18 004 20 721 23 216 23 024 25 983 29 376 31 512 restaurants, hotels restaurants et hôtels Banques, assurances, affaires Finance, insurance, real estate, etc. 11 944 12 389 13 028 13 902 14 835 16 119 17 905 21 638 23 273 immobilières Transport and communications 25 073 25 943 27 230 27 933 29 951 32 232 36 027 43 785 47 772 Transport(s) et communications Administrations publiques et Public administration and defense 19 684 18 911 18 772 20 036 19 705 22 809 22 478 22 789 23 457 défense Other services 1 753 1 816 1 908 2 025 2 141 2 241 2 487 2 685 2 824 Autres services Moins Services d’intermédiation Less Imputed Service Charges ... ... ... ... ... ... ... ... ... financière Gross domestic product at factor Produit intérieur brut aux couts des 90 715 92 862 97 880 105 476 112 023 121 132 134 433 157 341 168 477 cost / basic prices facteurs / prix de base Plus: Indirect Taxes / taxes on Plus taxes indirectes/impôts sur les 11 918 13 091 13 650 12 924 13 916 15 472 16 260 17 276 17 994 products, less subsidies produits, moins les subventions Expenditure on Gross domestic product at current purchaser's values Emploi du produit intérieur brut aux prix courants d'acquisition Djibouti Franc (Millions) Franc Djiboutien(Millions) Consommation finale des Government final consumption 26 008 28 462 29 498 31 652 31 521 32 880 34 520 36 339 37 758 administrations publiques Private final consumption 81 325 83 334 84 009 90 801 100 450 110 405 123 670 146 580 156 753 Consommation finale privée Gross fixed capital formation 11 485 17 254 25 053 20 839 24 313 27 620 29 477 32 979 34 994 Formation brute de capital fixe Increase in inventories ... ... ... ... ... ... ... ... ... Variation des stocks Exports of goods and services 48 414 51 649 52 984 55 873 58 352 60 566 62 515 64 431 66 435 Exportations de biens et services Moins importations de biens et 151 Less imports of goods and services 64 598 74 746 80 014 80 764 88 697 94 866 99 489 105 713 109 470 services GDP at purchasers' values 102 633 105 953 111 530 118 400 125 939 136 604 150 693 174 617 186 471 PIB aux prix d'acquisition Gross domestic product by kind of economic activity at constant Produit intérieur brut par branche d'activité economique aux prix constants prices Annual Growth Rates (%) Taux de croissance annuel (%) Agriculture 3.0 3.0 4.5 4.5 6.5 6.0 7.0 7.0 ... Agriculture Mining and quarrying -6.3 -21.0 -60.0 3.0 3.0 4.0 4.0 4.0 ... Industries extractives Manufacturing 3.1 3.1 4.0 4.0 4.0 5.0 7.0 7.0 ... Industries manufacturières Electricity, gas & water 5.5 4.8 4.8 3.5 8.6 6.0 7.0 7.0 ... Electricité, gaz et eau Construction 4.0 4.0 15.0 10.0 13.0 15.0 12.0 10.0 ... Bâtiments et travaux publics Wholesale & retail trade, Commerce de gros et de 4.7 4.6 4.5 5.7 6.8 7.0 7.2 6.6 ... restaurants, hotels détail,restaurants et hôtels Banques, assurances, affaires Finance, insurance, real estate, etc. 3.1 3.1 3.5 3.5 5.0 5.5 6.0 6.0 ... immobilières Transport and communications 2.9 2.9 -0.5 4.0 4.5 5.0 6.0 7.0 ... Transport(s) et communications Administrations publiques et Public administartion and defense -4.5 -2.7 4.3 -5.3 -2.6 -1.0 -3.3 -0.3 ... défense Other services 3.0 3.0 3.0 3.0 3.0 3.0 4.0 4.0 ... Autres services Moins Services d’intérmediation Less Imputed Service Charges ... ... ... ... ... ... ... ... ... financière Gross domestic product at factor Produit intérieur brut aux couts des 1.8 2.1 3.3 2.8 4.7 5.4 5.4 6.0 ... cost / basic prices facteurs / prix de base Plus: Indirect Taxes / taxes on Plus taxes indirectes/impôts sur les 9.1 10.8 0.6 5.8 64.3 3.4 3.4 3.4 ... products, less subsidies produits, moins les subventions Gross domestic product at market Produit intérieur brut aux prix du 2.6 3.2 3.0 3.2 12.7 5.0 5.0 5.5 ... prices marché 2009: Provisional 2010:Estimated 2009: provisoire 2010:Estimée African Statistical Yearbook 2011 / Annuaire Statistique pour l'Afrique 2011
  • 153.
    Djibouti Djibouti Expenditure on Gross domestic product at constant purchasers' Emplois du produit intérieur brut aux prix constants d'acquisition values Annual Growth Rates (%) Taux de croissance annuel (%) Consommation finale des Government final consumption 7.9 7.7 3.6 -5.0 22.3 -6.7 6.3 -9.9 ... administrations publiques Private final consumption -6.1 -6.6 5.9 6.1 2.7 15.8 17.5 -11.6 ... Consommation finale privée Gross fixed capital formation 30.8 93.7 15.8 13.2 70.3 26.3 16.4 -15.2 ... Formation brute de capital fixe Exports of goods and services 4.6 10.4 -3.9 11.4 12.7 -1.6 9.6 27.0 ... Exportations de biens et services Moins importations de biens et Less imports of goods and services -1.9 18.4 6.2 12.3 30.0 17.1 26.0 -15.1 ... services III INFLATION 2002 2003 2004 2005 2006 2007 2008 2009 2010 Annual Growth Rates (%) Taux de croissance annuel (%) All Item 0.6 2.0 3.1 4.7 3.5 0.3 12.0 1.7 4.2 Ensemble Food 1.2 3.9 4.2 1.4 4.0 7.8 16.8 1.3 ... Alimentation Health -0.3 2.3 3.8 1.6 -3.1 0.3 8.3 1.4 ... Santé Energy 0.8 -1.1 1.9 9.6 -2.2 4.7 6.6 3.5 ... Energie Transport -0.5 1.8 2.1 4.8 1.4 -0.5 10.4 7.4 ... Transport IV AGRICULTURAL PRODUCTION - PRODUCTION AGRICOLE 2002 2003 2004 2005 2006 2007 2008 2009 2010 Tons (Thousand) Tonnes (milliers) Beans, dry, Tons (thousands) 2 2 1 1 1 2 2 ... ... Fèves sèches, tonnes (milliers) Lemon, Tons (thousands) 2 2 2 2 2 2 2 ... ... Citrons, tonnes (milliers) Tomato, Tons (thousands) 1 1 1 1 1 1 1 ... ... Tomates, tonnes (milliers) Mango, Tons (thousands) 0 0 0 0 0 0 ... ... ... Mangues, tonnes (milliers) Oinons Green, Tons (thousands) 0 0 0 0 0 0 ... ... ... Oignons verts, tonnes (milliers) V MINING PRODUCTION - PRODUCTION MINIERE 152 2002 2003 2004 2005 2006 2007 2008 2009 2010 Salt and pure sodium chloride, Sel et chlorure de sodium pur, 102.0 102.0 78.0 ... ... ... ... ... ... metric tons (thousands) tonnes métriques (milliers) ... ... ... ... ... ... ... ... ... ... ... ... ... ... ... ... ... ... VI ENERGY - ENERGIE 2002 2003 2004 2005 2006 2007 2008 2009 2010 Electricity - total hydro production, Électricité - production hydraulique ... ... ... ... ... ... ... ... ... kilowatt hours (millions) totale, kilowatt-heures (millions) Electricity - total thermal production, Électricité - production thermique 200.0 200.0 215.0 255.0 280.0 292.0 ... ... ... kilowatt hours (millions) totale, kilowatt-heures (millions) Electricity - total production, self- Electricité - Production totale privée ... ... ... ... ... ... ... ... ... producer (Million Kilowatt Hours) (million de kilowatt heures) Electricity - total production, public Electricité - Production totale 248 261 274 298 307 321 326 ... ... (Million Kilowatt Hours) publique (million de kilowatt heures) African Statistical Yearbook 2011 / Annuaire Statistique pour l'Afrique 2011
  • 154.
    Djibouti Djibouti VII TOURISM AND INFRASTRUCTURE - TOURISME ET INFRASTUCTURE 2002 2003 2004 2005 2006 2007 2008 2009 2010 Arrivals - Tourists (thousands) 22.5 23.2 26.3 30.25 39.5 48.7 53.6 ... ... Arrivées - touristes (milliers) Rooms in hotels and similar Chambres d'hotels et établissements establishments (thousands) assimilés (milliers) 0.45 0.45 0.45 0.45 0.45 0.677 0.861 ... ... Paved Road (% of total) 14 14 14 14 14 14 16 16 ... Routes asphaltées (% du total) Total Network (Railways-km) 3 048 3 048 3 132 3 132 3 132 3 132 3 132 3 132 ... Réseau total voies ferrées-Km Main Telephone Lines (per 1,000 Lignes téléphoniques fixes (pour 17 16 17 16 17 20 21 ... ... inhabitants) 1000 habitants) Mobile Cellular Subscribers (per Abonnés aux téléphones mobiles 34 38 54 68 67 96 162 ... ... 1,000 inhabitants) (pour 1000 habitants) VII FINANCIAL AND MONETARY STATISTICS - FINANCES ET STATISTIQUES MONETAIRES 2002 2003 2004 2005 2006 2007 2008 2009 2010 VII-1 Monetary Statistics VII-1 Statistiques monétaires Djibouti Franc (Millions) Franc Djiboutien(Millions) Money supply (M1) 35 515 42 850 47 443 47 728 57 271 67 541 82 236 102 678 122 974 Masse monétaire (M1) Quasi-money 29 922 34 207 40 311 49 981 51 419 50 491 60 074 64 514 59 704 Quasi-monnaie of which Demand Deposit ... ... ... ... ... ... ... ... ... dont Monnaie scripturale Net foreign assets 45 881 59 610 70 721 79 397 92 003 95 115 117 191 127 495 130 940 Avoirs extérieurs nets Domestic credit 31 540 31 071 31 549 31 538 32 972 39 925 47 965 60 250 70 078 Crédit intérieur of which claims on private sector 25 629 24 967 24 991 25 282 27 579 33 939 43 211 54 717 66 282 dont créances sur le secteur privé of which Claims on government dont créances nettes sur le 4 537 4 845 5 459 5 192 4 442 4 243 3 236 2 908 1 242 sector, net gouvernement International reserves (millions of US Réserves internationales (millions de 74 100 94 89 120 132 175 242 254 $) $ EU) Average Exchange Rate (National Taux de change (moyen) (monnaie 177.72 177.72 177.72 177.72 177.72 177.72 177.72 177.72 177.72 Currency per us $) nationale par dollars) VII-2 Public Finance VII-2 Finances publiques Djibouti Franc (Millions) Franc Djiboutien(Millions) Total Revenues and Grants 30 948 37 966 42 156 46 714 47 742 53 002 73 091 68 916 74 066 Recettes totales et dons Tax Revenue 22 165 22 930 23 640 25 133 27 690 30 901 35 004 37 449 41 344 Recettes fiscales Non Tax Revenue 2 556 8 294 10 423 13 798 14 775 14 632 15 249 19 519 19 985 Recettes non fiscales Grants 6 227 6 742 8 093 7 783 5 277 7 469 22 838 11 948 12 737 Dons 153 Total Expenditures and Net Lending 34 817 40 491 44 399 46 409 51 118 56 885 70 902 77 983 80 790 Dépenses totales et prêts nets Current expenditure 26 832 29 281 31 521 30 861 35 734 34 658 40 677 39 031 42 337 Dépenses courantes Of which Wages and Salaries 15 908 17 338 17 933 18 607 19 926 20 801 22 176 24 058 25 497 Dont rémunérations et salaires Capital expenditure 4 695 7 436 9 117 11 711 10 302 16 859 24 164 32 121 31 481 Dépenses d'équipement Net Lending 0 0 0 0 0 0 0 0 0 Prêts nets Fiscal Balance - 3 869 - 2 525 - 2 243 305 - 3 376 - 3 883 2 189 - 9 067 - 6 725 Solde global y compris les dons VII-3 Balance of Payments VII-3 Balance des paiements Djibouti Franc (Millions) Franc Djiboutien(Millions) Trade balance - 28 691 - 35 719 - 39 718 - 47 523 - 59 859 - 80 064 - 109 654 - 90 105 - 105 273 Balance commerciale Services Balance 23 231 25 895 24 299 29 271 28 484 30 795 30 390 51 717 68 561 Balance des services Net Income 2 718 9 000 11 506 11 941 15 021 16 722 15 995 12 618 20 997 Revenus nets Current transfers, net total 1 040 4 611 2 360 2 285 - 3 692 - 3 692 - 5 154 - 5 332 - 2 950 Transferts courants Current account balance - 1 702 3 787 - 1 553 - 4 026 - 20 046 - 36 238 - 68 423 - 31 101 - 18 665 Solde du compte courant VII-4 External Debt and Financial Flows VII-4 Dette extérieure et flux financiers US $ (Millions) $ E.U (Millions) Total external debt 341 415 452 440 437 540 591 626 670 Dette extérieure totale Private 0 0 0 0 0 0 0 0 0 Privée Public 341 415 452 440 437 540 591 626 670 Publique Total external debt service 16 18 22 23 23 24 27 29 32 Service de la dette extérieure Net Foreign Direct Investment Investissements étranger direct (flux 4 14 39 59 164 195 234 100 ... Inflows nets entrants) Net Total Official Development Aide publique au développement 74 79 64 74 115 112 121 162 ... assistance (nette totale) African Statistical Yearbook 2011 / Annuaire Statistique pour l'Afrique 2011
  • 155.
    Djibouti Djibouti 2002 2003 2004 2005 2006 2007 2008 2009 2010 US $ (Millions) Franc Djiboutien Exports, fob Exportations, fàb Exports - Total ... ... ... ... ... ... ... ... ... Exportations - Total Main Products Principaux produits Oils petroleum, bituminous, Huiles de pétrole, bitumineux, 8 6 0 0 1 27 28 20 ... distillates, except crude distilles, sauf brut Bovine, live except pure-bred 0 0 0 1 1 24 43 44 ... Bovins vivants excepté laitiers breeding Animals, live 0 0 0 0 2 15 41 28 ... Animaux, vivants Prefabricated buildings 0 0 0 0 0 0 7 0 ... Bâtiments préfabriqués Food preparations nes 0 1 0 0 0 0 6 8 ... Préparations alimentaires Main Destinations Principales destinations Ethiopia 60.3 26.8 11.0 69.3 176.2 0.5 5.8 0.1 ... Ethiopie Saudi Arabia 0.3 0.2 0.3 0.1 0.2 125.0 130.5 104.0 ... Arabie Saoudite Yemen 26.1 6.7 0.5 1.9 0.2 0.6 0.4 0.4 ... Yémen Kenya ... ... ... 1.5 0.0 26.7 22.0 0.6 ... Kenya Egypt, Arab Rep. 7.4 3.9 1.0 1.3 7.3 6.7 13.9 15.6 ... Egypte 2002 2003 2004 2005 2006 2007 2008 2009 2010 Imports, cif Importations, cif 154 Imports - Total 505 954 757 1 659 2 321 2 335 2 045 1 995 ... Importations - Total (millions) Principaux produits Main Products Huile de palme et ses fractions, Palm oil and its fractions refined but 8 19 14 13 22 61 117 122 ... raffinées, mais non chimiquement not chemically modified modifiées Petroleum oils&oils obtained from Huiles de pétrole, bitumineux, bituminous minerals,o/than crude 3 164 4 659 1 052 777 103 17 ... distilles, sauf brut etc Wheat nes and meslin 35 9 5 23 16 4 63 91 ... Blé nda et méteil Diammonium phosphate, in Diammonium phosphate, dans des ... ... ... ... 4 22 54 9 ... packages weighing more than 10 kg colis pesant plus de 10 kg Grain sorghum 0 0 0 0 0 0 52 10 ... Sorgho à grains Main Origin Principales provenances Saudi Arabia ... 281.2 ... 676.8 939.6 640.1 ... ... ... Arabie Saoudite India 30.3 52.8 116.5 194.6 339.9 405.0 394.0 249.3 ... Inde China 49.8 65.9 72.2 111.5 155.0 166.9 252.3 294.6 ... Chine United Arab Emirates 49.2 104.3 146.3 178.5 245.9 286.0 273.1 271.0 ... Kenya Ethiopia 54.3 99.4 26.8 53.5 53.7 59.9 57.3 51.6 ... Ethiopie African Statistical Yearbook 2011 / Annuaire Statistique pour l'Afrique 2011
  • 156.
    Egypt Egypte AREA (KM 2) 1 001 449 SUPERFICIE (KM 2) CAPITAL CITY Cairo Le Caire CAPITALE CURRENCY Egyptian Pound Pound Egyptien MONNAIE I SOCIAL AND DEMOGRAPHIC INDICATORS — INDICATEURS DEMOGRAPHIQUES ET SOCIAUX 2002 2003 2004 2005 2006 2007 2008 2009 2010 Population Population Population au milieu de l'année - Mid-year population - Total (Million) 72.9 74.3 75.7 77.2 78.6 80.1 81.5 83.0 84.5 Total (million) Population au milieu de l'année - Mid-year population - Urban (%) 42.6 42.6 42.6 42.6 42.6 42.6 42.7 42.7 42.8 Urbaine (%) Female (%) 49.7 49.7 49.7 49.7 49.7 49.7 49.7 49.7 49.7 Femme (%) Population by Age Group Population par groupe d'âge 0-14 25764 523 25685 413 25660 051 25724 498 25893 033 26151 775 26473 338 26816 268 27148 626 0-14 15-64 43946 746 45333 596 46689 854 47975 464 49175 972 50301 538 51367 413 52399 596 53418 439 15-64 65+ 3536 829 3648 481 3757 667 3862 662 3961 306 4056 354 4156 915 4275 298 4419 921 65+ Active Population (000) 22 864.0 23 490.0 24 108.0 24 702.0 25 330.0 25 743.0 26 338.0 27 411.0 28 006.0 Population active (000) Female (%) 24.0 24.0 24.0 24.0 24.0 24.0 24.0 23.0 23.0 Femme (%) Taux brut de natalité - Total (par Crude birth rate - Total (per 1000) 26.0 26.0 25.0 25.0 25.0 25.0 25.0 24.0 25.0 1000) Taux brut de mortalité - Total (par Crude death rate - Total (per 1000) 6.0 6.0 6.0 6.0 6.0 6.0 6.0 6.0 6.0 1000) Life expectancy at birth - Total Espérance de vie à la naissance - 69.0 69.0 69.0 70.0 70.0 70.0 70.0 70.0 70.0 (years) Total (années) Net reproduction rate - (per Taux net de reproduction - (par ... ... ... 1.0 ... ... ... ... 1.0 woman) femme) Indice synthétique de fécondité - Total fertility rate - (per woman) 3.0 3.0 3.0 3.0 3.0 3.0 3.0 3.0 3.0 (par femme) Education Enseignement Teaching staff at first level - Total Personnel enseignant - 1er degré - 349.18 354.9 362.7 373.1 376.7 368.8 ... ... ... (thousands) Total (milliers) Teaching staff at second level - Personnel enseignant - 2ème degré - 480.69 485.2 487.7 491.8 489.0 490.5 ... ... ... Total (thousands) Total (milliers) 155 Teaching staff at third level - Total Personnel enseignant - 3ème degré - ... 72.6 80.7 ... ... ... ... ... ... (thousands) Total (milliers) First level student enrollment - Total Elèves inscrits - 1er degré - Total 7 855 7 874 7 928 9 564 9 795 9 988 ... ... ... (thousands) (milliers) First level student enrollment - Elèves inscrits - 1er degré - Femmes 3 721 3 749 3 796 4 527 4 643 4 754 ... ... ... Female (thousands) (milliers) Second level student enrollment - Elèves inscrits - 2ème degré - Total 8 360 8 384 8 330 ... ... ... ... ... ... Total (thousands) (milliers) Second level student enrollment - Elèves inscrits - 2ème degré - 3 936 3 965 3 947 ... ... ... ... ... ... Female (thousands) Femmes (milliers) Third level student enrollment - Elèves inscrits - 3ème degré - Total ... 2 153.9 2 299.7 2 397.4 2 440.7 2 501.3 2 488.4 ... ... Total (thousands) (milliers) Third level student enrollment - Elèves inscrits - 3ème degré - ... ... 982.4 ... ... ... ... ... ... Female (thousands) Femmes (milliers) Public expenditure on education (% Dépenses publiques consacrées à 5.2 16.2 15.5 16.0 12.0 12.6 ... ... ... of budget) l'enseignement (% du budget) Health Santé Hospital beds - Total (per 10 000 Nombre de lits d'hôpitaux - Total 307 308 310 311 229 245 ... ... ... population) (pour 10 000) Nurses - Total (per 10 000 Nombre d'infirmières - Total (pour ... 270 276 278 281 283 ... ... ... population) 10 000) Physicians - Total (per 10 000 Nombre de médecins - Total (pour 226 220 226 226 226 227 ... ... ... population) 10 000) Public expenditure on Health (% of Dépenses publiques consacrées à la 8 8 7 7 7 ... ... ... ... budget) santé (% du budget) African Statistical Yearbook 2011 / Annuaire Statistique pour l'Afrique 2011
  • 157.
    Egypt Egypte II NATIONAL ACCOUNTS — COMPTES NATIONAUX 2002 2003 2004 2005 2006 2007 2008 2009 2010 Gross domestic product by kind of economic activity at current prices Produit intérieur brut par branche d'activité économique aux prix courants Egyptian Pound (Millions) Pound Egyptien(Millions) Agriculture 58 369 63 822 69 252 75 291 81 766 99 953 113 104 135 465 160 970 Agriculture Mining and quarrying 29 360 42 348 57 427 64 026 89 834 103 656 133 674 147 966 165 747 Industries extractives Manufacturing 70 084 72 244 83 651 89 981 98 693 114 475 139 003 164 523 194 290 Industries manufacturières Electricity, gas & water 7 455 8 021 8 664 9 778 11 038 12 270 14 166 16 020 18 287 Electricité, gaz et eau Construction 16 560 16 710 18 502 20 106 23 763 30 175 36 780 44 026 52 609 Bâtiments et travaux publics Wholesale & retail trade, Commerce de gros et de détail, 49 416 51 711 63 354 73 079 82 381 102 081 125 806 147 780 173 802 restaurants, hotels restaurants et hôtels Banques, assurances, affaires Finance, insurance, real estate, etc. 44 191 46 718 51 131 55 463 60 350 75 179 86 465 98 389 112 957 immobilières Transport and communications 31 952 36 536 44 305 51 915 59 892 76 735 90 669 98 973 108 021 Transport(s) et communications Administrations publiques et Public administration and defense 35 269 39 925 46 293 51 755 56 930 64 220 79 737 98 575 114 974 défense Other services 11 908 12 586 13 744 15 118 16 498 31 643 35 898 39 466 45 694 Autres services Moins Services d’intermédiation Less Imputed Service Charges ... ... ... ... ... ... ... ... ... financière Gross domestic product at factor Produit intérieur brut aux couts des 354 564 390 619 456 322 506 511 581 144 710 388 855 302 991 183 1 147 350 cost / basic prices facteurs / prix de base Plus: Indirect Taxes / taxes on Plus taxes indirectes/impôts sur les 27 136 26 881 28 978 31 989 36 556 34 413 40 198 51 117 59 250 products, less subsidies produits, moins les subventions Expenditure on Gross domestic product at current purchaser's values Emploi du produit intérieur brut aux prix courants d'acquisition Egyptian Pound (Millions) Pound Egyptien(Millions) Consommation finale des Government final consumption 45 200 52 900 61 900 68 600 75 900 84 400 97 500 118 300 134 700 administrations publiques Private final consumption 285 500 304 900 347 800 385 300 436 100 539 200 647 600 793 200 901 700 Consommation finale privée Gross fixed capital formation 67 500 68 100 79 600 96 500 115 700 155 300 199 500 197 100 224 400 Formation brute de capital fixe Increase in inventories 1 700 2 400 2 600 300 0 0 1 000 2 900 3 500 Variation des stocks Exports of goods and services 68 000 91 000 137 000 163 400 185 000 225 300 295 900 260 100 257 600 Exportations de biens et services 156 Less imports of goods and services 86 200 101 800 143 600 175 600 195 000 259 400 346 000 329 300 315 300 Moins importations de biens et services GDP at purchasers' values 381 700 417 500 485 300 538 500 617 700 744 800 895 500 1 042 300 1 206 600 PIB aux prix d'acquisition Gross domestic product by kind of economic activity at constant Produit intérieur brut par branche d'activité economique aux prix constants prices Annual Growth Rates (%) Taux de croissance annuel (%) Agriculture 21.2 4.9 1.4 3.3 3.2 3.7 3.3 3.2 3.5 Agriculture Mining and quarrying 82.4 2.9 2.3 0.6 20.8 3.9 3.6 5.9 0.9 Industries extractives Manufacturing 22.2 1.0 3.1 4.4 5.8 7.3 8.0 3.7 5.1 Industries manufacturières Electricity, gas & water 9.1 6.0 6.6 6.3 8.2 6.5 7.6 10.6 6.4 Electricité, gaz et eau Construction 13.7 -5.2 4.7 5.0 14.0 15.8 15.7 11.4 13.2 Bâtiments et travaux publics Wholesale & retail trade, Commerce de gros et de -10.6 2.4 10.5 6.7 6.0 9.4 10.8 2.4 7.7 restaurants, hotels détail,restaurants et hôtels Banques, assurances, affaires Finance, insurance, real estate, etc. 83.2 2.3 2.8 3.7 4.8 11.5 6.7 4.6 5.3 immobilières Transport and communications 15.8 9.5 8.1 9.7 8.7 6.2 12.7 6.4 6.2 Transport(s) et communications Administrations publiques et Public administartion and defense 56.6 2.4 2.7 3.0 3.4 3.4 2.7 7.1 4.3 défense Other services -51.0 4.2 3.5 3.5 4.9 6.8 5.1 -2.4 5.0 Autres services Moins Services d’intérmediation Less Imputed Service Charges ... ... ... ... ... ... ... ... financière Gross domestic product at factor Produit intérieur brut aux couts des 19.5 3.0 4.3 4.6 6.9 7.1 7.2 4.7 5.1 cost / basic prices facteurs / prix de base Plus: Indirect Taxes / taxes on Plus taxes indirectes/impôts sur les 4.0 6.1 0.7 2.6 5.5 7.6 9.6 10.2 -2.2 products, less subsidies produits, moins les subventions Gross domestic product at market Produit intérieur brut aux prix du 18.3 3.2 4.1 4.5 6.8 7.1 7.3 4.9 4.8 prices marché Break in the serie from 2002 and 2007 Rupture de la série à partir 2002 et 2007 African Statistical Yearbook 2011 / Annuaire Statistique pour l'Afrique 2011
  • 158.
    Egypt Egypte Expenditure on Gross domestic product at constant purchasers' Emplois du produit intérieur brut aux prix constants d'acquisition values Annual Growth Rates (%) Taux de croissance annuel (%) Consommation finale des Government final consumption 39.1 2.7 2.0 2.8 3.1 0.2 2.1 5.6 4.5 administrations publiques Private final consumption 16.5 2.3 2.1 4.8 6.4 6.9 5.7 5.7 5.1 Consommation finale privée Gross fixed capital formation 16.2 -8.7 6.2 14.2 13.8 23.8 15.5 -9.1 2.1 Formation brute de capital fixe Exports of goods and services 22.8 13.8 25.3 20.2 21.3 23.3 28.8 -14.5 -3.0 Exportations de biens et services Moins importations de biens et Less imports of goods and services 22.2 1.3 17.2 23.8 21.8 28.8 26.3 -17.9 -3.2 services III INFLATION 2002 2003 2004 2005 2006 2007 2008 2009 2010 Annual Growth Rates (%) Taux de croissance annuel (%) All Item 2.4 3.2 12.9 8.8 4.1 11.2 11.7 16.2 ... Ensemble Food ... ... ... ... ... ... ... ... ... Alimentation Health ... ... ... ... ... ... ... ... ... Santé Energy ... ... ... ... ... ... ... ... ... Energie Transport ... ... ... ... ... ... ... ... ... Transport IV AGRICULTURAL PRODUCTION - PRODUCTION AGRICOLE 2002 2003 2004 2005 2006 2007 2008 2009 2010 Tons (Thousand) Tonnes (milliers) Wheat, Tons (thousands) 6 625 6 845 7 178 8 141 8 274 7 379 7 977 ... ... Blé, tonnes (milliers) Maize, Tons (thousands) 6 431 6 530 6 236 7 085 6 374 6 243 6 544 ... ... Maïs, tonnes (milliers) Tomato, Tons (thousands) 6 778 7 140 7 641 7 600 7 650 7 550 ... ... ... Tomates, tonnes (milliers) Rice, Tons (thousands) 6 105 6 176 6 352 6 125 6 755 6 665 ... ... ... Riz, tonnes (milliers) Sugar beets, Tons (thousands) 3 168 2 692 2 861 3 430 5 300 5 600 ... ... ... Betteraves à sucre, tonnes (milliers) V MINING PRODUCTION - PRODUCTION MINIERE 157 2002 2003 2004 2005 2006 2007 2008 2009 2010 Crude petroleum, metric tons Pétrole brut, tonnes métriques 30 706.0 30 549.0 29 040.0 27 044.0 25 934.0 26 354.0 ... ... ... (thousands) (milliers) Natural gas (terajoules) 1076 806.0 1214 024.0 1311 413.0 1933 144.0 2074 343.0 2136 170.0 ... ... ... Gaz naturel (térajoules) Natural phosphates, P205 content, Phosphates naturels, teneur en 434.0 630.0 650.0 622.0 650.0 650.0 ... ... ... metric tons (thousands) P205, tonnes métriques (milliers) VI ENERGY - ENERGIE 2002 2003 2004 2005 2006 2007 2008 2009 2010 Electricity - total hydro production, Électricité - production hydraulique 15 130.0 12 303.0 12 644.0 12 644.0 12 925.0 15 510.0 ... ... ... kilowatt hours (millions) totale, kilowatt-heures (millions) Electricity - total thermal production, Électricité - production thermique 70 603.0 79 343.0 88 132.0 98 494.0 104 866.0 111 788.0 ... ... ... kilowatt hours (millions) totale, kilowatt-heures (millions) Electricity - total production, self- Electricité - Production totale privée 2 950 2 950 2 950 3 000 3 000 3 000 ... ... ... producer (Million Kilowatt Hours) (million de kilowatt heures) Electricity - total production, public Electricité - Production totale 82 996 88 982 98 349 108 690 115 407 125 129 ... ... ... (Million Kilowatt Hours) publique (million de kilowatt heures) African Statistical Yearbook 2011 / Annuaire Statistique pour l'Afrique 2011
  • 159.
    Egypt Egypte VII TOURISM AND INFRASTRUCTURE - TOURISME ET INFRASTUCTURE 2002 2003 2004 2005 2006 2007 2008 2009 2010 Arrivals - Tourists (thousands) 5192 6045 8104 8608 9083 10610 12296 ... ... Arrivées - touristes (milliers) Rooms in hotels and similar Chambres d'hotels et établissements establishments (thousands) 132.109 136.51 148.039 170.776 177.613 ... ... ... ... assimilés (milliers) Paved Road (% of total) ... ... ... ... 81 ... ... ... ... Routes asphaltées (% du total) Total Network (Railways-km) 5 150 ... 5 150 5 150 5 195 5 195 ... ... ... Réseau total voies ferrées-Km Main Telephone Lines (per 1,000 Lignes téléphoniques fixes (pour 106 118 125 135 139 141 146 ... ... inhabitants) 1000 habitants) Mobile Cellular Subscribers (per Abonnés aux téléphones mobiles 62 78 101 177 229 376 506 ... ... 1,000 inhabitants) (pour 1000 habitants) VII FINANCIAL AND MONETARY STATISTICS - FINANCES ET STATISTIQUES MONETAIRES 2002 2003 2004 2005 2006 2007 2008 2009 2010 VII-1 Monetary Statistics VII-1 Statistiques monétaires Egyptian Pound (Millions) Pound Egyptien(Millions) Money supply (M1) 75 781 93 520 102 543 120 468 142 601 178 676 200 349 226 097 258 433 Masse monétaire (M1) Quasi-money 257 031 310 114 366 416 402 389 458 708 537 599 591 029 640 257 704 822 Quasi-monnaie of which Demand Deposit ... ... ... ... ... ... ... ... ... dont Monnaie scripturale Net foreign assets 18 043 32 806 54 108 111 639 187 997 231 587 247 440 255 846 304 920 Avoirs extérieurs nets Domestic credit 384 807 436 655 508 289 527 845 574 256 626 722 695 790 782 844 846 112 Crédit intérieur of which claims on private sector 207 089 225 023 262 270 275 526 304 470 338 997 383 252 376 158 416 976 dont créances sur le secteur privé of which Claims on government dont créances nettes sur le 127 180 158 140 186 352 179 036 191 057 196 026 229 002 311 935 322 948 sector, net gouvernement International reserves (millions of US Réserves internationales (millions de 13 242 13 589 14 273 20 609 24 462 30 188 32 216 32 253 33 154 $) $ EU) Average Exchange Rate (National Taux de change (moyen) (monnaie 4.50 5.85 6.20 5.78 5.73 5.64 5.43 5.54 5.61 Currency per us $) nationale par dollars) VII-2 Public Finance VII-2 Finances publiques Egyptian Pound (Millions) Pound Egyptien(Millions) Total Revenues and Grants 78 318 89 146 101 879 109 987 149 520 180 216 218 500 278 569 224 987 Recettes totales et dons Tax Revenue 50 801 55 736 67 158 75 960 98 029 114 327 137 378 163 182 145 544 Recettes fiscales Non Tax Revenue 4 265 3 290 5 050 3 497 1 584 3 886 971 7 646 7 700 Recettes non fiscales Grants 23 252 30 120 29 671 30 530 49 907 62 003 80 151 107 740 71 743 Dons 158 Total Expenditures and Net Lending 115 542 127 320 145 988 158 434 204 463 222 029 277 432 347 679 323 917 Dépenses totales et prêts nets Current expenditure 95 766 107 069 123 137 137 195 184 776 196 531 245 337 305 541 287 438 Dépenses courantes Of which Wages and Salaries 30 516 33 816 37 266 41 190 45 918 52 153 62 062 75 194 87 484 Dont rémunérations et salaires Capital expenditure 19 776 20 251 22 851 21 239 19 687 25 498 32 095 42 138 36 480 Dépenses d'équipement Net Lending 0 0 0 0 0 0 0 0 0 Prêts nets Fiscal Balance - 37 224 - 38 174 - 44 109 - 48 448 - 54 943 - 41 813 - 58 932 - 69 110 - 98 931 Solde global y compris les dons VII-3 Balance of Payments VII-3 Balance des paiements Egyptian Pound (Millions) Pound Egyptien(Millions) Trade balance - 33 820 - 38 709 - 48 540 - 59 866 - 68 717 - 91 864 - 127 203 - 140 122 - 140 856 Balance commerciale Services Balance 16 378 29 581 46 624 46 785 43 916 58 201 73 920 69 591 82 448 Balance des services Net Income 431 - 627 - 1 281 578 4 587 8 459 7 606 5 566 - 24 474 Revenus nets Current transfers, net total 19 133 21 118 24 377 32 939 33 252 46 805 53 239 37 851 58 672 Transferts courants Current account balance 2 122 11 362 21 179 20 436 13 038 21 601 7 561 - 27 114 - 24 210 Solde du compte courant VII-4 External Debt and Financial Flows VII-4 Dette extérieure et flux financiers US $ (Millions) $ E.U (Millions) Total external debt 28 661 29 396 29 872 28 949 29 593 29 898 33 892 31 531 30 969 Dette extérieure totale Private 2 530 2 190 2 258 1 732 4 431 4 209 3 745 3 289 4 249 Privée Public 26 132 27 206 27 614 27 217 25 162 25 689 30 147 28 242 26 720 Publique Total external debt service 3 788 3 890 3 874 4 175 5 150 4 160 4 451 5 664 4 521 Service de la dette extérieure Net Foreign Direct Investment Investissements étranger direct 647 237 2 157 5 376 10 043 11 578 9 495 6 712 ... Inflows (flux nets entrants) Net Total Official Development Aide publique au développement 1 231 982 1 506 994 873 1 107 1 344 925 ... assistance (nette totale) African Statistical Yearbook 2011 / Annuaire Statistique pour l'Afrique 2011
  • 160.
    Egypt Egypte 2002 2003 2004 2005 2006 2007 2008 2009 2010 US $ Pound Egyptien Exports, fob Exportations, fàb Exports - Total 7 121 8 205 10 453 13 833 18 455 22 018 29 356 25 169 ... Exportations - Total Main Products Principaux produits Crude Oil 686 1 117 1 414 1 938 3 214 3 128 4 911 4 004 ... Pétrole brut Peutroleum Products 1 695 2 044 2 497 3 361 7 009 6 980 9 562 7 000 ... Produits pétroliers Cotton 83 199 202 138 146 110 194 83 ... Coton Carbon 20 47 21 10 25 27 75 74 ... Carbon Rice 79 63 58 141 136 146 162 77 ... Riz Main Destinations Principales destinations United States 1 416.6 1 219.3 1 438.6 2 221.0 2 573.4 2 545.0 2 484.4 2 169.4 ... États-Unis Italy 1 059.6 1 120.2 1 587.2 1 582.5 2 674.0 2 491.3 3 296.3 2 009.4 ... Italie Spain 249.2 373.5 567.9 1 321.2 1 992.0 2 017.6 2 327.7 1 999.4 ... Espagne United Kingdom 620.3 745.4 864.9 605.2 1 090.5 1 071.4 1 039.9 877.4 ... Royaume-Uni India 198.5 143.8 125.0 228.5 1 414.4 1 877.3 2 081.4 1 716.9 ... Inde 2002 2003 2004 2005 2006 2007 2008 2009 2010 Imports, cif Importations, cif Imports - Total 12 496 10 893 12 841 19 812 20 594 27 033 52 772 44 934 ... Importations - Total (millions) 159 Principaux produits Main Products Wheat nes and meslin 636 679 898 774 1 015 1 870 2 079 1 551 ... Blé nda et méteil Petroleum oils&oils obtained from Huiles de pétrole, bitumineux, bituminous minerals,o/than crude 54 111 100 868 1 262 1 556 1 303 1 699 ... distilles, sauf brut etc Automobiles w reciprocatg piston Automobiles w reciprocatg moteur à engine displacg > 1500 cc to 3000 72 125 163 421 599 854 1 080 876 ... piston displacg> 1500 cc à 3000 cc cc Ferrous waste and scrap, iron or Déchets et débris de fonte, fer ou 61 75 211 262 489 465 1 062 331 ... steel, nes acier, nda Maize, nes 485 518 426 519 456 803 924 845 ... Maïs, nda Main Origin Principales provenances United States 2 866.2 2 659.4 3 104.5 3 168.9 4 103.8 5 347.1 6 030.8 5 257.6 ... États-Unis China 852.9 936.8 1 388.4 1 934.0 2 975.5 4 468.1 5 874.3 5 107.4 ... Chine Germany 1 295.6 1 462.3 1 774.5 2 109.4 2 386.1 2 929.4 3 926.7 3 716.6 ... Allemagne Italy 1 113.0 1 333.9 1 654.2 1 699.9 1 911.7 2 924.7 4 248.1 3 609.8 ... Italie France 970.9 1 114.8 1 257.1 1 765.2 1 670.9 1 649.0 1 778.9 1 906.7 ... France African Statistical Yearbook 2011 / Annuaire Statistique pour l'Afrique 2011
  • 161.
    Equatorial Guinea Guinée Equatoriale AREA (KM 2) 28 051 SUPERFICIE (KM 2) CAPITAL CITY Malabo Malabo CAPITALE CURRENCY CFA Franc Franc CFA MONNAIE I SOCIAL AND DEMOGRAPHIC INDICATORS — INDICATEURS DEMOGRAPHIQUES ET SOCIAUX 2002 2003 2004 2005 2006 2007 2008 2009 2010 Population Population Population au milieu de l'année - Mid-year population - Total (Million) 0.6 0.6 0.6 0.6 0.6 0.6 0.7 0.7 0.7 Total (million) Population au milieu de l'année - Mid-year population - Urban (%) 38.8 38.8 38.9 38.9 39.0 39.2 39.3 39.5 39.7 Urbaine (%) Female (%) 50.5 50.5 50.5 50.5 50.5 50.4 50.4 50.4 50.4 Femme (%) Population by Age Group Population par groupe d'âge 0-14 243 869 248 378 252 745 257 215 261 864 266 682 271 718 276 995 282 531 0-14 15-64 297 399 308 725 320 396 332 200 344 069 355 996 367 871 379 595 391 098 15-64 65+ 19 134 19 239 19 325 19 392 19 461 19 532 19 608 19 683 19 756 65+ Active Population (000) 200.6 208.9 217.4 225.9 234.4 242.9 251.3 261.3 269.9 Population active (000) Female (%) 28.2 28.7 29.1 29.4 29.7 29.9 30.1 30.9 31.1 Femme (%) Taux brut de natalité - Total (par Crude birth rate - Total (per 1000) 39.0 39.0 39.0 38.0 38.0 38.0 38.0 38.0 38.0 1000) Taux brut de mortalité - Total (par Crude death rate - Total (per 1000) 16.0 16.0 16.0 16.0 16.0 15.0 15.0 15.0 15.0 1000) Life expectancy at birth - Total Espérance de vie à la naissance - 49.0 49.0 49.0 49.0 50.0 50.0 50.0 51.0 50.0 (years) Total (années) Net reproduction rate - (per Taux net de reproduction - (par ... ... ... 2.0 ... ... ... ... 2.0 woman) femme) Indice synthétique de fécondité - Total fertility rate - (per woman) 6.0 6.0 6.0 6.0 5.0 5.0 5.0 5.0 5.0 (p femme) (par ) Education Enseignement Teaching staff at first level - Total Personnel enseignant - 1er degré - ... 2.3 ... ... ... ... 2.9 3.4 ... (thousands) Total (milliers) Teaching staff at second level - Personnel enseignant - 2ème degré ... ... ... ... ... ... ... ... ... 160 Total (thousands) - Total (milliers) Teaching staff at third level - Total Personnel enseignant - 3ème degré ... ... ... ... ... ... ... ... ... (thousands) - Total (milliers) First level student enrollment - Elèves inscrits - 1er degré - Total 78 74 ... 76 ... ... 81 82 ... Total (thousands) (milliers) First level student enrollment - Elèves inscrits - 1er degré - 37 36 ... 37 ... ... 39 40 ... Female (thousands) Femmes (milliers) Second level student enrollment - Elèves inscrits - 2ème degré - Total 21 ... ... ... ... ... ... ... ... Total (thousands) (milliers) Second level student enrollment - Elèves inscrits - 2ème degré - 8 ... ... ... ... ... ... ... ... Female (thousands) Femmes (milliers) Third level student enrollment - Elèves inscrits - 3ème degré - Total ... ... ... ... ... ... ... ... ... Total (thousands) (milliers) Third level student enrollment - Elèves inscrits - 3ème degré - ... ... ... ... ... ... ... ... ... Female (thousands) Femmes (milliers) Public expenditure on education (% Dépenses publiques consacrées à 4.0 4.0 ... ... ... ... ... ... ... of budget) l'enseignement (% du budget) Health Santé Hospital beds - Total (per 10 000 Nombre de lits d'hôpitaux - Total ... ... 48 ... ... ... ... ... ... population) (pour 10 000) Nurses - Total (per 10 000 Nombre d'infirmières - Total (pour ... ... ... 220 ... ... ... 50 ... population) 10 000) Physicians - Total (per 10 000 Nombre de médecins - Total (pour ... ... 32 ... ... ... ... 30 ... population) 10 000) Public expenditure on Health (% of Dépenses publiques consacrées à 21 9 7 7 7 ... ... ... ... budget) la santé (% du budget) African Statistical Yearbook 2011 / Annuaire Statistique pour l'Afrique 2011
  • 162.
    Equatorial Guinea Guinée Equatoriale II NATIONAL ACCOUNTS — COMPTES NATIONAUX 2002 2003 2004 2005 2006 2007 2008 2009 2010 Gross domestic product by kind of economic activity at current prices Produit intérieur brut par branche d'activité économique aux prix courants CFA Franc (Millions) Franc CFA (Millions) Agriculture 1 258 903 1 353 002 2 198 244 3 381 515 3 830 831 4 082 408 5 323 007 3 110 128 3 906 174 Agriculture Mining and quarrying 81 443 106 782 141 746 198 399 340 569 739 171 1 347 724 1 018 522 1 500 555 Industries extractives Manufacturing 2 104 2 622 3 267 3 975 4 837 5 921 7 150 8 783 10 945 Industries manufacturières Electricity, gas & water 5 956 7 034 10 255 13 865 19 994 25 792 30 950 36 521 43 825 Electricité, gaz et eau Construction 20 995 24 861 51 655 66 900 118 976 157 827 218 727 347 516 326 250 Bâtiments et travaux publics Wholesale & retail trade, 17 152 21 044 27 841 32 227 36 029 39 588 43 607 48 766 52 967 Commerce de gros et de détail, restaurants, hotels restaurants et hôtels Banques, assurances, affaires Finance, insurance, real estate, etc. 3 687 4 524 7 251 12 154 14 138 17 327 24 029 28 362 43 205 immobilières Transport and communications 3 353 4 114 4 465 5 168 5 778 6 049 6 663 7 398 8 036 Transport(s) et communications Administrations publiques et Public administration and defense 30 047 34 538 34 889 42 631 46 613 57 481 58 866 74 654 129 285 défense Other services 7 109 10 823 11 746 13 597 15 201 17 103 19 339 21 283 23 117 Autres services Moins Services d’intermédiation Less Imputed Service Charges ... ... ... ... ... ... ... ... ... financière Gross domestic product at factor Produit intérieur brut aux couts des 1 430 749 1 569 343 2 491 359 3 770 431 4 432 966 5 148 666 7 080 061 4 701 933 6 044 357 cost / basic prices facteurs / prix de base Plus: Indirect Taxes / taxes on Plus taxes indirectes/impôts sur les 23 518 31 026 30 905 30 243 39 061 47 061 61 985 80 075 90 253 products, less subsidies produits, moins les subventions Expenditure on Gross domestic product at current purchaser's values Emploi du produit intérieur brut aux prix courants d'acquisition CFA Franc (Millions) Franc CFA (Millions) Consommation finale des Government final consumption 76 901 65 023 81 348 118 592 128 125 137 874 195 586 224 841 268 750 administrations publiques Private final consumption 205 001 225 758 253 510 289 200 317 888 352 175 389 978 374 706 530 714 Consommation finale privée Gross fixed capital f G fi d it l formation ti 462 457 679 558 659 582 824 373 1 203 687 1 596 819 2 146 431 3 321 521 3 004 007 Formation b t d capital fi F ti brute de it l fixe Increase in inventories 100 200 200 200 200 200 200 200 200 Variation des stocks Exports of goods and services 1 492 989 1 584 036 2 503 705 3 745 182 4 327 686 4 984 292 6 839 862 4 277 112 5 569 067 Exportations de biens et services Less imports of goods and services 783 181 954 207 976 081 1 176 874 1 505 559 1 875 633 2 430 012 3 416 372 3 238 128 Moins importations de biens et 161 services GDP at purchasers' values 1 454 267 1 600 369 2 522 264 3 800 674 4 472 027 5 195 727 7 142 045 4 782 007 6 134 610 PIB aux prix d'acquisition Gross domestic product by kind of economic activity at constant Produit intérieur brut par branche d'activité economique aux prix constants prices Annual Growth Rates (%) Taux de croissance annuel (%) Agriculture 15.6 15.2 29.3 2.4 -3.7 3.8 0.3 -10.3 -7.2 Agriculture Mining and quarrying 53.4 6.1 49.8 29.3 10.3 103.1 41.4 14.5 8.1 Industries extractives Manufacturing 13.6 17.3 20.6 17.7 17.7 14.4 14.8 16.9 20.6 Industries manufacturières Electricity, gas & water 21.4 18.2 41.8 35.2 44.2 20.0 13.5 11.5 16.0 Electricité, gaz et eau Construction 39.5 11.1 107.8 29.5 77.8 30.8 26.6 27.1 -9.1 Bâtiments et travaux publics Wholesale & retail trade, Commerce de gros et de 20.9 15.4 27.3 10.8 6.8 4.4 4.2 6.0 3.6 restaurants, hotels détail,restaurants et hôtels Banques, assurances, affaires Finance, insurance, real estate, etc. 16.1 19.7 55.3 62.6 11.3 17.1 35.2 15.0 47.3 immobilières Transport and communications 24.8 17.9 3.5 10.8 6.8 -0.3 3.2 6.0 3.6 Transport(s) et communications Administrations publiques et Public administartion and defense 14.6 13.9 1.0 22.2 9.3 22.3 1.4 16.8 72.2 défense Other services 13.1 50.2 3.1 11.1 6.8 6.5 7.9 4.1 3.6 Autres services Moins Services d’intérmediation Less Imputed Service Charges ... ... ... ... ... ... ... ... ... financière Gross domestic product at factor Produit intérieur brut aux couts des 20.4 14.3 33.8 9.1 5.5 24.1 15.5 4.6 1.3 cost / basic prices facteurs / prix de base Plus: Indirect Taxes / taxes on Plus taxes indirectes/impôts sur les 24.0 21.8 -31.4 -19.1 14.0 4.1 12.2 4.8 2.7 products, less subsidies produits, moins les subventions Gross domestic product at market Produit intérieur brut aux prix du 20.4 14.4 32.6 8.9 5.6 24.0 15.5 4.6 1.3 prices marché 2008: semi-final 2009: Provisional 2010:Estimated 2008: semi-définitif 2009: provisoire 2010:Estimée African Statistical Yearbook 2011 / Annuaire Statistique pour l'Afrique 2011
  • 163.
    Equatorial Guinea Guinée Equatoriale Expenditure on Gross domestic product at constant purchasers' Emplois du produit intérieur brut aux prix constants d'acquisition values Annual Growth Rates (%) Taux de croissance annuel (%) Consommation finale des Government final consumption 78.0 -22.7 -9.0 40.8 3.0 2.1 35.9 9.0 15.5 administrations publiques Private final consumption 35.6 4.3 15.1 9.9 -2.2 7.3 3.2 7.5 6.8 Consommation finale privée Gross fixed capital formation -29.8 44.7 0.8 15.8 9.1 27.7 30.8 33.2 -3.1 Formation brute de capital fixe Exports of goods and services 18.3 13.0 39.1 5.0 -3.8 12.9 8.5 -1.6 -5.9 Exportations de biens et services Moins importations de biens et Less imports of goods and services -28.6 37.8 -6.6 16.1 0.3 14.2 29.9 43.8 -5.5 services III INFLATION 2002 2003 2004 2005 2006 2007 2008 2009 2010 Annual Growth Rates (%) Taux de croissance annuel (%) All Item 7.6 7.3 4.2 5.7 4.4 2.8 6.0 5.5 4.7 Ensemble Food ... ... ... ... ... ... ... ... ... Alimentation Health ... ... ... ... ... ... ... ... ... Santé Energy ... ... ... ... ... ... ... ... ... Energie Transport ... ... ... ... ... ... ... ... ... Transport IV AGRICULTURAL PRODUCTION - PRODUCTION AGRICOLE 2002 2003 2004 2005 2006 2007 2008 2009 2010 Tons (Thousand) Tonnes (milliers) Cassava, Tons (thousands) 45 45 45 45 45 45 45 ... ... Manioc, tonnes (milliers) Sweet Potato, Tons (thousands) 36 36 36 36 36 36 36 ... ... Patates douces, tonnes (milliers) Plantains, Tons (thousands) 31 31 31 31 31 31 31 ... ... Plantains, tonnes (milliers) Banana, Tons (thousands) 20 20 20 20 20 20 20 ... ... Banane, tonnes (milliers) Coconuts, Tons (thousands) 6 6 6 6 6 6 6 ... ... Noix de coco, tonnes (milliers) V MINING PRODUCTION - PRODUCTION MINIERE 162 2002 2003 2004 2005 2006 2007 2008 2009 2010 Crude petroleum, metric tons Pétrole brut, tonnes métriques 11 410.0 12 989.0 17 662.0 17 973.0 17 144.0 17 513.0 ... ... ... (thousands) (milliers) Natural gas (terajoules) 18 537.0 18 773.0 25 030.0 45 030.0 55 030.0 65 250.0 ... ... ... Gaz naturel (térajoules) Gold ores and concentrates, Minerais d'or et concentrés 500.0 500.0 500.0 ... ... ... ... ... ... Kilograms (Kilogrammes) VI ENERGY - ENERGIE 2002 2003 2004 2005 2006 2007 2008 2009 2010 Electricity - total hydro production, Électricité - production hydraulique 7.0 7.0 7.0 7.0 7.0 2.0 ... ... ... kilowatt hours (millions) totale, kilowatt-heures (millions) Electricity - total thermal Électricité - production thermique 60.0 73.0 78.0 83.0 88.0 93.0 ... ... ... production, kilowatt hours (millions) totale, kilowatt-heures (millions) Electricity - total production, self- Electricité - Production totale privée 0 0 0 0 0 0 ... ... ... producer (Million Kilowatt Hours) (million de kilowatt heures) Electricité - Production totale Electricity - total production, public 67 80 85 90 95 95 ... ... ... publique (million de kilowatt (Million Kilowatt Hours) heures) African Statistical Yearbook 2011 / Annuaire Statistique pour l'Afrique 2011
  • 164.
    Equatorial Guinea Guinée Equatoriale VII TOURISM AND INFRASTRUCTURE - TOURISME ET INFRASTUCTURE 2002 2003 2004 2005 2006 2007 2008 2009 2010 Arrivals - Tourists (thousands) ... ... ... ... ... ... ... ... ... Arrivées - touristes (milliers) Rooms in hotels and similar Chambres d'hotels et établissements establishments (thousands) assimilés (milliers) ... ... ... ... ... ... ... ... ... Paved Road (% of total) ... ... ... ... ... ... ... ... ... Routes asphaltées (% du total) Total Network (Railways-km) ... ... ... ... ... ... ... ... ... Réseau total voies ferrées-Km Main Telephone Lines (per 1,000 Lignes téléphoniques fixes (pour 20 20 20 20 20 20 20 10 ... inhabitants) 1000 habitants) Mobile Cellular Subscribers (per Abonnés aux téléphones mobiles 60 70 100 160 220 340 520 660 ... 1,000 inhabitants) (pour 1000 habitants) VII FINANCIAL AND MONETARY STATISTICS - FINANCES ET STATISTIQUES MONETAIRES 2002 2003 2004 2005 2006 2007 2008 2009 2010 VII-1 Monetary Statistics VII-1 Statistiques monétaires CFA Franc (Millions) Franc CFA (Millions) Money supply (M1) 73 275 114 449 170 531 234 232 261 013 372 169 523 113 611 263 928 495 Masse monétaire (M1) Quasi-money 25 808 40 793 36 646 44 822 57 512 77 748 62 270 84 103 90 545 Quasi-monnaie of which Demand Deposit ... ... ... ... ... ... ... ... ... dont Monnaie scripturale Net foreign assets 104 237 153 306 499 255 1 240 660 1 573 640 1 800 190 2 237 590 1 561 250 1 060 890 Avoirs extérieurs nets Domestic credit 3 410 17 270 - 269 165 - 933 619 -1 224 590 -1 339 670 -1 686 980 - 698 559 46 657 Crédit intérieur of which claims on private sector 52 768 50 759 62 078 92 385 124 504 175 644 362 178 401 903 567 077 dont créances sur le secteur privé of which Claims on government dont créances nettes sur le - 50 811 - 34 346 - 332 006 -1 027 450 -1 354 040 -1 524 060 -2 071 320 -1 124 660 - 546 357 sector, net gouvernement International reserves (millions of US Réserves internationales (millions 89 238 945 2 102 3 067 3 846 4 431 3 252 2 287 $) de $ EU) Average Exchange Rate (National Taux de change (moyen) (monnaie 696.99 581.20 528.29 527.47 522.89 479.27 447.81 472.19 495.28 Currency per us $) nationale par dollars) VII-2 Public Finance VII-2 Finances publiques CFA Franc (Millions) Franc CFA (Millions) Total Revenues and Grants 414 500 472 300 773 525 1 410 189 2 103 730 2 308 526 3 051 786 2 368 087 2 798 772 Recettes totales et dons Tax Revenue 400 652 454 632 751 285 1 363 559 2 038 599 2 169 606 2 952 362 2 293 388 ... Recettes fiscales Non Tax Revenue 13 848 17 668 22 240 46 630 65 131 138 920 99 424 74 699 ... Recettes non fiscales Grants 0 0 0 0 0 0 0 0 ... Dons 163 Total Expenditures and Net Lending 227 236 257 524 484 976 609 880 954 248 1 233 481 1 759 331 2 827 522 2 716 462 Dépenses totales et prêts nets Current expenditure 76 901 65 023 81 348 118 592 128 125 137 918 195 586 224 842 ... Dépenses courantes Of which Wages and Salaries 26 047 27 538 30 889 36 631 40 613 52 481 56 366 70 654 ... Dont rémunérations et salaires Capital expenditure 126 634 169 741 363 035 446 003 759 837 1 018 846 1 391 510 2 482 257 ... Dépenses d'équipement Net Lending 0 0 0 0 0 0 0 0 ... Prêts nets Fiscal Balance 187 264 214 776 288 549 800 309 1 149 482 1 075 045 1 292 455 - 459 435 82 310 Solde global y compris les dons VII-3 Balance of Payments VII-3 Balance des paiements CFA Franc (Millions) Franc CFA (Millions) Trade balance 1 121 641 908 887 1 910 726 3 035 135 3 235 187 3 570 560 4 698 955 1 226 928 ... Balance commerciale Services Balance - 411 833 - 418 707 - 383 102 - 466 826 - 427 445 - 523 155 - 722 423 - 760 733 ... Balance des services Net Income - 898 780 - 735 548 -1 280 682 -1 832 249 -2 385 022 -2 968 017 -3 683 736 -1 365 148 ... Revenus nets Current transfers, net total - 7 738 - 4 335 - 10 077 - 13 998 - 17 579 - 21 915 - 27 159 - 33 492 ... Transferts courants Current account balance - 196 711 - 249 703 236 865 722 062 405 141 57 473 265 638 - 932 445 ... Solde du compte courant VII-4 External Debt and Financial Flows VII-4 Dette extérieure et flux financiers US $ (Millions) $ E.U (Millions) Total external debt 447 307 323 245 156 136 120 620 1 093 Dette extérieure totale Private 234 1 1 1 1 1 1 502 993 Privée Public 212 306 322 244 155 135 119 118 100 Publique Total external debt service 6 10 11 39 97 37 10 20 34 Service de la dette extérieure Net Foreign Direct Investment Investissements étranger direct 323 690 341 769 470 1 243 - 794 1 636 ... Inflows (flux nets entrants) Net Total Official Development Aide publique au développement 20 21 29 38 26 31 32 32 ... assistance (nette totale) African Statistical Yearbook 2011 / Annuaire Statistique pour l'Afrique 2011
  • 165.
    Equatorial Guinea Guinée Equatoriale 2002 2003 2004 2005 2006 2007 2008 2009 2010 US $ (Millions) Franc CFA Exports, fob Exportations, fàb Exports - Total 2 120 2 804 4 711 7 060 8 212 10 210 14 440 6 382 ... Exportations - Total Main Products Principaux produits Crude oil 1 936 2 476 4 337 6 607 7 457 8 508 12 687 ... ... Pétrole brut Methanol and Other Gases 123 194 283 396 686 1 624 4 438 ... ... Méthanol et Autres Gaz Lumber 48 31 56 28 48 71 65 ... ... Bois Cocoa 2 2 2 1 2 2 3 ... ... Cacao Coffee 0 0 0 0 0 0 0 ... ... Café Main Destinations Principales destinations United States 553.6 963.0 1 258.8 1 675.3 1 825.4 1 861.8 3 495.1 2 587.1 ... États-Unis China 382.7 411.9 996.6 1 437.8 2 537.6 1 697.3 2 267.9 1 055.1 ... Chine Spain 488.4 762.1 684.7 739.2 1 043.8 1 239.1 2 787.9 639.1 ... Espagne Taiwan, China 24.3 53.3 640.2 489.0 870.3 1 213.9 1 566.9 485.9 ... Taiwan, Chine France 97.2 24.7 62.2 217.4 187.4 667.7 1 202.1 337.5 ... France 2002 2003 2004 2005 2006 2007 2008 2009 2010 Imports, cif Importations, cif 164 Imports - Total 443 1 224 737 1 116 1 619 1 344 1 726 1 985 ... Importations - Total (millions) Principaux produits Main Products Petroleum oils&oils obtained from Huiles de pétrole, bitumineux, bituminous minerals,o/than crude 5 32 59 104 119 117 166 113 ... distilles, sauf brut etc Aircraft nes of an unladen weight > Aéronefs nda d'un poids à vide > 1 0 0 3 1 16 50 13 ... 2,000 kg but not exceedg 15,000 kg 2.000 kg mais pas sup 15.000 kg Parts of boring or sinking machinery, Pièces du forage ou de fonçage, 82 141 104 76 244 105 41 74 ... whether or not self-propelled qu'ils soient ou non autopropulsés Electric conductors, for a voltage Conducteurs électriques, pour une >80V but not exceeding 1,000 V, 2 1 1 2 4 5 53 42 ... tension> 80 V mais n'excédant pas nes 1 000 V nda Bars & rods,i/nas,hr,hd or he,cntg Barres, i / nas, hr, hd ou he, ,cntg 1 1 4 4 8 20 34 23 ... indent,ribs,etc,prod dur rp/tar,nes indent,ribs, etc, prod dur rp/tar, nda Main Origin Principales provenances United States 108.7 336.3 215.4 249.1 551.5 236.4 184.5 305.9 ... États-Unis Spain 60.8 90.3 112.9 112.5 145.3 174.3 213.4 271.3 ... Espagne Cote d'Ivoire 17.3 131.1 36.3 87.5 114.6 104.9 148.4 112.6 ... Côte d'Ivoire United Kingdom 54.8 177.9 62.8 70.6 83.6 77.7 79.1 68.0 ... Royaume-Uni France 38.0 89.1 42.5 63.6 89.7 114.9 169.8 164.7 ... France African Statistical Yearbook 2011 / Annuaire Statistique pour l'Afrique 2011
  • 166.
    Eritrea Erythrée AREA (KM 2) 117 600 SUPERFICIE (KM 2) CAPITAL CITY Asmara Asmara CAPITALE CURRENCY Nakfa Nakfa MONNAIE I SOCIAL AND DEMOGRAPHIC INDICATORS — INDICATEURS DEMOGRAPHIQUES ET SOCIAUX 2002 2003 2004 2005 2006 2007 2008 2009 2010 Population Population Population au milieu de l'année - Mid-year population - Total (Million) 4.0 4.1 4.3 4.5 4.6 4.8 4.9 5.1 5.2 Total (million) Population au milieu de l'année - Mid-year population - Urban (%) 18.4 18.7 19.0 19.4 19.8 20.2 20.6 21.1 21.6 Urbaine (%) Female (%) 50.5 50.5 50.5 50.5 50.5 50.4 50.4 50.4 50.4 Femme (%) Population by Age Group Population par groupe d'âge 0-14 1719 113 1767 144 1818 449 1872 445 1928 595 1986 520 2045 923 2106 565 2168 012 0-14 15-64 2149 762 2269 378 2386 347 2494 760 2592 004 2679 613 2761 025 2841 714 2925 759 15-64 65+ 94 309 97 855 101 741 105 917 110 353 115 036 119 929 125 000 130 223 65+ Active Population (000) 1 552.2 1 651.8 1 747.1 1 835.3 1 917.2 1 989.9 2 057.4 2 154.6 2 230.3 Population active (000) Female (%) 42.7 43.1 43.3 43.5 43.6 43.7 43.7 44.5 44.7 Femme (%) Taux brut de natalité - Total (par Crude birth rate - Total (per 1000) 38.0 38.0 38.0 38.0 38.0 38.0 37.0 36.0 37.0 1000) Taux brut de mortalité - Total (par Crude death rate - Total (per 1000) 10.0 10.0 9.0 9.0 9.0 9.0 8.0 8.0 9.0 1000) Life expectancy at birth - Total Espérance de vie à la naissance - 57.0 57.0 58.0 58.0 59.0 59.0 60.0 60.0 59.0 (years) Total (années) Net reproduction rate - (per Taux net de reproduction - (par ... ... ... 2.0 ... ... ... ... 2.0 woman) femme) Indice synthétique de fécondité - Total fertility rate - (p woman) y (per ) 5.0 5.0 5.0 5.0 5.0 5.0 5.0 5.0 5.0 (par femme) Education Enseignement Teaching staff at first level - Total Personnel enseignant - 1er degré - 7.50 7.7 8.0 7.9 7.7 6.9 6.6 7.8 ... (thousands) Total (milliers) Teaching staff at second level - Total Personnel enseignant - 2ème degré - 3.10 3.0 4.1 4.2 4.2 4.4 ... 5.6 ... 165 (thousands) Total (milliers) Teaching staff at third level - Total Personnel enseignant - 3ème degré - 0.3 0.2 0.4 ... ... ... ... 0.6 0.6 (thousands) Total (milliers) First level student enrollment - Total Elèves inscrits - 1er degré - Total 330 359 375 378 364 332 314 300 ... (thousands) (milliers) First level student enrollment - Elèves inscrits - 1er degré - Femmes 146 160 166 167 162 150 141 135 ... Female (thousands) (milliers) Second level student enrollment - Elèves inscrits - 2ème degré - Total 153 161 194 217 228 218 229 241 ... Total (thousands) (milliers) Second level student enrollment - Elèves inscrits - 2ème degré - 60 63 70 81 86 90 95 100 ... Female (thousands) Femmes (milliers) Third level student enrollment - Total Elèves inscrits - 3ème degré - Total 5.5 5.8 4.6 ... ... ... ... 9.9 10.2 (thousands) (milliers) Third level student enrollment - Elèves inscrits - 3ème degré - 0.7 0.8 0.6 ... ... ... ... 2.4 2.5 Female (thousands) Femmes (milliers) Public expenditure on education (% Dépenses publiques consacrées à ... ... ... ... ... ... ... ... ... of budget) l'enseignement (% du budget) Health Santé Hospital beds - Total (per 10 000 Nombre de lits d'hôpitaux - Total ... ... 58 ... ... ... ... 12 ... population) (pour 10 000) Nurses - Total (per 10 000 Nombre d'infirmières - Total (pour ... ... ... ... ... ... ... 60 ... population) 10 000) Physicians - Total (per 10 000 Nombre de médecins - Total (pour ... ... 5 ... ... ... ... 10 ... population) 10 000) Public expenditure on Health (% of Dépenses publiques consacrées à la 4 4 4 4 4 ... ... ... ... budget) santé (% du budget) African Statistical Yearbook 2011 / Annuaire Statistique pour l'Afrique 2011
  • 167.
    Eritrea Erythrée II NATIONAL ACCOUNTS — COMPTES NATIONAUX 2002 2003 2004 2005 2006 2007 2008 2009 2010 Gross domestic product by kind of economic activity at current prices Produit intérieur brut par branche d'activité économique aux prix courants Nakfa (Millions) Nakfa(Millions) Agriculture 1 061 1 613 1 923 3 577 4 331 4 716 4 790 6 634 ... Agriculture Mining and quarrying 117 148 201 217 217 269 267 360 ... Industries extractives Manufacturing 1 059 1 241 1 550 1 081 1 054 1 062 1 224 1 600 ... Industries manufacturières Electricity, gas & water ... ... ... ... ... ... ... ... ... Electricité, gaz et eau Construction 1 075 1 296 1 793 1 941 1 925 2 400 2 382 3 207 ... Bâtiments et travaux publics Wholesale & retail trade, Commerce de gros et de détail, 1 885 2 152 2 711 2 926 3 262 3 553 3 705 5 041 ... restaurants, hotels restaurants et hôtels Banques, assurances, affaires Finance, insurance, real estate, etc. ... ... ... ... ... ... ... ... ... immobilières Transport and communications 1 208 1 378 1 736 1 874 2 089 2 275 2 373 3 229 ... Transport(s) et communications Administrations publiques et Public administration and defense 2 664 3 143 3 920 4 213 4 727 5 133 5 353 7 290 ... défense Other services ... ... ... ... ... ... ... ... ... Autres services Moins Services d’intermédiation Less Imputed Service Charges ... ... ... ... ... ... ... ... ... financière Gross domestic product at factor Produit intérieur brut aux couts des 9 069 10 971 13 834 15 828 17 604 19 408 20 095 27 362 ... cost / basic prices facteurs / prix de base Plus: Indirect Taxes / taxes on Plus taxes indirectes/impôts sur les 1 111 1 106 1 457 1 052 1 017 856 1 126 1 439 ... products, less subsidies produits, moins les subventions Expenditure on Gross domestic product at current purchaser's values Emploi du produit intérieur brut aux prix courants d'acquisition Nakfa (Millions) Nakfa(Millions) Consommation finale des Government final consumption 4 037 5 628 5 598 5 948 4 827 5 195 5 594 5 760 ... administrations publiques Private final consumption 8 533 10 625 14 855 15 733 17 106 17 165 17 534 25 023 ... Consommation finale privée Gross fixed capital formation 3 008 3 206 3 098 3 433 2 548 2 568 2 698 2 628 ... Formation brute de capital fixe Increase in inventories ... ... ... ... ... ... ... ... ... Variation des stocks Exports of goods and services 1 199 778 883 1 041 1 285 1 170 940 1 293 ... Exportations de biens et services 166 Moins importations de biens et Less imports of goods and services 6 598 8 160 9 143 9 274 7 144 5 834 5 545 5 902 ... services GDP at purchasers' values 10 180 12 077 15 291 16 880 18 622 20 264 21 220 28 801 ... PIB aux prix d'acquisition Gross domestic product by kind of economic activity at constant Produit intérieur brut par branche d'activité economique aux prix constants prices Annual Growth Rates (%) Taux de croissance annuel (%) Agriculture -34.8 24.7 -4.5 72.9 8.7 1.5 -12.5 5.7 ... Agriculture Mining and quarrying 10.4 3.7 8.4 0.5 -10.3 15.6 -14.4 2.9 ... Industries extractives Manufacturing 7.7 -3.8 0.1 -35.2 -12.5 -6.1 -0.7 -0.2 ... Industries manufacturières Electricity, gas & water ... ... ... ... ... ... ... ... ... Electricité, gaz et eau Construction 13.3 -1.1 10.8 0.6 -11.0 16.2 -14.5 2.8 ... Bâtiments et travaux publics Wholesale & retail trade, Commerce de gros et de 8.2 -6.4 1.0 0.3 0.1 1.5 -10.2 3.9 ... restaurants, hotels détail,restaurants et hôtels Banques, assurances, affaires Finance, insurance, real estate, etc. ... ... ... ... ... ... ... ... ... immobilières Transport and communications 8.3 -6.4 1.0 0.3 0.1 1.5 -10.1 3.9 ... Transport(s) et communications Administrations publiques et Public administartion and defense 4.4 -3.2 -0.1 -0.1 0.7 1.2 -10.2 4.0 ... défense Other services ... ... ... ... ... ... ... ... ... Autres services Moins Services d’intérmediation Less Imputed Service Charges ... ... ... ... ... ... ... ... ... financière Gross domestic product at factor Produit intérieur brut aux couts des 0.0 -0.7 1.0 6.3 -0.2 2.8 -10.8 3.9 ... cost / basic prices facteurs / prix de base Plus: Indirect Taxes / taxes on Plus taxes indirectes/impôts sur les ... ... ... ... ... ... ... ... ... products, less subsidies produits, moins les subventions Gross domestic product at market Produit intérieur brut aux prix du 3.0 -2.7 1.5 2.6 -1.0 1.4 -9.8 3.6 ... prices marché 2008: semi-final 2009: Provisional 2008: semi-définitif 2009: provisoire African Statistical Yearbook 2011 / Annuaire Statistique pour l'Afrique 2011
  • 168.
    Eritrea Erythrée Expenditure on Gross domestic product at constant purchasers' Emplois du produit intérieur brut aux prix constants d'acquisition values Annual Growth Rates (%) Taux de croissance annuel (%) Consommation finale des Government final consumption -6.5 16.4 -19.0 -2.0 -25.5 2.0 1.1 -5.9 ... administrations publiques Private final consumption 13.0 -0.8 13.2 -4.1 -1.4 -4.6 -12.8 7.8 ... Consommation finale privée Gross fixed capital formation -14.4 6.4 -12.6 -21.3 -57.6 -45.3 -0.5 -36.9 ... Formation brute de capital fixe Exports of goods and services 7.2 -28.2 9.1 3.3 20.5 -10.9 -21.4 34.8 ... Exportations de biens et services Moins importations de biens et Less imports of goods and services 0.4 12.8 -2.5 -18.6 -35.9 -28.0 -10.0 5.2 ... services III INFLATION 2002 2003 2004 2005 2006 2007 2008 2009 2010 Annual Growth Rates (%) Taux de croissance annuel (%) All Item 16.9 22.7 25.1 12.5 15.1 9.3 19.9 34.7 20.5 Ensemble Food ... ... ... ... ... ... ... ... ... Alimentation Health ... ... ... ... ... ... ... ... ... Santé Energy ... ... ... ... ... ... ... ... ... Energie Transport ... ... ... ... ... ... ... ... ... Transport IV AGRICULTURAL PRODUCTION - PRODUCTION AGRICOLE 2002 2003 2004 2005 2006 2007 2008 2009 2010 Tons (Thousand) Tonnes (milliers) Sorghum, Tons (thousands) 28 64 45 114 223 303 303 ... ... Sorgho, tonnes (milliers) Barley, Tons (thousands) 10 9 11 9 52 39 39 ... ... Orge, tonnes (milliers) Potato, Tons (thousands) 15 11 16 17 12 1 1 1 ... Pomme de terre, tonnes (milliers) Millet, Tons (thousands) 5 12 8 17 56 63 63 ... ... Millet, tonnes (milliers) Cereals, nes, Tons (thousands) 3 7 8 19 26 22 22 ... ... Céréales, nda, tonnes (milliers) V MINING PRODUCTION - PRODUCTION MINIERE 167 2002 2003 2004 2005 2006 2007 2008 2009 2010 Gold ores and concentrates, Minerais d'or et concentrés ... ... ... ... ... ... ... ... ... Kilograms (Kilogrammes) Salt and pure sodium chloride, 116.0 52.0 53.0 6.0 10.0 7.0 ... ... ... Sel et chorure de sodium pur, metric tons (thousands) tonnes métriques (milliers) ... ... ... ... ... ... ... ... ... VI ENERGY - ENERGIE 2002 2003 2004 2005 2006 2007 2008 2009 2010 Electricity - total hydro production, Électricité - production hydraulique ... ... ... ... ... ... ... ... ... kilowatt hours (millions) totale, kilowatt-heures (millions) Electricity - total thermal production, Électricité - production thermique 258.0 276.0 282.0 288.0 267.0 286.0 ... ... ... kilowatt hours (millions) totale, kilowatt-heures (millions) Electricity - total production, self- Electricité - Production totale privée 9 12 9 9 9 10 ... ... ... producer (Million Kilowatt Hours) (million de kilowatt heures) Electricity - total production, public Electricité - Production totale 249 264 274 280 260 278 ... ... ... (Million Kilowatt Hours) publique (million de kilowatt heures) African Statistical Yearbook 2011 / Annuaire Statistique pour l'Afrique 2011
  • 169.
    Eritrea Erythrée VII TOURISM AND INFRASTRUCTURE - TOURISME ET INFRASTUCTURE 2002 2003 2004 2005 2006 2007 2008 2009 2010 Arrivals - Tourists (thousands) 101 80 87 83 78 81 ... ... ... Arrivées - touristes (milliers) Rooms in hotels and similar Chambres d'hotels et établissements establishments (thousands) 4 4 5 5 5 ... ... ... ... assimilés (milliers) Paved Road (% of total) ... ... ... ... ... ... ... ... ... Routes asphaltées (% du total) Total Network (Railways-km) ... ... ... ... ... ... ... ... ... Réseau total voies ferrées-Km Main Telephone Lines (per 1,000 Lignes téléphoniques fixes (pour 10 10 10 10 10 10 10 10 ... inhabitants) 1000 habitants) Mobile Cellular Subscribers (per Abonnés aux téléphones mobiles ... ... 5 10 10 20 20 30 ... 1,000 inhabitants) (pour 1000 habitants) VII FINANCIAL AND MONETARY STATISTICS - FINANCES ET STATISTIQUES MONETAIRES 2002 2003 2004 2005 2006 2007 2008 2009 2010 VII-1 Monetary Statistics VII-1 Statistiques monétaires Nakfa (Millions) Nakfa(Millions) Money supply (M1) 6 877 8 063 9 106 10 282 10 863 12 710 15 320 17 291 18 536 Masse monétaire (M1) Quasi-money 8 463 9 587 10 608 11 535 12 211 13 159 14 656 17 397 19 267 Quasi-monnaie of which Demand Deposit ... ... ... ... ... ... ... ... ... dont Monnaie scripturale Net foreign assets 3 130 3 507 3 994 3 127 2 747 2 488 2 898 4 031 5 366 Avoirs extérieurs nets Domestic credit 13 571 15 790 18 401 21 223 23 175 24 548 28 669 32 293 35 531 Crédit intérieur of which claims on private sector 2 913 3 648 4 120 4 653 4 839 4 202 4 681 4 787 5 334 dont créances sur le secteur privé of which Claims on government dont créances nettes sur le 9 691 11 689 13 719 15 874 17 743 19 778 23 391 26 949 29 614 sector, net gouvernement International reserves (millions of US Réserves internationales (millions de 30 25 35 28 25 34 58 ... ... $) $ EU) Average Exchange Rate (National Taux de change (moyen) (monnaie 13.96 13.88 13.79 15.37 15.38 15.38 15.38 15.38 15.38 Currency per us $) nationale par dollars) VII-2 Public Finance VII-2 Finances publiques Nakfa Nakfa Total Revenues and Grants ... ... ... ... ... ... ... ... ... Recettes totales et dons Tax Revenue ... ... ... ... ... ... ... ... ... Recettes fiscales Non Tax Revenue ... ... ... ... ... ... ... ... ... Recettes non fiscales 168 Grants ... ... ... ... ... ... ... ... ... Dons Total Expenditures and Net Lending ... ... ... ... ... ... ... ... ... Dépenses totales et prêts nets Current expenditure ... ... ... ... ... ... ... ... ... Dépenses courantes Of which Wages and Salaries ... ... ... ... ... ... ... ... ... Dont rémunérations et salaires Capital expenditure ... ... ... ... ... ... ... ... ... Dépenses d'équipement Net Lending ... ... ... ... ... ... ... ... ... Prêts nets Fiscal Balance ... ... ... ... ... ... ... ... ... Solde global y compris les dons VII-3 Balance of Payments VII-3 Balance des paiements Nakfa (Millions) Nakfa(Millions) Trade balance - 4 570 - 6 525 - 7 582 - 7 469 - 5 442 - 4 902 - 4 671 - 4 899 - 5 366 Balance commerciale Services Balance - 828 - 857 - 678 - 764 - 416 238 65 294 321 Balance des services Net Income - 85 - 134 - 211 - 145 - 134 - 111 - 181 - 266 - 306 Revenus nets Current transfers, net total 6 176 8 684 8 368 8 435 5 325 3 537 3 626 3 423 4 876 Transferts courants Current account balance 692 1 168 - 103 56 - 667 - 1 238 - 1 160 - 1 449 - 474 Solde du compte courant VII-4 External Debt and Financial Flows VII-4 Dette extérieure et flux financiers US $ (Millions) $ E.U (Millions) Total external debt 489 542 599 702 718 764 855 895 920 Dette extérieure totale Private 0 0 0 0 0 0 0 0 0 Privée Public 489 542 599 702 718 764 855 895 920 Publique Total external debt service 30 24 24 26 25 27 28 30 34 Service de la dette extérieure Net Foreign Direct Investment Investissements étranger direct (flux 20 22 - 8 - 1 0 0 0 0 ... Inflows nets entrants) Net Total Official Development Aide publique au développement 226 317 265 349 126 158 144 145 ... assistance (nette totale) African Statistical Yearbook 2011 / Annuaire Statistique pour l'Afrique 2011
  • 170.
    Eritrea Erythrée 2002 2003 2004 2005 2006 2007 2008 2009 2010 US $ (Millions) Nakfa Exports, fob Exportations, fàb Exports - Total ... ... ... ... ... ... ... ... ... Exportations - Total Main Products Principaux produits Diesel powered trucks with a GVW Diesel chariots de manutention d'un ... ... ... ... ... 0 5 0 ... exceeding twenty tonnes PTAC n'excédant pas cinq tonnes Sesamum seeds, whether or not Graines de sésame, même 0 0 1 1 1 2 2 1 ... broken concassées Mens/boys shirts, of cotton, not Hommes/garçons chemisiers en 0 ... ... 0 1 1 2 2 ... knitted coton, non tricotes Military weapons,other than Armes militaires, autres que les revolvers,pistols & arms of headg No ... ... ... ... ... ... 1 ... ... revolvers, pistolets et armes du n ° 93.07 93.07 Sel (y compris le sel de table et sel Salt (includg table salt&denaturd ... ... ... ... ... ... 1 0 ... denaturd) de chlorure de sodium salt) pure sodium chloride&sea water pur et l'eau de mer Main Destinations Principales destinations Dominican Republic 0.0 0.1 0.0 0.0 0.0 0.0 0.0 0.0 ... République dominicaine Germany 1.2 0.6 0.7 1.3 0.1 52.7 0.3 5.6 ... Allemagne Italy 2.8 1.4 1.7 2.1 3.0 5.4 4.0 3.7 ... Italie Kenya 0.0 0.0 0.1 12.0 0.4 0.0 2.5 0.3 ... Kenya India 0.0 0.2 0.9 0.8 0.6 1.0 6.8 0.1 ... Inde 2002 2003 2004 2005 2006 2007 2008 2009 2010 Imports, cif Importations, cif Imports - Total 208 313 391 338 276 350 256 353 ... Importations - Total (millions) 169 Principaux produits Main Products Refined sugar, in solid form, nes 1 4 0 15 7 12 16 28 ... Sucre raffiné, sous forme solide, nsa Wheat nes and meslin 17 33 25 16 6 17 12 14 ... Blé nda et méteil Wheeled tractors nes 1 2 1 6 1 2 8 1 ... Tracteurs à roues NDA Pneumatic tires new of rubber for Pneumatiques de nouveaux pneus 1 2 2 2 3 3 8 8 ... de caoutchouc pour autobus ou buses or lorries camions Veg fats&oils nes&their Veg Graisses & huiles NDA et leurs fractions,refind or not but not 0 2 7 0 0 0 0 0 ... fractions, refind ou non, mais non chemically mod chimiquement mod Main Origin Principales provenances Italy 49.6 41.8 48.1 81.9 38.2 36.3 37.5 39.7 ... Italie United States 28.8 87.1 54.0 31.1 8.8 6.1 14.9 6.7 ... États-Unis India 0.0 9.5 8.0 6.9 8.0 102.7 21.0 7.2 ... Inde United Arab Emirates 5.9 11.7 45.7 44.4 38.0 42.4 34.8 50.2 ... Emirats Arabes Unis China 6.0 5.5 7.5 7.8 37.9 26.9 29.0 39.5 ... Chine African Statistical Yearbook 2011 / Annuaire Statistique pour l'Afrique 2011
  • 171.
    Ethiopia Ethiopie AREA (KM 2) 1 104 300 SUPERFICIE (KM 2) CAPITAL CITY Addis Ababa Addis-Abeba CAPITALE CURRENCY Ethiopian Birr Birr Ethiopien MONNAIE I SOCIAL AND DEMOGRAPHIC INDICATORS — INDICATEURS DEMOGRAPHIQUES ET SOCIAUX 2002 2003 2004 2005 2006 2007 2008 2009 2010 Population Population Population au milieu de l'année - Mid-year population - Total (Million) 69.1 70.9 72.7 74.7 76.6 78.6 80.7 82.8 85.0 Total (million) Population au milieu de l'année - Mid-year population - Urban (%) ... 15.5 15.8 16.1 16.3 16.6 16.9 17.2 17.6 Urbaine (%) Female (%) 50.3 50.3 50.3 50.3 50.3 50.3 50.3 50.3 50.2 Femme (%) Population by Age Group Population par groupe d'âge 0-14 31450 593 32131 261 32799 571 33459 876 34113 224 34759 793 35401 948 36042 194 36682 132 0-14 15-64 35542 418 36611 568 37733 859 38910 405 40143 294 41431 791 42770 268 44150 696 45566 692 15-64 65+ 2065 602 2137 827 2212 796 2290 620 2371 180 2454 546 2541 219 2631 842 3037 099 65+ Active Population (000) 31 211.0 32 384.0 33 603.0 34 871.0 35 921.0 37 015.0 38 149.0 39 962.0 41 310.0 Population active (000) Female (%) 46.0 46.0 47.0 47.0 47.0 47.0 47.0 48.0 48.0 Femme (%) Taux brut de natalité - Total (par Crude birth rate - Total (per 1000) 41.0 40.0 40.0 40.0 39.0 39.0 38.0 38.0 38.0 1000) Taux brut de mortalité - Total (par Crude death rate - Total (per 1000) 14.0 13.0 13.0 13.0 12.0 12.0 12.0 12.0 13.0 1000) Life expectancy at birth - Total Espérance de vie à la naissance - 52.0 53.0 53.0 54.0 54.0 55.0 55.0 56.0 53.0 (years) Total (années) Net reproduction rate - (per Taux net de reproduction - (par ... ... ... 2.0 ... ... ... ... 2.0 woman) femme) Indice synthétique de fécondité - Total fertility rate - (per woman) 6.0 6.0 6.0 6.0 6.0 5.0 5.0 5.0 5.0 (par femme) Education Enseignement Teaching staff at first level - Total Personnel enseignant - 1er degré - ... ... ... ... ... ... 214.8 234.2 ... (thousands) Total (milliers) Teaching staff at second level - Personnel enseignant - 2ème degré - ... ... ... ... ... ... 80.0 81.9 ... Total (thousands) Total (milliers) 170 Teaching staff at third level - Total Personnel enseignant - 3ème degré - 3.3 4.2 4.8 4.8 4.8 7.8 8.4 ... ... (thousands) Total (milliers) First level student enrollment - Total Elèves inscrits - 1er degré - Total 7 213 7 623 8 270 10 020 10 972 12 175 13 379 13 571 ... (thousands) (milliers) First level student enrollment - Elèves inscrits - 1er degré - Femmes 2 984 3 196 3 596 4 516 5 058 5 665 6 277 6 451 ... Female (thousands) (milliers) Second level student enrollment - Elèves inscrits - 2ème degré - Total 1 734 1 858 2 141 2 488 2 993 3 430 3 696 3 926 ... Total (thousands) (milliers) Second level student enrollment - Elèves inscrits - 2ème degré - 665 676 778 927 1 152 1 371 1 547 1 707 ... Female (thousands) Femmes (milliers) Third level student enrollment - Elèves inscrits - 3ème degré - Total 101.8 148.0 172.1 191.2 180.3 255.5 264.8 ... ... Total (thousands) (milliers) Third level student enrollment - Elèves inscrits - 3ème degré - 26.9 37.3 43.3 46.6 43.7 65.7 62.9 ... ... Female (thousands) Femmes (milliers) Public expenditure on education (% Dépenses publiques consacrées à 15.6 18.2 20.4 19.7 17.5 23.3 ... ... ... of budget) l'enseignement (% du budget) Health Santé Hospital beds - Total (per 10 000 Nombre de lits d'hôpitaux - Total 14 20 20 20 20 ... 18 20 ... population) (pour 10 000) Nurses - Total (per 10 000 Nombre d'infirmières - Total (pour 12 12 14 ... ... ... 19 20 ... population) 10 000) Physicians - Total (per 10 000 Nombre de médecins - Total (pour 2 2 2 ... ... ... 1 ... ... population) 10 000) Public expenditure on Health (% of Dépenses publiques consacrées à la 10 11 10 10 10 ... ... ... ... budget) santé (% du budget) African Statistical Yearbook 2011 / Annuaire Statistique pour l'Afrique 2011
  • 172.
    Ethiopia Ethiopie II NATIONAL ACCOUNTS — COMPTES NATIONAUX 2002 2003 2004 2005 2006 2007 2008 2009 2010 Gross domestic product by kind of economic activity at current prices Produit intérieur brut par branche d'activité économique aux prix courants Ethiopian Birr (Millions) Birr Ethiopien(Millions) Agriculture 26 880 28 578 34 988 45 760 58 431 75 875 117 108 160 627 165 668 Agriculture Mining and quarrying 399 454 473 560 676 636 944 1 270 2 475 Industries extractives Manufacturing 3 508 3 867 4 216 4 683 5 533 7 136 9 251 11 813 14 467 Industries manufacturières Electricity, gas & water 1 471 1 574 1 812 1 952 2 316 3 136 3 481 3 717 4 457 Electricité, gaz et eau Construction 3 205 3 693 4 627 5 511 6 921 9 269 12 000 16 074 15 882 Bâtiments et travaux publics Wholesale & retail trade, Commerce de gros et de détail, 8 623 10 059 11 426 13 741 18 177 25 474 36 913 56 629 66 432 restaurants, hotels restaurants et hôtels Banques, assurances, affaires Finance, insurance, real estate, etc. 6 577 7 594 8 091 9 119 11 328 16 050 23 596 30 068 42 947 immobilières Transport and communications 3 732 4 187 5 012 6 824 6 863 7 928 9 350 12 766 15 967 Transport(s) et communications Administrations publiques et Public administration and defense 3 870 4 120 4 099 4 687 5 447 6 343 8 370 10 320 11 577 défense Other services 3 887 4 587 5 036 5 853 7 258 9 158 12 463 15 501 17 922 Autres services Moins Services d’intermédiation Less Imputed Service Charges - 374 - 509 - 594 - 683 - 1 007 - 1 200 - 1 657 - 2 544 - 2 843 financière Gross domestic product at factor Produit intérieur brut aux couts des 61 779 68 204 79 185 98 006 121 943 159 803 231 820 316 241 354 952 cost / basic prices facteurs / prix de base Plus: Indirect Taxes / taxes on Plus taxes indirectes/impôts sur les 4 778 5 228 7 476 8 467 9 698 12 186 16 785 19 139 28 412 products, less subsidies produits, moins les subventions Expenditure on Gross domestic product at current purchaser's values Emploi du produit intérieur brut aux prix courants d'acquisition Ethiopian Birr (Millions) Birr Ethiopien(Millions) Consommation finale des Government final consumption 9 873 9 850 11 315 13 203 16 080 18 072 24 364 27 592 27 592 administrations publiques Private final consumption 49 949 57 630 67 094 89 676 112 272 142 857 216 432 293 463 341 447 Consommation finale privée Gross fixed capital formation 16 052 16 305 22 705 25 293 33 176 44 294 56 055 75 377 75 377 Formation brute de capital fixe Increase in inventories ... ... ... ... ... ... ... ... ... Variation des stocks Exports of goods and services 8 389 9 779 12 914 16 077 18 205 21 854 28 317 35 233 35 233 Exportations de biens et services Less imports of goods and services 17 707 20 131 27 367 37 776 48 092 55 088 76 564 96 285 96 285 Moins importations de biens et 171 services GDP at purchasers' values 66 557 73 432 86 661 106 473 131 641 171 989 248 605 335 380 383 364 PIB aux prix d'acquisition Gross domestic product by kind of economic activity at constant Produit intérieur brut par branche d'activité economique aux prix constants prices Annual Growth Rates (%) Taux de croissance annuel (%) Agriculture -1.9 -10.5 16.9 13.5 10.9 9.4 7.5 6.4 7.6 Agriculture Mining and quarrying 10.5 4.1 2.0 4.1 7.2 -15.4 21.4 12.8 44.2 Industries extractives Manufacturing 1.3 0.8 6.6 12.8 10.6 8.3 10.3 9.1 10.0 Industries manufacturières Electricity, gas & water 9.7 4.8 6.6 7.9 8.8 13.6 4.8 5.0 5.1 Electricité, gaz et eau Construction 16.2 13.6 19.5 7.5 10.5 10.9 11.3 11.7 10.9 Bâtiments et travaux publics Wholesale & retail trade, Commerce de gros et de 3.6 3.6 5.2 12.8 17.9 18.5 17.2 14.0 11.7 restaurants, hotels détail,restaurants et hôtels Banques, assurances, affaires Finance, insurance, real estate, etc. 12.4 9.9 6.8 10.2 17.2 15.2 19.6 16.0 18.5 immobilières Transport and communications 5.6 10.5 9.5 19.2 5.7 9.3 11.5 8.9 13.8 Transport(s) et communications Administrations publiques et Public administartion and defense -15.6 1.4 0.2 11.6 6.4 11.8 12.5 18.4 3.4 défense Other services 5.6 5.2 9.5 11.4 8.9 15.8 13.7 11.9 12.6 Autres services Moins Services d’intérmediation Less Imputed Service Charges -36.1 14.7 18.5 16.5 40.3 13.5 30.0 12.5 8.7 financière Gross domestic product at factor Produit intérieur brut aux couts des 1.6 -2.1 11.7 12.6 11.5 11.8 11.2 10.0 10.4 cost / basic prices facteurs / prix de base Plus: Indirect Taxes / taxes on Plus taxes indirectes/impôts sur les 0.0 -3.0 37.6 3.1 2.7 7.2 5.6 -8.3 45.4 products, less subsidies produits, moins les subventions Gross domestic product at market Produit intérieur brut aux prix du 1.5 -2.2 13.6 11.8 10.8 11.5 10.8 8.8 12.4 prices marché 2009: semi-final 2010: Provisional 2009: semi-définitif 2010: provisoire African Statistical Yearbook 2011 / Annuaire Statistique pour l'Afrique 2011
  • 173.
    Ethiopia Ethiopie Expenditure on Gross domestic product at constant purchasers' Emplois du produit intérieur brut aux prix constants d'acquisition values Annual Growth Rates (%) Taux de croissance annuel (%) Consommation finale des Government final consumption 2.9 -11.4 11.0 5.0 9.0 -4.2 4.4 -9.0 12.4 administrations publiques Private final consumption 1.1 2.5 12.4 21.8 12.5 8.6 16.7 7.3 12.4 Consommation finale privée Gross fixed capital formation 12.8 -10.8 32.8 0.9 16.6 14.2 -5.3 15.0 12.4 Formation brute de capital fixe Exports of goods and services 6.6 3.3 27.2 13.3 1.3 2.6 0.3 -0.7 12.4 Exportations de biens et services Moins importations de biens et Less imports of goods and services 13.9 0.8 31.0 25.6 14.0 -2.0 7.7 -0.3 12.4 services III INFLATION 2002 2003 2004 2005 2006 2007 2008 2009 2010 Annual Growth Rates (%) Taux de croissance annuel (%) All Item -7.2 15.1 8.6 6.8 12.3 15.8 25.3 36.4 3.8 Ensemble Food ... ... ... ... ... ... ... ... ... Alimentation Health ... ... ... ... ... ... ... ... ... Santé Energy ... ... ... ... ... ... ... ... ... Energie Transport ... ... ... ... ... ... ... ... ... Transport IV AGRICULTURAL PRODUCTION - PRODUCTION AGRICOLE 2002 2003 2004 2005 2006 2007 2008 2009 2010 Tons (Thousand) Tonnes (milliers) Wheat, Tons (thousands) 1 448 1 618 2 177 2 307 2 779 2 219 2 463 2 538 ... Blé, tonnes (milliers) Barley, Tons (thousands) 1 184 1 087 1 376 1 398 1 410 1 271 1 352 1 519 ... Orge, tonnes (milliers) Maize, Tons (thousands) 2 826 2 744 2 906 3 912 4 030 3 337 3 776 3 933 ... Maïs, tonnes (milliers) Sorghum, Tons (thousands) 1 546 1 784 1 718 2 200 2 313 2 174 2 316 2 804 ... Sorgho, tonnes (milliers) Teff, Tons (thousands) ... 1 627 1 677 2 026 2 176 2 438 2 993 3 028 3 179 Téf, tonnes (milliers) V MINING PRODUCTION - PRODUCTION MINIERE 172 2002 2003 2004 2005 2006 2007 2008 2009 2010 Gold ores and concentrates, Minerais aurifères et concentrés, 3 206.0 3 862.0 3 670.0 3 875.0 4 500.0 3 726.0 3 828.0 3 300.0 ... Kilograms Kilogrammes Silver ores and concentrates, 1 018.0 4 000.0 1 100.0 1 100.0 1 000.0 883.0 902.0 900.0 ... Minerais d'argent et concentrés, Kilograms Kilogrammes Abrasives, natural, metric tons Abrasifs naturels, tonnes métriques 156.0 169.0 170.0 170.0 271.0 350.0 ... ... ... (thousands) (milliers) VI ENERGY - ENERGIE 2002 2003 2004 2005 2006 2007 2008 2009 2010 Electricity - total hydro production, Électricité - production hydraulique 2 023.0 2 280.0 2 521.0 2 852.0 3 259.0 3 369.0 ... ... ... kilowatt hours (millions) totale, kilowatt-heures (millions) Electricity - total thermal production, Électricité - production thermique 19.0 21.0 18.0 19.0 10.0 133.0 ... ... ... kilowatt hours (millions) totale, kilowatt-heures (millions) Electricity - total production, self- Electricité - Production totale privée ... ... ... ... ... ... ... ... ... producer (Million Kilowatt Hours) (million de kilowatt heures) Electricity - total production, public Electricité - Production totale 2 043 2 302 2 540 2 872 3 270 3 503 ... ... ... (Million Kilowatt Hours) publique (million de kilowatt heures) African Statistical Yearbook 2011 / Annuaire Statistique pour l'Afrique 2011
  • 174.
    Ethiopia Ethiopie VII TOURISM AND INFRASTRUCTURE - TOURISME ET INFRASTUCTURE 2002 2003 2004 2005 2006 2007 2008 2009 2010 Arrivals - Tourists (thousands) 156 180 184 227 290 312 330 ... ... Arrivées - touristes (milliers) Rooms in hotels and similar Chambres d'hotels et établissements establishments (thousands) 3 3 ... 3 ... ... ... ... ... assimilés (milliers) Paved Road (% of total) ... ... 19 ... ... ... ... ... ... Routes asphaltées (% du total) Total Network (Railways-km) ... ... ... ... ... ... ... ... ... Réseau total voies ferrées-Km Main Telephone Lines (per 1,000 Lignes téléphoniques fixes (pour 10 10 10 10 10 10 10 10 ... inhabitants) 1000 habitants) Mobile Cellular Subscribers (per Abonnés aux téléphones mobiles 0 0 0 10 10 20 20 50 ... 1,000 inhabitants) (pour 1000 habitants) VII FINANCIAL AND MONETARY STATISTICS - FINANCES ET STATISTIQUES MONETAIRES 2002 2003 2004 2005 2006 2007 2008 2009 2010 VII-1 Monetary Statistics VII-1 Statistiques monétaires Ethiopian Birr (Millions) Birr Ethiopien(Millions) Money supply (M1) 16 558 18 595 22 312 25 981 32 056 38 904 49 106 ... ... Masse monétaire (M1) Quasi-money 12 976 14 613 17 293 20 988 24 303 29 974 35 882 ... ... Quasi-monnaie of which Demand Deposit ... ... ... ... ... ... ... ... ... dont Monnaie scripturale Net foreign assets 10 680 13 252 15 056 14 790 13 746 16 278 13 118 ... ... Avoirs extérieurs nets Domestic credit 29 570 33 203 38 480 49 555 58 770 72 516 92 233 ... ... Crédit intérieur of which claims on private sector 12 057 12 950 14 434 20 241 27 126 32 106 44 312 ... ... dont créances sur le secteur privé of which Claims on government dont créances nettes sur le 16 101 18 621 20 487 25 543 28 056 35 302 37 006 ... ... sector, net gouvernement International reserves (millions of US Réserves internationales (millions de 882 956 1 497 1 043 867 1 290 871 1 781 ... $) $ EU) Average Exchange Rate (National Taux de change (moyen) (monnaie 8.57 8.60 8.64 8.67 8.70 8.97 9.60 11.78 ... Currency per us $) nationale par dollars) VII-2 Public Finance VII-2 Finances publiques Ethiopian Birr (Millions) Birr Ethiopien(Millions) Total Revenues and Grants 12 833 15 703 17 918 20 147 23 262 29 381 39 705 54 628 66 237 Recettes totales et dons Tax Revenue 7 926 8 243 10 906 12 398 14 159 17 354 23 801 28 998 43 315 Recettes fiscales Non Tax Revenue 2 483 2 906 3 010 3 184 5 371 4 444 5 993 11 176 10 546 Recettes non fiscales Grants 2 424 4 554 4 002 4 565 3 732 7 583 9 911 14 454 12 376 Dons 173 Total Expenditures and Net Lending 16 684 19 849 20 236 24 571 29 276 35 563 46 915 57 775 71 154 Dépenses totales et prêts nets Current expenditure 10 555 13 536 11 965 13 228 15 234 17 165 22 794 27 176 31 832 Dépenses courantes Of which Wages and Salaries 3 789 4 001 5 162 5 949 7 995 9 349 13 221 15 762 26 877 Dont rémunérations et salaires Capital expenditure 6 129 6 313 8 271 11 343 14 042 18 398 24 121 30 599 39 322 Dépenses d'équipement Net Lending ... ... ... ... ... ... ... ... ... Prêts nets Fiscal Balance - 3 851 - 4 146 - 2 318 - 4 424 - 6 014 - 6 182 - 7 210 - 3 147 - 4 917 Solde global y compris les dons VII-3 Balance of Payments VII-3 Balance des paiements US $ (Millions) $ E.U(Millions) Trade balance - 1 244 - 1 373 - 1 721 - 2 786 - 3 592 - 3 940 - 5 348 - 6 279 - 7 580 Balance commerciale Services Balance 153 167 310 277 149 161 126 419 546 Balance des services Net Income - 40 - 66 - 64 - 36 - 38 14 20 - 42 - 98 Revenus nets Current transfers, net total 783 1 164 1 338 1 772 2 096 2 895 3 699 4 281 4 923 Transferts courants Current account balance - 347 - 109 - 136 - 773 - 1 386 - 871 - 1 504 - 1 621 - 2 209 Solde du compte courant VII-4 External Debt and Financial Flows VII-4 Dette extérieure et flux financiers US $ (Millions) $ E.U (Millions) Total external debt 6 142 6 797 7 215 5 927 6 332 2 369 3 124 4 552 5 206 Dette extérieure totale Private 17 15 14 10 333 335 331 569 526 Privée Public 6 125 6 782 7 200 5 917 5 999 2 033 2 793 3 982 4 680 Publique Total external debt service 160 163 154 152 96 88 89 79 154 Service de la dette extérieure Net Foreign Direct Investment Investissements étranger direct 255 465 545 265 545 222 109 94 ... Inflows (flux nets entrants) Net Total Official Development Aide publique au développement 1 324 1 626 1 828 1 927 1 980 2 578 3 328 3 820 ... assistance (nette totale) African Statistical Yearbook 2011 / Annuaire Statistique pour l'Afrique 2011
  • 175.
    Ethiopia Ethiopie 2002 2003 2004 2005 2006 2007 2008 2009 2010 US $ (Millions) Birr Ethiopien Exports, fob Exportations, fàb Exports - Total 485 171 158 236 244 296 361 473 577 Exportations - Total Main Products Principaux produits Coffee, not roasted, not 154 186 247 361 399 420 520 402 ... Café, non torréfié, non décaféiné decaffeinated Sesamum seeds, whether or not 28 49 73 155 177 164 194 326 ... Graines de sésame, concassées broken Cut flowers and flower buds for Cut flowers and flower buds for 2 5 7 14 31 66 112 141 ... bouquets, etc., fresh bouquets, etc., fresh Gold in unwrought forms non- Or sous forme brute à usage non ... ... ... 21 ... 89 74 ... ... monetary monétaire Waste&scrap of gold ... ... ... ... ... 15 53 ... ... Déchets et débris d'or Main Destinations Principales destinations Germany 47.3 76.5 88.0 118.7 159.9 111.6 156.4 166.3 ... Allemagne United States 28.4 33.6 45.4 66.7 85.4 93.3 158.9 119.5 ... États-Unis Japan 42.5 45.2 73.9 74.3 92.2 78.9 31.9 10.5 ... Japon Italy 47.1 43.5 40.9 58.6 62.1 86.9 89.0 61.2 ... Italie China 3.7 4.7 14.4 85.7 131.8 87.1 81.7 214.8 ... Chine 2002 2003 2004 2005 2006 2007 2008 2009 2010 Imports, cif Importations, cif Imports - Total 1 568 2 102 2 557 4 082 4 532 5 335 7 093 7 030 ... Importations - Total (millions) 174 Principaux produits Main Products Electrical apparatus for line Appareils électriques pour la 2 8 9 19 3 12 9 30 595 telephony/telegraphy nes téléphonie/télégraphie NDA Wheat nes and meslin 3 140 66 104 40 67 245 101 343 Blé nda et méteil Diammonium phosphate, in Diammonium phosphate, dans des 9 ... ... 11 19 19 159 151 ... packages weighing more than 10 kg colis pesant plus de 10 kg Apparatus for carrier-current/digital Appareils pour systèmes de 1 2 22 6 8 45 122 85 ... line systems canalisation carrier-current/digital Bars & rods,i/nas,hr,hd or he,cntg Barres, i / nas, hr, hd ou he, ,cntg 11 17 30 48 35 122 100 108 ... indent,ribs,etc,prod dur rp/tar,nes indent,ribs, etc, prod dur rp/tar, nda Main Origin Principales provenances China 96.4 152.7 194.1 284.0 430.8 778.4 1 230.7 1 252.5 ... Chine United States 60.5 409.0 459.1 514.9 137.3 167.6 301.6 276.0 ... États-Unis Italy 92.7 97.1 111.4 182.3 193.7 246.1 268.2 211.1 ... Italie Germany 64.0 77.1 77.6 136.4 157.6 162.7 149.8 174.2 ... Allemagne India 68.5 79.4 55.4 66.3 109.5 163.4 216.6 283.3 ... Inde African Statistical Yearbook 2011 / Annuaire Statistique pour l'Afrique 2011
  • 176.
    Gabon Gabon AREA (KM 2) 267 667 SUPERFICIE (KM 2) CAPITAL CITY Libreville Libreville CAPITALE CURRENCY CFA Franc Franc CFA MONNAIE I SOCIAL AND DEMOGRAPHIC INDICATORS — INDICATEURS DEMOGRAPHIQUES ET SOCIAUX 2002 2003 2004 2005 2006 2007 2008 2009 2010 Population Population Population au milieu de l'année - Mid-year population - Total (Million) 1.3 1.3 1.3 1.3 1.4 1.4 1.4 1.5 ... Total (million) Population au milieu de l'année - Mid-year population - Urban (%) ... ... 83.0 80.1 84.0 85.0 85.0 85.6 ... Urbaine (%) Female (%) 50.6 50.3 50.2 50.8 50.1 50.1 50.1 50.0 ... Femme (%) Population by Age Group Population par groupe d'âge 0-14 517 433 522 161 525 887 494 291 530 505 531 530 532 143 532 857 ... 0-14 15-64 711 997 734 000 756 624 767 932 803 864 828 372 853 148 877 839 ... 15-64 65+ 59 543 59 836 60 187 50 223 61 242 61 982 62 865 63 892 ... 65+ Active Population (000) 577.0 593.0 608.0 482.7 640.0 657.0 673.0 691.0 ... Population active (000) Female (%) 44.4 44.4 44.4 45.0 44.2 44.1 44.1 44.0 ... Femme (%) Taux brut de natalité - Total (par Crude birth rate - Total (per 1000) 30.1 29.6 29.0 28.5 28.1 27.7 27.3 26.9 ... 1000) Taux brut de mortalité - Total (par Crude death rate - Total (per 1000) 10.4 10.4 10.3 10.2 10.1 9.9 9.7 9.5 ... 1000) Life expectancy at birth - Total Espérance de vie à la naissance - 59.4 59.3 59.3 59.5 59.7 60.1 60.5 60.9 ... (years) Total (années) Net reproduction rate - (per Taux net de reproduction - (par ... ... ... 1.3 ... ... ... ... ... woman) femme) Indice synthétique de fécondité - Total fertility rate - (p woman) y (per ) 3.8 3.7 3.6 3.5 3.5 3.4 3.3 3.2 ... (par femme) Education Enseignement Teaching staff at first level - Total Personnel enseignant - 1er degré - ... ... 4.8 5.6 5.7 ... 7.2 ... ... (thousands) Total (milliers) Teaching staff at second level - Total Personnel enseignant - 2ème degré - ... ... ... ... ... ... 3.0 ... ... 175 (thousands) Total (milliers) Teaching staff at third level - Total Personnel enseignant - 3ème degré - 0.5 0.5 0.5 0.5 ... ... ... ... ... (thousands) Total (milliers) First level student enrollment - Total Elèves inscrits - 1er degré - Total ... ... ... ... ... ... 348 ... ... (thousands) (milliers) First level student enrollment - Elèves inscrits - 1er degré - Femmes 139 138 139 ... ... ... 168 ... ... Female (thousands) (milliers) Second level student enrollment - Elèves inscrits - 2ème degré - Total 105 ... ... ... ... ... ... ... ... Total (thousands) (milliers) Second level student enrollment - Elèves inscrits - 2ème degré - ... ... ... ... ... ... ... ... ... Female (thousands) Femmes (milliers) Third level student enrollment - Total Elèves inscrits - 3ème degré - Total ... 10.1 10.5 ... ... ... ... ... ... (thousands) (milliers) Third level student enrollment - Elèves inscrits - 3ème degré - ... ... ... ... ... ... ... ... ... Female (thousands) Femmes (milliers) Public expenditure on education (% Dépenses publiques consacrées à ... ... ... ... ... ... ... ... ... of budget) l'enseignement (% du budget) Health Santé Hospital beds - Total (per 10 000 Nombre de lits d'hôpitaux - Total ... ... 55 ... ... ... ... ... ... population) (pour 10 000) Nurses - Total (per 10 000 Nombre d'infirmières - Total (pour ... ... ... ... ... ... ... ... ... population) 10 000) Physicians - Total (per 10 000 Nombre de médecins - Total (pour ... ... 3 3 ... ... ... ... ... population) 10 000) Public expenditure on Health (% of Dépenses publiques consacrées à la ... ... ... ... ... ... ... ... ... budget) santé (% du budget) African Statistical Yearbook 2011 / Annuaire Statistique pour l'Afrique 2011
  • 177.
    Gabon Gabon II NATIONAL ACCOUNTS — COMPTES NATIONAUX 2002 2003 2004 2005 2006 2007 2008 2009 2010 Gross domestic product by kind of economic activity at current prices Produit intérieur brut par branche d'activité économique aux prix courants CFA Franc (Billions) Franc CFA (Milliards) Agriculture 209 214 214 223 247 269 264 277 ... Agriculture Mining and quarrying 1 464 1 527 1 778 2 460 2 675 2 853 3 684 2 282 ... Industries extractives Manufacturing 182 183 190 209 225 250 251 230 ... Industries manufacturières Electricity, gas & water 46 48 54 57 62 70 81 88 ... Electricité, gaz et eau Construction 84 72 76 79 92 102 113 112 ... Bâtiments et travaux publics Wholesale & retail trade, Commerce de gros et de détail, 242 247 240 256 279 303 333 350 ... restaurants, hotels restaurants et hôtels Banques, assurances, affaires Finance, insurance, real estate, etc. 486 478 482 515 561 611 668 687 ... immobilières Transport and communications 191 197 204 211 228 281 295 267 ... Transport(s) et communications Administrations publiques et Public administration and defense 293 302 298 300 336 402 432 506 ... défense Other services ... ... ... ... ... ... ... ... ... Autres services Moins Services d’intermédiation Less Imputed Service Charges ... ... ... ... ... ... ... ... ... financière Gross domestic product at factor Produit intérieur brut aux couts des 3 199 3 268 3 535 4 311 4 704 5 140 6 121 4 799 ... cost / basic prices facteurs / prix de base Plus: Indirect Taxes / taxes on Plus taxes indirectes/impôts sur les 239 251 257 260 288 338 333 332 ... products, less subsidies produits, moins les subventions Expenditure on Gross domestic product at current purchaser's values Emploi du produit intérieur brut aux prix courants d'acquisition CFA Franc( Billions) Franc CFA (Milliards) Consommation finale des Government final consumption 520 502 497 527 574 670 709 791 ... administrations publiques Private final consumption 1 273 1 317 1 362 1 433 1 567 1 758 1 932 2 038 ... Consommation finale privée Gross fixed capital formation 1 061 1 021 1 037 1 047 1 157 1 291 1 331 1 250 ... Formation brute de capital fixe Increase in inventories 25 25 19 14 51 4 32 27 ... Variation des stocks Exports of goods and services 1 907 1 970 2 287 3 026 3 265 3 558 4 401 2 893 ... Exportations de biens et services 176 Moins importations de biens et Less imports of goods and services 1 349 1 316 1 409 1 476 1 622 1 802 1 951 1 868 ... services GDP at purchasers' values 3 437 3 519 3 792 4 571 4 992 5 478 6 454 5 131 ... PIB aux prix d'acquisition Gross domestic product by kind of economic activity at constant Produit intérieur brut par branche d'activité economique aux prix constants prices Annual Growth Rates (%) Taux de croissance annuel (%) Agriculture -4.8 1.5 1.2 2.2 3.3 5.4 -0.2 2.9 ... Agriculture Mining and quarrying -1.8 7.8 -0.2 -0.2 -7.9 2.9 -1.9 -4.4 ... Industries extractives Manufacturing 4.1 -1.2 2.1 6.5 -2.9 7.8 2.4 -11.3 ... Industries manufacturières Electricity, gas & water 21.2 3.8 10.2 2.5 6.0 3.7 7.0 1.4 ... Electricité, gaz et eau Construction 3.3 -6.2 4.2 2.0 6.4 3.3 3.5 -3.3 ... Bâtiments et travaux publics Wholesale & retail trade, Commerce de gros et de -7.8 1.7 -0.7 5.6 5.3 7.0 5.0 2.3 ... restaurants, hotels détail,restaurants et hôtels Banques, assurances, affaires Finance, insurance, real estate, etc. 3.4 0.4 0.9 5.6 5.4 6.0 5.7 1.3 ... immobilières Transport and communications 2.4 3.0 3.2 4.5 4.8 7.2 2.0 -6.2 ... Transport(s) et communications Administrations publiques et Public administartion and defense -0.4 2.5 2.0 2.5 4.0 6.0 6.0 4.2 ... défense Other services ... ... ... ... ... ... ... ... ... Autres services Moins Services d’intérmediation Less Imputed Service Charges ... ... ... ... ... ... ... ... ... financière Gross domestic product at factor Produit intérieur brut aux couts des 0.3 2.7 1.3 3.0 0.5 5.4 2.7 -1.5 cost / basic prices facteurs / prix de base Plus: Indirect Taxes / taxes on Plus taxes indirectes/impôts sur les -11.1 -2.8 1.4 2.4 15.3 9.1 -4.2 0.3 ... products, less subsidies produits, moins les subventions Gross domestic product at market Produit intérieur brut aux prix du -0.3 2.5 1.4 3.0 1.2 5.6 2.3 -1.4 ... prices marché 2009: Provisional 2009: provisoire African Statistical Yearbook 2011 / Annuaire Statistique pour l'Afrique 2011
  • 178.
    Gabon Gabon Expenditure on Gross domestic product at constant purchasers' Emplois du produit intérieur brut aux prix constants d'acquisition values Annual Growth Rates (%) Taux de croissance annuel (%) Consommation finale des Government final consumption -8.5 -3.5 1.8 6.7 -5.4 19.0 -1.9 4.9 ... administrations publiques Private final consumption 4.0 1.4 3.0 5.5 5.2 6.9 4.4 3.5 ... Consommation finale privée Gross fixed capital formation -1.2 -1.1 0.8 0.6 8.1 7.1 3.2 -6.8 ... Formation brute de capital fixe Exports of goods and services -3.8 4.8 3.6 1.4 -5.7 6.3 0.7 -10.6 ... Exportations de biens et services Moins importations de biens et Less imports of goods and services -0.6 -3.0 4.8 3.2 6.7 8.7 5.5 -5.8 ... services III INFLATION 2002 2003 2004 2005 2006 2007 2008 2009 2010 Annual Growth Rates (%) Taux de croissance annuel (%) All Item 0.2 2.1 0.4 3.7 -1.4 5.0 5.3 2.5 3.2 Ensemble Food ... ... ... 0.2 0.9 2.2 7.8 3.7 4.5 Alimentation Health ... ... ... 2.8 9.5 -2.0 1.9 2.9 0.9 Santé Energy ... ... ... ... 2.8 9.1 9.1 4.1 -6.5 Energie Transport ... ... ... -1.2 3.0 13.5 3.3 -6.3 1.2 Transport IV AGRICULTURAL PRODUCTION - PRODUCTION AGRICOLE 2002 2003 2004 2005 2006 2007 2008 2009 2010 Tons (Thousand) Tonnes (milliers) Plantains, Tons (thousands) 269 270 270 270 ... ... ... ... ... Banane plantain (1000 tonnes) Cassava, Tons (thousands) 226 234 228 229 ... ... ... ... ... Manioc (1000 tonnes) Taro, Tons (thousands) 56 55 54 55 ... ... ... ... ... Taro (1000 tonnes) Groundnuts in shells, Tons 16 17 17 17 ... ... ... ... ... Arachide, en coques (1000 tonnes) (thousands) 5 : Caoutchouc naturel (1000 Natural rubber, Tons (thousands) ... ... 1 9 12 13 19 17 ... tonnes) V MINING PRODUCTION - PRODUCTION MINIERE 177 2002 2003 2004 2005 2006 2007 2008 2009 2010 Crude Petroleum, metric tons 12 563.0 13 433.0 13 483.0 13 305.0 11 930.0 12 130.0 12 700.0 ... ... Pétrole brut (1000 tonnes) (thousands) Gas natural, cubic meter (million) 138.7 146.6 143.6 150.9 155.3 167.1 187.3 ... ... Gaz naturel (millions de m3) Manganese, Tons (thousands) 1 856.0 2 000.0 2 459.2 2 753.0 2 979.0 3 333.8 3 248.0 1 969.0 ... Manganèse (1000 tonnes) VI ENERGY - ENERGIE 2002 2003 2004 2005 2006 2007 2008 2009 2010 Electricity - total hydro production, Électricité - production hydraulique 1 266.0 1 314.6 1 337.1 1 363.7 1 463.0 1 525.0 1 639.1 ... ... kilowatt hours (millions) totale, kilowatt-heures (millions) Electricity - total thermal production, Électricité - production thermique 73.0 68.0 67.0 60.0 65.0 53.0 55.0 ... ... kilowatt hours (millions) totale, kilowatt-heures (millions) Electricity - total production, self- Electricité - Production totale privée 191 189 200 247 269 319 ... ... ... producer (Million Kilowatt Hours) (million de kilowatt heures) Electricity - total production, public Electricité - Production totale 1 266 1 315 1 337 1 363 1 463 1 525 ... ... ... (Million Kilowatt Hours) publique (million de kilowatt heures) African Statistical Yearbook 2011 / Annuaire Statistique pour l'Afrique 2011
  • 179.
    Gabon Gabon VII TOURISM AND INFRASTRUCTURE - TOURISME ET INFRASTUCTURE 2002 2003 2004 2005 2006 2007 2008 2009 2010 Arrivals - Tourists (thousands) 208 222 180.6 151.4 149.7 159.4 185.6 ... ... Arrivées - touristes (milliers) Rooms in hotels and similar Chambres d'hotels et établissements establishments (thousands) 2 ... ... ... ... 4.191 ... ... ... assimilés (milliers) Paved Road (% of total) ... ... 10 ... ... ... ... ... ... Routes asphaltées (% du total) Total Network (Railways-km) ... 731 731 810 810 1 098 ... ... ... Réseau total voies ferrées-Km Main Telephone Lines (per 1,000 Lignes téléphoniques fixes (pour 25 29 29 2 26 19 18 ... ... inhabitants) 1000 habitants) Mobile Cellular Subscribers (per Abonnés aux téléphones mobiles 217 228 364 538 643 822 898 ... ... 1,000 inhabitants) (pour 1000 habitants) VII FINANCIAL AND MONETARY STATISTICS - FINANCES ET STATISTIQUES MONETAIRES 2002 2003 2004 2005 2006 2007 2008 2009 2010 VII-1 Monetary Statistics VII-1 Statistiques monétaires CFA Franc (Billions) Franc CFA (Milliards) Money supply (M1) 347 345 387 528 618 689 774 766 806 Masse monétaire (M1) Quasi-money 252 247 272 312 360 356 367 399 416 Quasi-monnaie of which Demand Deposit ... ... ... ... ... ... ... ... ... dont Monnaie scripturale Net foreign assets 24 71 280 531 705 1 019 974 977 894 Avoirs extérieurs nets Domestic credit 650 617 485 442 416 160 395 390 494 Crédit intérieur of which claims on private sector 416 381 330 380 465 667 556 527 543 dont créances sur le secteur privé of which Claims on government dont créances nettes sur le 194 204 111 24 - 91 - 552 - 236 - 190 - 112 sector, net gouvernement International reserves (millions of US Réserves internationales (millions de 140 197 443 669 1 113 1 227 1 923 1 993 1 952 $) $ EU) Average Exchange Rate (National Taux de change (moyen) (monnaie 696.99 581.20 528.29 527.47 522.89 479.27 447.81 472.19 495.28 Currency per us $) nationale par dollars) VII-2 Public Finance VII-2 Finances publiques CFA Franc (Billions) Franc CFA (Milliards) Total Revenues and Grants 1 090 1 050 1 114 1 362 1 583 1 636 2 078 1 282 1 719 Recettes totales et dons Tax Revenue 972 913 961 1 216 1 442 1 466 1 910 1 072 1 522 Recettes fiscales Non Tax Revenue 116 136 151 144 140 170 168 207 207 Recettes non fiscales 178 Grants 2 1 2 2 0 0 0 4 4 Dons Total Expenditures and Net Lending 969 789 827 931 1 088 1 166 1 296 1 271 1 778 Dépenses totales et prêts nets Current expenditure 755 614 628 717 725 838 906 848 847 Dépenses courantes Of which Wages and Salaries 221 229 226 228 252 302 324 370 385 Dont rémunérations et salaires Capital expenditure 137 131 160 155 198 247 299 295 898 Dépenses d'équipement Net Lending 17 0 0 5 0 10 21 0 0 Prêts nets Fiscal Balance 121 261 286 431 495 471 782 11 - 59 Solde global y compris les dons VII-3 Balance of Payments VII-3 Balance des paiements CFA Franc (Billions) Franc CFA (Milliards) Trade balance 1 125 1 241 1 508 2 152 2 351 2 575 3 344 1 971 ... Balance commerciale Services Balance - 465 - 388 - 414 - 548 - 567 - 617 - 644 - 523 ... Balance des services Net Income - 334 - 415 - 511 - 845 - 810 - 861 - 1 048 - 658 ... Revenus nets Current transfers, net total - 90 - 104 - 95 - 91 - 106 - 118 - 136 - 90 ... Transferts courants Current account balance 236 335 489 668 868 979 1 517 700 ... Solde du compte courant VII-4 External Debt and Financial Flows VII-4 Dette extérieure et flux financiers US $ (Millions) $ E.U (Millions) Total external debt 3 096 3 363 3 604 3 416 3 117 4 040 2 264 2 035 1 933 Dette extérieure totale Private 185 135 95 68 37 977 964 834 775 Privée Public 2 911 3 228 3 509 3 348 3 080 3 063 1 300 1 201 1 158 Publique Total external debt service 464 601 593 493 639 755 2 528 485 517 Service de la dette extérieure Net Foreign Direct Investment Investissements étranger direct (flux 37 206 320 242 268 269 209 33 ... Inflows nets entrants) Net Total Official Development Aide publique au développement 72 - 11 40 60 29 51 62 78 ... assistance (nette totale) African Statistical Yearbook 2011 / Annuaire Statistique pour l'Afrique 2011
  • 180.
    Gabon Gabon 2002 2003 2004 2005 2006 2007 2008 2009 2010 US $ (Millions) Franc CFA Exports, fob Exportations, fàb Exports - Total 1 781 1 847 2 151 2 882 3 166 3 446 4 352 2 632 ... Exportations - Total Main Products Principaux produits Crude oil 1 372 1 419 1 567 2 193 2 653 2 485 3 707 2 170 ... Pétrole brut Rough lumber 138 144 131 160 159 192 165 197 ... Bois en grumes Manganese 29 33 80 94 98 107 92 148 ... Manganèse Lumber 65 77 85 90 103 127 107 ... ... Bois ouvrés ... ... ... ... ... ... ... ... ... Main Destinations Principales destinations United States ... 1 004.9 1 012.1 1 751.1 1 836.5 1 604.7 2 204.1 ... ... Etats-Unis France 128.0 116.3 145.8 123.2 222.1 341.4 255.4 ... ... France China 75.3 130.9 111.5 107.0 332.2 287.7 560.7 ... ... Chine Japan 18.5 94.4 1.1 2.8 1.9 167.5 29.4 ... ... Japon Thailand 0.5 0.1 16.5 29.6 66.4 95.2 0.1 ... ... Thaïlande 2002 2003 2004 2005 2006 2007 2008 2009 2010 Imports, cif Importations, cif Imports - Total 791 701 675 776 904 1 010 1 141 941 ... Importations - Total (millions) 179 Principaux produits Main Products Outillage et matériels non Tools and materials non-electric 146 108 138 149 185 205 250 ... ... électriques Food 132 135 142 147 151 185 202 ... ... Produits alimentaires Produits de consommation non Consumer Products nonfood 130 100 110 121 132 149 210 ... ... alimentaires Vehicles 65 77 57 73 91 97 102 ... ... Véhicules Electrical machinery and apparatus 60 50 57 69 80 90 79 ... ... Machines et appareils électriques Main Origin Principales provenances France 308.8 285.0 259.6 305.2 362.0 365.5 403.9 ... ... France United States ... 67.2 57.5 50.3 66.2 60.1 84.9 ... ... Etats-Unis Chine 8.5 9.0 8.6 14.2 23.6 39.2 45.0 ... ... Chine Netherlands 31.2 38.3 27.5 20.8 25.2 32.3 39.0 ... ... Pays-Bas Cameroon 16.8 19.4 24.2 28.2 31.3 31.4 26.8 ... ... Cameroun African Statistical Yearbook 2011 / Annuaire Statistique pour l'Afrique 2011
  • 181.
    Gambia Gambie AREA (KM 2) 11 295 SUPERFICIE (KM 2) CAPITAL CITY Banjul Banjul CAPITALE CURRENCY Gambian Dalasi Dalasi Gambien MONNAIE I SOCIAL AND DEMOGRAPHIC INDICATORS — INDICATEURS DEMOGRAPHIQUES ET SOCIAUX 2002 2003 2004 2005 2006 2007 2008 2009 2010 Population Population Population au milieu de l'année - Mid-year population - Total (Million) 1.4 1.4 1.4 1.5 1.5 1.6 1.6 1.7 ... Total (million) Population au milieu de l'année - Mid-year population - Urban (%) ... ... 53.0 54.0 55.0 56.0 57.0 57.3 ... Urbaine (%) Female (%) 50.4 50.4 50.4 50.4 50.4 50.4 50.4 50.6 ... Femme (%) Population by Age Group Population par groupe d'âge 0-14 597 926 616 994 635 710 653 941 671 605 688 684 705 194 721 174 ... 0-14 15-64 755 274 779 736 804 526 829 743 855 393 881 506 908 215 935 694 ... 15-64 65+ 38 178 39 591 41 018 42 454 43 885 45 321 46 791 48 343 ... 65+ Active Population (000) 626.0 482.4 500.8 519.8 539.6 560.1 560.1 560.1 ... Population active (000) Female (%) 45.7 217.0 227.7 ... ... ... ... ... ... Femme (%) Taux brut de natalité - Total (par Crude birth rate - Total (per 1000) 40.0 39.4 43.0 42.0 42.6 42.3 42.0 41.6 ... 1000) Taux brut de mortalité - Total (par Crude death rate - Total (per 1000) 12.5 12.3 8.9 8.8 8.6 8.4 8.2 8.1 ... 1000) Life expectancy at birth - Total Espérance de vie à la naissance - 54.4 64.5 64.7 64.9 65.1 65.2 65.4 65.1 ... (years) Total (années) Net reproduction rate - (per Taux net de reproduction - (par ... ... ... 1.9 ... ... ... ... ... woman) femme) Indice synthétique de fécondité - Total fertility rate - (p woman) y (per ) 5.5 5.4 5.3 5.3 5.3 5.2 5.2 5.2 ... (par femme) Education Enseignement Teaching staff at first level - Total Personnel enseignant - 1er degré - ... ... ... ... ... ... ... ... ... (thousands) Total (milliers) Teaching staff at second level - Total Personnel enseignant - 2ème degré - 180 ... ... ... ... ... ... ... ... ... (thousands) Total (milliers) Teaching staff at third level - Total Personnel enseignant - 3ème degré - ... ... ... ... ... ... ... ... ... (thousands) Total (milliers) First level student enrollment - Total Elèves inscrits - 1er degré - Total 196 205 205 208 219 221 236 230 ... (thousands) (milliers) First level student enrollment - Elèves inscrits - 1er degré - Femmes 86 102 104 105 111 113 120 115 ... Female (thousands) (milliers) Second level student enrollment - Elèves inscrits - 2ème degré - Total 73 82 96 99 102 105 111 114 ... Total (thousands) (milliers) Second level student enrollment - Elèves inscrits - 2ème degré - 25 29 31 32 33 33 37 39 ... Female (thousands) Femmes (milliers) Third level student enrollment - Total Elèves inscrits - 3ème degré - Total ... ... 1.5 ... ... ... ... ... ... (thousands) (milliers) Third level student enrollment - Elèves inscrits - 3ème degré - ... ... 0.3 ... ... ... ... ... ... Female (thousands) Femmes (milliers) Public expenditure on education (% Dépenses publiques consacrées à 8.9 ... ... ... ... ... ... ... ... of budget) l'enseignement (% du budget) Health Santé Hospital beds - Total (per 10 000 Nombre de lits d'hôpitaux - Total ... 11 ... 10 10 10 10 10 ... population) (pour 10 000) Nurses - Total (per 10 000 Nombre d'infirmières - Total (pour ... 1 ... 2 8 5 6 ... ... population) 10 000) Physicians - Total (per 10 000 Nombre de médecins - Total (pour ... 0 ... 1 1 1 ... ... ... population) 10 000) Public expenditure on Health (% of Dépenses publiques consacrées à la 9 13 12 11 11 ... ... ... ... budget) santé (% du budget) African Statistical Yearbook 2011 / Annuaire Statistique pour l'Afrique 2011
  • 182.
    Gambia Gambie II NATIONAL ACCOUNTS — COMPTES NATIONAUX 2002 2003 2004 2005 2006 2007 2008 2009 2010 Gross domestic product by kind of economic activity at current prices Produit intérieur brut par branche d'activité économique aux prix courants Gambian Dalasi (Millions) Dalasi Gambien(Millions) Agriculture 2 779 3 717 4 667 4 888 3 885 4 044 5 590 6 417 ... Agriculture Mining and quarrying 181 229 267 395 400 343 374 406 ... Industries extractives Manufacturing 809 822 973 1 185 1 259 1 327 1 241 1 278 ... Industries manufacturières Electricity, gas & water 91 115 134 175 195 317 334 355 ... Electricité, gaz et eau Construction 740 897 982 547 824 712 820 829 ... Bâtiments et travaux publics Wholesale & retail trade, Commerce de gros et de détail, 4 021 4 296 4 819 4 772 5 661 6 587 6 824 6 693 ... restaurants, hotels restaurants et hôtels Banques, assurances, affaires Finance, insurance, real estate, etc. 1 390 1 888 1 702 1 850 1 968 2 049 2 543 2 841 ... immobilières Transport and communications 1 270 1 986 1 923 2 165 2 216 2 385 2 231 2 467 ... Transport(s) et communications Administrations publiques et Public administration and defense 369 417 376 416 471 561 832 894 ... défense Other services 418 473 426 574 633 749 953 969 ... Autres services Moins Services d’intermédiation Less Imputed Service Charges - 507 - 573 - 516 - 600 - 684 - 672 - 743 - 868 ... financière Gross domestic product at factor Produit intérieur brut aux couts des 11 560 14 268 15 755 16 367 16 829 18 402 20 999 22 279 ... cost / basic prices facteurs / prix de base Plus: Indirect Taxes / taxes on Plus taxes indirectes/impôts sur les - 43 - 372 1 626 1 567 1 856 2 154 1 980 2 527 ... products, less subsidies produits, moins les subventions Expenditure on Gross domestic product at current purchaser's values Emploi du produit intérieur brut aux prix courants d'acquisition Gambian Dalasi (Millions) Dalasi Gambien(Millions) Consommation finale des Government final consumption 1 244 1 325 1 404 1 261 1 164 984 1 747 1 885 ... administrations publiques Private final consumption 8 184 10 268 15 172 16 191 15 912 18 252 19 279 20 813 ... Consommation finale privée Gross fixed capital formation 5 056 5 806 5 121 4 979 5 712 5 797 5 957 6 430 ... Formation brute de capital fixe Increase in inventories - 319 - 173 625 653 640 699 626 676 ... Variation des stocks Exports of goods and services 780 965 1 148 1 211 1 493 1 634 1 465 1 581 ... Exportations de biens et services Moins importations de biens et 181 Less imports of goods and services 3 428 4 295 6 089 6 361 6 237 6 809 6 095 6 579 ... services GDP at purchasers' values 11 517 13 895 17 381 17 935 18 685 20 556 22 978 24 806 ... PIB aux prix d'acquisition Gross domestic product by kind of economic activity at constant Produit intérieur brut par branche d'activité economique aux prix constants prices Annual Growth Rates (%) Taux de croissance annuel (%) Agriculture ... ... ... ... -14.3 -1.9 26.6 5.5 ... Agriculture Mining and quarrying ... ... ... ... 1.2 -14.1 8.8 8.8 ... Industries extractives Manufacturing ... ... ... ... 4.1 3.9 -8.3 0.4 ... Industries manufacturières Electricity, gas & water ... ... ... ... 8.7 59.1 1.7 10.0 ... Electricité, gaz et eau Construction ... ... ... ... 6.0 -4.3 5.0 3.0 ... Bâtiments et travaux publics Wholesale & retail trade, Commerce de gros et de ... ... ... ... 16.0 10.3 -1.7 1.2 ... restaurants, hotels détail,restaurants et hôtels Banques, assurances, affaires Finance, insurance, real estate, etc. ... ... ... ... 2.4 -0.2 19.2 2.9 ... immobilières Transport and communications ... ... ... ... 2.7 7.0 -8.0 8.0 ... Transport(s) et communications Administrations publiques et Public administartion and defense ... ... ... ... 11.1 12.9 42.1 2.0 ... défense Other services ... ... ... ... 11.0 17.8 27.0 37.1 ... Autres services Moins Services d’intérmediation Less Imputed Service Charges ... ... ... ... 11.8 -7.0 5.7 6.0 ... financière Gross domestic product at factor Produit intérieur brut aux couts des 2.1 5.6 8.4 5.3 ... cost / basic prices facteurs / prix de base Plus: Indirect Taxes / taxes on Plus taxes indirectes/impôts sur les ... ... ... ... 16.1 10.1 -12.0 2.0 ... products, less subsidies produits, moins les subventions Gross domestic product at market Produit intérieur brut aux prix du ... ... ... ... 3.4 6.0 6.3 5.0 ... prices marché 2009: Estimated 2009: Estimée African Statistical Yearbook 2011 / Annuaire Statistique pour l'Afrique 2011
  • 183.
    Gambia Gambie Expenditure on Gross domestic product at constant purchasers' Emplois du produit intérieur brut aux prix constants d'acquisition values Annual Growth Rates (%) Taux de croissance annuel (%) Consommation finale des Government final consumption ... ... ... ... -9.6 -19.8 70.0 5.0 ... administrations publiques Private final consumption ... ... ... ... 12.9 4.3 1.5 5.0 ... Consommation finale privée Gross fixed capital formation ... ... ... ... -19.2 12.3 -6.3 5.0 ... Formation brute de capital fixe Exports of goods and services ... ... ... ... 20.8 3.9 -18.0 5.0 ... Exportations de biens et services Moins importations de biens et Less imports of goods and services ... ... ... ... -3.9 3.6 -18.1 5.0 ... services III INFLATION 2002 2003 2004 2005 2006 2007 2008 2009 2010 Annual Growth Rates (%) Taux de croissance annuel (%) All Item 8.6 17.0 14.3 5.0 2.1 5.4 4.4 4.6 5.0 Ensemble Food 12.3 20.4 16.1 3.2 0.4 ... 6.1 5.4 6.7 Alimentation Health 13.9 13.2 10.1 5.5 2.3 ... 0.3 0.7 0.1 Santé Energy 0.0 0.0 0.0 0.0 0.0 ... 4.3 4.4 2.5 Energie Transport 13.9 13.2 10.1 5.5 2.3 ... 3.0 2.0 13.3 Transport IV AGRICULTURAL PRODUCTION - PRODUCTION AGRICOLE 2002 2003 2004 2005 2006 2007 2008 2009 2010 Tons (Thousand) Tonnes (milliers) Groundnuts in shells, Tons 93 136 118 82 73 110 140 163 ... Arachides en coques, tonnes (thousands) (milliers) Millet, Tons (thousands) 107 116 ... 123 118 89 122 103 ... Millet, tonnes (milliers) Sorghum, Tons (thousands) 33 29 ... 31 20 18 26 13 ... Sorgho, tonnes (milliers) Maize, Tons (thousands) 30 29 ... 30 29 31 45 69 ... Maïs, tonnes (milliers) Rice, Tons (thousands) 18 21 ... 20 16 11 38 68 ... Riz, tonnes (milliers) V MINING PRODUCTION - PRODUCTION MINIERE 182 2002 2003 2004 2005 2006 2007 2008 2009 2010 Gravel and crushed stone, metric Graviers et pierres concentrés, 500.0 ... ... ... ... ... ... ... ... tons (thousands) tonnes métriques (milliers) Clays, metric tons (thousands) 8.6 9.0 ... ... ... ... ... ... ... Argiles, tonnes métriques (milliers) ... ... ... ... ... ... ... ... ... VI ENERGY - ENERGIE 2002 2003 2004 2005 2006 2007 2008 2009 2010 Electricity - total hydro production, Électricité - production hydraulique ... ... ... ... ... ... ... ... ... kilowatt hours (millions) totale, kilowatt-heures (millions) Electricity - total thermal production, Électricité - production thermique 151.2 168.0 185.0 203.0 216.0 229.0 ... ... ... kilowatt hours (millions) totale, kilowatt-heures (millions) Electricity - total production, self- Electricité - Production totale privée 16 18 20 23 26 28 ... ... ... producer (Million Kilowatt Hours) (million de kilowatt heures) Electricity - total production, public Electricité - Production totale 135 150 165 180 190 201 ... ... ... (Million Kilowatt Hours) publique (million de kilowatt heures) African Statistical Yearbook 2011 / Annuaire Statistique pour l'Afrique 2011
  • 184.
    Gambia Gambie VII TOURISM AND INFRASTRUCTURE - TOURISME ET INFRASTUCTURE 2002 2003 2004 2005 2006 2007 2008 2009 2010 Arrivals - Tourists (thousands) 48.002 75.347 90.095 107.904 124.8 142.606 146.759 141.569 ... Arrivées - touristes (milliers) Rooms in hotels and similar Chambres d'hotels et établissements establishments (thousands) ... ... ... 6.132 7.984 8.623 8.623 8.623 ... assimilés (milliers) Paved Road (% of total) ... ... ... ... ... ... ... ... ... Routes asphaltées (% du total) Total Network (Railways-km) ... ... 730 780 780 780 ... ... ... Réseau total voies ferrées-Km Main Telephone Lines (per 1,000 Lignes téléphoniques fixes (pour 28 29 42 44 53 56 58 58 ... inhabitants) 1000 habitants) Mobile Cellular Subscribers (per Abonnés aux téléphones mobiles 72 10 10 10 10 10 10 275 ... 1,000 inhabitants) (pour 1000 habitants) VII FINANCIAL AND MONETARY STATISTICS - FINANCES ET STATISTIQUES MONETAIRES 2002 2003 2004 2005 2006 2007 2008 2009 2010 VII-1 Monetary Statistics VII-1 Statistiques monétaires Gambian Dalasi (Millions) Dalasi Gambien(Millions) Money supply (M1) 1 757 2 873 3 108 3 321 4 185 4 209 5 120 5 600 ... Masse monétaire (M1) Quasi-money 1 446 1 720 2 324 2 825 3 572 4 065 4 677 6 095 ... Quasi-monnaie of which Demand Deposit ... ... ... ... ... ... ... ... ... dont Monnaie scripturale Net foreign assets 1 731 1 531 2 924 3 025 4 047 3 860 3 271 3 702 ... Avoirs extérieurs nets Domestic credit 1 866 3 265 2 481 3 130 3 876 3 828 6 166 7 560 ... Crédit intérieur of which claims on private sector 1 227 1 633 1 454 1 719 2 230 2 600 3 164 3 694 ... dont créances sur le secteur privé of which Claims on government dont créances nettes sur le 565 1 426 940 1 289 1 516 1 137 2 677 3 187 ... sector, net gouvernement International reserves (millions of US Réserves internationales (millions de 107 59 84 98 121 143 117 224 ... $) $ EU) Average Exchange Rate (National Taux de change (moyen) (monnaie 19.92 27.31 30.03 28.58 28.07 24.88 22.19 26.64 ... Currency per us $) nationale par dollars) VII-2 Public Finance VII-2 Finances publiques Gambian Dalasi (Millions) Dalasi Gambien(Millions) Total Revenues and Grants 1 523 1 820 3 065 2 823 3 203 3 662 3 744 4 909 4 781 Recettes totales et dons Tax Revenue 1 040 1 381 2 245 2 263 2 678 3 037 3 146 3 517 3 441 Recettes fiscales Non Tax Revenue 162 194 273 340 346 431 354 371 430 Recettes non fiscales Grants 321 246 547 220 180 194 244 1 021 910 Dons 183 Total Expenditures and Net Lending 1 854 2 293 3 750 3 961 4 211 3 635 4 138 5 684 4 943 Dépenses totales et prêts nets Current expenditure 948 1 099 1 168 1 290 1 663 1 771 2 472 2 881 3 056 Dépenses courantes Of which Wages and Salaries 395 453 518 554 653 680 983 1 192 1 461 Dont rémunérations et salaires Capital expenditure 568 608 1 734 1 450 1 564 973 857 1 924 1 045 Dépenses d'équipement Net Lending - 33 - 23 - 23 - 30 63 76 96 138 - 32 Prêts nets Fiscal Balance - 331 - 472 - 685 - 1 138 - 1 008 28 - 394 - 775 - 162 Solde global y compris les dons VII-3 Balance of Payments VII-3 Balance des paiements Gambian Dalasi (Millions) Dalasi Gambien(Millions) Trade balance - 2 880 - 2 068 - 3 061 - 3 616 - 3 368 - 3 762 - 1 915 - 2 393 ... Balance commerciale Services Balance 629 1 132 806 1 010 - 56 1 045 714 571 ... Balance des services Net Income - 446 - 648 - 816 - 924 - 1 063 - 1 111 - 757 - 215 ... Revenus nets Current transfers, net total 852 1 465 1 982 2 054 2 459 2 123 1 809 3 619 ... Transferts courants Current account balance - 1 844 - 118 - 1 089 - 1 476 - 2 028 - 1 705 - 149 1 582 ... Solde du compte courant VII-4 External Debt and Financial Flows VII-4 Dette extérieure et flux financiers US $ (Millions) $ E.U (Millions) Total external debt 432 456 480 549 568 180 236 316 ... Dette extérieure totale Private 58 61 0 0 0 0 0 0 ... Privée Public 498 514 588 621 677 299 301 316 ... Publique Total external debt service 65 43 52 62 69 71 69 70 ... Service de la dette extérieure Net Foreign Direct Investment Investissements étranger direct (flux 43 15 49 45 71 76 63 0 ... Inflows nets entrants) Net Total Official Development Aide publique au développement 62 63 55 60 73 73 94 0 ... assistance (nette totale) African Statistical Yearbook 2011 / Annuaire Statistique pour l'Afrique 2011
  • 185.
    Gambia Gambie 2002 2003 2004 2005 2006 2007 2008 2009 2010 US $ (Millions) Dalasi Gambien Exports, fob Exportations, fàb Exports - Total 109 101 97 81 84 91 87 81 ... Exportations - Total Main Products Principaux produits Ground nut Shelled 1 0 1 2 6 1 1 0 ... Noix d'arachide, coque Fish and fish preserved 1 0 0 1 0 3 3 0 ... Poissons et poissons conservés Hides and skins 0 0 0 0 0 0 0 0 ... Cuirs et peaux Cotton 0 0 0 0 0 0 0 0 ... Coton Fruits and Vegetable 1 1 1 1 3 1 3 0 ... Fruits et légumes Main Destinations Principales destinations India 4.4 3.8 11.3 12.7 17.3 15.4 29.0 52.4 ... Inde United Kingdom 5.8 4.7 5.9 5.3 6.6 4.3 2.9 416.7 131.4 Royaume-Uni France 6.9 0.3 5.8 0.3 2.9 2.6 2.1 228.8 170.9 France China ... 1.5 0.1 0.2 0.4 8.7 3.2 170.9 ... Chine Belgium 1.9 1.0 1.0 1.3 0.9 2.1 1.8 131.4 ... Belgique 2002 2003 2004 2005 2006 2007 2008 2009 2010 Imports, cif Importations, cif 184 Imports - Total ... ... ... ... ... ... ... ... ... Importations - Total (millions) Principaux produits Main Products Huile de palme et ses fractions, Palm oil and its fractions refined but 3 9 12 14 16 28 30 30 ... raffinées, mais non chimiquement not chemically modified modifiées Rice, broken 0 1 4 14 13 17 28 32 ... Riz, cassé Rice, semi-milled or wholly milled, Riz semi-blanchi ou blanchi, même 0 1 3 13 3 4 25 9 ... whether or not polished or glazed poli ou glacé Refined sugar, in solid form, nes 19 24 24 24 26 39 23 48 ... Sucre raffiné, sous forme solide, nsa Wheat or meslin flour 7 8 13 9 14 19 11 17 ... Blé nda et méteil Main Origin Principales provenances China 81.9 116.0 124.2 124.4 162.4 185.6 175.7 929.1 ... Chine Senegal 33.8 42.9 65.7 73.4 83.3 83.7 90.6 ... ... Sénégal Brazil 22.1 27.2 31.0 32.5 42.3 62.8 48.5 460.7 ... Brésil Ivory Coast 18.0 15.9 17.7 49.5 51.9 47.3 62.1 1 156.3 ... Chine Netherlands 21.0 24.4 23.8 23.7 28.7 40.8 42.9 458.7 ... Pays-Bas African Statistical Yearbook 2011 / Annuaire Statistique pour l'Afrique 2011
  • 186.
    Ghana Ghana AREA (KM 2) 238 533 SUPERFICIE (KM 2) CAPITAL CITY Accra Accra CAPITALE CURRENCY Cedi Cedi MONNAIE I SOCIAL AND DEMOGRAPHIC INDICATORS — INDICATEURS DEMOGRAPHIQUES ET SOCIAUX 2002 2003 2004 2005 2006 2007 2008 2009 2010 Population Population Population au milieu de l'année - Mid-year population - Total (Million) 20.5 21.0 21.4 21.9 22.4 22.9 23.4 23.8 ... Total (million) Population au milieu de l'année - Mid-year population - Urban (%) ... ... 47.0 48.0 49.0 49.0 50.0 50.7 ... Urbaine (%) Female (%) 49.3 49.3 49.3 49.3 49.3 49.3 49.3 49.3 ... Femme (%) Population by Age Group Population par groupe d'âge 0-14 8318 729 8445 202 8569 415 8690 831 8809 016 8924 693 9039 833 9157 090 ... 0-14 15-64 11461 808 11791 375 12124 083 12458 641 12794 707 13132 627 13472 684 13815 422 ... 15-64 65+ 694 384 717 982 741 760 765 696 789 615 813 645 838 411 864 749 ... 65+ Active Population (000) 9 003.0 9 235.0 9 468.0 9 707.0 9 945.0 10 250.0 10 527.0 10 816.0 ... Population active (000) Female (%) 48.6 48.8 49.0 49.2 49.4 49.0 49.0 49.0 ... Femme (%) Taux brut de natalité - Total (par Crude birth rate - Total (per 1000) 33.8 33.6 33.3 33.1 32.9 32.6 32.4 32.1 ... 1000) Taux brut de mortalité - Total (par Crude death rate - Total (per 1000) 10.7 10.8 11.0 11.1 11.1 11.1 11.1 11.0 ... 1000) Life expectancy at birth - Total Espérance de vie à la naissance - 57.2 56.9 56.7 56.5 56.5 56.5 56.6 56.8 ... (years) Total (années) Net reproduction rate - (per Taux net de reproduction - (par ... ... ... 1.6 ... ... ... ... ... woman) femme) Indice synthétique de fécondité - Total fertility rate - (p woman) y (per ) 4.6 4.5 4.5 4.4 4.4 4.3 4.3 4.2 ... (par femme) Education Enseignement Teaching staff at first level - Total Personnel enseignant - 1er degré - ... ... ... ... ... ... ... ... ... (thousands) Total (milliers) Teaching staff at second level - Total Personnel enseignant - 2ème degré - ... ... ... ... ... ... ... ... ... 185 (thousands) Total (milliers) Teaching staff at third level - Total Personnel enseignant - 3ème degré - ... ... ... ... ... ... ... ... ... (thousands) Total (milliers) First level student enrollment - Total Elèves inscrits - 1er degré - Total ... ... ... ... ... ... ... ... ... (thousands) (milliers) First level student enrollment - Elèves inscrits - 1er degré - Femmes 1 227 1 219 1 270 1 404 1 518 1 634 1 700 ... ... Female (thousands) (milliers) Second level student enrollment - Elèves inscrits - 2ème degré - Total 1 107 1 171 1 277 1 350 1 454 1 619 1 691 ... ... Total (thousands) (milliers) Second level student enrollment - Elèves inscrits - 2ème degré - 497 527 568 608 653 740 776 ... ... Female (thousands) Femmes (milliers) Third level student enrollment - Total Elèves inscrits - 3ème degré - Total ... ... ... 119.6 110.2 140.0 ... ... ... (thousands) (milliers) Third level student enrollment - Elèves inscrits - 3ème degré - ... ... ... 41.8 37.1 47.9 ... ... ... Female (thousands) Femmes (milliers) Public expenditure on education (% Dépenses publiques consacrées à ... ... ... ... ... ... ... ... ... of budget) l'enseignement (% du budget) Health Santé Hospital beds - Total (per 10 000 Nombre de lits d'hôpitaux - Total 82 ... 89 ... ... ... ... ... ... population) (pour 10 000) Nurses - Total (per 10 000 Nombre d'infirmières - Total (pour ... ... ... 90 ... ... ... ... ... population) 10 000) Physicians - Total (per 10 000 Nombre de médecins - Total (pour 9 11 15 ... ... ... ... ... ... population) 10 000) Public expenditure on Health (% of Dépenses publiques consacrées à la 9 9 7 7 4 ... ... ... ... budget) santé (% du budget) African Statistical Yearbook 2011 / Annuaire Statistique pour l'Afrique 2011
  • 187.
    Ghana Ghana II NATIONAL ACCOUNTS — COMPTES NATIONAUX 2002 2003 2004 2005 2006 2007 2008 2009 2010 Gross domestic product by kind of economic activity at current prices Produit intérieur brut par branche d'activité économique aux prix courants Cedi (Millions) Cedi(Millions) Agriculture 1 717 2 418 3 032 3 643 5 415 6 320 8 875 11 379 13 037 Agriculture Mining and quarrying 231 311 366 447 497 602 693 740 823 Industries extractives Manufacturing 441 594 698 842 1 824 1 991 2 277 2 478 2 791 Industries manufacturières Electricity, gas & water 132 177 207 267 367 357 384 413 527 Electricité, gaz et eau Construction 432 587 703 888 1 016 1 565 2 501 3 144 3 901 Bâtiments et travaux publics Wholesale & retail trade, Commerce de gros et de détail, 336 453 549 694 2 426 2 960 3 919 5 134 6 420 restaurants, hotels restaurants et hôtels Banques, assurances, affaires Finance, insurance, real estate, etc. 211 286 342 423 995 1 341 1 781 2 344 3 197 immobilières Transport and communications 215 293 353 437 2 840 3 360 3 884 4 484 5 329 Transport(s) et communications Administrations publiques et Public administration and defense 492 659 773 932 862 1 289 1 799 2 479 2 935 défense Other services 173 231 273 327 1 566 1 971 2 552 3 337 4 187 Autres services Moins Services d’intermédiation Less Imputed Service Charges ... ... ... ... ... ... ... ... ... financière Gross domestic product at factor Produit intérieur brut aux couts des 4 380 6 009 7 298 8 899 17 810 21 755 28 664 35 932 43 148 cost / basic prices facteurs / prix de base Plus: Indirect Taxes / taxes on Plus taxes indirectes/impôts sur les 506 607 691 827 895 1 400 1 515 936 1 651 products, less subsidies produits, moins les subventions Expenditure on Gross domestic product at current purchaser's values Emploi du produit intérieur brut aux prix courants d'acquisition Cedi (Millions) Cedi(Millions) Consommation finale des Government final consumption 859 1 172 1 320 1 489 2 114 2 676 3 393 3 535 5 025 administrations publiques Private final consumption 3 871 4 980 6 085 7 903 15 450 19 598 26 183 30 115 35 615 Consommation finale privée Gross fixed capital formation 939 1 517 2 267 2 821 4 047 4 656 6 474 7 216 10 037 Formation brute de capital fixe Increase in inventories ... ... ... ... ... ... ... ... ... Variation des stocks Exports of goods and services 2 073 2 691 3 140 3 510 4 712 5 679 7 554 11 245 11 325 Exportations de biens et services 186 Moins importations de biens et Less imports of goods and services 2 856 3 745 4 823 5 997 7 619 9 454 13 425 15 244 17 203 services GDP at purchasers' values 4 886 6 616 7 989 9 726 18 705 23 155 30 179 36 867 44 799 PIB aux prix d'acquisition Gross domestic product by kind of economic activity at constant Produit intérieur brut par branche d'activité economique aux prix constants prices Annual Growth Rates (%) Taux de croissance annuel (%) Agriculture 4.4 6.1 7.0 4.1 4.5 -1.7 7.4 7.6 4.8 Agriculture Mining and quarrying 4.5 4.7 3.0 6.3 3.5 101.5 13.2 -10.5 6.0 Industries extractives Manufacturing 4.8 4.6 4.6 5.0 2.0 -33.6 9.0 7.1 6.0 Industries manufacturières Electricity, gas & water 4.1 4.2 3.7 12.4 2.6 1.2 27.9 2.5 6.0 Electricité, gaz et eau Construction 5.0 6.1 6.6 10.0 15.0 32.4 18.4 13.6 6.0 Bâtiments et travaux publics Wholesale & retail trade, Commerce de gros et de 5.6 5.0 6.0 10.0 7.5 10.0 10.0 7.7 7.7 restaurants, hotels détail,restaurants et hôtels Banques, assurances, affaires Finance, insurance, real estate, etc. 5.5 5.2 4.8 7.6 7.6 12.4 11.5 7.6 7.6 immobilières Transport and communications 5.7 5.8 5.2 7.9 7.2 6.0 8.0 11.8 11.8 Transport(s) et communications Administrations publiques et Public administartion and defense 3.6 4.0 4.4 5.0 5.7 6.0 2.7 15.5 15.5 défense Other services 4.0 3.8 4.0 4.0 4.3 5.1 5.3 -9.6 -3.6 Autres services Moins Services d’intérmediation Less Imputed Service Charges ... ... ... ... ... ... ... ... ... financière Gross domestic product at factor Produit intérieur brut aux couts des 4.6 5.3 5.7 6.0 6.6 4.5 9.3 6.5 6.8 cost / basic prices facteurs / prix de base Plus: Indirect Taxes / taxes on Plus taxes indirectes/impôts sur les 4.3 4.4 4.3 4.4 2.8 45.6 -4.2 -25.2 2.8 products, less subsidies produits, moins les subventions Gross domestic product at market Produit intérieur brut aux prix du 4.5 5.2 5.6 5.9 6.4 6.5 8.4 4.7 6.6 prices marché Break in the serie from 2006 Rupture de la série à partir 2006 African Statistical Yearbook 2011 / Annuaire Statistique pour l'Afrique 2011
  • 188.
    Ghana Ghana Expenditure on Gross domestic product at constant purchasers' Emplois du produit intérieur brut aux prix constants d'acquisition values Annual Growth Rates (%) Taux de croissance annuel (%) Consommation finale des Government final consumption -4.4 4.5 -5.4 -3.9 -3.4 1.5 13.0 -11.9 57.0 administrations publiques Private final consumption 12.3 6.5 3.1 6.3 7.8 8.0 7.9 1.9 5.9 Consommation finale privée Gross fixed capital formation -21.1 29.3 28.7 7.7 23.6 18.3 30.1 -24.2 45.7 Formation brute de capital fixe Exports of goods and services -2.2 -6.1 11.4 9.3 10.3 18.2 16.7 12.6 53.7 Exportations de biens et services Moins importations de biens et Less imports of goods and services 2.1 7.7 8.9 6.7 13.7 21.7 24.6 -14.1 69.4 services III INFLATION 2002 2003 2004 2005 2006 2007 2008 2009 2010 Annual Growth Rates (%) Taux de croissance annuel (%) All Item 14.8 26.7 12.6 15.4 11.7 10.7 16.4 19.2 10.8 Ensemble Food ... ... ... 13.6 9.9 9.5 15.2 15.6 6.1 Alimentation Health ... ... ... 20.2 20.7 31.7 19.6 48.3 12.1 Santé Energy ... ... ... 24.0 20.0 16.1 17.8 4.6 14.8 Energie Transport ... ... ... 31.5 28.0 17.4 23.2 2.8 10.3 Transport IV AGRICULTURAL PRODUCTION - PRODUCTION AGRICOLE 2002 2003 2004 2005 2006 2007 2008 2009 2010 Tons (Thousand) Tonnes (milliers) Cassava, Tons (thousands) 9 731 10 239 9 739 9 567 9 638 9 650 ... ... ... Manioc, tonnes (milliers) Yams, Tons (thousands) 3 900 3 813 3 892 3 893 3 600 3 550 ... ... ... Ignames, tonnes (milliers) Plantains, Tons (thousands) 2 279 2 329 2 381 2 792 2 900 2 930 ... ... ... Plantains, tonnes (milliers) Taro, Tons (thousands) 1 860 1 805 1 716 1 686 1 660 1 662 ... ... ... Taros, tonnes (milliers) Maize, Tons (thousands) 1 400 1 289 1 158 1 171 1 189 1 100 1 100 ... ... Maïs, tonnes (milliers) V MINING PRODUCTION - PRODUCTION MINIERE 187 2002 2003 2004 2005 2006 2007 2008 2009 2010 Aluminium ores and concentrates Minerais d'aluminium et concentrés 684.0 495.0 498.0 606.7 841.8 1 033.4 ... ... ... (Bauxite), metric tons (thousands) (Bauxite), tonnes métriques Gold ores and concentrates, 65 547.0 69 600.0 63 139.0 66 530.0 72 323.0 83 558.0 ... ... ... Minerais d'or et concentrés Kilograms (Kilogrammes) Diamonds, industrial, carat 193.0 180.0 180.0 200.0 190.0 180.0 ... ... ... Diamants industriels, carat (milliers) (thousands) VI ENERGY - ENERGIE 2002 2003 2004 2005 2006 2007 2008 2009 2010 Electricity - total hydro production, Électricité - production hydraulique 5 036.0 3 885.0 5 281.0 5 629.0 5 619.0 3 727.0 ... ... ... kilowatt hours (millions) totale, kilowatt-heures (millions) Electricity - total thermal production, Électricité - production thermique 2 265.0 2 020.0 763.0 1 164.0 2 816.0 3 257.0 ... ... ... kilowatt hours (millions) totale, kilowatt-heures (millions) Electricity - total production, self- Electricité - Production totale privée 5 5 5 5 6 6 ... ... ... producer (Million Kilowatt Hours) (million de kilowatt heures) Electricity - total production, public Electricité - Production totale 7 296 5 900 6 039 6 788 8 429 6 978 ... ... ... (Million Kilowatt Hours) publique (million de kilowatt heures) African Statistical Yearbook 2011 / Annuaire Statistique pour l'Afrique 2011
  • 189.
    Ghana Ghana VII TOURISM AND INFRASTRUCTURE - TOURISME ET INFRASTUCTURE 2002 2003 2004 2005 2006 2007 2008 2009 2010 Arrivals - Tourists (thousands) 483 531 584 429 497 587 ... ... ... Arrivées - touristes (milliers) Rooms in hotels and similar Chambres d'hotels et établissements establishments (thousands) 16 17 18 19 ... ... ... ... ... assimilés (milliers) Paved Road (% of total) ... ... ... 15 ... ... ... ... ... Routes asphaltées (% du total) Total Network (Railways-km) ... 977 977 ... ... ... ... ... ... Réseau total voies ferrées-Km Main Telephone Lines (per 1,000 Lignes téléphoniques fixes (pour 13 14 15 15 16 16 6 ... ... inhabitants) 1000 habitants) Mobile Cellular Subscribers (per Abonnés aux téléphones mobiles 19 38 79 131 233 332 496 ... ... 1,000 inhabitants) (pour 1000 habitants) VII FINANCIAL AND MONETARY STATISTICS - FINANCES ET STATISTIQUES MONETAIRES 2002 2003 2004 2005 2006 2007 2008 2009 2010 VII-1 Monetary Statistics VII-1 Statistiques monétaires Cedi (Millions) Cedi(Millions) Money supply (M1) 1 307 1 512 1 924 2 161 2 962 3 968 5 531 6 721 8 664 Masse monétaire (M1) Quasi-money 360 542 690 962 1 389 1 986 2 756 3 873 4 998 Quasi-monnaie of which Demand Deposit ... ... ... ... ... ... ... ... ... dont Monnaie scripturale Net foreign assets 352 933 1 251 1 478 2 088 2 431 2 686 3 827 5 486 Avoirs extérieurs nets Domestic credit 1 690 1 781 2 511 3 000 3 948 5 294 8 420 10 511 12 893 Crédit intérieur of which claims on private sector 594 827 1 052 1 512 2 075 3 355 4 793 5 730 7 039 dont créances sur le secteur privé of which Claims on government dont créances nettes sur le 854 688 1 347 1 229 1 533 1 323 2 641 3 606 4 643 sector, net gouvernement International reserves (millions of US Réserves internationales (millions de 540 1 353 1 627 1 753 2 090 ... ... ... ... $) $ EU) Average Exchange Rate (National Taux de change (moyen) (monnaie 0.79 0.87 0.90 0.91 0.92 0.94 1.06 1.41 1.43 Currency per us $) nationale par dollars) VII-2 Public Finance VII-2 Finances publiques Cedi (Millions) Cedi(Millions) Total Revenues and Grants 944 1 615 2 375 2 830 3 192 4 508 5 623 6 881 8 167 Recettes totales et dons Tax Revenue 765 1 263 1 702 2 013 2 326 3 313 4 368 4 804 6 068 Recettes fiscales Non Tax Revenue 26 40 165 311 231 338 434 870 813 Recettes non fiscales 188 Grants 153 312 508 506 635 857 821 1 207 1 286 Dons Total Expenditures and Net Lending 1 275 1 903 2 659 2 986 4 010 5 701 8 012 8 417 11 089 Dépenses totales et prêts nets Current expenditure 559 763 973 1 138 1 870 2 176 3 104 3 268 4 536 Dépenses courantes Of which Wages and Salaries 414 557 699 827 1 137 1 419 1 988 2 479 3 051 Dont rémunérations et salaires Capital expenditure 299 591 989 1 167 1 449 1 630 2 481 2 497 3 336 Dépenses d'équipement Net Lending 0 0 0 0 0 387 279 288 0 Prêts nets Fiscal Balance - 331 - 288 - 284 - 156 - 818 - 1 193 - 2 389 - 1 535 - 2 923 Solde global y compris les dons VII-3 Balance of Payments VII-3 Balance des paiements Cedi (Millions) Cedi(Millions) Trade balance - 5 482 - 5 811 - 14 327 - 23 066 - 27 741 - 36 419 - 52 877 - 49 762 ... Balance commerciale Services Balance - 923 - 2 338 - 3 204 - 1 510 - 1 229 - 1 494 - 1 913 - 2 703 ... Balance des services Net Income - 984 - 1 569 - 1 779 - 1 696 - 1 167 - 1 026 - 1 472 - 5 483 ... Revenus nets Current transfers, net total 7 141 12 128 16 470 19 262 22 712 21 170 29 352 16 144 ... Transferts courants Current account balance - 247 2 410 - 2 841 - 7 009 - 7 426 - 17 768 - 26 910 - 41 804 ... Solde du compte courant VII-4 External Debt and Financial Flows VII-4 Dette extérieure et flux financiers US $ (Millions) $ E.U (Millions) Total external debt 7 215 8 689 9 581 7 982 4 217 5 748 6 227 7 298 ... Dette extérieure totale Private 1 083 1 140 3 133 1 634 2 041 2 162 2 192 2 252 ... Privée Public 6 131 7 549 6 448 6 348 2 177 3 586 4 035 5 046 ... Publique Total external debt service 267 161 195 227 581 181 329 579 ... Service de la dette extérieure Net Foreign Direct Investment Investissements étranger direct (flux 59 105 139 145 636 855 2 120 ... ... Inflows nets entrants) Net Total Official Development Aide publique au développement 657 967 1 403 1 136 1 175 1 154 1 293 ... ... assistance (nette totale) African Statistical Yearbook 2011 / Annuaire Statistique pour l'Afrique 2011
  • 190.
    Ghana Ghana 2002 2003 2004 2005 2006 2007 2008 2009 2010 US $ (Millions) Cedi Exports, fob Exportations, fàb Exports - Total 2 015 2 562 2 704 2 802 3 727 4 172 5 270 5 786 ... Exportations - Total Main Products Principaux produits Cocoa beans, whole or broken, raw Cacao en fèves et brisures de fèves, 564 803 934 947 1 183 1 401 1 743 1 578 ... or roasted bruts ou torrefiés Minerais de manganèse et leurs Manganese ores and concentrates 74 102 125 146 116 254 620 264 ... concentrés, etc etc Petroleum oils&oils obtained from Huiles de pétrole, bitumineux, bituminous minerals,o/than crude 40 64 93 157 107 125 173 20 ... distilles, sauf brut etc Tuna, skipjack, bonito, Thon, bonite, bonite, 61 76 73 78 77 96 130 123 ... prepared/preserved, not mince prepares/conserves, pas mache Cocoa paste not defatted 25 30 51 46 71 85 102 125 ... Pâte de cacao non dégraissée Main Destinations Principales destinations Netherlands 196.9 172.3 292.5 297.9 304.0 335.5 586.7 467.2 ... Pays-Bas United Kingdom 178.0 228.3 247.4 196.6 244.3 318.1 383.9 289.9 ... Royaume-Uni France 130.0 176.8 181.6 154.8 161.4 262.8 294.2 253.8 ... France United States 128.5 93.4 159.9 173.5 209.7 212.1 241.3 144.4 ... États-Unis Germany 120.4 137.4 113.4 116.5 157.9 178.6 143.7 150.4 ... Allemagne 2002 2003 2004 2005 2006 2007 2008 2009 2010 Imports, cif Importations, cif Imports - Total ... ... ... ... ... ... ... ... ... Importations - Total (millions) 189 Principaux produits Main Products Petroleum oils and oils obtained from Huiles de pétrole, les huiles de 354 451 ... 0 1 525 800 1 496 298 ... bituminous minerals, crude minéraux bitumineux, brut Petroleum oils&oils obtained from Huiles de pétrole, bitumineux, bituminous minerals,o/than crude 55 90 121 123 299 432 688 329 ... distilles, sauf brut etc Dentifrices 2 3 4 4 74 17 466 10 ... Dentifrices Rice, semi-milled or wholly milled, Riz semi-blanchi ou blanchi, même 46 60 128 111 91 140 192 180 ... whether or not polished or glazed poli ou glacé Huile de palme et ses fractions, Palm oil and its fractions refined but 27 55 59 57 82 119 160 82 ... raffinées, mais non chimiquement not chemically modified modifiées Main Origin Principales provenances China 182.3 321.8 510.4 672.4 803.1 1 228.0 1 747.9 1 533.7 ... Chine Nigeria 380.2 454.8 0.0 0.0 1 563.1 859.4 1 861.7 303.5 ... Nigéria United States 192.6 209.4 306.5 337.5 289.7 415.9 608.7 634.3 ... États-Unis United Kingdom 209.2 264.3 313.2 281.7 349.4 429.3 489.2 404.4 ... Royaume-Uni India 96.4 169.5 168.1 201.9 280.5 767.9 551.3 383.2 ... Inde African Statistical Yearbook 2011 / Annuaire Statistique pour l'Afrique 2011
  • 191.
    Guinea Guinée AREA (KM 2) 245 857 SUPERFICIE (KM 2) CAPITAL CITY Conakry Conakry CAPITALE CURRENCY Guinea Franc Franc Guinéen MONNAIE I SOCIAL AND DEMOGRAPHIC INDICATORS — INDICATEURS DEMOGRAPHIQUES ET SOCIAUX 2002 2003 2004 2005 2006 2007 2008 2009 2010 Population Population Population au milieu de l'année - Mid-year population - Total (Million) 8.3 8.6 8.8 9.1 9.3 9.6 9.9 10.2 ... Total (million) Population au milieu de l'année - Mid-year population - Urban (%) 15.6 15.6 15.6 15.7 15.7 15.7 15.7 15.7 ... Urbaine (%) Female (%) 50.9 50.9 50.9 50.8 50.8 50.8 50.7 50.7 ... Femme (%) Population by Age Group Population par groupe d'âge 0-14 3735 814 3785 077 3830 845 3880 096 3938 950 4012 533 4104 881 4218 987 ... 0-14 15-64 4187 101 4366 967 4561 730 4763 622 4966 089 5164 095 5354 191 5533 912 ... 15-64 65+ 401 124 408 016 413 847 420 312 428 568 439 011 451 245 464 692 ... 65+ Active Population (000) 4 141.0 4 225.0 4 312.0 4 349.0 4 478.3 4 613.6 4 755.0 4 835.0 ... Population active (000) Female (%) 47.0 47.0 47.0 47.7 47.7 47.7 47.7 47.1 ... Femme (%) Taux brut de natalité - Total (par Crude birth rate - Total (per 1000) 40.1 40.3 40.5 40.8 41.1 41.4 41.5 41.6 ... 1000) Taux brut de mortalité - Total (par Crude death rate - Total (per 1000) 12.4 12.1 11.9 11.7 11.6 11.4 11.2 11.0 ... 1000) Life expectancy at birth - Total Espérance de vie à la naissance - ... ... ... 54.0 54.0 54.0 54.0 58.4 ... (years) Total (années) Net reproduction rate - (per Taux net de reproduction - (par ... ... ... 2.1 ... ... ... ... ... woman) femme) Indice synthétique de fécondité - Total fertility rate - (p woman) y (per ) ... ... ... 5.7 5.7 5.7 5.7 5.3 ... (par femme) Education Enseignement Teaching staff at first level - Total Personnel enseignant - 1er degré - 21.13 23.9 25.4 26.9 28.3 29.0 30.9 31.8 ... (thousands) Total (milliers) Teaching staff at second level - Total Personnel enseignant - 2ème degré - 190 7.25 8.4 9.4 11.0 12.2 13.3 14.9 16.4 ... (thousands) Total (milliers) Teaching staff at third level - Total Personnel enseignant - 3ème degré - 0.8 0.9 0.0 0.9 1.0 1.3 ... ... ... (thousands) Total (milliers) First level student enrollment - Total Elèves inscrits - 1er degré - Total 998 1 073 1 147 1 207 1 258 1 318 1 364 1 390 ... (thousands) (milliers) First level student enrollment - Elèves inscrits - 1er degré - Femmes 418 458 497 532 564 596 616 629 ... Female (thousands) (milliers) Second level student enrollment - Elèves inscrits - 2ème degré - Total 271 301 340 416 478 526 520 549 ... Total (thousands) (milliers) Second level student enrollment - Elèves inscrits - 2ème degré - 79 94 105 138 163 187 187 198 ... Female (thousands) Femmes (milliers) Third level student enrollment - Total Elèves inscrits - 3ème degré - Total ... 16.9 17.2 23.8 42.7 68.3 80.2 ... ... (thousands) (milliers) Third level student enrollment - Elèves inscrits - 3ème degré - ... 2.6 2.7 4.4 9.1 16.7 19.6 ... ... Female (thousands) Femmes (milliers) Public expenditure on education (% Dépenses publiques consacrées à 15.5 16.6 14.2 13.8 11.2 23.3 ... ... ... of budget) l'enseignement (% du budget) Health Santé Hospital beds - Total (per 10 000 Nombre de lits d'hôpitaux - Total ... ... 54 ... ... ... ... ... ... population) (pour 10 000) Nurses - Total (per 10 000 Nombre d'infirmières - Total (pour ... ... ... ... ... ... ... ... ... population) 10 000) Physicians - Total (per 10 000 Nombre de médecins - Total (pour ... 1 1 2 ... ... ... ... ... population) 10 000) Public expenditure on Health (% of Dépenses publiques consacrées à la 21 15 9 12 13 2 2 ... ... budget) santé (% du budget) African Statistical Yearbook 2011 / Annuaire Statistique pour l'Afrique 2011
  • 192.
    Guinea Guinée II NATIONAL ACCOUNTS — COMPTES NATIONAUX 2002 2003 2004 2005 2006 2007 2008 2009 2010 Gross domestic product by kind of economic activity at current prices Produit intérieur brut par branche d'activité économique aux prix courants Guinea Franc (Millions) Franc Guinéen(Millions) Agriculture 1 260 935 1 421 547 1 901 906 2 384 891 3 312 611 4 056 952 4 741 217 5 232 139 5 490 562 Agriculture Mining and quarrying 989 591 1 044 254 1 236 241 1 858 676 3 312 436 3 391 578 4 611 290 4 258 238 6 359 669 Industries extractives Manufacturing 220 709 405 530 462 179 651 210 855 182 1 123 440 1 297 652 1 492 445 1 715 763 Industries manufacturières Electricity, gas & water 57 215 30 200 33 525 45 586 57 268 69 210 78 128 90 706 104 240 Electricité, gaz et eau Construction 558 264 690 230 756 830 876 131 1 318 210 1 742 054 2 063 721 2 304 933 2 695 285 Bâtiments et travaux publics Wholesale & retail trade, Commerce de gros et de détail, 1 269 915 1 136 990 1 359 666 1 866 029 2 212 357 2 911 528 3 240 893 3 579 839 4 179 676 restaurants, hotels restaurants et hôtels Banques, assurances, affaires Finance, insurance, real estate, etc. ... ... ... ... ... ... ... ... ... immobilières Transport and communications 282 441 486 730 585 816 648 691 783 704 998 329 1 067 334 1 193 685 1 388 325 Transport(s) et communications Administrations publiques et Public administration and defense 273 700 973 203 1 051 992 1 261 745 1 671 152 1 275 979 1 458 569 1 511 512 1 839 212 défense Other services 471 552 177 700 204 067 279 033 369 516 437 243 447 356 559 419 673 796 Autres services Moins Services d’intermédiation Less Imputed Service Charges ... ... ... ... ... ... ... ... ... financière Gross domestic product at factor Produit intérieur brut aux couts des 5 384 322 6 366 384 7 592 222 9 871 992 13 892 437 16 006 314 19 006 160 20 222 915 24 446 528 cost / basic prices facteurs / prix de base Plus: Indirect Taxes / taxes on Plus taxes indirectes/impôts sur les 444 810 474 566 565 496 831 676 1 201 768 1 347 920 1 774 270 1 902 040 2 561 980 products, less subsidies produits, moins les subventions Expenditure on Gross domestic product at current purchaser's values Emploi du produit intérieur brut aux prix courants d'acquisition Guinea Franc (Millions) Franc Guinéen(Millions) Consommation finale des Government final consumption 467 387 538 812 566 225 670 729 1 065 135 1 156 306 1 270 764 1 889 117 3 324 492 administrations publiques Private final consumption 4 497 143 4 872 395 5 837 802 7 696 937 11 262 116 13 859 268 16 253 045 17 896 362 20 554 912 Consommation finale privée Gross fixed capital formation 1 083 819 1 355 343 1 858 242 2 490 042 3 385 086 3 339 048 4 429 171 3 631 784 4 851 720 Formation brute de capital fixe Increase in inventories 33 744 123 317 136 512 216 780 123 896 93 870 140 854 - 8 536 4 807 Variation des stocks Exports of goods and services 1 602 350 1 675 045 1 905 691 3 382 903 5 769 804 5 231 391 7 008 952 5 356 962 8 864 519 Exportations de biens et services Moins importations de biens et 191 Less imports of goods and services 1 855 310 1 723 963 2 146 753 3 753 722 6 511 832 6 325 649 8 322 357 6 640 734 10 591 942 services GDP at purchasers' values 5 829 132 6 840 950 8 157 718 10 703 668 15 094 205 17 354 234 20 780 430 22 124 955 27 008 508 PIB aux prix d'acquisition Gross domestic product by kind of economic activity at constant Produit intérieur brut par branche d'activité economique aux prix constants prices Annual Growth Rates (%) Taux de croissance annuel (%) Agriculture 4.2 3.5 3.2 1.3 3.9 2.8 3.6 3.2 3.2 Agriculture Mining and quarrying 2.9 2.7 1.1 2.4 -1.6 2.4 14.2 -7.3 1.1 Industries extractives Manufacturing 5.9 -4.0 3.0 3.5 1.8 -0.1 1.5 1.6 1.2 Industries manufacturières Electricity, gas & water 3.0 -5.5 0.9 1.0 0.5 5.1 5.5 4.5 1.7 Electricité, gaz et eau Construction 8.0 -1.0 6.0 6.0 8.0 1.5 7.5 -0.1 4.5 Bâtiments et travaux publics Wholesale & retail trade, Commerce de gros et de 3.5 1.1 1.0 1.5 1.5 1.0 2.3 -1.2 1.0 restaurants, hotels détail,restaurants et hôtels Banques, assurances, affaires Finance, insurance, real estate, etc. ... ... ... ... ... ... ... ... ... immobilières Transport and communications 2.6 1.0 1.2 1.8 0.5 1.1 2.8 -0.5 1.4 Transport(s) et communications Administrations publiques et Public administartion and defense 2.5 1.5 1.3 1.7 1.0 -0.2 2.5 3.5 1.7 défense Other services 1.9 1.5 1.4 1.2 2.5 0.5 1.3 2.5 1.3 Autres services Moins Services d’intérmediation Less Imputed Service Charges ... ... ... ... ... ... ... ... ... financière Gross domestic product at factor Produit intérieur brut aux couts des 3.9 1.3 2.2 2.3 2.2 1.5 5.1 -0.1 2.1 cost / basic prices facteurs / prix de base Plus: Indirect Taxes / taxes on Plus taxes indirectes/impôts sur les 24.9 0.1 3.6 12.4 6.2 5.2 2.8 -2.5 -0.2 products, less subsidies produits, moins les subventions Gross domestic product at market Produit intérieur brut aux prix du 5.2 1.2 2.3 3.0 2.5 1.8 4.9 -0.3 1.9 prices marché 2009: semi-final 2010: Provisional 2009: provisoire 2010:Estimée African Statistical Yearbook 2011 / Annuaire Statistique pour l'Afrique 2011
  • 193.
    Guinea Guinée Expenditure on Gross domestic product at constant purchasers' Emplois du produit intérieur brut aux prix constants d'acquisition values Annual Growth Rates (%) Taux de croissance annuel (%) Consommation finale des Government final consumption 21.8 10.8 1.0 13.9 52.7 4.4 55.1 15.2 -5.3 administrations publiques Private final consumption 1.1 -7.8 3.4 -3.1 -4.4 11.3 -9.8 -26.3 11.7 Consommation finale privée Gross fixed capital formation 29.4 9.7 18.9 23.3 26.4 -4.1 34.5 19.9 11.1 Formation brute de capital fixe Exports of goods and services 0.7 6.2 -4.1 3.5 -2.1 -3.8 19.8 8.4 7.9 Exportations de biens et services Moins importations de biens et Less imports of goods and services 6.6 -7.6 9.0 8.9 20.0 10.0 30.6 -4.7 13.3 services III INFLATION 2002 2003 2004 2005 2006 2007 2008 2009 2010 Annual Growth Rates (%) Taux de croissance annuel (%) All Item 3.0 12.9 17.5 31.4 34.7 22.9 18.4 4.7 15.8 Ensemble Food 9.9 -9.5 -7.7 39.6 47.1 17.3 13.2 ... ... Alimentation Health 4.2 9.4 -25.4 14.0 22.7 19.0 14.1 ... ... Santé Energy 2.8 6.2 -22.5 19.2 39.3 14.4 14.3 ... ... Energie Transport 3.3 16.6 -14.9 38.4 43.9 -9.1 16.3 ... ... Transport IV AGRICULTURAL PRODUCTION - PRODUCTION AGRICOLE 2002 2003 2004 2005 2006 2007 2008 2009 2010 Tons (Thousand) Tonnes (milliers) Rice, Tons (thousands) 1 034 1 089 1 147 1 208 1 272 1 340 1 402 1 466 ... Riz Paddy, tonnes (milliers) Maize, Tons (thousands) 25 27 30 32 35 38 42 45 ... Maïs, tonnes (milliers) Fonio, Tons (thousands) 178 188 198 208 219 231 243 256 ... Fonio, tonnes (milliers) Groundnuts, Tons (thousands) 4 458 5 112 5 863 6 724 7 712 8 845 10 144 11 634 ... Arachide, tonnes (milliers) Cassava, Tons (thousands) 836 878 922 969 1 017 1 069 1 122 1 179 ... Manioc, tonnes (milliers) V MINING PRODUCTION - PRODUCTION MINIERE 192 2002 2003 2004 2005 2006 2007 2008 2009 2010 Aluminium ores and concentrates Minerais d'aluminium et concentrés 15 177.9 15 260.9 16 241.2 16 484.1 16 956.6 16 700.0 17 965.0 18 954.8 ... (Bauxite), metric tons (thousands) (Bauxite), tonnes (milliers) Gold ores and concentrates 17 578.4 16 935.0 14 518.0 18 328.0 18 455.2 19 053.6 19 975.6 20 946.0 ... Minerais d'or et concentrés, (Kilograms) Kilogrammes Diamonds, carat (thousands) 513.4 698.6 719.4 699.7 468.9 1 012.6 1 063.3 1 190.9 ... Diamant (milliers carats) VI ENERGY - ENERGIE 2002 2003 2004 2005 2006 2007 2008 2009 2010 Electricity - total hydro production, Électricité - production hydraulique 699.8 583.2 652.6 581.1 542.8 632.6 660.7 ... ... kilowatt hours (millions) totale, kilowatt-heures (millions) Electricity - total thermal production, Électricité - production thermique 73.8 69.5 73.7 78.5 84.7 20.2 19.3 ... ... kilowatt hours (millions) totale, kilowatt-heures (millions) Electricity - total production, self- Electricité - Production totale privée 315 316 320 231 168 182 174 ... ... producer (Million Kilowatt Hours) (million de kilowatt heures) Electricity - total production, public Electricité - Production totale 700 583 653 581 542 633 440 ... ... (Million Kilowatt Hours) publique (million de kilowatt heures) African Statistical Yearbook 2011 / Annuaire Statistique pour l'Afrique 2011
  • 194.
    Guinea Guinée VII TOURISM AND INFRASTRUCTURE - TOURISME ET INFRASTUCTURE 2002 2003 2004 2005 2006 2007 2008 2009 2010 Arrivals - Tourists (thousands) 42.507 43.966 44.622 45.334 46.096 ... ... ... ... Arrivées - touristes (milliers) Rooms in hotels and similar Chambres d'hotels et établissements establishments (thousands) 4 3.747 3.886 4.295 4.495 ... ... ... ... assimilés (milliers) Paved Road (% of total) 35 31 41 35 35 35 35 35 ... Routes asphaltées (% du total) Total Network (Railways-km) ... 6 758 6 758 6 758 6 758 6 758 6 758 6 758 ... Réseau total voies ferrées-Km Main Telephone Lines (per 1,000 Lignes téléphoniques fixes (pour 216 247 326 3 2 2 2 ... ... inhabitants) 1000 habitants) Mobile Cellular Subscribers (per Abonnés aux téléphones mobiles 71 94 250 205 201 208 391 ... ... 1,000 inhabitants) (pour 1000 habitants) VII FINANCIAL AND MONETARY STATISTICS - FINANCES ET STATISTIQUES MONETAIRES 2002 2003 2004 2005 2006 2007 2008 2009 2010 VII-1 Monetary Statistics VII-1 Statistiques monétaires Guinea Franc (Millions) Franc Guinéen(Millions) Money supply (M1) 681 228 893 055 1 143 310 1 394 200 ... ... ... ... ... Masse monétaire (M1) Quasi-money 144 302 206 281 356 870 606 326 ... ... ... ... ... Quasi-monnaie of which Demand Deposit ... ... ... ... ... ... ... ... ... dont Monnaie scripturale Net foreign assets 71 909 - 10 892 90 958 168 216 ... ... ... ... ... Avoirs extérieurs nets Domestic credit 794 387 1 098 650 1 331 460 1 899 270 ... ... ... ... ... Crédit intérieur of which claims on private sector 241 832 289 157 308 810 605 410 ... ... ... ... ... dont créances sur le secteur privé of which Claims on government dont créances nettes sur le 539 300 801 417 1 016 010 1 287 230 ... ... ... ... ... sector, net gouvernement International reserves (millions of US Réserves internationales (millions de 171 ... 110 95 ... ... ... ... ... $) $ EU) Average Exchange Rate (National Taux de change (moyen) (monnaie 1 975.84 1 984.93 2 225.03 3 644.33 5 350.00 4 122.80 5 500.00 ... ... Currency per us $) nationale par dollars) VII-2 Public Finance VII-2 Finances publiques Guinea Franc (Millions) Franc Guinéen(Millions) Total Revenues and Grants 876 868 982 793 1 027 395 1 631 530 2 658 392 2 726 610 3 368 120 3 492 790 4 523 823 Recettes totales et dons Tax Revenue 692 600 705 230 873 381 1 433 330 2 141 782 2 347 350 3 060 140 3 303 880 ... Recettes fiscales Non Tax Revenue 71 260 48 870 62 614 123 300 271 530 129 930 204 970 108 330 ... Recettes non fiscales Grants 113 008 228 693 91 400 74 900 245 080 249 330 103 010 80 580 ... Dons 193 Total Expenditures and Net Lending 1 157 389 1 322 533 1 464 192 1 724 984 2 710 304 2 641 329 3 617 895 5 240 240 7 778 736 Dépenses totales et prêts nets Current expenditure 454 690 514 630 534 108 648 651 1 095 870 1 167 790 1 844 855 2 470 100 ... Dépenses courantes Of which Wages and Salaries 236 890 258 610 274 804 332 506 444 420 607 210 856 270 1 109 230 ... Dont rémunérations et salaires Capital expenditure 369 000 390 613 444 000 500 378 672 350 682 440 837 290 1 577 180 ... Dépenses d'équipement Net Lending 4 400 1 420 700 140 8 144 2 724 2 970 7 740 ... Prêts nets Fiscal Balance - 280 521 - 339 740 - 436 797 - 93 454 - 51 912 85 281 - 249 775 -1 747 450 -3 254 913 Solde global y compris les dons VII-3 Balance of Payments VII-3 Balance des paiements Guinea Franc (Millions) Franc Guinéen(Millions) Trade balance - 114 420 425 553 - 76 920 - 76 920 - 150 320 - 136 240 - 22 220 980 889 ... Balance commerciale Services Balance - 240 170 - 474 475 - 197 170 - 195 430 - 217 500 - 247 420 - 337 110 -1 897 586 ... Balance des services Net Income - 102 330 - 78 090 - 59 800 - 48 400 - 59 780 - 63 150 - 80 550 - 307 177 ... Revenus nets Current transfers, net total 45 950 109 250 13 160 - 10 080 - 20 610 - 130 590 18 480 - 694 833 ... Transferts courants Current account balance - 199 630 - 17 762 - 117 720 - 151 640 - 227 030 - 455 570 - 423 240 -1 918 708 ... Solde du compte courant VII-4 External Debt and Financial Flows VII-4 Dette extérieure et flux financiers US $ (Millions) $ E.U (Millions) Total external debt 3 046 3 364 3 290 3 235 3 188 3 242 3 099 3 015 3 054 Dette extérieure totale Private 0 0 0 0 0 0 0 0 101 Privée Public 3 046 3 364 3 290 3 235 3 188 3 242 3 099 3 015 2 952 Publique Total external debt service 134 167 180 196 209 203 174 166 ... Service de la dette extérieure Net Foreign Direct Investment Investissements étranger direct (flux 30 83 98 105 125 386 382 141 ... Inflows nets entrants) Net Total Official Development Aide publique au développement 254 254 278 198 170 228 328 215 ... assistance (nette totale) African Statistical Yearbook 2011 / Annuaire Statistique pour l'Afrique 2011
  • 195.
    Guinea Guinée 2002 2003 2004 2005 2006 2007 2008 2009 2010 US $ (Millions) Franc Guinéen Exports, fob Exportations, fàb Exports - Total 531 ... 584 678 661 1 070 1 441 1 603 ... Exportations - Total Main Products Principaux produits Bauxite 282 256 292 358 405 431 518 571 ... Bauxite Allumine 138 145 163 173 147 215 263 318 ... Allumine Diamonds 36 52 48 45 43 51 62 69 ... Diamant Gold 162 179 165 182 327 438 465 515 ... Or Coffee 5 14 12 19 22 22 22 23 ... Café Main Destinations Principales destinations East African / Southern 0.4 0.6 916.0 5.8 8.2 11.9 85.6 ... ... Afrique de l'est/Australe Liberia 0.2 0.3 709.1 3.3 6.0 11.3 41.4 ... ... Liberia North Africa 8.5 1.1 471.0 2.0 1.5 0.9 3.1 ... ... Afrique du Nord Europe 337.3 303.4 122.9 161.8 217.1 299.7 132.9 ... ... Europe China 9.8 0.0 115.2 3.6 7.2 11.5 40.0 ... ... Chine 2002 2003 2004 2005 2006 2007 2008 2009 2010 Imports, cif Importations, cif 194 Imports - Total 655 630 778 817 1 066 1 107 1 252 ... ... Importations - Total (millions) Principaux produits Main Products Food 118 111 160 147 160 186 185 165 ... Produits alimentaires Other consumer goods 113 96 134 119 147 165 175 173 ... Autres biens de consommation Petroleum Products 106 96 124 124 202 300 383 260 ... Produits pétroliers Intermediate goods 130 131 142 168 230 232 259 209 ... Biens intermédiaires Equipment goods 188 197 217 259 327 224 250 176 ... Biens d'équipement Main Origin Principales provenances Europe ... ... 51.4 79.7 38.7 38.8 35.0 ... ... Europe European Union 251.9 257.9 272.1 485.8 338.2 491.6 472.5 ... ... Union Européenne Other Asian countries 160.4 185.4 184.6 260.6 244.1 87.6 285.9 ... ... Autres Pays d' Asie Ivory Coast 97.2 43.2 169.0 382.9 237.0 130.6 120.3 ... ... Côte d'Ivoire North America 57.0 25.1 40.0 116.1 52.0 58.1 0.0 ... ... Amérique du Nord African Statistical Yearbook 2011 / Annuaire Statistique pour l'Afrique 2011
  • 196.
    Guinea-Bissau Guinée-Bissau AREA (KM 2) 36 125 SUPERFICIE (KM 2) CAPITAL CITY Bissau Bissau CAPITALE CURRENCY CFA Franc Franc CFA MONNAIE I SOCIAL AND DEMOGRAPHIC INDICATORS — INDICATEURS DEMOGRAPHIQUES ET SOCIAUX 2002 2003 2004 2005 2006 2007 2008 2009 2010 Population Population Population au milieu de l'année - Mid-year population - Total (Million) 1.2 1.2 1.3 1.3 1.3 1.4 1.4 1.5 1.6 Total (million) Population au milieu de l'année - Mid-year population - Urban (%) 33.0 33.0 33.0 33.0 33.0 33.0 33.0 48.0 48.0 Urbaine (%) Female (%) 51.7 51.7 51.7 51.7 51.7 51.7 51.7 51.7 51.7 Femme (%) Population by Age Group Population par groupe d'âge 0-14 563 488 575 596 588 230 601 450 615 331 629 964 640 595 646 352 665 439 0-14 15-64 586 870 599 481 612 639 626 408 640 865 656 105 667 178 822 769 847 065 15-64 65+ 64 055 65 432 66 868 68 371 69 949 71 612 72 820 51 709 53 235 65+ Active Population (000) 874.4 893.2 912.8 933.3 954.8 977.5 994.0 573.2 590.2 Population active (000) Female (%) 52.6 52.6 52.6 52.6 52.6 52.6 52.6 21.0 21.0 Femme (%) Taux brut de natalité - Total (par Crude birth rate - Total (per 1000) 42.8 42.6 42.3 42.1 40.9 41.5 41.2 42.0 41.8 1000) Taux brut de mortalité - Total (par Crude death rate - Total (per 1000) 18.6 18.4 18.2 18.0 17.3 17.5 17.2 16.0 16.0 1000) Life expectancy at birth - Total Espérance de vie à la naissance - 46.3 46.5 46.7 46.9 46.0 46.2 46.4 47.0 47.0 (years) Total (années) Net reproduction rate - (per Taux net de reproduction - (par ... ... ... 2.4 ... ... ... ... ... woman) femme) Indice synthétique de fécondité - Total fertility rate - (per woman) 6.8 6.8 6.8 6.8 6.8 6.8 6.8 6.8 6.8 (par femme) Education Enseignement Teaching staff at first level - Total Personnel enseignant - 1er degré - ... ... 5.6 5.6 5.7 5.7 5.8 5.9 6.0 (thousands) Total (milliers) Teaching staff at second level - Personnel enseignant - 2ème degré - ... ... 1.9 1.9 1.8 1.8 1.8 1.8 1.8 Total (thousands) Total (milliers) 195 Teaching staff at third level - Total Personnel enseignant - 3ème degré - ... ... 0.1 0.1 0.1 0.2 0.1 ... ... (thousands) Total (milliers) First level student enrollment - Total Elèves inscrits - 1er degré - Total ... ... 252 269 286 303 326 343 360 (thousands) (milliers) First level student enrollment - Elèves inscrits - 1er degré - Femmes ... ... 119 129 139 149 156 167 177 Female (thousands) (milliers) Second level student enrollment - Elèves inscrits - 2ème degré - Total ... ... 51 54 58 62 65 68 72 Total (thousands) (milliers) Second level student enrollment - Elèves inscrits - 2ème degré - ... ... 15 16 17 19 20 20 22 Female (thousands) Femmes (milliers) Third level student enrollment - Elèves inscrits - 3ème degré - Total ... ... ... 3.1 3.7 ... ... ... ... Total (thousands) (milliers) Third level student enrollment - Elèves inscrits - 3ème degré - ... ... ... ... ... ... ... ... ... Female (thousands) Femmes (milliers) Public expenditure on education (% Dépenses publiques consacrées à ... ... ... ... ... ... ... 7.0 8.0 of budget) l'enseignement (% du budget) Health Santé Hospital beds - Total (per 10 000 Nombre de lits d'hôpitaux - Total ... ... 6 6 6 6 6 12 13 population) (pour 10 000) Nurses - Total (per 10 000 Nombre d'infirmières - Total (pour ... 7 7 ... ... ... ... 14 14 population) 10 000) Physicians - Total (per 10 000 Nombre de médecins - Total (pour ... 1 1 ... ... ... ... 1 1 population) 10 000) Public expenditure on Health (% of Dépenses publiques consacrées à la 8 7 4 5 5 7 8 9 9 budget) santé (% du budget) African Statistical Yearbook 2011 / Annuaire Statistique pour l'Afrique 2011
  • 197.
    Guinea-Bissau Guinée-Bissau II NATIONAL ACCOUNTS — COMPTES NATIONAUX 2002 2003 2004 2005 2006 2007 2008 2009 2010 Gross domestic product by kind of economic activity at current prices Produit intérieur brut par branche d'activité économique aux prix courants CFA Franc(Millions) Franc CFA (Millions) Agriculture 117 799 113 907 114 001 130 037 125 795 138 737 173 021 165 500 166 792 Agriculture Mining and quarrying 206 230 135 91 83 147 105 110 116 Industries extractives Manufacturing 37 372 38 040 37 549 36 952 35 659 36 693 43 207 44 142 44 877 Industries manufacturières Electricity, gas & water 1 468 1 477 1 350 1 489 1 316 1 119 1 502 1 636 1 670 Electricité, gaz et eau Construction 6 802 7 595 4 476 3 020 2 740 4 898 3 469 5 154 5 739 Bâtiments et travaux publics Wholesale & retail trade, Commerce de gros et de détail, 59 594 54 277 55 440 59 441 60 090 69 579 72 874 79 184 80 173 restaurants, hotels restaurants et hôtels Banques, assurances, affaires Finance, insurance, real estate, etc. 1 160 1 290 1 282 1 612 2 080 1 483 1 487 1 491 1 495 immobilières Transport and communications 7 852 8 256 10 301 10 881 13 509 13 763 15 941 20 028 21 142 Transport(s) et communications Administrations publiques et Public administration and defense 29 286 29 696 30 234 33 255 32 036 34 350 33 623 41 712 41 724 défense Other services 12 645 10 468 12 831 15 264 16 738 16 902 18 007 17 487 17 500 Autres services Moins Services d’intermédiation Less Imputed Service Charges - 331 - 542 - 451 - 802 - 1 395 - 717 - 717 - 5 782 - 4 803 financière Gross domestic product at factor Produit intérieur brut aux couts des 273 853 264 694 267 148 291 240 288 651 316 954 362 519 370 662 392 425 cost / basic prices facteurs / prix de base Plus: Indirect Taxes / taxes on Plus taxes indirectes/impôts sur les 9 591 5 805 8 961 10 922 13 850 14 086 14 932 24 422 26 376 products, less subsidies produits, moins les subventions Expenditure on Gross domestic product at current purchaser's values Emploi du produit intérieur brut aux prix courants d'acquisition CFA Franc(Millions) Franc CFA (Millions) Consommation finale des Government final consumption 42 321 46 396 40 149 46 004 45 824 50 415 45 986 53 297 55 196 administrations publiques Private final consumption 244 188 218 720 246 883 273 287 286 391 303 860 357 433 364 196 368 527 Consommation finale privée Gross fixed capital formation 23 678 26 279 20 728 18 792 21 233 38 193 32 526 31 212 39 818 Formation brute de capital fixe Increase in inventories 304 305 312 1 120 - 1 904 554 378 400 422 Variation des stocks Exports of goods and services 44 561 43 120 43 410 47 813 36 836 55 626 58 627 60 502 73 360 Exportations de biens et services 196 Less imports of goods and services 71 608 64 320 75 373 84 854 85 879 117 608 117 499 114 523 118 523 Moins importations de biens et services GDP at purchasers' values 283 444 270 499 276 109 302 162 302 501 331 040 377 451 395 084 418 800 PIB aux prix d'acquisition Gross domestic product by kind of economic activity at constant Produit intérieur brut par branche d'activité economique aux prix constants prices Annual Growth Rates (%) Taux de croissance annuel (%) Agriculture -0.2 4.3 -1.6 10.4 -0.6 1.8 5.4 2.4 2.7 Agriculture Mining and quarrying 141.7 18.4 -38.8 -27.8 -14.3 96.2 -34.6 4.5 4.8 Industries extractives Manufacturing 5.3 5.7 -3.3 4.3 -1.8 -6.1 0.2 4.5 4.8 Industries manufacturières Electricity, gas & water 20.3 -10.6 2.8 10.3 -11.5 -15.0 34.1 4.5 4.8 Electricité, gaz et eau Construction 95.8 13.9 -40.3 -31.6 -5.4 85.0 -33.3 10.0 10.0 Bâtiments et travaux publics Wholesale & retail trade, Commerce de gros et de -16.5 -4.8 11.8 -7.6 5.2 11.8 6.3 2.8 4.6 restaurants, hotels détail,restaurants et hôtels Banques, assurances, affaires Finance, insurance, real estate, etc. 7.5 11.2 -0.6 25.7 37.5 -30.4 -26.4 4.1 4.1 immobilières Transport and communications -7.6 6.9 17.0 -13.2 24.1 -7.6 14.3 5.4 5.4 Transport(s) et communications Administrations publiques et Public administartion and defense -3.9 4.8 0.6 8.0 -3.9 4.4 -8.7 -1.0 -1.0 défense Other services 18.9 -15.4 19.8 16.4 6.3 -4.0 3.4 2.8 4.0 Autres services Moins Services d’intérmediation Less Imputed Service Charges 18.6 63.7 -16.8 77.8 85.4 -49.8 -26.6 116.5 116.4 financière Gross domestic product at factor Produit intérieur brut aux couts des -2.5 1.8 1.8 3.7 1.2 3.3 3.1 2.5 2.9 cost / basic prices facteurs / prix de base Plus: Indirect Taxes / taxes on Plus taxes indirectes/impôts sur les 46.8 -39.5 54.4 21.9 26.8 1.7 6.0 14.5 14.5 products, less subsidies produits, moins les subventions Gross domestic product at market Produit intérieur brut aux prix du -1.3 0.4 2.8 4.3 2.1 3.2 3.2 3.0 3.5 prices marché 2009: Provisional 2010:Estimates 2009: provisoire 2010:Estimée African Statistical Yearbook 2011 / Annuaire Statistique pour l'Afrique 2011
  • 198.
    Guinea-Bissau Guinée-Bissau Expenditure on Gross domestic product at constant purchasers' Emplois du produit intérieur brut aux prix constants d'acquisition values Annual Growth Rates (%) Taux de croissance annuel (%) Consommation finale des Government final consumption -5.9 14.3 -14.8 12.1 -0.7 6.1 -16.5 0.0 3.0 administrations publiques Private final consumption -0.4 -8.3 17.1 -0.7 3.6 1.2 6.3 1.2 0.3 Consommation finale privée Gross fixed capital formation 29.1 14.2 -21.3 -8.7 15.1 80.2 -13.4 5.2 6.7 Formation brute de capital fixe Exports of goods and services -19.9 -9.0 9.6 9.7 -10.8 50.1 7.4 2.0 9.2 Exportations de biens et services Moins importations de biens et Less imports of goods and services -6.0 -20.1 34.5 -6.9 -0.8 43.9 -2.4 -2.7 -0.9 services III INFLATION 2002 2003 2004 2005 2006 2007 2008 2009 2010 Annual Growth Rates (%) Taux de croissance annuel (%) All Item 3.3 -3.5 0.8 3.3 0.7 4.6 10.4 -2.6 3.6 Ensemble Food ... -5.0 1.8 3.4 0.4 5.9 16.2 -3.8 8.3 Alimentation Health ... 3.2 -1.2 1.0 7.7 1.6 1.6 1.7 1.4 Santé Energy ... -2.8 1.7 0.2 3.8 5.5 8.9 0.1 -1.1 Energie Transport ... 0.1 1.4 15.2 3.6 -2.9 6.1 -4.7 0.7 Transport IV AGRICULTURAL PRODUCTION - PRODUCTION AGRICOLE 2002 2003 2004 2005 2006 2007 2008 2009 2010 Tons (Thousand) Tonnes (milliers) Rice, Tons (thousands) ... 88 89 98 106 131 149 ... ... Riz, tonnes (milliers) Cashew nuts, Tons (thousands) ... 81 81 81 81 81 81 ... ... Noix de cajou, tonnes (milliers) Palm nuts, Tons (thousands) ... 80 82 84 80 80 80 ... ... Noix de palme, tonnes (milliers) Coconuts, Tons (thousands) ... 46 46 46 46 46 46 ... ... Noix de coco, tonnes (milliers) Millet, Tons (thousands) ... 17 18 26 28 26 31 ... ... Mil, tonnes (milliers) V MINING PRODUCTION - PRODUCTION MINIERE 197 2002 2003 2004 2005 2006 2007 2008 2009 2010 ... ... ... ... ... ... ... ... ... ... ... ... ... ... ... ... ... ... ... ... ... ... ... ... ... ... ... VI ENERGY - ENERGIE 2002 2003 2004 2005 2006 2007 2008 2009 2010 Electricity - total hydro production, Électricité - production hydraulique ... 0.0 0.0 0.0 0.0 0.0 0.0 ... ... kilowatt hours (millions) totale, kilowatt-heures (millions) Electricity - total thermal production, Électricité - production thermique 60.0 61.0 63.0 64.0 66.0 70.0 ... ... ... kilowatt hours (millions) totale, kilowatt-heures (millions) Electricity - total production, self- Electricité - Production totale privée 5 5 5 5 6 7 ... ... ... producer (Million Kilowatt Hours) (million de kilowatt heures) Electricity - total production, public Electricité - Production totale 55 56 58 59 60 63 ... ... ... (Million Kilowatt Hours) publique (million de kilowatt heures) African Statistical Yearbook 2011 / Annuaire Statistique pour l'Afrique 2011
  • 199.
    Guinea-Bissau Guinée-Bissau VII TOURISM AND INFRASTRUCTURE - TOURISME ET INFRASTUCTURE 2002 2003 2004 2005 2006 2007 2008 2009 2010 Arrivals - Tourists (thousands) 1.302 1.003 1.456 1.685 1.746 1.815 1.829 ... ... Arrivées - touristes (milliers) Rooms in hotels and similar Chambres d'hotels et établissements establishments (thousands) ... ... 4 3.729 3.718 3.724 3.724 ... ... assimilés (milliers) Paved Road (% of total) 38 38 38 38 38 38 38 38 ... Routes asphaltées (% du total) Total Network (Railways-km) 2 755 2 755 2 755 2 755 2 755 2 755 2 755 2 755 ... Réseau total voies ferrées-Km Main Telephone Lines (per 1,000 Lignes téléphoniques fixes (pour 1 8 1 1 1 1 1 ... ... inhabitants) 1000 habitants) Mobile Cellular Subscribers (per Abonnés aux téléphones mobiles ... 1 5 6 22 29 29 ... ... 1,000 inhabitants) (pour 1000 habitants) VII FINANCIAL AND MONETARY STATISTICS - FINANCES ET STATISTIQUES MONETAIRES 2002 2003 2004 2005 2006 2007 2008 2009 2010 VII-1 Monetary Statistics VII-1 Statistiques monétaires CFA Franc(Millions) Franc CFA (Millions) Money supply (M1) 85 074 29 922 42 964 51 679 53 260 63 509 80 688 87 483 108 348 Masse monétaire (M1) Quasi-money 1 282 564 577 1 138 1 892 5 367 8 481 7 807 13 544 Quasi-monnaie of which Demand Deposit ... ... ... ... ... ... ... ... ... dont Monnaie scripturale Net foreign assets 53 681 11 510 32 331 35 158 43 303 51 911 66 373 82 270 80 862 Avoirs extérieurs nets Domestic credit 22 777 17 777 11 977 14 519 16 732 20 693 27 750 19 378 46 533 Crédit intérieur of which claims on private sector 4 211 2 651 2 251 3 326 6 329 10 469 18 621 22 070 31 351 dont créances sur le secteur privé of which Claims on government dont créances nettes sur le 18 566 15 126 9 726 11 193 10 403 10 224 9 129 - 2 692 15 182 sector, net gouvernement International reserves (millions of US Réserves internationales (millions de 103 33 73 80 82 113 125 169 148 $) $ EU) Average Exchange Rate (National Taux de change (moyen) (monnaie 696.99 581.20 528.29 527.47 522.89 479.27 447.81 472.19 495.28 Currency per us $) nationale par dollars) VII-2 Public Finance VII-2 Finances publiques CFA Franc(Millions) Franc CFA (Millions) Total Revenues and Grants 31 947 41 354 57 654 43 021 48 978 57 097 57 097 66 800 74 500 Recettes totales et dons Tax Revenue 11 858 20 915 20 915 20 915 20 915 20 915 20 915 18 800 29 300 Recettes fiscales Non Tax Revenue 9 789 12 239 12 239 12 239 12 239 12 239 12 239 1 010 800 15 100 Recettes non fiscales Grants 10 300 8 200 24 500 9 867 15 824 23 943 23 943 37 200 30 100 Dons 198 Total Expenditures and Net Lending 46 409 41 000 70 416 51 845 52 243 54 474 54 474 78 300 116 200 Dépenses totales et prêts nets Current expenditure 33 720 27 800 42 074 39 364 40 065 41 125 41 125 59 100 49 500 Dépenses courantes Of which Wages and Salaries 10 527 10 500 16 168 20 031 18 901 19 729 19 729 23 353 25 003 Dont rémunérations et salaires Capital expenditure 12 689 9 600 28 342 12 481 12 178 13 349 13 349 5 529 3 336 Dépenses d'équipement Net Lending 0 3 600 ... ... ... ... ... ... ... Prêts nets Fiscal Balance - 14 462 354 - 12 762 - 8 824 - 3 265 2 623 2 623 - 11 500 - 47 500 Solde global y compris les dons VII-3 Balance of Payments VII-3 Balance des paiements CFA Franc(Millions) Franc CFA (Millions) Trade balance - 3 0 - 4 - 9 - 28 - 29 - 32 - 38 - 39 Balance commerciale Services Balance - 15 - 18 - 19 - 19 - 19 - 17 - 19 - 19 - 20 Balance des services Net Income - 6 - 5 - 5 - 5 - 5 - 5 - 7 - 6 - 6 Revenus nets Current transfers, net total 23 23 36 27 30 36 44 45 44 Transferts courants Current account balance - 1 0 7 - 6 - 21 - 15 - 13 - 18 - 20 Solde du compte courant VII-4 External Debt and Financial Flows VII-4 Dette extérieure et flux financiers US $(Millions) $ E.U(Millions) Total external debt 941 1 013 1 024 1 029 1 025 1 031 1 040 1 064 160 Dette extérieure totale Private 1 1 1 1 1 1 1 0 0 Privée Public 941 1 013 1 023 1 028 1 024 1 031 1 039 1 064 160 Publique Total external debt service 3 6 6 4 5 6 4 11 930 Service de la dette extérieure Net Foreign Direct Investment Investissements étranger direct 4 3 9 8 17 19 6 14 ... Inflows (flux nets entrants) Net Total Official Development Aide publique au développement 60 150 76 66 87 122 132 146 ... assistance (nette totale) African Statistical Yearbook 2011 / Annuaire Statistique pour l'Afrique 2011
  • 200.
    Guinea-Bissau Guinée-Bissau 2002 2003 2004 2005 2006 2007 2008 2009 2010 CFA Franc(Millions) Franc CFA Exports, fob Exportations, fàb Exports - Total ... 37 784 40 026 47 271 38 766 51 299 57 421 56 418 57 021 Exportations - Total Main Products Principaux produits Cashew nut ... 33 863 38 193 44 706 34 712 39 340 46 213 45 863 46 812 Noix de cajou Cotton ... 132 0 ... 18 ... ... ... ... Coton Woods ... 134 1 31 103 67 70 703 712 Bois ... ... ... ... ... ... ... ... ... ... ... ... ... ... ... ... ... ... Main Destinations Principales destinations India ... 19 051.0 33 025.0 29 085.0 20 002.0 34 183.0 35 351.0 34 213.0 33 512.0 Inde Singapore ... 13 201.0 5 169.0 7 057.0 8 827.0 1 204.0 1 123.0 ... 1 216.0 Singapour China ... 426.0 ... 57.0 ... 20.0 38.0 1 093.0 42.0 Chine ... ... ... ... ... ... ... ... ... ... ... ... ... ... ... ... ... ... 2002 2003 2004 2005 2006 2007 2008 2009 2010 Imports, cif Importations, cif Imports - Total 49 423 46 006 50 795 64 970 75 731 91 736 89 010 93 916 96 121 Importations - Total (millions) 199 Principaux produits Main Products Rice ... 9 033 6 719 8 849 11 024 9 395 9 769 9 876 8 963 Riz Wheat flour ... 2 640 2 494 4 059 3 616 4 214 2 251 2 376 1 731 Farine de ble Beverages ... 2 966 2 913 3 457 3 475 3 510 4 451 4 546 3 731 Boissons Petroleum products, refined ... 8 314 15 838 15 282 18 611 19 278 20 000 18 531 20 000 Produits petroliers raffines Construction Materials ... 4 168 3 322 3 986 4 218 3 296 3 400 3 516 4 013 Materiaux de construction Main Origin Principales provenances Senegal 8 436.0 3 860.9 6 677.8 12 440.7 15 744.8 10 815.1 11 351.0 9 321.0 11 821.0 Sénégal Portugal 3 959.3 2 606.7 3 265.4 2 320.5 2 428.3 2 369.2 3 251.0 2 132.0 3 031.0 Portugal China 1 805.9 5 440.6 3 246.2 1 208.4 1 075.1 1 294.9 1 278.0 1 233.0 900.0 Chine France 1 149.5 1 946.4 183.3 132.7 1 025.3 987.3 ... ... ... France India 1 127.2 1 062.3 985.3 271.1 1 314.0 1 425.2 70.0 1 426.0 1 236.0 Inde African Statistical Yearbook 2011 / Annuaire Statistique pour l'Afrique 2011
  • 201.
    Kenya Kenya AREA (KM 2) 592 909 SUPERFICIE (KM 2) CAPITAL CITY Nairobi Nairobi CAPITALE CURRENCY Kenyan Shilling Shilling Kenyan MONNAIE I SOCIAL AND DEMOGRAPHIC INDICATORS — INDICATEURS DEMOGRAPHIQUES ET SOCIAUX 2002 2003 2004 2005 2006 2007 2008 2009 2010 Population Population Population au milieu de l'année - Mid-year population - Total (Million) 32.2 33.2 34.2 35.1 36.1 37.2 38.3 39.4 ... Total (million) Population au milieu de l'année - Mid-year population - Urban (%) ... ... 20.0 21.0 21.0 21.0 21.0 21.9 ... Urbaine (%) Female (%) 51.2 51.1 51.1 51.1 51.1 51.0 51.0 51.0 ... Femme (%) Population by Age Group Population par groupe d'âge 0-14 13913 049 14264 820 14621 692 15102 744 15583 450 16068 793 16560 630 17060 465 ... 0-14 15-64 17339 878 17905 339 18524 048 18969 778 19456 658 19984 087 20553 986 21167 534 ... 15-64 65+ 969 607 1001 329 1033 604 1066 122 1098 636 1131 044 1163 240 1195 265 ... 65+ Active Population (000) ... ... ... ... 14 600.0 ... ... ... ... Population active (000) Female (%) ... ... ... ... 49.3 46.4 46.4 46.4 ... Femme (%) Taux brut de natalité - Total (par Crude birth rate - Total (per 1000) 38.7 37.5 39.1 39.2 39.2 39.0 34.8 38.4 ... 1000) Taux brut de mortalité - Total (par Crude death rate - Total (per 1000) 12.7 12.8 12.7 12.5 12.3 12.0 11.6 11.3 ... 1000) Life expectancy at birth - Total Espérance de vie à la naissance - 52.0 51.9 52.1 52.5 53.0 53.6 54.3 54.9 ... (years) Total (années) Net reproduction rate - (per Taux net de reproduction - (par ... ... ... 1.9 ... ... ... ... ... woman) femme) Indice synthétique de fécondité - Total fertility rate - (p woman) y (per ) 5.0 4.9 5.0 5.0 5.0 5.0 4.6 4.9 ... (par femme) Education Enseignement Teaching staff at first level - Total Personnel enseignant - 1er degré - 178.04 178.6 178.2 171.0 163.0 173.2 170.1 171.3 ... (thousands) Total (milliers) Teaching staff at second level - Total Personnel enseignant - 2ème degré - 200 45.99 46.4 47.6 47.4 42.4 44.3 43.0 48.1 ... (thousands) Total (milliers) Teaching staff at third level - Total Personnel enseignant - 3ème degré - 2.0 1.9 1.9 2.0 2.1 2.7 2.8 ... ... (thousands) Total (milliers) First level student enrollment - Total Elèves inscrits - 1er degré - Total 6 063 7 160 7 395 7 597 7 632 8 330 8 564 8 831 ... (thousands) (milliers) First level student enrollment - Elèves inscrits - 1er degré - Femmes 2 375 2 820 2 861 3 689 3 736 4 069 4 201 4 322 ... Female (thousands) (milliers) Second level student enrollment - Elèves inscrits - 2ème degré - Total 779 869 926 934 1 030 1 180 1 382 1 508 ... Total (thousands) (milliers) Second level student enrollment - Elèves inscrits - 2ème degré - 367 411 439 440 484 541 636 699 ... Female (thousands) Femmes (milliers) Third level student enrollment - Total Elèves inscrits - 3ème degré - Total 98.1 ... 108.4 92.0 112.0 118.0 123.0 178.0 ... (thousands) (milliers) Third level student enrollment - Elèves inscrits - 3ème degré - 34.2 ... 40.6 33.5 43.9 47.5 49.3 67.4 ... Female (thousands) Femmes (milliers) Public expenditure on education (% Dépenses publiques consacrées à ... 22.1 29.2 17.9 21.5 19.2 21.4 18.9 ... of budget) l'enseignement (% du budget) Health Santé Hospital beds - Total (per 10 000 Nombre de lits d'hôpitaux - Total 19 19 19 19 ... ... ... ... ... population) (pour 10 000) Nurses - Total (per 10 000 Nombre d'infirmières - Total (pour 12 12 12 12 12 ... ... ... ... population) 10 000) Physicians - Total (per 10 000 Nombre de médecins - Total (pour 2 2 2 2 2 2 3 4 ... population) 10 000) Public expenditure on Health (% of Dépenses publiques consacrées à la 9 8 9 10 10 ... ... ... ... budget) santé (% du budget) African Statistical Yearbook 2011 / Annuaire Statistique pour l'Afrique 2011
  • 202.
    Kenya Kenya II NATIONAL ACCOUNTS — COMPTES NATIONAUX 2002 2003 2004 2005 2006 2007 2008 2009 2010 Gross domestic product by kind of economic activity at current prices Produit intérieur brut par branche d'activité économique aux prix courants Kenyan Shilling (Millions) Shilling Kenyan (Millions) Agriculture 266 622 292 050 317 677 343 212 386 401 404 184 480 205 565 293 ... Agriculture Mining and quarrying 4 545 5 936 6 174 6 803 7 884 12 904 14 930 12 426 ... Industries extractives Manufacturing 101 710 109 884 127 441 149 162 166 777 190 497 203 999 216 833 ... Industries manufacturières Electricity, gas & water 20 812 23 330 24 810 28 766 28 477 26 173 44 992 54 037 ... Electricité, gaz et eau Construction 32 373 37 669 48 079 56 121 63 928 69 556 80 407 99 013 ... Bâtiments et travaux publics Wholesale & retail trade, Commerce de gros et de détail, 103 437 109 294 133 438 149 830 175 781 207 221 235 200 267 490 ... restaurants, hotels restaurants et hôtels Banques, assurances, affaires Finance, insurance, real estate, etc. 99 343 116 237 125 727 145 524 171 993 194 093 216 959 223 807 ... immobilières Transport and communications 99 306 104 684 117 045 128 879 152 267 184 291 205 128 246 551 ... Transport(s) et communications Administrations publiques et Public administration and defense 45 730 46 433 53 672 64 178 86 973 106 862 106 110 103 184 ... défense Other services 150 576 170 652 187 834 200 666 219 033 239 508 263 949 288 084 ... Autres services Moins Services d’intermédiation Less Imputed Service Charges - 9 070 - 10 111 - 9 052 - 11 514 - 15 376 - 20 074 - 18 231 - 28 232 ... financière Gross domestic product at factor Produit intérieur brut aux couts des 915 384 1 006 057 1 132 844 1 261 625 1 444 139 1 615 214 1 833 646 2 048 485 ... cost / basic prices facteurs / prix de base Plus: Indirect Taxes / taxes on Plus taxes indirectes/impôts sur les 116 460 125 721 141 478 154 197 178 453 213 574 243 787 225 200 ... products, less subsidies produits, moins les subventions Expenditure on Gross domestic product at current purchaser's values Emploi du produit intérieur brut aux prix courants d'acquisition Kenyan Shilling (Millions) Shilling Kenyan (Millions) Consommation finale des Government final consumption 176 821 205 207 227 596 246 056 285 056 327 918 346 769 369 741 ... administrations publiques Private final consumption 768 686 809 196 929 065 1 059 083 1 220 276 1 352 253 1 603 362 1 715 602 ... Consommation finale privée Gross fixed capital formation 178 466 179 254 207 196 264 728 309 592 355 090 409 597 456 771 ... Formation brute de capital fixe Increase in inventories - 21 713 7 305 10 565 - 25 282 - 18 383 - 6 240 13 022 18 105 ... Variation des stocks Exports of goods and services 244 468 270 118 335 743 395 208 439 906 490 987 584 504 575 253 ... Exportations de biens et services Moins importations de biens et 201 Less imports of goods and services 314 884 339 301 435 844 523 970 613 856 691 220 879 821 861 788 ... services GDP at purchasers' values 1 031 844 1 131 778 1 274 322 1 415 823 1 622 591 1 828 788 2 077 433 2 273 685 ... PIB aux prix d'acquisition Gross domestic product by kind of economic activity at constant Produit intérieur brut par branche d'activité economique aux prix constants prices Annual Growth Rates (%) Taux de croissance annuel (%) Agriculture -3.5 2.4 1.7 6.9 4.4 2.1 -5.0 -1.4 5.6 Agriculture Mining and quarrying 2.5 3.5 -0.4 2.7 4.1 12.9 3.2 -4.5 11.5 Industries extractives Manufacturing 0.1 6.0 4.5 4.7 6.3 6.5 3.8 1.6 7.8 Industries manufacturières Electricity, gas & water 20.7 14.0 3.0 -0.1 -1.4 9.1 5.2 -2.9 12.6 Electricité, gaz et eau Construction -1.9 1.0 4.4 7.5 6.3 6.9 8.3 14.5 12.5 Bâtiments et travaux publics Wholesale & retail trade, Commerce de gros et de -1.7 -1.1 11.4 6.5 12.0 12.1 -0.5 4.7 4.4 restaurants, hotels détail,restaurants et hôtels Banques, assurances, affaires Finance, insurance, real estate, etc. 1.1 2.0 2.4 4.2 4.2 4.8 3.4 3.5 6.9 immobilières Transport and communications 9.0 3.5 7.0 9.0 11.4 15.1 3.1 6.4 3.2 Transport(s) et communications Administrations publiques et Public administartion and defense -0.1 0.6 0.2 -1.3 -1.6 -2.0 0.6 1.6 0.7 défense Other services 2.8 5.2 2.8 1.9 2.1 3.5 4.5 4.5 3.3 Autres services Moins Services d’intérmediation Less Imputed Service Charges -9.4 -3.3 4.7 4.3 5.1 2.7 -7.5 13.4 25.5 financière Gross domestic product at factor Produit intérieur brut aux couts des 0.7 3.1 3.9 5.2 5.6 6.2 0.9 2.7 5.2 cost / basic prices facteurs / prix de base Plus: Indirect Taxes / taxes on Plus taxes indirectes/impôts sur les -0.7 1.3 14.8 11.0 11.2 13.4 6.7 1.0 6.3 products, less subsidies produits, moins les subventions Gross domestic product at market Produit intérieur brut aux prix du 0.5 2.9 5.1 5.9 6.3 7.1 1.7 2.5 5.4 prices marché 2009: semi-final 2010:Estimated 2009: semi-définitif 2010:Estimée African Statistical Yearbook 2011 / Annuaire Statistique pour l'Afrique 2011
  • 203.
    Kenya Kenya Expenditure on Gross domestic product at constant purchasers' Emplois du produit intérieur brut aux prix constants d'acquisition values Annual Growth Rates (%) Taux de croissance annuel (%) Consommation finale des Government final consumption 1.7 6.0 0.6 -0.8 2.2 3.6 2.3 5.5 ... administrations publiques Private final consumption -1.7 -1.6 5.9 8.3 9.8 7.5 -0.6 3.5 ... Consommation finale privée Gross fixed capital formation -6.1 -8.0 7.3 27.8 18.5 13.6 9.5 0.6 ... Formation brute de capital fixe Exports of goods and services 7.1 7.2 12.6 9.4 3.1 6.6 7.5 -7.0 ... Exportations de biens et services Moins importations de biens et Less imports of goods and services -11.4 -0.1 12.3 14.9 17.8 11.1 6.6 -0.2 ... services III INFLATION 2002 2003 2004 2005 2006 2007 2008 2009 2010 Annual Growth Rates (%) Taux de croissance annuel (%) All Item 2.0 9.8 11.6 10.3 14.5 9.8 26.2 19.6 5.4 Ensemble Food 1.4 15.5 15.5 12.5 20.9 12.3 35.2 26.4 8.5 Alimentation Health 5.3 7.4 3.5 4.8 4.2 4.3 10.7 14.7 4.5 Santé Energy 3.3 5.7 14.7 21.4 12.9 8.4 21.5 -1.5 4.4 Energie Transport 0.8 6.5 21.5 6.1 7.4 5.5 18.1 2.6 8.4 Transport IV AGRICULTURAL PRODUCTION - PRODUCTION AGRICOLE 2002 2003 2004 2005 2006 2007 2008 2009 2010 Tons (Thousand) Tonnes (milliers) Maize, Tons (thousands) 2 340 2 520 2 610 2 907 3 114 2 925 2 340 2 439 ... Maïs, tonnes (milliers) Tea, Tons (thousands) 287 294 325 329 311 370 346 314 ... Thé, tonnes (milliers) Sugar cane, Tons (thousands) 4 501 4 204 4 661 4 801 4 933 5 204 5 112 5 611 ... Canne à sucre, tonnes (milliers) Coffee green, Tons (thousands) 46 61 50 48 51 52 39 49 ... Café, tonnes (milliers) Wheat, Tons (thousands) 60 76 88 129 106 113 86 129 ... Blé, tonnes (milliers) V MINING PRODUCTION - PRODUCTION MINIERE 202 2002 2003 2004 2005 2006 2007 2008 2009 2010 Carbonate de soude, tonnes Soda Ash, Tons (thousands) 304.1 352.6 353.8 360.2 374.2 386.6 502.8 ... ... (milliers) Flourspar, Tons (thousands) 85.0 80.2 118.0 109.6 132.0 85.1 130.1 ... ... Spath fluor, tonnes (milliers) Minerai d'or et concentrés Gold (Kilograms) 1 477.0 1 543.0 567.0 616.0 432.0 3 023.0 343.0 ... ... (Kilogrammes) VI ENERGY - ENERGIE 2002 2003 2004 2005 2006 2007 2008 2009 2010 Electricity - total hydro production, Électricité - production hydraulique 1 477.0 1 543.0 567.0 616.0 432.0 3 023.0 343.0 1 100.0 ... kilowatt hours (millions) totale, kilowatt-heures (millions) Electricity - total thermal production, Électricité - production thermique 2 490.0 1 900.0 2 000.0 2 720.0 3 090.0 2 740.0 3 320.0 4 630.0 ... kilowatt hours (millions) totale, kilowatt-heures (millions) Electricity - total production, self- Electricité - Production totale privée 4 685 4 851 5 194 5 547 5 895 6 325 6 456 6 469 ... producer (Million Kilowatt Hours) (million de kilowatt heures) Electricity - total production, public Electricité - Production totale 6 550 7 080 6 100 5 480 5 130 5 680 5 060 3 260 ... (Million Kilowatt Hours) publique (million de kilowatt heures) African Statistical Yearbook 2011 / Annuaire Statistique pour l'Afrique 2011
  • 204.
    Kenya Kenya VII TOURISM AND INFRASTRUCTURE - TOURISME ET INFRASTUCTURE 2002 2003 2004 2005 2006 2007 2008 2009 2010 Arrivals - Tourists (thousands) 1.00128 1.146102 1.3607 1.479 1.600541 1.816957 1.203224 1.49 ... Arrivées - touristes (milliers) Rooms in hotels and similar Chambres d'hotels et établissements establishments (thousands) 4.416 4.336 5.568 6.063 7.202 8.289 8.148 10.335385 ... assimilés (milliers) Paved Road (% of total) 14 14 14 14 14 14 14 14 ... Routes asphaltées (% du total) Total Network (Railways-km) 65 878 65 878 66 169 66 169 66 169 66 172 66 172 66 945 ... Réseau total voies ferrées-Km Main Telephone Lines (per 1,000 Lignes téléphoniques fixes (pour 10 10 9 9 9 7 6 6 ... inhabitants) 1000 habitants) Mobile Cellular Subscribers (per Abonnés aux téléphones mobiles 36 47 73 129 200 301 421 ... ... 1,000 inhabitants) (pour 1000 habitants) VII FINANCIAL AND MONETARY STATISTICS - FINANCES ET STATISTIQUES MONETAIRES 2002 2003 2004 2005 2006 2007 2008 2009 2010 VII-1 Monetary Statistics VII-1 Statistiques monétaires Kenyan Shilling (Millions) Shilling Kenyan (Millions) Money supply (M1) 170 331 219 515 253 322 274 901 344 958 444 662 523 836 528 382 654 964 Masse monétaire (M1) Quasi-money 224 743 222 092 247 786 275 731 299 258 331 042 372 685 515 682 594 234 Quasi-monnaie of which Demand Deposit ... ... ... ... ... ... ... ... ... dont Monnaie scripturale Net foreign assets 103 316 123 019 140 580 182 836 206 968 255 265 257 587 242 660 276 124 Avoirs extérieurs nets Domestic credit 403 574 441 100 501 826 528 927 595 905 668 920 841 819 1 018 810 1 258 190 Crédit intérieur of which claims on private sector 267 692 284 707 347 733 372 008 426 190 495 778 630 215 716 541 848 802 dont créances sur le secteur privé of which Claims on government dont créances nettes sur le 106 229 124 613 114 655 111 478 123 999 129 199 154 368 228 125 336 053 sector, net gouvernement International reserves (millions of US Réserves internationales (millions de 1 068 1 482 1 519 1 799 2 416 3 355 2 879 3 849 4 326 $) $ EU) Average Exchange Rate (National Taux de change (moyen) (monnaie 78.75 75.94 79.17 75.55 72.10 67.32 69.18 77.35 79.23 Currency per us $) nationale par dollars) VII-2 Public Finance VII-2 Finances publiques Kenyan Shilling (Millions) Shilling Kenyan (Millions) Total Revenues and Grants 210 785 228 163 270 920 303 845 329 486 387 483 468 234 531 472 612 561 Recettes totales et dons Tax Revenue 175 215 196 061 217 776 264 763 288 669 346 563 408 445 459 368 532 540 Recettes fiscales Non Tax Revenue 13 211 14 009 23 894 21 060 20 747 25 426 33 085 42 728 44 714 Recettes non fiscales Grants 22 360 18 093 29 250 18 022 20 070 15 494 26 704 29 375 35 308 Dons 203 Total Expenditures and Net Lending 224 250 262 303 295 588 298 382 355 199 415 221 569 392 594 940 787 174 Dépenses totales et prêts nets Current expenditure 200 990 229 718 268 749 259 848 303 180 339 779 417 381 461 298 561 664 Dépenses courantes Of which Wages and Salaries 110 418 105 961 131 673 116 542 135 924 145 590 167 746 183 122 208 763 Dont rémunérations et salaires Capital expenditure 22 236 31 946 25 984 38 278 50 626 73 527 105 767 124 608 218 785 Dépenses d'équipement Net Lending 1 024 639 856 256 1 392 1 915 46 244 9 035 6 725 Prêts nets Fiscal Balance - 13 464 - 34 140 - 24 668 5 463 - 25 713 - 27 738 - 101 158 - 63 468 - 174 613 Solde global y compris les dons VII-3 Balance of Payments VII-3 Balance des paiements Kenyan Shilling (Millions) Shilling Kenyan (Millions) Trade balance - 78 514 - 86 764 - 128 633 - 161 651 - 234 562 - 286 506 - 390 783 - 386 055 ... Balance commerciale Services Balance 27 197 38 502 48 880 56 135 74 119 84 805 95 498 88 982 ... Balance des services Net Income - 11 275 - 6 728 - 10 017 - 8 194 - 5 053 - 9 706 - 3 127 - 5 041 ... Revenus nets Current transfers, net total 53 325 66 091 79 374 94 646 128 693 141 931 161 265 177 667 ... Transferts courants Current account balance - 9 266 11 100 - 10 396 - 19 064 - 36 803 - 69 476 - 137 147 - 124 447 ... Solde du compte courant VII-4 External Debt and Financial Flows VII-4 Dette extérieure et flux financiers US $ (Millions) $ E.U (Millions) Total external debt 5 245 5 824 6 071 5 797 6 145 6 312 7 195 7 831 8 671 Dette extérieure totale Private 315 407 360 312 322 91 257 223 357 Privée Public 4 929 5 417 5 711 5 486 5 823 6 221 6 938 7 608 8 314 Publique Total external debt service 375 456 410 374 485 355 376 387 455 Service de la dette extérieure Net Foreign Direct Investment Investissements étranger direct (flux 28 82 46 21 51 729 96 141 ... Inflows nets entrants) Net Total Official Development Aide publique au développement 392 522 658 752 943 1 323 1 363 1 778 ... assistance (nette totale) African Statistical Yearbook 2011 / Annuaire Statistique pour l'Afrique 2011
  • 205.
    Kenya Kenya 2002 2003 2004 2005 2006 2007 2008 2009 2010 Kenyan Shilling (Millions) Shilling Kenyan Exports, fob Exportations, fàb Exports - Total 170 252 184 218 215 825 261 578 253 524 278 174 348 629 348 228 ... Exportations - Total Main Products Principaux produits Tea 34 376 33 005 36 072 42 373 47 349 46 784 63 812 68 766 ... Thé Cutflowers 10 382 12 866 17 668 18 338 19 547 21 094 30 698 32 574 ... Fleurs coupées Beverages and tobacco 3 545 3 312 3 177 5 533 9 160 10 760 11 118 12 919 ... Boissons et tabac Coffee, not roasted 6 541 6 287 6 944 9 061 9 138 10 425 10 126 15 309 ... Café non torréfié Sodium carbonate 2 127 2 392 5 359 5 889 3 976 5 419 13 185 8 305 ... Carbonate de sodium Main Destinations Principales destinations United Kingdom 19 500.4 21 232.6 21 588.2 23 459.2 26 696.2 28 667.4 37 880.0 38 251.0 ... Royaume-Uni Uganda 14 272.3 12 334.1 15 695.0 23 436.0 23 159.6 30 162.9 37 821.0 40 563.0 ... Ouganda Netherlands 11 013.8 14 124.4 17 088.4 18 304.2 19 602.4 21 898.1 26 072.0 26 299.0 ... Pays-Bas Tanzania 9 219.8 8 138.9 11 165.7 14 527.8 15 816.1 20 859.9 25 999.0 27 324.0 ... Tanzanie USA 3 345.3 2 738.6 4 182.3 11 980.0 20 253.5 18 775.6 20 557.0 17 368.0 ... États-Unis 2002 2003 2004 2005 2006 2007 2008 2009 2010 Imports, cif Importations, cif 204 Imports - Total 257 710 281 844 364 557 443 093 521 483 605 112 770 651 788 097 ... Importations - Total (millions) Principaux produits Main Products Crude petroleum 23 940 25 415 45 954 51 529 55 016 49 241 81 453 54 495 ... Pétrole brut Gazole, carburant diesel et autres Gas oil, diesel oil and other fuel oils 7 820 16 525 19 575 20 370 30 928 37 508 63 581 52 304 ... fuel-oils Kérosène, huile d'éclairage, de Kerosene, illuminating oil, jet fuel 7 336 12 228 16 385 16 737 15 382 22 548 33 992 25 508 ... carburéacteur Vegetables oils and fats 13 751 12 817 7 625 13 416 16 592 22 424 33 855 26 935 ... Huiles végétales et graisses Medicinal and pharmaceutical Médicaments et produits 8 678 9 728 11 652 12 536 15 413 15 948 20 776 22 994 ... products pharmaceutiques Main Origin Principales provenances United Arab Kingdom 29 059.6 31 917.8 45 044.0 62 112.0 77 529.1 89 464.3 113 810.0 89 709.0 ... Émirats Arabes Unis India 13 809.8 14 811.4 22 629.5 24 621.3 37 780.8 56 817.4 90 531.1 83 243.0 ... Inde China 6 051.7 8 022.6 12 784.7 22 967.4 29 721.3 45 672.0 63 473.6 74 524.0 ... Chine South Africa 6 863.2 23 308.6 34 653.7 42 648.3 33 933.1 35 355.4 46 691.0 70 561.0 ... Afrique du Sud Japan 17 242.1 18 610.8 24 138.1 23 067.3 29 406.8 41 128.5 44 839.6 48 857.0 ... Japon African Statistical Yearbook 2011 / Annuaire Statistique pour l'Afrique 2011
  • 206.
    Lesotho Lesotho AREA (KM 2) 30 355 SUPERFICIE (KM 2) CAPITAL CITY Maseru Maseru CAPITALE CURRENCY Loti Loti MONNAIE I SOCIAL AND DEMOGRAPHIC INDICATORS — INDICATEURS DEMOGRAPHIQUES ET SOCIAUX 2002 2003 2004 2005 2006 2007 2008 2009 2010 Population Population Population au milieu de l'année - Mid-year population - Total (Million) 1.9 2.0 2.0 2.0 1.9 1.9 1.9 1.9 ... Total (million) Population au milieu de l'année - Mid-year population - Urban (%) ... ... 23.0 23.0 22.8 23.4 23.9 24.4 ... Urbaine (%) Female (%) 53.2 53.1 53.1 53.0 51.4 51.4 51.5 51.6 ... Femme (%) Population by Age Group Population par groupe d'âge 0-14 797 946 799 226 800 093 800 816 638 808 634 236 647 870 653 184 659 093 0-14 15-64 1047 662 1065 350 1082 328 1099 256 1129 861 1129 972 1130 111 1130 102 1129 840 15-64 65+ 91 766 93 015 94 111 95 087 109 220 107 231 105 614 104 193 102 987 65+ Active Population (000) 825.0 835.0 844.0 853.0 862.0 866.0 875.0 885.0 ... Population active (000) Female (%) 52.6 53.5 52.7 52.8 41.1 52.4 44.6 52.4 ... Femme (%) Taux brut de natalité - Total (par Crude birth rate - Total (per 1000) 31.6 36.9 36.7 30.1 30.7 30.7 30.7 30.6 30.5 1000) Taux brut de mortalité - Total (par Crude death rate - Total (per 1000) 15.9 16.5 16.9 17.1 23.3 23.1 22.7 22.3 22.0 1000) Life expectancy at birth - Total Espérance de vie à la naissance - 47.2 46.0 45.2 44.8 41.0 41.3 41.6 41.8 41.8 (years) Total (années) Net reproduction rate - (per Taux net de reproduction - (par ... ... ... 1.2 ... ... ... ... ... woman) femme) Indice synthétique de fécondité - Total fertility rate - (p woman) y (per ) 3.9 3.8 3.7 3.6 3.5 3.5 3.4 3.4 3.4 (par femme) Education Enseignement Teaching staff at first level - Total Personnel enseignant - 1er degré - 8.91 9.3 9.7 10.2 10.4 10.8 11.3 ... ... (thousands) Total (milliers) Teaching staff at second level - Total Personnel enseignant - 2ème degré - ... 3.5 3.5 3.5 3.7 4.0 4.1 ... ... 205 (thousands) Total (milliers) Teaching staff at third level - Total Personnel enseignant - 3ème degré - 0.3 0.2 0.1 0.3 ... ... ... ... ... (thousands) Total (milliers) First level student enrollment - Total Elèves inscrits - 1er degré - Total 419 430 427 422 425 401 395 ... ... (thousands) (milliers) First level student enrollment - Elèves inscrits - 1er degré - Femmes 210 215 212 210 211 198 195 ... ... Female (thousands) (milliers) Second level student enrollment - Elèves inscrits - 2ème degré - Total 81 83 88 93 95 98 99 ... ... Total (thousands) (milliers) Second level student enrollment - Elèves inscrits - 2ème degré - 46 46 49 52 53 56 56 ... ... Female (thousands) Femmes (milliers) Third level student enrollment - Total Elèves inscrits - 3ème degré - Total 5.0 6.1 ... 7.9 8.5 ... ... ... ... (thousands) (milliers) Third level student enrollment - Elèves inscrits - 3ème degré - 2.9 3.7 ... 4.5 4.7 ... ... ... ... Female (thousands) Femmes (milliers) Public expenditure on education (% Dépenses publiques consacrées à ... ... 29.9 20.8 20.0 17.8 16.6 19.1 ... of budget) l'enseignement (% du budget) Health Santé Hospital beds - Total (per 10 000 Nombre de lits d'hôpitaux - Total ... 58 ... ... ... ... ... ... ... population) (pour 10 000) Nurses - Total (per 10 000 Nombre d'infirmières - Total (pour 920 1 014 1 020 1 201 1 185 1 223 ... ... ... population) 10 000) Physicians - Total (per 10 000 Nombre de médecins - Total (pour ... 5 ... ... ... ... ... ... ... population) 10 000) Public expenditure on Health (% of Dépenses publiques consacrées à la 7 8 14 8 8 11 11 13 ... budget) santé (% du budget) African Statistical Yearbook 2011 / Annuaire Statistique pour l'Afrique 2011
  • 207.
    Lesotho Lesotho II NATIONAL ACCOUNTS — COMPTES NATIONAUX 2002 2003 2004 2005 2006 2007 2008 2009 2010 Gross domestic product by kind of economic activity at current prices Produit intérieur brut par branche d'activité économique aux prix courants Loti (Millions) Loti(Millions) Agriculture 650 671 702 721 709 791 952 1 131 1 217 Agriculture Mining and quarrying 13 44 68 301 420 820 1 152 960 956 Industries extractives Manufacturing 1 452 1 432 1 603 1 550 1 888 1 948 2 356 2 150 2 180 Industries manufacturières Electricity, gas & water 304 315 336 413 459 477 516 561 601 Electricité, gaz et eau Construction 420 438 365 383 410 451 527 637 704 Bâtiments et travaux publics Wholesale & retail trade, Commerce de gros et de détail, 540 584 630 706 817 922 1 122 1 107 1 143 restaurants, hotels restaurants et hôtels Banques, assurances, affaires Finance, insurance, real estate, etc. 1 358 1 444 1 490 1 571 1 759 2 068 2 460 2 731 2 911 immobilières Transport and communications 337 343 425 520 580 656 747 832 885 Transport(s) et communications Administrations publiques et Public administration and defense 690 759 866 936 1 015 1 136 1 354 1 817 1 950 défense Other services 765 812 883 959 1 028 1 200 1 410 1 881 2 021 Autres services Moins Services d’intermédiation Less Imputed Service Charges - 85 - 90 - 67 - 59 - 90 - 170 - 270 - 304 - 324 financière Gross domestic product at factor Produit intérieur brut aux couts des 6 445 6 751 7 301 8 001 8 995 10 298 12 325 13 502 14 244 cost / basic prices facteurs / prix de base Plus: Indirect Taxes / taxes on Plus taxes indirectes/impôts sur les 478 581 675 617 586 842 898 1 075 1 154 products, less subsidies produits, moins les subventions Expenditure on Gross domestic product at current purchaser's values Emploi du produit intérieur brut aux prix courants d'acquisition Loti (Millions) Loti(Millions) Consommation finale des Government final consumption 2 548 2 725 2 840 3 193 3 431 4 038 5 017 5 927 5 901 administrations publiques Private final consumption 7 653 8 305 8 832 9 571 10 185 11 133 12 385 14 165 15 315 Consommation finale privée Gross fixed capital formation 2 164 2 254 2 144 2 018 2 322 2 972 3 773 4 058 4 669 Formation brute de capital fixe Increase in inventories - 75 - 137 13 100 - 15 140 29 176 0 Variation des stocks Exports of goods and services 4 581 4 404 4 494 4 253 5 181 6 138 7 547 6 739 6 873 Exportations de biens et services 206 Moins importations de biens et Less imports of goods and services 9 949 10 218 10 347 10 518 11 523 13 281 15 529 16 488 17 361 services GDP at purchasers' values 6 923 7 331 7 975 8 618 9 581 11 140 13 223 14 577 15 398 PIB aux prix d'acquisition Gross domestic product by kind of economic activity at constant Produit intérieur brut par branche d'activité economique aux prix constants prices Annual Growth Rates (%) Taux de croissance annuel (%) Agriculture -29.4 3.4 -0.9 1.4 -10.3 -0.9 12.1 6.4 1.7 Agriculture Mining and quarrying 16.5 223.8 53.3 196.5 19.6 50.0 0.8 0.0 10.6 Industries extractives Manufacturing 29.5 13.1 5.9 -12.0 8.5 1.5 3.1 -5.2 3.1 Industries manufacturières Electricity, gas & water 2.4 6.1 4.0 13.9 5.1 3.5 1.7 3.2 2.9 Electricité, gaz et eau Construction -19.9 -3.9 -19.3 3.9 -1.4 3.0 7.7 10.0 5.0 Bâtiments et travaux publics Wholesale & retail trade, Commerce de gros et de 3.1 5.8 2.1 5.4 4.7 2.7 4.0 -2.2 0.0 restaurants, hotels détail,restaurants et hôtels Banques, assurances, affaires Finance, insurance, real estate, etc. 3.3 0.5 2.9 0.1 6.0 5.1 4.6 6.9 2.6 immobilières Transport and communications 11.2 4.5 8.6 13.3 11.0 11.5 10.9 11.3 3.2 Transport(s) et communications Administrations publiques et Public administartion and defense 10.3 8.3 2.6 0.9 4.8 3.4 2.9 4.2 -1.6 défense Other services 1.1 -2.1 -1.2 0.6 3.3 -2.3 -0.9 0.2 -2.2 Autres services Moins Services d’intérmediation Less Imputed Service Charges 17.3 -2.2 -13.7 -16.5 39.5 36.2 28.3 18.5 4.6 financière Gross domestic product at factor Produit intérieur brut aux couts des 1.3 4.9 2.0 1.8 4.4 3.9 4.0 2.5 1.9 cost / basic prices facteurs / prix de base Plus: Indirect Taxes / taxes on Plus taxes indirectes/impôts sur les -6.8 2.6 5.9 9.8 8.4 9.5 10.7 7.4 2.6 products, less subsidies produits, moins les subventions Gross domestic product at market Produit intérieur brut aux prix du 0.5 4.7 2.3 2.4 4.7 4.5 4.7 3.0 2.0 prices marché 2010 Estimates are projections Les estimations de 2010 sont des projections African Statistical Yearbook 2011 / Annuaire Statistique pour l'Afrique 2011
  • 208.
    Lesotho Lesotho Expenditure on Gross domestic product at constant purchasers' Emplois du produit intérieur brut aux prix constants d'acquisition values Annual Growth Rates (%) Taux de croissance annuel (%) Consommation finale des Government final consumption 11.7 1.0 -6.1 4.4 2.8 5.7 11.7 11.3 -4.1 administrations publiques Private final consumption -5.1 0.5 5.4 6.6 -1.4 0.3 3.5 3.1 0.8 Consommation finale privée Gross fixed capital formation -13.7 -2.2 -8.5 -7.6 12.2 23.0 5.9 13.9 2.5 Formation brute de capital fixe Exports of goods and services 35.1 16.8 5.4 -9.6 12.0 3.5 10.3 -5.7 4.5 Exportations de biens et services Moins importations de biens et Less imports of goods and services 4.3 2.1 1.9 -0.4 2.5 5.4 7.0 4.5 0.2 services III INFLATION 2002 2003 2004 2005 2006 2007 2008 2009 2010 Annual Growth Rates (%) Taux de croissance annuel (%) All Item 11.0 7.5 5.0 3.5 6.1 8.0 10.7 7.2 3.1 Ensemble Food 25.1 4.7 4.3 2.6 9.0 14.2 15.9 4.1 3.9 Alimentation Health 1.3 3.5 3.5 1.8 1.6 -1.3 1.1 3.1 2.2 Santé Energy 9.3 9.1 5.5 6.9 9.1 8.1 7.1 7.2 6.5 Energie Transport 8.2 7.0 6.4 7.4 4.2 3.5 10.4 6.6 1.2 Transport IV AGRICULTURAL PRODUCTION - PRODUCTION AGRICOLE 2002 2003 2004 2005 2006 2007 2008 2009 2010 Tons (Thousand) Tonnes (milliers) Maize, Tons (thousands) 85 81 79 77 60 60 57 ... ... Maïs, tonnes (milliers) Sorghum, Tons (thousands) 12 11 19 17 8 10 9 ... ... Sorgho, tonnes (milliers) Wheat, Tons (thousands) 22 16 14 8 4 4 7 ... ... Blé, tonnes (milliers) Beans, Tons (thousands) 4 5 2 5 6 3 3 ... ... Haricots, tonnes (milliers) Peas, Tons (thousands) 3 1 2 1 1 1 1 ... ... Pois, tonnes (milliers) V MINING PRODUCTION - PRODUCTION MINIERE 207 2002 2003 2004 2005 2006 2007 2008 2009 2010 Diamonds and other precious stones, Diamants et autres pierres 0.7 1.9 26.6 52.0 112.4 ... ... ... ... unworked, carat (thousands) précieuses, bruts, carat (milliers) ... ... ... ... ... ... ... ... ... ... ... ... ... ... ... ... ... ... VI ENERGY - ENERGIE 2002 2003 2004 2005 2006 2007 2008 2009 2010 Electricity - total hydro production, Électricité - production hydraulique 397.7 408.0 403.9 457.2 481.6 507.3 503.4 ... ... kilowatt hours (millions) totale, kilowatt-heures (millions) Electricity - total thermal production, Électricité - production thermique ... ... ... ... ... ... ... ... ... kilowatt hours (millions) totale, kilowatt-heures (millions) Electricity - total production, self- Electricité - Production totale privée ... ... ... ... ... ... ... ... ... producer (Million Kilowatt Hours) (million de kilowatt heures) Electricity - total production, public Electricité - Production totale 310 330 300 350 200 200 ... ... ... (Million Kilowatt Hours) publique (million de kilowatt heures) African Statistical Yearbook 2011 / Annuaire Statistique pour l'Afrique 2011
  • 209.
    Lesotho Lesotho VII TOURISM AND INFRASTRUCTURE - TOURISME ET INFRASTUCTURE 2002 2003 2004 2005 2006 2007 2008 2009 2010 Arrivals - Tourists (thousands) 287.281 360.955 303.53 303.578 356.913 300.35 293.073 343.743 ... Arrivées - touristes (milliers) Rooms in hotels and similar Chambres d'hotels et établissements establishments (thousands) ... ... 1 2.261 ... 2.105 2.254 2.429 ... assimilés (milliers) Paved Road (% of total) ... ... ... ... 25 ... ... 20 ... Routes asphaltées (% du total) Total Network (Railways-km) ... ... ... ... 5 020 ... ... 7 091 ... Réseau total voies ferrées-Km Main Telephone Lines (per 1,000 Lignes téléphoniques fixes (pour 29 35 38 39 63 53 48 41 ... inhabitants) 1000 habitants) Mobile Cellular Subscribers (per Abonnés aux téléphones mobiles 57 101 159 245 276 358 482 593 ... 1,000 inhabitants) (pour 1000 habitants) VII FINANCIAL AND MONETARY STATISTICS - FINANCES ET STATISTIQUES MONETAIRES 2002 2003 2004 2005 2006 2007 2008 2009 2010 VII-1 Monetary Statistics VII-1 Statistiques monétaires Loti (Millions) Loti(Millions) Money supply (M1) 1 441 1 538 1 592 1 832 2 689 2 991 3 877 4 179 4 989 Masse monétaire (M1) Quasi-money 727 760 784 761 819 1 091 1 006 1 568 1 589 Quasi-monnaie of which Demand Deposit ... ... ... ... ... ... ... ... ... dont Monnaie scripturale Net foreign assets 3 847 3 458 3 980 4 273 6 166 8 480 11 237 10 841 10 104 Avoirs extérieurs nets Domestic credit 747 340 - 147 - 100 - 577 - 2 071 - 2 466 - 2 136 - 1 001 Crédit intérieur of which claims on private sector 1 022 469 513 774 897 1 184 1 463 1 860 2 194 dont créances sur le secteur privé of which Claims on government dont créances nettes sur le - 318 - 167 - 712 - 910 - 1 499 - 3 324 - 3 973 - 3 996 - 3 198 sector, net gouvernement International reserves (millions of US Réserves internationales (millions de 406 460 502 519 658 ... ... ... ... $) $ EU) Average Exchange Rate (National Taux de change (moyen) (monnaie 10.54 7.56 6.46 6.36 6.77 7.05 8.26 8.47 7.32 Currency per us $) nationale par dollars) VII-2 Public Finance VII-2 Finances publiques Loti (Millions) Loti(Millions) Total Revenues and Grants 2 976 3 331 3 608 4 248 4 661 6 465 7 258 8 889 9 377 Recettes totales et dons Tax Revenue 2 325 2 576 2 993 3 643 4 061 5 852 6 444 7 759 8 068 Recettes fiscales Non Tax Revenue 462 459 509 423 429 520 622 841 682 Recettes non fiscales 208 Grants 189 296 106 183 171 92 192 289 627 Dons Total Expenditures and Net Lending 3 019 3 656 3 519 3 588 4 210 4 988 5 911 7 698 10 068 Dépenses totales et prêts nets Current expenditure 1 794 2 147 2 139 2 287 2 455 2 878 3 151 4 078 5 007 Dépenses courantes Of which Wages and Salaries 992 1 082 1 206 1 364 1 432 1 521 1 820 2 204 2 834 Dont rémunérations et salaires Capital expenditure 626 780 625 522 689 756 1 261 1 970 2 740 Dépenses d'équipement Net Lending 0 0 0 0 0 0 0 204 11 Prêts nets Fiscal Balance - 43 - 325 88 661 451 1 476 1 347 1 190 - 691 Solde global y compris les dons VII-3 Balance of Payments VII-3 Balance des paiements Loti (Millions) Loti(Millions) Trade balance - 4 250 - 3 917 - 3 827 - 4 176 - 4 192 - 5 440 - 6 281 - 7 095 - 8 597 Balance commerciale Services Balance - 215 - 262 - 155 - 323 - 239 - 232 - 360 - 320 - 213 Balance des services Net Income 1 698 1 874 1 950 1 926 2 574 3 000 4 141 3 560 2 974 Revenus nets Current transfers, net total 1 278 1 284 1 597 1 910 2 634 4 424 4 219 4 589 3 098 Transferts courants Current account balance - 1 489 - 1 022 - 436 - 663 778 1 753 1 720 734 - 2 739 Solde du compte courant VII-4 External Debt and Financial Flows VII-4 Dette extérieure et flux financiers US $ (Millions) $ E.U (Millions) Total external debt 606 669 716 614 633 673 683 702 724 Dette extérieure totale Private 0 0 0 0 0 0 0 0 0 Privée Public 606 669 716 614 633 673 683 702 724 Publique Total external debt service 47 50 51 80 41 98 34 33 39 Service de la dette extérieure Net Foreign Direct Investment Investissements étranger direct (flux 27 42 53 57 89 97 56 48 39 Inflows nets entrants) Net Total Official Development Aide publique au développement 77 79 98 67 71 129 144 123 39 assistance (nette totale) African Statistical Yearbook 2011 / Annuaire Statistique pour l'Afrique 2011
  • 210.
    Lesotho Lesotho 2002 2003 2004 2005 2006 2007 2008 2009 2010 Loti (Millions) Loti Exports, fob Exportations, fàb Exports - Total 3 740 3 557 4 533 4 138 4 737 5 664 7 184 6 455 ... Exportations - Total Main Products Principaux produits Clothing 3 339 3 116 3 238 2 708 3 223 3 385 3 521 2 971 ... Vêttements Diamonds 4 43 171 417 594 1 125 1 545 1 196 ... Diamants Television Sets 292 290 194 144 191 406 602 601 ... Ensembles Televisions Eletrical Components 1 2 2 2 90 76 389 315 ... Composants életriques Water 206 208 210 245 263 296 327 333 ... Eau Main Destinations Principales destinations United States 159.0 371.0 663.6 6.8 4 293.6 2 141.3 3 217.0 ... ... Etats-Unis South Africa 152.0 93.0 170.4 3 049.4 835.4 1 786.0 2 395.5 ... ... Afrique du Sud Belgium 3.0 5.0 96.4 ... ... ... ... ... ... Belgique Canada 25.0 8.0 5.5 ... 3.1 0.0 29.2 ... ... Canada Switzerland 0.0 0.0 27.1 ... ... ... ... ... ... Suisse 2002 2003 2004 2005 2006 2007 2008 2009 2010 Imports, cif Importations, cif Imports - Total 7 840 8 000 8 197 8 429 9 430 10 905 12 911 13 618 ... Importations - Total (millions) 209 Principaux produits Main Products Commodities not specified according 41 112 421 ... ... ... ... ... ... Produits non spécifiés selon type to kind Mineral fuels,oils,distillation products, Combustibles minéraux, huiles; 62 72 89 ... ... ... ... ... ... etc matières bitumineuses; cires etc Véhicules autres que ferroviaires, Vehicles other than railway,tramway 29 48 69 ... ... ... ... ... ... tramway Matières plastiques et ouvrages en Plastics and articles thereof 42 51 57 ... ... ... ... ... ... ces matières Cotton 41 47 50 ... ... ... ... ... ... Coton Main Origin Principales provenances South Africa 616.7 915.5 1 094.4 5 064.7 554.2 6 568.2 6 360.0 ... ... Afrique du Sud China 30.5 29.2 56.0 ... ... ... ... ... ... Chine Singapore 15.2 6.4 9.3 ... ... ... ... ... ... Singapour United States 13.8 1.8 11.7 1.2 49.5 19.1 64.4 ... ... Etats-Unis Germany 0.8 2.5 21.7 8.7 34.5 45.9 ... ... ... Allemagne African Statistical Yearbook 2011 / Annuaire Statistique pour l'Afrique 2011
  • 211.
    Liberia Libéria AREA (KM 2) 111 369 SUPERFICIE (KM 2) CAPITAL CITY Monrovia Monrovia CAPITALE CURRENCY Liberian Dollar Dollar Liberien MONNAIE I SOCIAL AND DEMOGRAPHIC INDICATORS — INDICATEURS DEMOGRAPHIQUES ET SOCIAUX 2002 2003 2004 2005 2006 2007 2008 2009 2010 Population Population Population au milieu de l'année - Mid-year population - Total (Million) 3.1 3.1 3.2 3.3 3.5 3.6 3.7 4.0 4.0 Total (million) Population au milieu de l'année - Mid-year population - Urban (%) ... ... 57.0 58.0 58.0 59.0 60.0 60.8 ... Urbaine (%) Female (%) 50.5 50.4 50.4 50.4 50.4 50.4 50.3 50.3 ... Femme (%) Population by Age Group Population par groupe d'âge 0-14 1344 648 1375 763 1408 660 1450 759 1503 941 1564 724 1628 813 1689 814 ... 0-14 15-64 1621 414 1668 430 1719 187 1782 749 1861 522 1951 472 2047 583 2142 349 ... 15-64 65+ 90 798 93 661 96 799 100 714 105 556 111 090 116 998 122 814 ... 65+ Active Population (000) 1 131.0 1 161.0 1 192.0 1 233.0 1 283.0 1 135.0 1 397.0 1 455.0 ... Population active (000) Female (%) 40.0 40.0 40.0 40.1 40.1 37.0 40.2 40.2 ... Femme (%) Taux brut de natalité - Total (par Crude birth rate - Total (per 1000) 41.4 40.8 40.3 39.8 39.3 38.8 38.3 37.8 ... 1000) Taux brut de mortalité - Total (par Crude death rate - Total (per 1000) 12.2 11.9 11.5 11.2 11.0 10.7 10.5 10.2 ... 1000) Life expectancy at birth - Total Espérance de vie à la naissance - 55.6 56.1 56.6 57.0 57.5 57.9 58.3 58.7 ... (years) Total (années) Net reproduction rate - (per Taux net de reproduction - (par ... ... ... 2.3 ... ... ... ... ... woman) femme) Indice synthétique de fécondité - Total fertility rate - (p woman) y (per ) 5.7 5.6 5.5 5.4 5.3 5.2 5.1 5.0 ... (par femme) Education Enseignement Teaching staff at first level - Total Personnel enseignant - 1er degré - ... ... ... ... ... ... ... ... ... (thousands) Total (milliers) Teaching staff at second level - Total Personnel enseignant - 2ème degré - 210 ... ... ... ... ... ... ... ... ... (thousands) Total (milliers) Teaching staff at third level - Total Personnel enseignant - 3ème degré - ... ... ... ... ... ... ... ... ... (thousands) Total (milliers) First level student enrollment - Total Elèves inscrits - 1er degré - Total ... ... ... ... ... ... ... ... ... (thousands) (milliers) First level student enrollment - Elèves inscrits - 1er degré - Femmes ... ... ... ... 254 ... 253 ... ... Female (thousands) (milliers) Second level student enrollment - Elèves inscrits - 2ème degré - Total ... ... ... ... 131 ... 158 ... ... Total (thousands) (milliers) Second level student enrollment - Elèves inscrits - 2ème degré - ... ... ... ... 55 ... 68 ... ... Female (thousands) Femmes (milliers) Third level student enrollment - Total Elèves inscrits - 3ème degré - Total ... ... ... ... ... ... ... ... ... (thousands) (milliers) Third level student enrollment - Elèves inscrits - 3ème degré - ... ... ... ... ... ... ... ... ... Female (thousands) Femmes (milliers) Public expenditure on education (% Dépenses publiques consacrées à ... ... ... ... ... ... ... ... ... of budget) l'enseignement (% du budget) Health Santé Hospital beds - Total (per 10 000 Nombre de lits d'hôpitaux - Total ... ... 18 ... ... ... ... ... ... population) (pour 10 000) Nurses - Total (per 10 000 Nombre d'infirmières - Total (pour ... ... ... ... ... ... ... ... ... population) 10 000) Physicians - Total (per 10 000 Nombre de médecins - Total (pour ... ... 3 ... ... ... ... ... ... population) 10 000) Public expenditure on Health (% of Dépenses publiques consacrées à la 4 5 10 15 10 ... ... ... ... budget) santé (% du budget) African Statistical Yearbook 2011 / Annuaire Statistique pour l'Afrique 2011
  • 212.
    Liberia Libéria II NATIONAL ACCOUNTS — COMPTES NATIONAUX 2002 2003 2004 2005 2006 2007 2008 2009 2010 Gross domestic product by kind of economic activity at current prices Produit intérieur brut par branche d'activité économique aux prix courants Liberian Dollar (Millions) Dollar Liberien(Millions) Agriculture 364 281 298 316 448 363 519 546 ... Agriculture Mining and quarrying 2 2 4 5 5 7 10 10 ... Industries extractives Manufacturing 27 15 26 32 44 49 59 62 ... Industries manufacturières Electricity, gas & water ... ... ... ... ... ... ... ... ... Electricité, gaz et eau Construction 11 8 17 19 20 21 35 37 ... Bâtiments et travaux publics Wholesale & retail trade, Commerce de gros et de détail, 54 42 61 67 77 89 67 70 ... restaurants, hotels restaurants et hôtels Banques, assurances, affaires Finance, insurance, real estate, etc. ... ... ... ... ... ... ... ... ... immobilières Transport and communications 30 28 33 39 41 43 50 52 ... Transport(s) et communications Administrations publiques et Public administration and defense 15 11 15 17 18 61 91 80 ... défense Other services ... ... ... ... ... ... ... ... ... Autres services Moins Services d’intermédiation Less Imputed Service Charges ... ... ... ... ... ... ... ... ... financière Gross domestic product at factor Produit intérieur brut aux couts des 503 387 454 495 653 632 830 857 ... cost / basic prices facteurs / prix de base Plus: Indirect Taxes / taxes on Plus taxes indirectes/impôts sur les ... ... ... ... ... ... ... ... ... products, less subsidies produits, moins les subventions Expenditure on Gross domestic product at current purchaser's values Emploi du produit intérieur brut aux prix courants d'acquisition Liberian Dollar (Millions) Dollar Liberien(Millions) Consommation finale des Government final consumption 71 34 49 57 77 95 160 129 ... administrations publiques Private final consumption 466 383 421 442 826 1 488 1 678 1 579 ... Consommation finale privée Gross fixed capital formation 25 38 62 84 134 131 166 171 ... Formation brute de capital fixe Increase in inventories ... ... ... ... ... ... ... ... ... Variation des stocks Exports of goods and services 103 131 174 194 192 185 258 251 ... Exportations de biens et services 211 Moins importations de biens et Less imports of goods and services 145 181 239 265 559 1 246 1 432 1 274 ... services GDP at purchasers' values 519 404 467 511 671 653 830 856 ... PIB aux prix d'acquisition Gross domestic product by kind of economic activity at constant Produit intérieur brut par branche d'activité economique aux prix constants prices Annual Growth Rates (%) Taux de croissance annuel (%) Agriculture 0.8 -31.8 -5.8 2.0 16.3 -8.8 20.5 6.6 ... Agriculture Mining and quarrying -22.5 -11.7 74.9 20.3 -17.5 45.4 26.6 6.5 ... Industries extractives Manufacturing 17.5 -51.0 53.9 18.4 12.8 25.0 1.7 6.5 ... Industries manufacturières Electricity, gas & water ... ... ... ... ... ... ... ... ... Electricité, gaz et eau Construction 33.0 -35.8 88.7 7.5 -13.6 18.1 40.5 6.9 ... Bâtiments et travaux publics Wholesale & retail trade, Commerce de gros et de 13.0 -31.3 29.0 5.7 -5.7 30.0 -36.5 6.5 ... restaurants, hotels détail,restaurants et hôtels Banques, assurances, affaires Finance, insurance, real estate, etc. ... ... ... ... ... ... ... ... ... immobilières Transport and communications 16.6 -17.6 4.6 13.7 -13.8 18.0 -2.2 6.5 ... Transport(s) et communications Administrations publiques et Public administartion and defense -9.8 -35.5 15.5 10.6 -11.6 205.0 35.9 6.7 ... défense Other services ... ... ... ... ... ... ... ... ... Autres services Moins Services d’intérmediation Less Imputed Service Charges ... ... ... ... ... ... ... ... ... financière Gross domestic product at factor Produit intérieur brut aux couts des 3.7 -32.1 4.0 4.9 8.3 6.9 11.2 6.6 ... cost / basic prices facteurs / prix de base Plus: Indirect Taxes / taxes on Plus taxes indirectes/impôts sur les ... ... ... ... ... ... ... ... ... products, less subsidies produits, moins les subventions Gross domestic product at market Produit intérieur brut aux prix du 3.7 -31.3 2.6 5.3 7.8 9.4 7.1 4.6 ... prices marché African Statistical Yearbook 2011 / Annuaire Statistique pour l'Afrique 2011
  • 213.
    Liberia Libéria Expenditure on Gross domestic product at constant purchasers' Emplois du produit intérieur brut aux prix constants d'acquisition values Annual Growth Rates (%) Taux de croissance annuel (%) Consommation finale des Government final consumption -1.2 -57.4 25.7 12.7 11.6 38.2 41.6 -17.9 ... administrations publiques Private final consumption 4.4 -27.5 -2.2 0.8 53.5 102.7 -5.0 -4.6 ... Consommation finale privée Gross fixed capital formation -0.7 35.9 44.3 31.2 31.1 9.4 7.1 4.6 ... Formation brute de capital fixe Exports of goods and services -11.2 11.9 18.2 7.0 -18.6 8.2 17.7 -1.3 ... Exportations de biens et services Moins importations de biens et Less imports of goods and services -8.2 10.4 16.8 6.8 72.8 150.9 -3.1 -9.8 ... services III INFLATION 2002 2003 2004 2005 2006 2007 2008 2009 2010 Annual Growth Rates (%) Taux de croissance annuel (%) All Item 14.2 10.3 3.6 6.9 7.2 11.4 17.5 7.8 7.7 Ensemble Food ... ... ... ... ... ... ... ... ... Alimentation Health ... ... ... ... ... ... ... ... ... Santé Energy ... ... ... ... ... ... ... ... ... Energie Transport ... ... ... ... ... ... ... ... ... Transport IV AGRICULTURAL PRODUCTION - PRODUCTION AGRICOLE 2002 2003 2004 2005 2006 2007 2008 2009 2010 Tons (Thousand) Tonnes (milliers) Cassava, Tons (tousands) 480 490 490 490 635 550 ... ... ... Manioc, tonnes (milliers) Rice, Tons (thousands) 110 100 110 155 107 155 ... ... ... Riz, tonnes (milliers) Banana, Tons (thousands) 110 110 110 110 116 120 ... ... ... Bananes, tonnes (milliers) Plantains, Tons (thousands) 40 42 42 42 42 43 ... ... ... Plantains, tonnes (milliers) Taro, Tons (thousands) 26 26 26 26 26 25 ... ... ... Taros, tonnes (milliers) V MINING PRODUCTION - PRODUCTION MINIERE 212 2002 2003 2004 2005 2006 2007 2008 2009 2010 Gold ores and concentrates Minerais d'or et concentrés 42.0 20.0 110.0 16.0 20.0 ... ... ... ... (Kilograms) (Kilogrammes) Diamonds and other precious stones, 48.0 36.0 30.0 30.0 30.0 13.0 ... ... ... Diamants et autres pierres unworked carat (thousands) précieuses bruts carat (milliers) Diamonds, industrial, carat 32.0 24.0 12.0 4.0 4.0 9.0 ... ... ... Diamants industriels, carat (milliers) (thousands) VI ENERGY - ENERGIE 2002 2003 2004 2005 2006 2007 2008 2009 2010 Electricity - total hydro production, Électricité - production hydraulique ... ... ... ... ... ... ... ... ... kilowatt hours (millions) totale, kilowatt-heures (millions) Electricity - total thermal production, Électricité - production thermique 320.0 320.0 330.0 338.0 351.0 353.0 ... ... ... kilowatt hours (millions) totale, kilowatt-heures (millions) Electricity - total production, self- Electricité - Production totale privée ... ... ... ... ... ... ... ... ... producer (Million Kilowatt Hours) (million de kilowatt heures) Electricity - total production, public Electricité - Production totale 320 320 330 338 351 353 ... ... ... (Million Kilowatt Hours) publique (million de kilowatt heures) African Statistical Yearbook 2011 / Annuaire Statistique pour l'Afrique 2011
  • 214.
    Liberia Libéria VII TOURISM AND INFRASTRUCTURE - TOURISME ET INFRASTUCTURE 2002 2003 2004 2005 2006 2007 2008 2009 2010 Arrivals - Tourists (thousands) 5.192 6.045 8.104 8.608 9.083 ... ... ... ... Arrivées - touristes (milliers) Rooms in hotels and similar Chambres d'hotels et établissements establishments (thousands) 0.132109 0.13651 0.148039 0.170776 0.177613 ... ... ... ... assimilés (milliers) Paved Road (% of total) ... ... ... ... ... ... ... ... ... Routes asphaltées (% du total) Total Network (Railways-km) ... ... ... ... ... ... ... ... ... Réseau total voies ferrées-Km Main Telephone Lines (per 1,000 Lignes téléphoniques fixes (pour 2 0 2 2 2 1 1 ... ... inhabitants) 1000 habitants) Mobile Cellular Subscribers (per Abonnés aux téléphones mobiles 1 15 29 48 81 112 140 ... ... 1,000 inhabitants) (pour 1000 habitants) VII FINANCIAL AND MONETARY STATISTICS - FINANCES ET STATISTIQUES MONETAIRES 2002 2003 2004 2005 2006 2007 2008 2009 2010 VII-1 Monetary Statistics VII-1 Statistiques monétaires Liberian Dollar (Millions) Dollar Liberien(Millions) Money supply (M1) 2 364 2 756 3 728 4 872 6 635 9 100 13 244 19 114 21 648 Masse monétaire (M1) Quasi-money 619 510 1 030 1 507 1 947 3 118 4 183 5 884 7 366 Quasi-monnaie of which Demand Deposit ... ... ... ... ... ... ... ... ... dont Monnaie scripturale Net foreign assets - 46 083 - 39 102 - 43 504 - 41 171 - 43 519 - 45 252 - 41 400 - 44 804 20 521 Avoirs extérieurs nets Domestic credit 61 656 52 071 59 369 59 153 65 100 72 323 76 953 89 441 30 289 Crédit intérieur of which claims on private sector 1 176 1 136 1 651 2 064 3 080 4 503 6 646 9 626 12 718 dont créances sur le secteur privé of which Claims on government dont créances nettes sur le 60 289 50 790 57 425 56 896 61 784 67 607 70 242 78 551 16 735 sector, net gouvernement International reserves (millions of US Réserves internationales (millions de 3 7 19 25 72 119 161 372 419 $) $ EU) Average Exchange Rate (National Taux de change (moyen) (monnaie 61.75 59.38 54.91 57.10 58.01 61.27 63.21 68.29 71.53 Currency per us $) nationale par dollars) VII-2 Public Finance VII-2 Finances publiques Liberian Dollar (Millions) Dollar Liberien(Millions) Total Revenues and Grants 4 490 2 820 3 794 4 591 4 966 9 099 13 071 16 041 21 052 Recettes totales et dons Tax Revenue 4 341 2 547 3 514 4 328 4 699 8 572 10 663 12 974 14 865 Recettes fiscales Non Tax Revenue 148 95 225 206 209 435 2 023 1 455 5 258 Recettes non fiscales Grants 0 178 55 57 58 92 386 1 612 930 Dons 213 Total Expenditures and Net Lending 4 947 2 660 3 893 4 356 4 258 7 530 12 465 16 997 20 187 Dépenses totales et prêts nets Current expenditure 1 192 1 063 2 905 3 329 3 162 5 312 8 166 11 383 13 634 Dépenses courantes Of which Wages and Salaries 828 659 1 493 2 415 1 885 2 488 4 298 6 241 8 148 Dont rémunérations et salaires Capital expenditure 3 341 1 211 538 605 365 1 017 1 511 2 308 2 268 Dépenses d'équipement Net Lending 0 0 0 0 0 0 0 0 0 Prêts nets Fiscal Balance - 457 160 - 99 234 708 1 569 607 - 956 866 Solde global y compris les dons VII-3 Balance of Payments VII-3 Balance des paiements Liberian Dollar (Millions) Dollar Liberien(Millions) Trade balance 21 - 31 - 132 - 183 - 243 - 291 - 370 - 383 ... Balance commerciale Services Balance 3 - 17 - 49 - 65 - 91 - 89 - 100 - 82 ... Balance des services Net Income - 107 - 78 - 87 - 113 - 168 - 154 - 156 - 167 ... Revenus nets Current transfers, net total 63 47 243 311 274 288 296 308 ... Transferts courants Current account balance - 19 - 79 - 26 - 50 - 228 - 246 - 329 - 324 ... Solde du compte courant VII-4 External Debt and Financial Flows VII-4 Dette extérieure et flux financiers US $ (Millions) $ E.U (Millions) Total external debt 4 332 4 432 4 532 4 632 4 732 3 160 1 970 1 660 150 Dette extérieure totale Private 0 0 0 0 0 0 0 0 0 Privée Public 4 332 4 432 4 532 4 632 4 732 3 160 1 970 1 660 150 Publique Total external debt service 166 167 170 160 147 148 1 301 1 648 781 Service de la dette extérieure Net Foreign Direct Investment Investissements étranger direct (flux 3 372 75 83 108 132 200 378 ... Inflows nets entrants) Net Total Official Development Aide publique au développement 55 107 213 222 260 701 1 249 505 ... assistance (nette totale) African Statistical Yearbook 2011 / Annuaire Statistique pour l'Afrique 2011
  • 215.
    Liberia Libéria 2002 2003 2004 2005 2006 2007 2008 2009 2010 US $ (Millions) Dollar Liberien Exports, fob Exportations, fàb Exports - Total 166 109 104 110 158 208 254 160 ... Exportations - Total Main Products Principaux produits Rubber 0 44 83 131 153 191 258 ... ... Caoutchouc Coffee 285 521 463 594 0 0 254 ... ... Café Iron Ore 49 0 5 1 1 1 143 ... ... Minerai de fer Scrap Metal 138 1 1 1 2 471 125 ... ... Mitraille Cocoa Beans 14 1 2 0 0 1 80 ... ... Cacao en fèves Main Destinations Principales destinations Germany 161.4 446.6 189.4 362.8 605.9 129.0 84.3 385.4 ... Allemagne Bangladesh 1 062.1 6.4 7.2 0.3 0.0 0.0 ... ... ... Bangladesh Poland 80.1 112.7 143.3 99.2 198.3 205.5 134.6 348.0 ... Pologne United States 47.6 62.0 89.3 97.1 144.4 118.4 147.6 84.7 ... États-Unis Belgium 0.9 1.9 68.3 453.0 25.6 20.6 60.5 11.9 ... Belgique 2002 2003 2004 2005 2006 2007 2008 2009 2010 Imports, cif Importations, cif 214 Imports - Total 5 033 4 285 4 913 5 716 7 579 8 811 11 668 12 893 ... Importations - Total (millions) Principaux produits Main Products Tankers 1 739 1 661 1 891 1 847 1 777 2 825 3 593 4 561 ... Tankers Cargo navires nda & autres navires Cargo vessels nes&oth vessels for 1 292 1 250 1 410 2 031 3 341 2 463 2 866 4 153 ... pour le transport de deux personnes the transport of both persons&goods et biens Floating or submersible drilling or Flottantes ou submersibles de ... 303 ... ... ... 310 1 138 ... ... forage ou de production des plates- production platforms formes Petroleum oils&oils obtained from Huiles de pétrole, bitumineux, bituminous minerals,o/than crude 27 39 81 135 185 177 444 395 ... distilles, sauf brut etc Structures et pièces de structures, i Structures&parts of structures,i/s (ex 15 4 13 3 12 13 152 216 ... / s (ex Prefab BLDGS de headg prefab bldgs of headg no.9406) no.9406) Main Origin Principales provenances Korea, Rep. 1 426.6 1 525.7 1 708.1 1 987.1 3 206.9 2 511.0 2 801.5 4 884.6 ... Corée, Rép. Singapore 371.4 481.9 538.8 743.5 976.8 1 768.1 2 627.7 1 643.0 ... Singapour Japan 897.7 633.2 925.3 1 087.8 871.6 1 190.1 1 223.0 1 486.5 ... Japon China 30.1 26.2 181.8 149.6 529.8 803.1 1 137.1 1 881.5 ... Chine Germany 261.0 385.2 186.8 101.7 107.8 269.3 270.6 100.2 ... Allemagne African Statistical Yearbook 2011 / Annuaire Statistique pour l'Afrique 2011
  • 216.
    Libyan Arab Jamahiriya Jamahiriya Arabe Libyenne AREA (KM 2) 1 759 540 SUPERFICIE (KM 2) CAPITAL CITY Tripoli Tripoli CAPITALE CURRENCY Libyan Dinar Dinar Libyen MONNAIE I SOCIAL AND DEMOGRAPHIC INDICATORS — INDICATEURS DEMOGRAPHIQUES ET SOCIAUX 2002 2003 2004 2005 2006 2007 2008 2009 2010 Population Population Population au milieu de l'année - Mid-year population - Total (Million) 5.6 5.7 5.8 5.9 6.0 6.2 6.3 6.4 6.5 Total (million) Population au milieu de l'année - Mid-year population - Urban (%) 76.6 76.7 76.9 77.0 77.2 77.3 77.5 77.7 77.9 Urbaine (%) Female (%) 48.0 48.0 48.1 48.1 48.2 48.2 48.3 48.3 48.3 Femme (%) Population by Age Group Population par groupe d'âge 0-14 1728 245 1745 692 1769 086 1796 434 1827 302 1861 568 1897 799 1934 319 1969 702 0-14 15-64 3644 958 3733 945 3818 908 3901 467 3981 777 4059 730 4136 419 4213 164 4290 969 15-64 65+ 196 169 205 173 214 706 224 931 235 954 247 699 259 963 272 442 284 948 65+ Active Population (000) 1 965.8 2 043.8 2 103.4 2 156.9 2 209.1 2 254.1 2 295.3 2 369.5 2 418.5 Population active (000) Female (%) 21.9 22.2 22.3 22.3 22.2 22.1 21.9 22.5 22.5 Femme (%) Taux brut de natalité - Total (par Crude birth rate - Total (per 1000) 22.2 22.1 23.5 23.3 23.3 23.7 23.3 23.0 ... 1000) Taux brut de mortalité - Total (par Crude death rate - Total (per 1000) 3.8 4.1 3.1 3.2 3.4 3.7 3.4 4.1 ... 1000) Life expectancy at birth - Total Espérance de vie à la naissance - 70.0 70.0 71.0 71.0 72.0 72.0 72.0 72.0 ... (years) Total (années) Net reproduction rate - (per Taux net de reproduction - (par ... ... ... 1.3 ... ... ... ... ... woman) femme) Indice synthétique de fécondité - Total fertility rate - (p woman) y (per ) 3.1 3.0 2.9 2.9 2.8 2.7 2.7 2.6 ... (par femme) Education Enseignement Teaching staff at first level - Total Personnel enseignant - 1er degré - ... ... ... 231.0 255.0 186.0 184.0 ... ... (thousands) Total (milliers) Teaching staff at second level - Total Personnel enseignant - 2ème degré - ... ... ... 69.0 76.0 56.0 55.0 ... ... 215 (thousands) Total (milliers) Teaching staff at third level - Total Personnel enseignant - 3ème degré - ... ... ... 6.0 8.0 9.0 10.0 ... ... (thousands) Total (milliers) First level student enrollment - Total Elèves inscrits - 1er degré - Total ... ... ... ... ... 1 047 1 031 ... ... (thousands) (milliers) First level student enrollment - Elèves inscrits - 1er degré - Femmes 366 355 358 346 360 513 510 ... ... Female (thousands) (milliers) Second level student enrollment - Elèves inscrits - 2ème degré - Total 825 798 ... 702 733 ... 207 ... ... Total (thousands) (milliers) Second level student enrollment - Elèves inscrits - 2ème degré - 417 403 ... 374 388 ... 113 ... ... Female (thousands) Femmes (milliers) Third level student enrollment - Total Elèves inscrits - 3ème degré - Total 359.1 375.0 ... ... ... ... ... ... ... (thousands) (milliers) Third level student enrollment - Elèves inscrits - 3ème degré - 184.6 192.7 ... ... ... ... ... ... ... Female (thousands) Femmes (milliers) Public expenditure on education (% Dépenses publiques consacrées à ... ... ... ... ... ... ... ... ... of budget) l'enseignement (% du budget) Health Santé Hospital beds - Total (per 10 000 Nombre de lits d'hôpitaux - Total ... ... ... ... ... ... ... ... ... population) (pour 10 000) Nurses - Total (per 10 000 Nombre d'infirmières - Total (pour 37 37 37 37 37 37 38 38 ... population) 10 000) Physicians - Total (per 10 000 Nombre de médecins - Total (pour 46 60 59 62 61 60 69 68 ... population) 10 000) Public expenditure on Health (% of Dépenses publiques consacrées à la 15 9 5 5 5 ... ... ... ... budget) santé (% du budget) African Statistical Yearbook 2011 / Annuaire Statistique pour l'Afrique 2011
  • 217.
    Libyan Arab Jamahiriya Jamahiriya Arabe Libyenne II NATIONAL ACCOUNTS — COMPTES NATIONAUX 2002 2003 2004 2005 2006 2007 2008 2009 2010 Gross domestic product by kind of economic activity at current prices Produit intérieur brut par branche d'activité économique aux prix courants Libyan Dinar (Millions) Dinar Libyen(Millions) Agriculture 1 295 1 333 1 329 1 448 1 643 1 905 2 248 2 383 ... Agriculture Mining and quarrying 14 384 20 218 29 278 44 122 53 953 62 397 81 277 47 231 ... Industries extractives Manufacturing 1 479 1 992 2 452 3 125 3 603 4 032 4 889 5 448 ... Industries manufacturières Electricity, gas & water 662 755 734 877 973 1 019 1 205 1 335 ... Electricité, gaz et eau Construction 1 935 1 787 2 159 2 684 3 129 4 198 5 995 7 578 ... Bâtiments et travaux publics Wholesale & retail trade, Commerce de gros et de détail, 1 771 1 876 2 195 2 658 2 863 3 396 3 950 4 298 ... restaurants, hotels restaurants et hôtels Banques, assurances, affaires Finance, insurance, real estate, etc. 4 443 4 456 4 625 5 041 5 460 6 200 6 805 7 337 ... immobilières Transport and communications 1 550 1 812 1 944 2 413 2 724 3 300 3 884 4 126 ... Transport(s) et communications Administrations publiques et Public administration and defense 2 905 3 279 3 659 4 482 4 935 6 507 6 671 6 871 ... défense Other services 218 218 226 241 279 322 360 390 ... Autres services Moins Services d’intermédiation Less Imputed Service Charges - 311 - 364 - 441 - 470 - 533 - 364 - 643 - 706 ... financière Gross domestic product at factor Produit intérieur brut aux couts des 30 331 37 361 48 159 66 619 79 030 92 913 116 640 86 289 ... cost / basic prices facteurs / prix de base Plus: Indirect Taxes / taxes on Plus taxes indirectes/impôts sur les ... ... ... ... ... ... ... ... ... products, less subsidies produits, moins les subventions Expenditure on Gross domestic product at current purchaser's values Emploi du produit intérieur brut aux prix courants d'acquisition Libyan Dinar (Millions) Dinar Libyen(Millions) Consommation finale des Government final consumption 4 633 4 964 5 375 7 125 9 402 9 851 12 421 9 311 ... administrations publiques Private final consumption 15 868 15 032 16 409 19 264 27 607 28 571 35 400 26 965 ... Consommation finale privée Gross fixed capital formation 3 846 3 561 4 176 5 102 6 918 7 320 9 092 6 862 ... Formation brute de capital fixe Increase in inventories 161 148 175 215 289 307 381 287 ... Variation des stocks Exports of goods and services 13 444 20 065 29 247 43 109 47 981 54 368 68 875 50 139 ... Exportations de biens et services 216 Moins importations de biens et Less imports of goods and services 10 109 9 848 11 936 15 346 19 850 21 290 26 601 19 903 ... services GDP at purchasers' values 27 844 33 922 43 446 59 468 72 347 79 127 99 569 73 660 ... PIB aux prix d'acquisition Gross domestic product by kind of economic activity at constant Produit intérieur brut par branche d'activité economique aux prix constants prices Annual Growth Rates (%) Taux de croissance annuel (%) Agriculture 3.7 3.5 4.7 7.6 9.8 4.0 2.4 2.5 ... Agriculture Mining and quarrying -5.9 19.4 6.0 9.4 3.9 1.0 -0.4 -7.6 ... Industries extractives Manufacturing 4.9 14.9 6.3 6.4 4.7 7.6 -1.7 3.5 ... Industries manufacturières Electricity, gas & water -5.9 19.4 4.3 17.4 8.4 13.9 10.0 7.0 ... Electricité, gaz et eau Construction 17.3 -12.0 9.1 17.5 7.6 20.9 12.0 9.0 ... Bâtiments et travaux publics Wholesale & retail trade, Commerce de gros et de 21.7 5.8 8.1 21.3 8.4 11.0 8.1 6.5 ... restaurants, hotels détail,restaurants et hôtels Banques, assurances, affaires Finance, insurance, real estate, etc. 21.7 5.8 3.5 4.7 4.7 8.9 7.8 7.3 ... immobilières Transport and communications 19.6 7.5 10.0 24.2 12.6 12.3 9.0 7.0 ... Transport(s) et communications Administrations publiques et Public administartion and defense 0.7 6.9 6.8 13.6 7.8 2.0 0.1 2.0 ... défense Other services 0.7 6.9 3.7 3.1 7.1 7.0 4.8 6.4 ... Autres services Moins Services d’intérmediation Less Imputed Service Charges 21.7 -15.4 -0.3 -15.2 -1.1 8.0 5.0 8.0 ... financière Gross domestic product at factor Produit intérieur brut aux couts des 1.9 12.8 6.2 11.1 5.7 5.0 2.7 -0.8 ... cost / basic prices facteurs / prix de base Plus: Indirect Taxes / taxes on Plus taxes indirectes/impôts sur les ... ... ... ... ... ... ... ... products, less subsidies produits, moins les subventions Gross domestic product at market Produit intérieur brut aux prix du -1.3 13.0 4.4 10.3 6.7 5.1 2.7 -0.7 ... prices marché Break in the serie from 2003 Rupture de la série à partir 2003 African Statistical Yearbook 2011 / Annuaire Statistique pour l'Afrique 2011
  • 218.
    Libyan Arab Jamahiriya Jamahiriya Arabe Libyenne Expenditure on Gross domestic product at constant purchasers' Emplois du produit intérieur brut aux prix constants d'acquisition values Annual Growth Rates (%) Taux de croissance annuel (%) Consommation finale des Government final consumption -24.4 7.0 5.0 2.9 11.6 4.4 1.7 0.2 ... administrations publiques Private final consumption 6.7 5.8 -3.0 18.8 4.2 4.2 4.1 -1.4 ... Consommation finale privée Gross fixed capital formation 17.1 -7.7 8.8 17.6 1.0 6.8 3.6 -1.8 ... Formation brute de capital fixe Exports of goods and services 15.6 19.7 7.9 3.3 10.3 5.1 1.6 0.0 ... Exportations de biens et services Moins importations de biens et Less imports of goods and services 37.4 2.6 2.1 6.6 10.0 4.2 2.3 -0.2 ... services III INFLATION 2002 2003 2004 2005 2006 2007 2008 2009 2010 Annual Growth Rates (%) Taux de croissance annuel (%) All Item -9.8 -2.1 -2.2 2.9 1.4 6.2 10.4 2.5 4.7 Ensemble Food -12.3 1.4 -2.5 6.6 1.2 15.1 19.7 3.0 2.8 Alimentation Health -4.9 -22.9 9.2 2.9 6.0 12.2 0.2 -0.1 0.0 Santé Energy -3.3 -15.5 0.0 1.6 1.2 0.1 0.5 3.8 ... Energie Transport 3.2 -21.3 26.2 1.7 1.5 -0.5 3.5 2.2 -0.4 Transport IV AGRICULTURAL PRODUCTION - PRODUCTION AGRICOLE 2002 2003 2004 2005 2006 2007 2008 2009 2010 Tons (Thousand) Tonnes (milliers) Potato, Tons (thousands) 195 195 195 310 300 290 290 ... ... Pomme de terre, tonnes (milliers) Tomato, Tons (thousands) 190 190 190 190 160 213 213 200 ... Tomates, tonnes (milliers) Dates, Tons (thousands) 200 200 150 150 150 150 150 150 ... Dattes, tonnes (milliers) Olives, Tons (thousands) 150 150 180 180 180 180 180 180 ... Olive, tonnes (milliers) Wheat, Tons (thousands) 125 125 125 125 104 104 104 ... ... Blé, tonnes (milliers) V MINING PRODUCTION - PRODUCTION MINIERE 217 2002 2003 2004 2005 2006 2007 2008 2009 2010 Crude petroleum, metric tons Pétrole brut, tonnes métriques 60 584.0 68 736.0 75 287.0 80 252.0 83 310.0 81 114.0 ... ... ... (thousands) (milliers) Natural gas (terajoules) 235 980.0 243 200.0 306 281.0 429 400.0 562 400.0 625 480.0 ... ... ... Gaz naturel (térajoules) Salt and sodium chloride, metric tons Sel et chlorure de sodium pur, 40.0 40.0 40.0 40.0 40.0 40.0 ... ... ... (thousands) tonnes métriques (milliers) VI ENERGY - ENERGIE 2002 2003 2004 2005 2006 2007 2008 2009 2010 Electricity - total hydro production, Électricité - production hydraulique 17 351.0 18 943.0 20 202.0 22 317.0 23 992.0 25 694.0 28 666.0 ... ... kilowatt hours (millions) totale, kilowatt-heures (millions) Electricity - total thermal production, Électricité - production thermique ... ... ... ... ... ... ... ... ... kilowatt hours (millions) totale, kilowatt-heures (millions) Electricity - total production, self- Electricité - Production totale privée ... ... ... ... ... ... ... ... ... producer (Million Kilowatt Hours) (million de kilowatt heures) Electricity - total production, public Electricité - Production totale 17 351 18 943 20 202 22 317 23 992 25 694 ... ... ... (Million Kilowatt Hours) publique (million de kilowatt heures) African Statistical Yearbook 2011 / Annuaire Statistique pour l'Afrique 2011
  • 219.
    Libyan Arab Jamahiriya Jamahiriya Arabe Libyenne VII TOURISM AND INFRASTRUCTURE - TOURISME ET INFRASTUCTURE 2002 2003 2004 2005 2006 2007 2008 2009 2010 Arrivals - Tourists (thousands) 135 142 42.638 81.319 125.48 105.997 759.771 ... ... Arrivées - touristes (milliers) Rooms in hotels and similar Chambres d'hotels et établissements establishments (thousands) 4 4 6 6 7 8 8 ... ... assimilés (milliers) Paved Road (% of total) ... ... ... ... ... 57 50 44 ... Routes asphaltées (% du total) Total Network (Railways-km) ... ... ... ... ... 27 355 30 000 34 000 ... Réseau total voies ferrées-Km Main Telephone Lines (per 1,000 Lignes téléphoniques fixes (pour 130 130 140 140 150 160 160 170 ... inhabitants) 1000 habitants) Mobile Cellular Subscribers (per Abonnés aux téléphones mobiles 10 20 90 340 650 730 770 780 ... 1,000 inhabitants) (pour 1000 habitants) VII FINANCIAL AND MONETARY STATISTICS - FINANCES ET STATISTIQUES MONETAIRES 2002 2003 2004 2005 2006 2007 2008 2009 2010 VII-1 Monetary Statistics VII-1 Statistiques monétaires Libyan Dinar (Millions) Dinar Libyen(Millions) Money supply (M1) 8 360 8 681 10 154 13 384 15 455 22 014 33 323 37 392 36 615 Masse monétaire (M1) Quasi-money 2 165 2 529 2 599 3 068 3 313 3 894 5 330 7 992 6 964 Quasi-monnaie of which Demand Deposit ... ... ... ... ... ... ... ... ... dont Monnaie scripturale Net foreign assets 19 034 27 016 34 125 56 308 79 318 100 484 124 714 128 810 131 681 Avoirs extérieurs nets Domestic credit 7 989 4 560 - 10 168 - 25 706 - 42 891 - 48 728 - 56 989 - 51 560 - 58 207 Crédit intérieur of which claims on private sector 4 476 4 298 4 452 4 573 4 742 5 286 7 744 8 521 8 593 dont créances sur le secteur privé of which Claims on government dont créances nettes sur le 275 - 4 055 - 18 701 - 35 137 - 53 668 - 60 961 - 70 642 - 69 953 - 79 240 sector, net gouvernement International reserves (millions of US Réserves internationales (millions de 14 307 19 584 25 689 39 508 59 289 79 405 92 313 98 725 101 882 $) $ EU) Average Exchange Rate (National Taux de change (moyen) (monnaie 1.27 1.29 1.30 1.31 1.31 1.26 1.22 1.25 1.27 Currency per us $) nationale par dollars) VII-2 Public Finance VII-2 Finances publiques Libyan Dinar (Millions) Dinar Libyen(Millions) Total Revenues and Grants 12 850 16 614 23 272 37 413 46 390 57 754 78 923 44 653 64 561 Recettes totales et dons Tax Revenue 11 301 15 231 21 757 36 289 44 654 54 810 74 921 43 767 ... Recettes fiscales Non Tax Revenue 1 549 1 383 1 515 1 124 1 736 1 506 1 981 886 ... Recettes non fiscales 218 Grants 0 0 0 0 0 1 438 2 021 0 ... Dons Total Expenditures and Net Lending 10 063 13 396 17 230 19 930 22 449 32 695 44 836 39 406 44 776 Dépenses totales et prêts nets Current expenditure 6 225 9 836 9 231 6 748 8 129 10 278 10 593 10 422 ... Dépenses courantes Of which Wages and Salaries 2 546 2 812 3 675 4 258 4 772 7 316 7 764 8 118 ... Dont rémunérations et salaires Capital expenditure 3 339 2 832 6 933 9 265 12 176 16 271 25 907 20 187 ... Dépenses d'équipement Net Lending 0 0 102 2 420 580 4 049 1 350 800 ... Prêts nets Fiscal Balance 2 787 3 218 6 042 17 483 23 941 25 059 34 087 5 247 19 785 Solde global y compris les dons VII-3 Balance of Payments VII-3 Balance des paiements Libyan Dinar (Millions) Dinar Libyen(Millions) Trade balance 2 734 4 591 9 209 12 593 35 878 36 811 50 011 19 008 31 276 Balance commerciale Services Balance - 1 445 - 1 493 - 1 927 - 2 376 - 2 489 - 2 420 - 3 104 - 4 085 - 2 907 Balance des services Net Income 337 698 - 321 - 368 - 50 1 053 852 723 377 Revenus nets Current transfers, net total - 1 108 - 2 163 - 3 274 - 830 436 - 275 - 1 273 - 1 895 - 1 728 Transferts courants Current account balance 827 6 670 9 670 22 823 33 775 35 168 46 486 13 751 27 018 Solde du compte courant VII-4 External Debt and Financial Flows VII-4 Dette extérieure et flux financiers US $ (Millions) $ E.U (Millions) Total external debt 5 574 5 574 5 574 5 574 5 574 5 574 5 574 5 574 5 574 Dette extérieure totale Private 2 374 2 374 2 374 2 374 2 374 2 374 2 374 2 374 2 374 Privée Public 3 200 3 200 3 200 3 200 3 200 3 200 3 200 3 200 3 200 Publique Total external debt service ... ... ... ... ... ... ... ... ... Service de la dette extérieure Net Foreign Direct Investment Investissements étranger direct (flux 145 143 357 1 038 2 013 4 689 4 111 2 674 ... Inflows nets entrants) Net Total Official Development Aide publique au développement 0 0 0 24 38 19 60 39 ... assistance (nette totale) African Statistical Yearbook 2011 / Annuaire Statistique pour l'Afrique 2011
  • 220.
    Libyan Arab Jamahiriya Jamahiriya Arabe Libyenne 2002 2003 2004 2005 2006 2007 2008 2009 2010 Libyan Dinar (Millions) Dinar Libyen Exports, fob Exportations, fàb Exports - Total 5 394 10 177 14 807 20 848 31 148 36 336 40 972 54 732 ... Exportations - Total Main Products Principaux produits Crude Petroleum 9 519 14 916 22 197 31 617 35 831 40 561 54 468 ... ... Pétrole brut ... ... ... ... ... ... ... ... ... ... ... ... ... ... ... ... ... ... ... ... ... ... ... ... ... ... ... ... ... ... ... ... ... ... ... ... Main Destinations Principales destinations Italy 4 176.3 5 868.1 8 187.8 12 930.7 15 456.4 16 805.6 24 428.4 ... ... Italie Germany 1 356.7 2 174.2 3 815.2 3 031.5 3 560.2 4 659.1 4 503.7 ... ... Allemagne Spain 1 739.0 2 179.0 2 782.8 3 102.8 3 079.1 2 379.2 3 042.5 ... ... Espagne Turkey 591.8 1 144.1 1 726.2 2 347.6 ... ... ... ... ... Turquie France ... ... ... 1 733.1 1 747.6 2 616.2 5 409.7 ... ... France 2002 2003 2004 2005 2006 2007 2008 2009 2010 Imports, cif Importations, cif Imports - Total 2 660 5 586 5 598 8 255 7 954 7 935 8 501 11 196 ... Importations - Total (millions) 219 Principaux produits Main Products Flour or wheat or meslin 248 240 628 404 291 398 373 ... ... Blé nda et méteil ... ... ... ... ... ... ... ... ... ... ... ... ... ... ... ... ... ... ... ... ... ... ... ... ... ... ... ... ... ... ... ... ... ... ... ... Main Origin Principales provenances Italy 1 360.0 1 027.2 1 511.5 946.9 784.1 690.4 ... ... ... Italie Germany 626.4 499.1 994.1 742.6 673.8 ... ... ... ... Allemagne Korea, South 288.6 ... 615.8 568.2 518.7 ... ... ... ... Corée du Sud United Kingdom 392.7 300.3 ... ... ... ... ... ... ... Royaume-Uni France ... ... ... 414.1 ... ... ... ... ... France African Statistical Yearbook 2011 / Annuaire Statistique pour l'Afrique 2011
  • 221.
    Madagascar Madagascar AREA (KM 2) 587 041 SUPERFICIE (KM 2) CAPITAL CITY Antananarivo Tananarive CAPITALE CURRENCY Ariary Ariary MONNAIE I SOCIAL AND DEMOGRAPHIC INDICATORS — INDICATEURS DEMOGRAPHIQUES ET SOCIAUX 2002 2003 2004 2005 2006 2007 2008 2009 2010 Population Population Population au milieu de l'année - Mid-year population - Total (Million) 16.2 16.7 17.1 17.6 18.1 18.6 19.1 19.6 20.1 Total (million) Population au milieu de l'année - Mid-year population - Urban (%) ... ... 28.0 29.0 29.0 29.0 29.0 29.8 ... Urbaine (%) Female (%) 50.5 50.5 50.5 50.6 50.5 50.5 50.5 50.5 ... Femme (%) Population by Age Group Population par groupe d'âge 0-14 7279 840 7457 496 7629 035 7796 480 7959 884 8118 275 8271 594 8419 688 8562 573 0-14 15-64 8406 728 8682 472 8972 115 9274 295 9588 720 9915 738 10255 212 10607 051 10970 858 15-64 65+ 503 228 516 759 530 167 543 486 556 835 570 352 584 135 598 291 613 011 65+ Active Population (000) 7 750.7 7 986.7 8 240.2 8 505.2 8 780.2 9 063.8 9 356.7 9 682.8 10 006.9 Population active (000) Female (%) 48.8 48.8 48.9 49.0 49.0 49.1 49.2 49.2 49.2 Femme (%) Taux brut de natalité - Total (par Crude birth rate - Total (per 1000) 39.7 39.0 38.3 37.7 37.1 36.5 35.9 35.3 ... 1000) Taux brut de mortalité - Total (par Crude death rate - Total (per 1000) 10.9 10.6 10.3 10.0 9.7 9.4 9.2 8.9 ... 1000) Life expectancy at birth - Total Espérance de vie à la naissance - 57.5 58.0 58.4 58.9 59.4 59.9 60.4 60.8 ... (years) Total (années) Net reproduction rate - (per Taux net de reproduction - (par ... ... ... 2.1 ... ... ... ... ... woman) femme) Indice synthétique de fécondité - Total fertility rate - (p woman) y (per ) 5.3 5.2 5.1 5.0 4.9 4.8 4.7 4.6 ... (par femme) Education Enseignement Teaching staff at first level - Total Personnel enseignant - 1er degré - ... ... ... ... ... ... ... ... ... (thousands) Total (milliers) Teaching staff at second level - Total Personnel enseignant - 2ème degré - 220 ... ... ... ... ... ... ... ... ... (thousands) Total (milliers) Teaching staff at third level - Total Personnel enseignant - 3ème degré - ... ... ... ... ... ... ... ... ... (thousands) Total (milliers) First level student enrollment - Total Elèves inscrits - 1er degré - Total ... ... ... ... ... ... ... ... ... (thousands) (milliers) First level student enrollment - Elèves inscrits - 1er degré - Femmes 1 180 1 398 1 648 1 759 1 813 1 887 1 979 ... ... Female (thousands) (milliers) Second level student enrollment - Elèves inscrits - 2ème degré - Total ... ... ... 621 727 834 945 ... ... Total (thousands) (milliers) Second level student enrollment - Elèves inscrits - 2ème degré - ... ... ... 304 354 407 459 ... ... Female (thousands) Femmes (milliers) Third level student enrollment - Total Elèves inscrits - 3ème degré - Total 31.9 35.5 42.1 44.9 49.7 58.3 62.1 ... ... (thousands) (milliers) Third level student enrollment - Elèves inscrits - 3ème degré - 14.5 16.1 19.9 21.1 23.1 27.4 29.3 ... ... Female (thousands) Femmes (milliers) Public expenditure on education (% Dépenses publiques consacrées à ... ... 18.2 25.3 13.9 16.4 ... ... ... of budget) l'enseignement (% du budget) Health Santé Hospital beds - Total (per 10 000 Nombre de lits d'hôpitaux - Total 40 40 38 40 33 34 ... ... ... population) (pour 10 000) Nurses - Total (per 10 000 Nombre d'infirmières - Total (pour ... ... 31 ... ... ... ... ... ... population) 10 000) Physicians - Total (per 10 000 Nombre de médecins - Total (pour 1 ... 3 ... 3 3 4 ... ... population) 10 000) Public expenditure on Health (% of Dépenses publiques consacrées à la 17 11 8 10 9 ... ... ... ... budget) santé (% du budget) African Statistical Yearbook 2011 / Annuaire Statistique pour l'Afrique 2011
  • 222.
    Madagascar Madagascar II NATIONAL ACCOUNTS — COMPTES NATIONAUX 2002 2003 2004 2005 2006 2007 2008 2009 2010 Gross domestic product by kind of economic activity at current prices Produit intérieur brut par branche d'activité économique aux prix courants Ariary (Billions) Ariary(Milliards) Agriculture 1 793 1 815 2 135 2 592 2 969 3 219 3 589 4 393 ... Agriculture Mining and quarrying 8 10 12 16 19 16 17 27 ... Industries extractives Manufacturing 735 878 1 087 1 330 1 579 1 877 2 131 2 250 ... Industries manufacturières Electricity, gas & water 72 68 84 99 128 144 192 191 ... Electricité, gaz et eau Construction 110 130 190 276 403 547 709 647 ... Bâtiments et travaux publics Wholesale & retail trade, Commerce de gros et de détail, 880 955 1 105 1 282 1 435 1 636 1 909 2 060 ... restaurants, hotels restaurants et hôtels Banques, assurances, affaires Finance, insurance, real estate, etc. 49 56 74 103 122 150 203 208 ... immobilières Transport and communications 963 1 029 1 314 1 748 2 111 2 595 3 100 3 063 ... Transport(s) et communications Administrations publiques et Public administration and defense 220 316 338 396 521 606 669 671 ... défense Other services 861 1 013 1 138 1 386 1 623 1 875 2 136 2 096 ... Autres services Moins Services d’intermédiation Less Imputed Service Charges - 39 - 45 - 63 - 67 - 108 - 135 - 187 - 182 ... financière Gross domestic product at factor Produit intérieur brut aux couts des 5 653 6 224 7 414 9 162 10 803 12 531 14 469 15 424 ... cost / basic prices facteurs / prix de base Plus: Indirect Taxes / taxes on Plus taxes indirectes/impôts sur les 355 554 742 931 1 012 1 229 1 630 1 379 ... products, less subsidies produits, moins les subventions Expenditure on Gross domestic product at current purchaser's values Emploi du produit intérieur brut aux prix courants d'acquisition Ariary( Billions) Ariary(Milliards) Consommation finale des Government final consumption 502 710 745 904 1 034 1 691 1 809 1 927 ... administrations publiques Private final consumption 5 244 5 921 6 966 8 698 9 688 10 986 12 080 13 136 ... Consommation finale privée Gross fixed capital formation 804 1 098 1 907 2 240 2 989 4 456 7 094 5 987 ... Formation brute de capital fixe Increase in inventories ... ... ... ... ... - 382 ... - 263 ... Variation des stocks Exports of goods and services 959 1 456 2 855 2 848 3 513 4 172 4 268 4 786 ... Exportations de biens et services 221 Moins importations de biens et Less imports of goods and services 1 500 2 406 4 317 4 598 5 408 7 164 9 151 8 771 ... services GDP at purchasers' values 6 008 6 779 8 156 10 092 11 815 13 760 16 099 16 803 ... PIB aux prix d'acquisition Gross domestic product by kind of economic activity at constant Produit intérieur brut par branche d'activité economique aux prix constants prices Annual Growth Rates (%) Taux de croissance annuel (%) Agriculture -1.3 1.3 3.1 2.5 2.1 2.2 2.9 5.9 ... Agriculture Mining and quarrying -34.0 10.0 7.7 4.4 9.1 -7.2 9.0 14.3 ... Industries extractives Manufacturing -18.5 15.6 6.6 3.0 3.3 10.8 4.3 -8.9 ... Industries manufacturières Electricity, gas & water -31.1 8.8 6.0 2.5 4.4 5.6 6.9 -0.4 ... Electricité, gaz et eau Construction -15.1 30.0 29.0 18.8 27.6 21.8 27.6 -17.7 ... Bâtiments et travaux publics Wholesale & retail trade, Commerce de gros et de -9.5 5.1 3.9 4.9 4.5 4.6 4.2 -0.7 ... restaurants, hotels détail,restaurants et hôtels Banques, assurances, affaires Finance, insurance, real estate, etc. 4.5 12.4 5.0 6.6 14.1 8.8 4.2 16.5 ... immobilières Transport and communications -22.6 14.5 5.6 5.3 7.8 8.2 8.1 -9.7 ... Transport(s) et communications Administrations publiques et Public administartion and defense 2.0 6.0 1.6 3.0 2.1 3.0 3.0 0.0 ... défense Other services -16.6 9.4 5.8 6.4 5.0 7.2 6.4 -4.5 ... Autres services Moins Services d’intérmediation Less Imputed Service Charges 5.0 12.5 5.0 6.6 14.2 8.9 4.0 16.7 ... financière Gross domestic product at factor Produit intérieur brut aux couts des -11.5 7.4 5.0 4.4 4.9 6.1 6.0 -2.8 ... cost / basic prices facteurs / prix de base Plus: Indirect Taxes / taxes on Plus taxes indirectes/impôts sur les -23.5 35.0 7.3 6.4 6.2 7.2 16.2 -9.9 ... products, less subsidies produits, moins les subventions Gross domestic product at market Produit intérieur brut aux prix du -12.7 9.8 5.3 4.6 5.0 6.2 7.1 -3.7 ... prices marché African Statistical Yearbook 2011 / Annuaire Statistique pour l'Afrique 2011
  • 223.
    Madagascar Madagascar Expenditure on Gross domestic product at constant purchasers' Emplois du produit intérieur brut aux prix constants d'acquisition values Annual Growth Rates (%) Taux de croissance annuel (%) Consommation finale des Government final consumption -13.6 29.4 -11.4 8.7 -11.5 44.7 -1.6 3.9 ... administrations publiques Private final consumption -3.0 8.9 3.4 1.6 1.4 0.1 0.3 0.1 ... Consommation finale privée Gross fixed capital formation -37.5 48.9 27.9 -1.3 19.3 30.8 54.3 -21.8 ... Formation brute de capital fixe Exports of goods and services -45.9 39.1 9.8 2.2 17.2 32.7 -3.3 9.3 ... Exportations de biens et services Moins importations de biens et Less imports of goods and services -25.0 56.7 8.9 -8.8 4.9 28.3 26.1 -10.5 ... services III INFLATION 2002 2003 2004 2005 2006 2007 2008 2009 2010 Annual Growth Rates (%) Taux de croissance annuel (%) All Item 16.7 -1.9 14.0 18.4 10.8 10.4 9.2 9.0 9.2 Ensemble Food 15.7 -3.7 20.0 25.6 4.2 28.4 -2.0 8.3 7.1 Alimentation Health 7.6 -0.7 7.7 8.8 8.4 -4.0 25.9 8.4 17.0 Santé Energy 17.1 1.6 14.2 16.0 23.0 -25.3 54.5 11.6 11.7 Energie Transport 42.9 -13.5 11.6 13.8 19.6 -7.8 25.8 2.2 3.4 Transport IV AGRICULTURAL PRODUCTION - PRODUCTION AGRICOLE 2002 2003 2004 2005 2006 2007 2008 2009 2010 Tons (Thousand) Tonnes (milliers) Rice, Tons (thousands) 2 604 2 800 3 030 3 392 3 485 3 596 ... ... ... Riz, tonnes (milliers) Cassava, Tons (thousands) 2 366 1 992 1 949 2 964 2 359 2 994 ... ... ... Manioc, tonnes (milliers) Sweet potato, Tons (thousands) 493 493 488 879 590 ... ... ... ... Patates douces, tonnes (milliers) Maize, Tons (thousands) 172 318 309 391 373 391 ... ... ... Maïs, tonnes (milliers) Potato, Tons (thousands) 296 255 246 215 298 ... ... ... ... Pommes de terre, tonnes (milliers) V MINING PRODUCTION - PRODUCTION MINIERE 222 2002 2003 2004 2005 2006 2007 2008 2009 2010 Gold ores and concentrates Minerais d'or et leurs concentrés 38.0 10.0 200.0 169.8 184.6 ... ... ... ... (Kilograms) (Kilogrammes) Chromium ores and concentrates, 28.0 40.0 46.0 38.6 42.0 122.0 ... ... ... Minerai de chrome et concentrés, metric tons (thousands) tonnes métriques (milliers) Marble, travertines, etc., metric tons Marbres, travertins, etc., tonnes 5.6 5.0 ... 4.2 4.6 ... ... ... ... (thousands) métriques (milliers) VI ENERGY - ENERGIE 2002 2003 2004 2005 2006 2007 2008 2009 2010 Electricity - total hydro production, Électricité - production hydraulique 779.2 897.8 983.4 988.4 1 003.6 1 051.8 1 296.0 1 410.4 ... kilowatt hours (millions) totale, kilowatt-heures (millions) Electricity - total thermal production, Électricité - production thermique 68.7 68.1 64.8 65.6 63.6 68.4 53.0 47.7 ... kilowatt hours (millions) totale, kilowatt-heures (millions) Electricity - total production, self- Electricité - Production totale privée 31 32 35 34 36 32 47 52 ... producer (Million Kilowatt Hours) (million de kilowatt heures) Electricity - total production, public Electricité - Production totale 682 775 840 875 820 765 ... ... ... (Million Kilowatt Hours) publique (million de kilowatt heures) African Statistical Yearbook 2011 / Annuaire Statistique pour l'Afrique 2011
  • 224.
    Madagascar Madagascar VII TOURISM AND INFRASTRUCTURE - TOURISME ET INFRASTUCTURE 2002 2003 2004 2005 2006 2007 2008 2009 2010 Arrivals - Tourists (thousands) 170.208 61.674 139.23 228.784 288.04 311.448 340.185 148.387 ... Arrivées - touristes (milliers) Rooms in hotels and similar Chambres d'hotels et établissements establishments (thousands) 8.78 9.325 10.23 10.879 11.872 14.435 16.145 18.066 ... assimilés (milliers) Paved Road (% of total) ... ... 20 ... ... ... ... ... ... Routes asphaltées (% du total) Total Network (Railways-km) ... ... 30 004 ... ... ... ... ... ... Réseau total voies ferrées-Km Main Telephone Lines (per 1,000 Lignes téléphoniques fixes (pour 3 3 3 3 6 7 9 ... ... inhabitants) 1000 habitants) Mobile Cellular Subscribers (per Abonnés aux téléphones mobiles 10 17 20 30 60 120 261 ... ... 1,000 inhabitants) (pour 1000 habitants) VII FINANCIAL AND MONETARY STATISTICS - FINANCES ET STATISTIQUES MONETAIRES 2002 2003 2004 2005 2006 2007 2008 2009 2010 VII-1 Monetary Statistics VII-1 Statistiques monétaires Ariary (Billions) Ariary(Milliards) Money supply (M1) 1 126 1 172 1 399 1 415 1 751 2 075 2 263 2 403 2 615 Masse monétaire (M1) Quasi-money 333 414 588 617 818 1 032 1 241 1 498 1 662 Quasi-monnaie of which Demand Deposit ... ... ... ... ... ... ... ... ... dont Monnaie scripturale Net foreign assets 372 438 776 845 1 526 1 846 2 098 1 925 2 308 Avoirs extérieurs nets Domestic credit 1 101 1 214 1 224 1 296 1 138 1 371 1 508 1 952 1 908 Crédit intérieur of which claims on private sector 487 595 815 997 1 191 1 398 1 796 1 926 2 134 dont créances sur le secteur privé of which Claims on government dont créances nettes sur le 541 616 406 294 - 58 - 31 - 294 20 - 232 sector, net gouvernement International reserves (millions of US Réserves internationales (millions de 363 414 504 481 583 847 982 1 135 1 134 $) $ EU) Average Exchange Rate (National Taux de change (moyen) (monnaie 1 366.39 1 238.33 1 868.86 2 003.03 2 142.30 1 873.88 1 708.37 1 956.21 2 089.95 Currency per us $) nationale par dollars) VII-2 Public Finance VII-2 Finances publiques Ariary (Billions) Ariary(Milliards) Total Revenues and Grants 499 832 1 302 1 244 1 496 1 697 2 685 2 054 2 534 Recettes totales et dons Tax Revenue 461 678 887 1 020 1 261 1 573 2 087 1 862 2 175 Recettes fiscales Non Tax Revenue 20 20 96 83 62 35 50 80 271 Recettes non fiscales Grants 18 134 319 141 173 89 548 192 358 Dons 223 Total Expenditures and Net Lending 925 1 339 2 118 2 122 3 277 2 594 2 998 2 478 2 887 Dépenses totales et prêts nets Current expenditure 594 741 1 017 1 100 2 012 1 497 1 754 1 752 1 938 Dépenses courantes Of which Wages and Salaries 276 365 400 456 285 711 759 802 1 003 Dont rémunérations et salaires Capital expenditure 289 494 985 959 1 165 1 011 1 244 726 949 Dépenses d'équipement Net Lending 41 104 116 63 99 87 0 0 0 Prêts nets Fiscal Balance - 345 - 333 - 464 - 439 4 457 - 393 - 313 - 424 - 353 Solde global y compris les dons VII-3 Balance of Payments VII-3 Balance des paiements Ariary (Billions) Ariary(Milliards) Trade balance - 64 - 314 - 816 - 1 185 - 1 148 - 1 873 - 3 193 - 3 280 - 2 918 Balance commerciale Services Balance - 236 - 368 - 512 - 236 - 150 - 379 - 652 - 697 - 219 Balance des services Net Income - 93 - 95 - 124 - 161 - 171 - 118 - 84 - 179 - 262 Revenus nets Current transfers, net total 130 377 610 472 455 422 679 599 558 Transferts courants Current account balance - 262 - 400 - 843 - 1 110 - 1 013 - 1 948 - 3 250 - 3 557 - 2 841 Solde du compte courant VII-4 External Debt and Financial Flows VII-4 Dette extérieure et flux financiers US $ (Millions) $ E.U (Millions) Total external debt 4 303 4 835 3 829 3 716 1 587 1 837 1 875 2 113 2 214 Dette extérieure totale Private 61 67 57 42 39 34 23 17 14 Privée Public 4 242 4 768 3 772 3 674 1 549 1 803 1 852 2 096 2 199 Publique Total external debt service 58 74 103 85 68 43 44 42 40 Service de la dette extérieure Net Foreign Direct Investment Investissements étranger direct (flux 61 95 95 86 294 777 1 180 543 ... Inflows nets entrants) Net Total Official Development Aide publique au développement 374 546 1 263 913 757 894 843 445 ... assistance (nette totale) African Statistical Yearbook 2011 / Annuaire Statistique pour l'Afrique 2011
  • 225.
    Madagascar Madagascar 2002 2003 2004 2005 2006 2007 2008 2009 2010 Ariary (Millions) Ariary Exports, fob Exportations, fàb Exports - Total 658 050 1 057 579 1 855 080 1 674 698 2 093 053 2 312 024 2 196 577 2 056 695 ... Exportations - Total Main Products Principaux produits Shrimps and prawns 166 835 152 302 197 611 203 072 256 468 232 648 187 068 153 093 ... Crevettes Shirts, blouses 15 381 15 036 35 845 35 670 47 865 68 804 155 182 65 687 ... Chemises, chemisettes Petroleum products 35 799 48 867 70 177 88 679 166 954 104 042 154 941 95 035 ... Produits pétroliers Vanilla 224 684 281 547 232 234 94 114 100 652 104 134 85 742 86 688 ... Vanille Chrome ore 3 822 3 751 15 383 21 193 27 967 22 396 55 742 33 420 ... Minerai de chrome Main Destinations Principales destinations France 348 673.5 500 459.3 640 360.5 551 779.5 800 209.5 1 037 485.0 1 239 475.3 674 016.0 ... France United States 175 108.4 311 226.6 615 031.5 376 730.0 317 681.4 436 438.4 624 028.6 383 436.0 ... Etats-Unis Germany 42 579.0 59 063.7 103 888.9 109 832.8 127 410.2 126 962.9 184 849.3 136 733.0 ... Allemagne China 8 909.6 9 017.7 18 964.1 69 667.3 47 127.8 50 372.8 89 541.9 103 208.0 ... Chine Italy 26 778.8 18 233.3 52 291.0 47 286.4 87 472.7 87 681.2 69 079.9 54 610.0 ... Italie 2002 2003 2004 2005 2006 2007 2008 2009 2010 Imports, cif Importations, cif 224 Imports - Total ... ... ... ... ... ... ... ... ... Importations - Total (millions) Principaux produits Main Products Petroleum Products 279 553 252 697 425 678 532 111 684 469 731 548 840 087 628 149 ... Produits pétroliers Cotton Fabrics 5 667 72 518 146 763 135 156 143 024 179 185 243 672 107 720 ... Tissus de coton Rebars and laminates 20 314 45 929 85 501 74 540 94 266 91 079 206 509 135 830 ... Fers à béton et laminés Plastics 20 341 45 629 84 009 94 762 116 705 129 205 170 697 114 913 ... Matières plastiques Trucks 17 204 36 615 106 395 135 430 74 813 94 993 159 418 85 810 ... Camions Main Origin Principales provenances China 45 331.3 239 504.6 542 059.5 476 997.3 661 991.5 864 273.0 1 371 594.0 694 817.0 ... Chine France 120 520.5 245 994.3 406 788.2 486 005.4 484 810.4 474 378.3 575 346.0 595 837.0 ... France Bahreïn 95 886.8 28 977.1 198 002.9 446 535.2 615 710.0 688 884.6 518 898.2 214 881.0 ... Bahreïn South Africa 50 806.8 115 203.3 185 513.3 200 461.5 216 032.4 240 198.3 396 956.0 277 943.0 ... Afrique du Sud United States 25 369.6 59 020.5 216 628.3 80 871.7 133 891.0 160 487.2 326 130.2 211 048.0 ... Etats-Unis African Statistical Yearbook 2011 / Annuaire Statistique pour l'Afrique 2011
  • 226.
    Malawi Malawi AREA (KM 2) 118 484 SUPERFICIE (KM 2) CAPITAL CITY Lilongwe Lilongwe CAPITALE CURRENCY Kwacha Kwacha MONNAIE I SOCIAL AND DEMOGRAPHIC INDICATORS — INDICATEURS DEMOGRAPHIQUES ET SOCIAUX 2002 2003 2004 2005 2006 2007 2008 2009 2010 Population Population Population au milieu de l'année - Mid-year population - Total (Million) 11.2 11.5 11.9 12.3 12.8 12.9 13.1 13.3 13.9 Total (million) Population au milieu de l'année - Mid-year population - Urban (%) 14.0 13.0 13.0 14.0 14.0 14.0 15.0 15.0 15.0 Urbaine (%) Female (%) 51.0 51.0 51.0 51.0 51.0 51.0 51.0 51.0 51.0 Femme (%) Population by Age Group Population par groupe d'âge 0-14 5134 534 5306 477 5485 249 5670 528 5861 999 5908 920 5989 173 6213 116 6435 192 0-14 15-64 5612 312 5800 255 5995 662 6198 181 6407 470 6458 756 6612 740 6809 635 7016 430 15-64 65+ 427 803 442 129 457 024 472 461 488 414 492 323 500 163 497 347 495 970 65+ Active Population (000) 6 034.1 6 191.9 6 360.9 6 540.6 6 729.5 6 783.3 6 897.9 7 035.8 7 172.5 Population active (000) Female (%) 49.0 49.0 49.0 49.0 49.0 49.0 49.0 49.0 49.0 Femme (%) Taux brut de natalité - Total (par Crude birth rate - Total (per 1000) 45.0 50.1 40.5 48.8 48.2 41.0 46.5 45.8 45.1 1000) Taux brut de mortalité - Total (par Crude death rate - Total (per 1000) 25.0 18.5 17.7 16.6 16.3 15.2 14.8 14.6 14.1 1000) Life expectancy at birth - Total Espérance de vie à la naissance - 43.8 43.8 43.8 45.9 46.4 48.0 51.0 51.7 52.5 (years) Total (années) Net reproduction rate - (per Taux net de reproduction - (par ... ... ... 2.1 ... ... ... ... ... woman) femme) Indice synthétique de fécondité - Total fertility rate - (p woman) y (per ) 6.5 6.5 6.4 6.3 6.3 6.3 5.2 5.2 5.2 (par femme) Education Enseignement Teaching staff at first level - Total Personnel enseignant - 1er degré - 46.03 45.1 44.0 45.1 43.2 42.3 45.9 46.4 46.8 (thousands) Total (milliers) Teaching staff at second level - Total Personnel enseignant - 2ème degré - 10.81 7.1 9.0 9.0 10.4 10.3 11.4 11.5 11.6 (thousands) Total (milliers) 225 Teaching staff at third level - Total Personnel enseignant - 3ème degré - 0.7 0.8 0.8 0.8 0.8 0.8 0.8 0.8 0.8 (thousands) Total (milliers) First level student enrollment - Total Elèves inscrits - 1er degré - Total 3 113 3 117 3 167 3 201 3 281 3 307 3 601 3 637 3 673 (thousands) (milliers) First level student enrollment - Elèves inscrits - 1er degré - Femmes 1 552 1 533 1 577 1 594 1 641 1 653 1 794 1 812 1 831 Female (thousands) (milliers) Second level student enrollment - Elèves inscrits - 2ème degré - Total 116 131 180 184 218 210 234 236 238 Total (thousands) (milliers) Second level student enrollment - Elèves inscrits - 2ème degré - 49 56 77 78 96 91 102 103 103 Female (thousands) Femmes (milliers) Third level student enrollment - Total Elèves inscrits - 3ème degré - Total 4.5 4.8 5.8 5.8 6.3 6.5 6.5 6.5 7.2 (thousands) (milliers) Third level student enrollment - Elèves inscrits - 3ème degré - 1.3 1.4 2.0 2.1 2.1 2.2 2.8 3.2 3.0 Female (thousands) Femmes (milliers) Public expenditure on education (% Dépenses publiques consacrées à 9.0 19.4 20.2 11.3 10.7 10.7 10.2 11.0 12.0 of budget) l'enseignement (% du budget) Health Santé Hospital beds - Total (per 10 000 Nombre de lits d'hôpitaux - Total 1 1 1 1 1 1 1 1 ... population) (pour 10 000) Nurses - Total (per 10 000 Nombre d'infirmières - Total (pour 7 7 7 7 7 7 7 8 ... population) 10 000) Physicians - Total (per 10 000 Nombre de médecins - Total (pour 2 2 2 2 2 2 2 2 ... population) 10 000) Public expenditure on Health (% of Dépenses publiques consacrées à la 5 7 5 5 10 12 12 14 ... budget) santé (% du budget) African Statistical Yearbook 2011 / Annuaire Statistique pour l'Afrique 2011
  • 227.
    Malawi Malawi II NATIONAL ACCOUNTS — COMPTES NATIONAUX 2002 2003 2004 2005 2006 2007 2008 2009 2010 Gross domestic product by kind of economic activity at current prices Produit intérieur brut par branche d'activité économique aux prix courants Kwacha(Millions) Kwacha(Millions) Agriculture 82 922 105 408 126 711 137 762 139 648 153 063 176 258 202 969 ... Agriculture Mining and quarrying 7 763 8 974 10 731 11 468 11 827 19 384 22 321 25 704 ... Industries extractives Manufacturing 9 488 10 969 13 116 14 017 14 455 23 691 27 281 31 415 ... Industries manufacturières Electricity, gas & water 4 890 5 966 7 124 8 742 7 851 12 868 14 818 17 063 ... Electricité, gaz et eau Construction 6 721 7 494 8 985 9 632 9 902 16 229 18 688 21 520 ... Bâtiments et travaux publics Wholesale & retail trade, 17 882 20 919 24 895 28 019 27 437 44 967 51 782 59 629 ... Commerce de gros et de détail, restaurants, hotels restaurants et hôtels Banques, assurances, affaires Finance, insurance, real estate, etc. 19 162 22 131 26 445 27 030 29 145 47 767 55 005 63 341 ... immobilières Transport and communications 11 747 12 031 14 443 15 090 15 917 26 087 30 041 34 593 ... Transport(s) et communications Administrations publiques et Public administration and defense 21 682 23 250 27 041 30 416 29 802 48 843 56 244 64 768 ... défense Other services 11 206 13 605 15 715 17 079 17 319 28 385 32 687 45 849 ... Autres services Moins Services d’intermédiation Less Imputed Service Charges ... ... ... ... ... ... ... ... ... financière Gross domestic product at factor Produit intérieur brut aux couts des 193 464 230 747 275 207 299 256 303 305 421 283 485 125 566 852 ... cost / basic prices facteurs / prix de base Plus: Indirect Taxes / taxes on Plus taxes indirectes/impôts sur les 10 918 5 493 10 663 2 164 13 665 75 809 87 298 100 527 ... products, less subsidies produits, moins les subventions Expenditure on Gross domestic product at current purchaser's values Emploi du produit intérieur brut aux prix courants d'acquisition Kwacha(Millions) Kwacha(Millions) Consommation finale des Government final consumption 17 507 20 544 29 773 97 328 164 884 163 227 108 524 126 526 ... administrations publiques Private final consumption 181 181 208 128 256 154 246 623 237 092 317 938 458 284 534 304 ... Consommation finale privée Gross fixed capital formation 27 637 33 402 46 376 31 866 17 356 70 285 134 027 156 262 ... Formation brute de capital fixe Increase in inventories 5 345 7 003 5 695 6 589 7 483 14 735 15 933 18 576 ... Variation des stocks Exports of goods and services 42 517 63 068 71 353 68 750 66 148 132 707 133 320 155 435 ... Exportations de biens et services 226 Moins importations de biens et Less imports of goods and services 69 805 95 904 123 480 149 737 175 993 201 800 277 665 323 724 ... services GDP at purchasers' values 204 382 236 240 285 870 301 420 316 970 497 092 572 423 667 379 ... PIB aux prix d'acquisition Gross domestic product by kind of economic activity at constant Produit intérieur brut par branche d'activité economique aux prix constants prices Annual Growth Rates (%) Taux de croissance annuel (%) Agriculture -2.1 3.9 2.8 -7.8 -2.5 12.3 11.3 ... ... Agriculture Mining and quarrying -25.2 35.1 18.9 46.5 0.4 4.7 6.8 ... ... Industries extractives Manufacturing -0.1 16.9 3.0 4.3 42.2 3.6 12.2 ... ... Industries manufacturières Electricity, gas & water 5.8 3.0 13.4 3.1 7.2 5.4 3.9 ... ... Electricité, gaz et eau Construction 8.3 1.1 3.0 12.2 -24.2 9.2 8.1 ... ... Bâtiments et travaux publics Wholesale & retail trade, Commerce de gros et de 1.6 3.2 14.4 13.7 11.1 4.6 8.2 ... ... restaurants, hotels détail,restaurants et hôtels Banques, assurances, affaires Finance, insurance, real estate, etc. 6.3 1.9 4.4 5.8 15.3 6.3 7.9 ... ... immobilières Transport and communications 28.5 6.2 5.1 -6.2 11.0 5.8 22.5 ... ... Transport(s) et communications Administrations publiques et Public administartion and defense 13.5 -0.6 12.2 4.8 14.6 3.2 9.5 ... ... défense Other services 1.0 5.2 1.5 10.9 70.3 -25.2 -2.3 ... ... Autres services Moins Services d’intérmediation Less Imputed Service Charges 6.3 30.0 18.2 16.5 2.7 8.0 8.1 ... ... financière Gross domestic product at factor Produit intérieur brut aux couts des 2.9 3.8 4.8 1.6 15.3 1.8 9.5 ... ... cost / basic prices facteurs / prix de base Plus: Indirect Taxes / taxes on Plus taxes indirectes/impôts sur les 2.8 34.4 12.7 21.6 13.7 16.7 5.3 ... ... products, less subsidies produits, moins les subventions Gross domestic product at market Produit intérieur brut aux prix du 2.9 5.7 5.4 3.3 15.2 3.3 9.0 ... ... prices marché 2008: semi-final 2009: Provisional 2008: semi-définitif 2009: provisoire African Statistical Yearbook 2011 / Annuaire Statistique pour l'Afrique 2011
  • 228.
    Malawi Malawi Expenditure on Gross domestic product at constant purchasers' Emplois du produit intérieur brut aux prix constants d'acquisition values Annual Growth Rates (%) Taux de croissance annuel (%) Consommation finale des Government final consumption 29.3 6.0 22.2 4.1 21.7 5.4 7.7 ... ... administrations publiques Private final consumption 8.1 2.4 4.6 5.7 8.1 3.1 4.0 ... ... Consommation finale privée Gross fixed capital formation -20.5 21.2 34.5 38.3 50.0 0.5 23.6 ... ... Formation brute de capital fixe Exports of goods and services -1.0 37.0 4.2 0.6 28.0 0.0 21.2 ... ... Exportations de biens et services Moins importations de biens et Less imports of goods and services 28.3 21.5 11.4 22.1 22.1 0.0 13.1 ... ... services III INFLATION 2002 2003 2004 2005 2006 2007 2008 2009 2010 Annual Growth Rates (%) Taux de croissance annuel (%) All Item 17.3 9.6 11.4 15.5 13.9 7.9 8.7 8.4 7.4 Ensemble Food 16.0 5.3 7.5 17.2 15.5 7.4 7.0 7.4 5.1 Alimentation Health ... ... ... ... ... ... ... ... ... Santé Energy ... ... ... ... ... ... ... ... ... Energie Transport 11.1 19.6 17.8 13.5 13.7 10.5 17.2 12.1 12.7 Transport IV AGRICULTURAL PRODUCTION - PRODUCTION AGRICOLE 2002 2003 2004 2005 2006 2007 2008 2009 2010 Tons (Thousand) Tonnes (milliers) Maize, Tons (thousands) 1 557 1 983 1 733 1 259 2 611 3 226 2 634 3 582 ... Maïs, tonnes (milliers) Tobacco, Tons (thousands) 137 117 180 145 155 117 195 ... ... Tabac, tonnes (milliers) Tea, Tons (thousands) 39 42 50 38 39 48 42 53 ... Thé, tonnes (milliers) Sugar cane, Tons (thousands) 261 194 259 267 273 216 149 209 ... Cane à sucre, tonnes (milliers) Rice, Tons (thousands) 92 88 49 45 92 113 115 136 ... Riz, tonnes (milliers) V MINING PRODUCTION - PRODUCTION MINIERE 227 2002 2003 2004 2005 2006 2007 2008 2009 2010 Coal, metric tons (thousands) 62.9 81.4 51.8 51.9 60.4 58.6 60.6 ... ... Houilles, tonnes métriques (milliers) Gemstones, Kilograms 174.0 190.0 190.0 1 994.0 2 171.0 3 710.0 3 718.0 ... ... Pierres précieuses (kilogrammes) Cement, metric tons (thousands) 109.3 161.0 119.5 166.0 187.6 133.4 240.3 148.6 ... Ciments, tonnes métriques (milliers) VI ENERGY - ENERGIE 2002 2003 2004 2005 2006 2007 2008 2009 2010 Electricity - total hydro production, Électricité - production hydraulique 1 177.5 1 203.0 1 329.3 1 390.1 1 421.7 1 473.0 1 621.3 1 577.9 ... kilowatt hours (millions) totale, kilowatt-heures (millions) Electricity - total thermal production, Électricité - production thermique 7.0 2.0 5.0 5.0 5.0 5.0 5.0 5.0 ... kilowatt hours (millions) totale, kilowatt-heures (millions) Electricity - total production, self- Electricité - Production totale privée 93 98 95 95 95 95 95 95 ... producer (Million Kilowatt Hours) (million de kilowatt heures) Electricity - total production, public Electricité - Production totale 1 156 1 189 1 306 1 383 1 422 1 473 1 621 1 578 ... (Million Kilowatt Hours) publique (million de kilowatt heures) African Statistical Yearbook 2011 / Annuaire Statistique pour l'Afrique 2011
  • 229.
    Malawi Malawi VII TOURISM AND INFRASTRUCTURE - TOURISME ET INFRASTUCTURE 2002 2003 2004 2005 2006 2007 2008 2009 2010 Arrivals - Tourists (thousands) 382.64 424 427.356 437.718 637.772 735 742 ... ... Arrivées - touristes (milliers) Rooms in hotels and similar Chambres d'hotels et établissements establishments (thousands) assimilés (milliers) 59 21 21 ... ... ... ... ... ... Paved Road (% of total) 21 21 21 22 23 23 25 26 ... Routes asphaltées (% du total) Total Network (Railways-km) 15 451 15 451 15 451 15 451 15 451 15 451 15 451 15 451 ... Réseau total voies ferrées-Km Main Telephone Lines (per 1,000 Lignes téléphoniques fixes (pour 7 9 9 10 10 12 12 ... ... inhabitants) 1000 habitants) Mobile Cellular Subscribers (per Abonnés aux téléphones mobiles 9 12 22 43 43 73 120 ... ... 1,000 inhabitants) (pour 1000 habitants) VII FINANCIAL AND MONETARY STATISTICS - FINANCES ET STATISTIQUES MONETAIRES 2002 2003 2004 2005 2006 2007 2008 2009 2010 VII-1 Monetary Statistics VII-1 Statistiques monétaires Kwacha(Millions) Kwacha(Millions) Money supply (M1) 13 979 17 763 25 723 31 303 35 689 50 730 70 597 81 900 ... Masse monétaire (M1) Quasi-money 14 114 18 048 20 725 22 691 27 170 35 130 69 047 92 132 ... Quasi-monnaie of which Demand Deposit ... ... ... ... ... ... ... ... ... dont Monnaie scripturale Net foreign assets 3 397 4 454 6 107 11 460 19 300 28 034 19 667 - 2 279 ... Avoirs extérieurs nets Domestic credit 23 755 28 783 36 550 41 210 47 100 56 997 157 107 213 802 ... Crédit intérieur of which claims on private sector 7 363 9 809 13 926 17 502 27 747 33 988 68 144 95 044 ... dont créances sur le secteur privé of which Claims on government dont créances nettes sur le 15 711 18 694 22 322 23 399 18 121 19 164 82 919 112 517 ... sector, net gouvernement International reserves (millions of US Réserves internationales (millions de 161 122 128 159 134 217 243 149 ... $) $ EU) Average Exchange Rate (National Taux de change (moyen) (monnaie 76.69 97.43 108.90 118.42 136.01 139.96 140.52 141.17 ... Currency per us $) nationale par dollars) VII-2 Public Finance VII-2 Finances publiques Kwacha(Millions) Kwacha(Millions) Total Revenues and Grants 31 997 42 684 65 817 84 926 119 965 147 632 164 554 208 072 257 661 Recettes totales et dons Tax Revenue 20 382 27 251 36 902 49 798 59 884 77 321 96 387 107 300 143 400 Recettes fiscales Non Tax Revenue 2 471 4 758 5 852 7 011 7 431 6 974 8 567 10 867 25 373 Recettes non fiscales 228 Grants 9 144 10 675 23 063 28 117 52 650 63 337 59 600 89 905 88 888 Dons Total Expenditures and Net Lending 42 491 61 321 80 535 97 216 120 009 153 580 179 288 231 219 266 357 Dépenses totales et prêts nets Current expenditure 20 312 31 057 32 102 38 491 56 354 60 076 73 146 115 246 123 317 Dépenses courantes Of which Wages and Salaries 9 201 10 930 12 337 17 056 20 209 23 778 30 018 37 256 43 540 Dont rémunérations et salaires Capital expenditure 9 816 11 787 20 999 24 969 26 263 53 665 63 775 57 219 77 447 Dépenses d'équipement Net Lending 0 61 0 589 0 452 - 108 0 1 000 Prêts nets Fiscal Balance - 10 494 - 18 637 - 14 718 - 12 290 - 44 - 5 948 - 14 734 - 23 147 - 8 696 Solde global y compris les dons VII-3 Balance of Payments VII-3 Balance des paiements Kwacha(Millions) Kwacha(Millions) Trade balance - 13 895 - 24 400 - 33 889 - 59 369 - 67 499 - 75 753 - 67 316 - 88 566 ... Balance commerciale Services Balance - 12 680 - 14 545 - 18 522 - 25 384 - 28 120 - 32 230 - 33 579 - 33 666 ... Balance des services Net Income - 2 794 - 3 268 - 4 993 - 5 162 - 4 561 - 2 974 - 3 048 - 5 407 ... Revenus nets Current transfers, net total 623 611 1 889 9 227 10 600 10 908 11 226 10 738 ... Transferts courants Current account balance - 28 746 - 41 603 - 55 514 - 80 689 - 89 580 - 100 049 - 92 717 - 116 901 ... Solde du compte courant VII-4 External Debt and Financial Flows VII-4 Dette extérieure et flux financiers US $(Millions) $ E.U(Millions) Total external debt 2 857 2 904 2 956 2 969 452 518 683 900 1 010 Dette extérieure totale Private 0 0 0 0 0 0 0 0 0 Privée Public 2 857 2 904 2 956 2 969 452 518 683 900 1 010 Publique Total external debt service 85 95 103 103 86 16 13 12 13 Service de la dette extérieure Net Foreign Direct Investment Investissements étranger direct (flux 17 66 108 52 72 92 170 60 13 Inflows nets entrants) Net Total Official Development Aide publique au développement 378 518 506 573 698 744 924 772 13 assistance (nette totale) African Statistical Yearbook 2011 / Annuaire Statistique pour l'Afrique 2011
  • 230.
    Malawi Malawi 2002 2003 2004 2005 2006 2007 2008 2009 2010 Kwacha(Millions) Kwacha Exports, fob Exportations, fàb Exports - Total 31 713 42 252 54 420 59 733 73 804 99 804 123 399 166 551 ... Exportations - Total Main Products Principaux produits Tobacco 17 893 24 191 22 303 31 621 55 839 59 224 82 095 106 149 ... Tabac Tea 2 828 3 481 5 132 5 914 6 737 7 811 5 157 9 837 ... Thé Sugar 2 684 10 571 7 881 5 409 6 153 8 480 7 341 9 779 ... Sucre Cotton 261 582 2 224 1 847 1 832 3 091 3 070 3 320 ... Coton Nuts 378 1 132 1 581 1 489 3 189 3 347 1 503 3 915 ... Noix Main Destinations Principales destinations South Africa 48 847.3 7 864.8 7 787.6 11 349.9 20 216.8 18 019.4 11 379.8 15 359.2 ... Afrique du Sud USA 4 665.7 6 393.4 5 946.3 6 540.1 7 386.1 85 072.1 87 934.5 118 684.6 ... Etats-Unis Germany 3 321.0 3 654.7 3 973.7 4 502.8 9 525.4 6 980.9 7 215.8 9 739.1 ... Allemagne UK 2 905.0 3 821.6 5 205.9 6 834.1 12 136.9 8 000.5 8 269.7 11 161.5 ... Royaume-Uni Japan 1 238.0 2 879.9 1 134.2 1 015.8 464.1 631.0 750.3 1 012.6 ... Japon 2002 2003 2004 2005 2006 2007 2008 2009 2010 Imports, cif Importations, cif Imports - Total 53 657 76 650 101 555 140 179 162 505 156 387 278 477 255 118 ... Importations - Total (millions) 229 Principaux produits Main Products Fertilizer 3 710 4 556 6 980 15 386 8 550 26 509 51 288 23 795 ... Engrais Diesel and other 2 574 4 211 5 954 7 868 9 742 11 427 16 412 14 170 ... Diesel et autres Petrol 1 828 2 761 3 500 3 389 4 389 6 011 8 198 7 957 ... Essence Paraffin 434 664 859 1 137 942 1 317 1 521 1 149 ... Paraffine Coal 91 86 221 235 163 120 102 1 248 ... Charbon Main Origin Principales provenances South Africa 22 272.3 30 621.4 32 047.5 45 224.4 59 304.7 55 537.9 78 484.1 71 900.7 ... Afrique du Sud Zimbabwe 3 117.6 4 996.3 4 807.2 10 704.3 5 529.4 7 168.2 5 050.1 4 626.5 ... Zimbabwe UK 2 805.7 4 078.6 5 249.5 6 571.8 9 623.3 9 010.9 30 447.3 27 893.3 ... Royaume-Uni Japan 1 596.6 3 202.4 3 914.0 1 570.9 1 476.5 2 080.1 4 049.8 3 710.1 ... Japon Germany 504.1 1 099.1 1 112.3 3 903.3 2 592.8 3 419.1 6 656.7 6 098.3 ... Allemagne African Statistical Yearbook 2011 / Annuaire Statistique pour l'Afrique 2011
  • 231.
    Mali Mali AREA (KM 2) 1 240 192 SUPERFICIE (KM 2) CAPITAL CITY Bamako Bamako CAPITALE CURRENCY CFA Franc Franc CFA MONNAIE I SOCIAL AND DEMOGRAPHIC INDICATORS — INDICATEURS DEMOGRAPHIQUES ET SOCIAUX 2002 2003 2004 2005 2006 2007 2008 2009 2010 Population Population Population au milieu de l'année - Mid-year population - Total (Million) 10.8 11.1 11.4 11.7 12.1 12.4 12.7 14.5 ... Total (million) Population au milieu de l'année - Mid-year population - Urban (%) 29.4 30.1 30.8 31.6 32.4 33.1 33.9 33.9 ... Urbaine (%) Female (%) 50.5 50.5 50.5 50.5 50.5 50.5 50.5 50.5 ... Femme (%) Population by Age Group Population par groupe d'âge 0-14 5298 604 5444 498 5595 546 5748 885 5905 000 6064 730 6228 780 7113 402 ... 0-14 15-64 5136 402 5277 830 5424 254 5572 899 5724 235 5879 075 6038 103 6895 660 ... 15-64 65+ 378 472 388 893 399 682 410 635 421 786 433 195 444 913 508 101 ... 65+ Active Population (000) 4 287.3 4 405.4 4 527.6 4 651.7 4 778.0 4 907.2 5 040.0 5 176.3 ... Population active (000) Female (%) ... ... ... 34.4 34.4 34.4 34.4 34.4 ... Femme (%) Taux brut de natalité - Total (par Crude birth rate - Total (per 1000) ... ... ... 42.5 42.1 41.9 41.7 44.4 ... 1000) Taux brut de mortalité - Total (par Crude death rate - Total (per 1000) ... ... ... 11.6 11.3 10.9 10.6 10.4 ... 1000) Life expectancy at birth - Total Espérance de vie à la naissance - ... ... ... 57.8 58.3 58.8 59.3 59.8 ... (years) Total (années) Net reproduction rate - (per Taux net de reproduction - (par ... ... ... 2.4 ... ... ... ... ... woman) femme) Indice synthétique de fécondité - Total fertility rate - (p woman) y (per ) 6.8 6.8 6.8 6.8 6.6 6.6 6.6 6.6 ... (par femme) Education Enseignement Teaching staff at first level - Total Personnel enseignant - 1er degré - 29.65 30.3 31.6 40.6 40.6 44.0 46.9 50.5 ... (thousands) Total (milliers) Teaching staff at second level - Total Personnel enseignant - 2ème degré - 2.37 2.9 3.0 2.6 2.7 4.2 5.7 7.2 ... 230 (thousands) Total (milliers) Teaching staff at third level - Total Personnel enseignant - 3ème degré - 0.9 1.0 1.0 0.8 0.6 0.6 0.5 1.3 ... (thousands) Total (milliers) First level student enrollment - Total Elèves inscrits - 1er degré - Total 1 452 1 532 1 665 1 823 1 963 2 105 2 245 2 388 ... (thousands) (milliers) First level student enrollment - Elèves inscrits - 1er degré - Femmes 520 553 602 654 709 763 977 1 039 ... Female (thousands) (milliers) Second level student enrollment - Elèves inscrits - 2ème degré - Total 96 69 64 116 125 146 155 148 ... Total (thousands) (milliers) Second level student enrollment - Elèves inscrits - 2ème degré - ... ... ... ... ... ... ... ... ... Female (thousands) Femmes (milliers) Third level student enrollment - Total Elèves inscrits - 3ème degré - Total 27.4 30.9 28.3 28.5 38.6 50.7 56.8 63.6 ... (thousands) (milliers) Third level student enrollment - Elèves inscrits - 3ème degré - 7.5 8.7 7.9 8.0 9.5 12.5 14.5 16.0 ... Female (thousands) Femmes (milliers) Public expenditure on education (% Dépenses publiques consacrées à 11.6 13.9 15.1 15.4 16.9 16.8 16.8 ... ... of budget) l'enseignement (% du budget) Health Santé Hospital beds - Total (per 10 000 Nombre de lits d'hôpitaux - Total 15 15 14 13 14 13 13 13 ... population) (pour 10 000) Nurses - Total (per 10 000 Nombre d'infirmières - Total (pour 12 11 11 11 20 20 20 20 ... population) 10 000) Physicians - Total (per 10 000 Nombre de médecins - Total (pour 1 1 1 1 1 1 1 1 ... population) 10 000) Public expenditure on Health (% of Dépenses publiques consacrées à la 7 7 7 7 10 11 11 11 ... budget) santé (% du budget) African Statistical Yearbook 2011 / Annuaire Statistique pour l'Afrique 2011
  • 232.
    Mali Mali II NATIONAL ACCOUNTS — COMPTES NATIONAUX 2002 2003 2004 2005 2006 2007 2008 2009 2010 Gross domestic product by kind of economic activity at current prices Produit intérieur brut par branche d'activité économique aux prix courants CFA Franc (Billions) Franc CFA (Milliards) Agriculture 666 865 901 1 001 1 064 1 115 1 412 1 486 1 642 Agriculture Mining and quarrying 239 182 162 205 240 229 242 284 256 Industries extractives Manufacturing 171 155 248 262 259 236 207 219 230 Industries manufacturières Electricity, gas & water 37 40 43 50 60 66 75 83 91 Electricité, gaz et eau Construction 119 118 116 125 145 169 191 216 238 Bâtiments et travaux publics Wholesale & retail trade, Commerce de gros et de détail, 274 315 323 364 421 490 560 611 658 restaurants, hotels restaurants et hôtels Banques, assurances, affaires Finance, insurance, real estate, etc. 17 18 19 25 27 27 30 32 33 immobilières Transport and communications 97 105 115 131 156 192 221 233 247 Transport(s) et communications Administrations publiques et Public administration and defense 249 275 289 309 325 332 359 378 399 défense Other services 157 162 168 201 216 237 263 284 300 Autres services Moins Services d’intermédiation Less Imputed Service Charges - 12 - 12 - 13 - 14 - 14 - 13 - 15 - 15 - 16 financière Gross domestic product at factor Produit intérieur brut aux couts des 2 012 2 223 2 372 2 660 2 899 3 079 3 545 3 810 4 078 cost / basic prices facteurs / prix de base Plus: Indirect Taxes / taxes on Plus taxes indirectes/impôts sur les 211 231 260 234 303 345 368 423 480 products, less subsidies produits, moins les subventions Expenditure on Gross domestic product at current purchaser's values Emploi du produit intérieur brut aux prix courants d'acquisition CFA Franc( Billions) Franc CFA (Milliards) Consommation finale des Government final consumption 368 445 473 490 553 597 688 734 788 administrations publiques Private final consumption 1 510 1 554 1 797 1 995 2 091 2 215 2 495 2 633 2 812 Consommation finale privée Gross fixed capital formation 440 443 447 447 529 664 716 862 968 Formation brute de capital fixe Increase in inventories - 74 197 131 190 123 74 75 37 58 Variation des stocks Exports of goods and services 660 670 643 724 958 996 896 914 1 037 Exportations de biens et services Moins importations de biens et 231 Less imports of goods and services 681 855 858 953 1 053 1 122 957 947 1 104 services GDP at purchasers' values 2 223 2 454 2 632 2 894 3 201 3 425 3 913 4 233 4 558 PIB aux prix d'acquisition Gross domestic product by kind of economic activity at constant Produit intérieur brut par branche d'activité economique aux prix constants prices Annual Growth Rates (%) Taux de croissance annuel (%) Agriculture -3.2 19.5 -4.1 6.6 4.3 2.5 13.2 5.6 7.7 Agriculture Mining and quarrying 22.5 -18.8 -15.2 19.3 17.8 -8.4 -6.4 1.5 -16.2 Industries extractives Manufacturing 24.2 -5.6 19.0 0.3 0.9 -12.0 -14.4 1.0 2.6 Industries manufacturières Electricity, gas & water 15.1 11.0 11.6 10.2 10.0 9.7 10.0 10.0 10.0 Electricité, gaz et eau Construction 4.4 4.4 8.0 4.0 3.0 8.7 4.5 6.0 7.0 Bâtiments et travaux publics Wholesale & retail trade, Commerce de gros et de -1.6 9.2 6.1 1.4 14.0 12.0 4.4 4.5 5.4 restaurants, hotels détail,restaurants et hôtels Banques, assurances, affaires Finance, insurance, real estate, etc. 0.3 7.7 10.7 -0.5 6.0 5.0 2.0 3.5 3.5 immobilières Transport and communications -2.7 10.6 14.7 14.8 16.0 20.9 10.0 1.9 5.0 Transport(s) et communications Administrations publiques et Public administartion and defense 4.1 3.5 3.9 7.3 2.5 1.2 2.0 1.9 3.0 défense Other services 3.3 4.9 7.8 -0.3 4.0 8.0 1.0 5.3 4.0 Autres services Moins Services d’intérmediation Less Imputed Service Charges 1.3 7.8 11.2 0.0 4.3 -12.3 5.5 4.0 5.0 financière Gross domestic product at factor Produit intérieur brut aux couts des 3.5 7.2 1.7 6.2 7.2 3.9 5.5 4.4 4.5 cost / basic prices facteurs / prix de base Plus: Indirect Taxes / taxes on Plus taxes indirectes/impôts sur les 14.5 12.5 8.8 5.6 -15.0 9.5 -2.0 5.9 4.3 products, less subsidies produits, moins les subventions Gross domestic product at market Produit intérieur brut aux prix du 4.3 7.6 2.3 6.1 5.3 4.3 5.0 4.5 4.5 prices marché 2008: semi-final 2009: Provisional 2010:Estimated 2008: semi-définitif 2009: provisoire 2010:Estimée African Statistical Yearbook 2011 / Annuaire Statistique pour l'Afrique 2011
  • 233.
    Mali Mali Expenditure on Gross domestic product at constant purchasers' Emplois du produit intérieur brut aux prix constants d'acquisition values Annual Growth Rates (%) Taux de croissance annuel (%) Consommation finale des Government final consumption 2.4 18.5 7.8 2.8 9.7 4.3 8.0 3.0 5.0 administrations publiques Private final consumption -0.8 -3.4 15.5 -4.6 3.2 4.5 1.9 3.1 4.0 Consommation finale privée Gross fixed capital formation 0.3 7.0 7.9 6.4 4.0 15.2 -0.8 13.3 7.7 Formation brute de capital fixe Exports of goods and services 20.3 1.0 -6.2 12.3 1.3 0.5 -13.0 1.0 5.0 Exportations de biens et services Moins importations de biens et Less imports of goods and services -8.3 3.4 -0.9 1.4 1.8 1.2 -19.1 -3.4 6.0 services III INFLATION 2002 2003 2004 2005 2006 2007 2008 2009 2010 Annual Growth Rates (%) Taux de croissance annuel (%) All Item 5.1 -1.3 -3.1 6.3 1.6 1.4 9.2 2.2 1.2 Ensemble Food 7.1 -4.1 -7.0 11.4 0.0 1.9 13.0 4.3 3.4 Alimentation Health 5.0 10.1 8.5 -2.9 0.6 0.7 1.0 5.8 -0.9 Santé Energy 6.8 -0.2 -1.6 -2.3 2.4 2.0 5.2 0.6 -2.8 Energie Transport 2.1 4.2 3.1 7.7 6.5 2.1 4.6 -2.1 2.1 Transport IV AGRICULTURAL PRODUCTION - PRODUCTION AGRICOLE 2002 2003 2004 2005 2006 2007 2008 2009 2010 Tons (Thousand) Tonnes (milliers) Cotton seed, Tons (thousands) 571 440 621 590 417 242 210 246 ... Graines de coton, tonnes (milliers) Rice, Tons (thousands) 940 710 967 851 946 1 003 1 608 1 704 ... Riz paddy, tonnes (milliers) Millet, Tons (thousands) 793 795 1 123 975 1 158 1 217 1 364 1 441 ... Mil, tonnes (milliers) Sorghum, Tons (thousands) 518 642 764 673 629 661 1 049 1 107 ... Sorgho, tonnes (milliers) Maize, Tons (thousands) 365 455 460 635 707 690 740 839 ... Maïs, tonnes (milliers) V MINING PRODUCTION - PRODUCTION MINIERE 232 2002 2003 2004 2005 2006 2007 2008 2009 2010 Gold ores and concentrates Minerais d'or et concentrés 66 068.0 53 597.0 44 311.7 52 120.4 61 346.0 55 600.0 51 900.0 49 500.0 ... (Kilograms) (Kilogrammes) Silver ores and concentrates 3 000.0 3 000.0 3 000.0 ... ... ... ... ... ... Minerais d'argent et concentrés (Kilograms) (Kilogrammes) Salt and pure sodium chloride, Sel et chlorure de sodium pur, 6.0 6.0 6.0 6.0 6.0 6.0 ... ... ... metric tons (thousands) tonnes métriques (milliers) VI ENERGY - ENERGIE 2002 2003 2004 2005 2006 2007 2008 2009 2010 Electricity - total hydro production, Électricité - production hydraulique 238.0 236.0 250.0 258.0 266.0 271.0 ... ... ... kilowatt hours (millions) totale, kilowatt-heures (millions) Electricity - total thermal production, Électricité - production thermique 179.0 213.0 215.0 217.0 211.0 211.0 211.0 211.0 ... kilowatt hours (millions) totale, kilowatt-heures (millions) Electricity - total production, self- Electricité - Production totale privée 45 45 45 45 33 33 33 33 ... producer (Million Kilowatt Hours) (million de kilowatt heures) Electricity - total production, public Electricité - Production totale 372 404 420 430 444 449 ... ... ... (Million Kilowatt Hours) publique (million de kilowatt heures) African Statistical Yearbook 2011 / Annuaire Statistique pour l'Afrique 2011
  • 234.
    Mali Mali VII TOURISM AND INFRASTRUCTURE - TOURISME ET INFRASTUCTURE 2002 2003 2004 2005 2006 2007 2008 2009 2010 Arrivals - Tourists (thousands) 95.851 110.365 120.141 139.448 152.66 163.826 189.508 65.957 ... Arrivées - touristes (milliers) Rooms in hotels and similar Chambres d'hotels et établissements establishments (thousands) assimilés (milliers) 3 4 5 5 6 ... ... ... ... Paved Road (% of total) 17 22 30 26 25 20 30 32 ... Routes asphaltées (% du total) Total Network (Railways-km) 19 342 15 519 11 043 13 027 14 784 18 515 12 729 12 229 ... Réseau total voies ferrées-Km Main Telephone Lines (per 1,000 Lignes téléphoniques fixes (pour 5 6 6 7 8 8 7 7 ... inhabitants) 1000 habitants) Mobile Cellular Subscribers (per Abonnés aux téléphones mobiles 4 23 39 72 143 240 327 365 ... 1,000 inhabitants) (pour 1000 habitants) VII FINANCIAL AND MONETARY STATISTICS - FINANCES ET STATISTIQUES MONETAIRES 2002 2003 2004 2005 2006 2007 2008 2009 2010 VII-1 Monetary Statistics VII-1 Statistiques monétaires CFA Franc (Millions) Franc CFA (Millions) Money supply (M1) 486 060 614 191 569 671 642 376 694 478 704 150 734 908 800 453 863 049 Masse monétaire (M1) Quasi-money 136 997 173 357 197 103 199 543 197 850 310 612 264 404 344 368 341 325 Quasi-monnaie of which Demand Deposit ... ... ... ... ... ... ... ... ... dont Monnaie scripturale Net foreign assets 310 313 444 542 393 944 439 769 548 176 565 170 524 423 769 405 730 517 Avoirs extérieurs nets Domestic credit 384 446 409 802 455 845 489 589 418 424 489 914 516 194 453 007 545 632 Crédit intérieur of which claims on private sector 412 223 482 943 515 550 515 983 527 756 619 161 671 225 740 711 782 677 dont créances sur le secteur privé of which Claims on government dont créances nettes sur le - 27 776 - 73 141 - 59 705 - 26 394 - 109 333 - 129 247 - 155 031 - 287 704 - 237 045 sector, net gouvernement International reserves (millions of US Réserves internationales (millions de 594 952 861 855 970 1 087 1 072 1 604 1 295 $) $ EU) Average Exchange Rate (National Taux de change (moyen) (monnaie 696.99 581.20 528.29 527.47 522.89 479.27 447.81 472.19 495.28 Currency per us $) nationale par dollars) VII-2 Public Finance VII-2 Finances publiques CFA Franc (Millions) Franc CFA (Millions) Total Revenues and Grants 423 000 496 700 515 300 576 300 1 740 600 668 300 741 500 901 200 951 800 Recettes totales et dons Tax Revenue 306 000 349 100 393 300 446 200 470 200 487 200 586 100 603 400 674 400 Recettes fiscales Non Tax Revenue 31 200 35 200 18 700 15 100 25 900 22 200 21 200 26 000 26 900 Recettes non fiscales Grants 85 800 112 400 103 300 115 000 1 244 500 158 900 134 200 200 300 179 000 Dons 233 Total Expenditures and Net Lending 540 500 551 500 625 700 712 700 768 600 845 500 828 200 1 099 100 1 126 500 Dépenses totales et prêts nets Current expenditure 236 200 251 300 300 800 324 020 340 700 384 600 417 300 626 100 672 000 Dépenses courantes Of which Wages and Salaries 93 500 106 200 121 700 137 800 147 900 162 800 186 000 217 100 235 700 Dont rémunérations et salaires Capital expenditure 203 000 201 600 242 200 268 100 329 400 395 600 294 900 462 000 443 200 Dépenses d'équipement Net Lending - 4 900 - 3 900 - 9 000 22 700 - 6 000 - 47 600 7 600 11 000 11 300 Prêts nets Fiscal Balance - 117 500 - 54 800 - 110 400 - 136 400 972 000 - 177 200 - 86 700 - 197 900 - 174 700 Solde global y compris les dons VII-3 Balance of Payments VII-3 Balance des paiements CFA Franc (Millions) Franc CFA (Millions) Trade balance 113 370 - 35 160 - 61 515 - 76 265 39 201 - 138 860 - 284 672 - 121 400 - 207 600 Balance commerciale Services Balance - 151 667 - 149 936 - 153 552 - 165 492 - 188 863 - 191 654 - 255 227 - 212 400 - 285 700 Balance des services Net Income - 167 410 - 92 948 - 102 931 - 109 159 - 134 643 - 139 679 - 139 986 - 170 700 - 169 400 Revenus nets Current transfers, net total 101 987 120 554 101 946 120 033 169 999 191 680 203 697 194 600 203 100 Transferts courants Current account balance - 103 720 - 157 490 - 216 052 - 230 883 - 114 306 - 278 513 - 476 188 - 309 900 - 459 600 Solde du compte courant VII-4 External Debt and Financial Flows VII-4 Dette extérieure et flux financiers US $ (Millions) $ E.U (Millions) Total external debt 1 746 1 556 1 639 1 617 629 851 810 932 ... Dette extérieure totale Private 0 0 0 0 0 0 0 0 ... Privée Public 1 746 1 556 1 639 1 617 629 851 810 932 ... Publique Total external debt service 16 15 16 16 14 11 13 13 15 Service de la dette extérieure Net Foreign Direct Investment Investissements étranger direct (flux 258 94 99 167 95 133 218 310 212 Inflows nets entrants) Net Total Official Development Aide publique au développement 480 559 588 704 824 1 020 964 ... ... assistance (nette totale) African Statistical Yearbook 2011 / Annuaire Statistique pour l'Afrique 2011
  • 235.
    Mali Mali 2002 2003 2004 2005 2006 2007 2008 2009 2010 CFA Franc (Millions) Franc CFA Exports, fob Exportations, fàb Exports - Total 609 944 539 262 515 835 580 673 810 671 745 860 939 129 918 200 ... Exportations - Total Main Products Principaux produits Gold 402 563 330 073 270 567 355 504 587 486 515 178 645 871 637 400 724 700 Or Cotton 130 946 194 850 181 355 139 656 141 027 110 889 91 921 62 750 81 200 Coton Live Animals 27 327 24 533 22 905 27 829 30 204 37 601 51 800 41 200 44 200 Animaux vivants ... ... ... ... ... ... ... ... ... ... ... ... ... ... ... ... ... ... Main Destinations Principales destinations Switzerland 354 646.0 339 808.0 110 692.0 173 400.0 11 767.0 31 200.0 22 120.0 62 460.7 ... Suisse South Africa 1 258.0 10 164.0 164 564.0 199 497.0 563 451.0 459 740.0 624 733.0 573 085.2 ... Afrique du Sud Senegal 21 912.0 16 735.0 32 573.0 39 225.0 21 103.0 29 085.0 58 914.0 47 988.6 ... Sénégal Ivory Coast 18 290.0 13 345.0 24 567.0 7 433.0 9 794.0 17 122.0 22 084.0 16 346.8 ... Côte d'Ivoire China 1 354.0 6 447.0 24 743.0 33 191.0 49 124.0 15 255.0 15 947.0 14 987.2 ... Chine 2002 2003 2004 2005 2006 2007 2008 2009 2010 Imports, cif Importations, cif 234 Imports - Total 639 873 727 980 732 777 825 063 950 997 1 088 051 1 489 974 1 176 904 ... Importations - Total (millions) Principaux produits Main Products Petroleum Products 112 893 130 275 152 155 196 047 232 987 241 533 318 041 256 700 359 000 Produits petroliers Building Materials 79 694 98 669 107 483 109 593 132 298 157 468 232 510 207 600 243 400 Matériaux de constructions Chemical products 129 146 127 010 111 935 116 006 116 848 149 272 190 709 152 600 176 500 Produits chimiques Vehicles and machinery 153 091 196 727 157 876 148 856 209 204 263 311 376 608 261 000 328 400 Véhicules et machines Food 82 740 124 346 98 125 130 771 171 959 161 105 186 302 181 900 198 200 Produits alimentaires Main Origin Principales provenances France 119 676.0 133 286.0 114 440.0 102 337.0 102 822.0 156 292.0 207 107.0 133 561.2 ... France Senegal 61 709.0 73 330.0 88 016.0 93 365.0 115 366.0 207 269.0 256 691.0 162 307.2 ... Sénégal Ivory Coast 138 530.0 64 566.0 67 473.0 83 398.0 103 352.0 132 872.0 154 689.0 142 778.2 ... Côte-d'Ivoire Togo 32 270.0 86 970.0 61 273.0 53 215.0 47 155.0 41 886.0 20 114.0 30 520.7 ... Togo Benin 6 370.0 35 489.0 53 413.0 75 528.0 85 666.0 46 779.0 33 269.0 63 820.2 ... Bénin African Statistical Yearbook 2011 / Annuaire Statistique pour l'Afrique 2011
  • 236.
    Mauritania Mauritanie AREA (KM 2) 1 025 520 SUPERFICIE (KM 2) CAPITAL CITY Nouakchott Nouakchott CAPITALE CURRENCY Ouguiya Ouguiya MONNAIE I SOCIAL AND DEMOGRAPHIC INDICATORS — INDICATEURS DEMOGRAPHIQUES ET SOCIAUX 2002 2003 2004 2005 2006 2007 2008 2009 2010 Population Population Population au milieu de l'année - Mid-year population - Total (Million) 2.7 2.7 2.8 2.9 3.0 3.1 3.2 3.3 3.3 Total (million) Population au milieu de l'année - Mid-year population - Urban (%) 42.7 44.0 45.3 46.7 48.0 49.3 50.7 52.0 53.3 Urbaine (%) Female (%) 50.3 50.2 50.2 50.1 50.0 49.9 49.9 49.8 49.8 Femme (%) Population by Age Group Population par groupe d'âge 0-14 1155 214 1187 750 1219 869 1251 267 1281 509 1310 618 1339 005 1366 618 1393 609 0-14 15-64 1367 421 1414 515 1463 193 1513 519 1565 649 1619 589 1675 012 1731 551 1789 045 15-64 65+ 139 835 139 765 140 000 140 941 142 659 145 060 148 321 152 599 157 973 65+ Active Population (000) ... ... 825.6 ... ... ... 902.2 ... ... Population active (000) Female (%) ... ... 39.1 ... ... ... 34.4 ... ... Femme (%) Taux brut de natalité - Total (par Crude birth rate - Total (per 1000) 35.4 35.4 35.3 35.0 34.7 34.3 34.1 33.7 33.4 1000) Taux brut de mortalité - Total (par Crude death rate - Total (per 1000) 10.9 10.6 10.4 10.2 9.6 9.7 9.5 9.3 9.1 1000) Life expectancy at birth - Total Espérance de vie à la naissance - 58.3 58.7 59.1 59.5 59.9 60.3 60.7 61.1 61.5 (years) Total (années) Taux net de reproduction - (par Net reproduction rate - (per woman) ... ... ... 1.8 ... ... ... ... ... femme) Indice synthétique de fécondité - Total fertility rate - (p woman) y (per ) 4.7 4.7 4.8 4.7 4.6 4.6 4.5 4.4 ... (par femme) Education Enseignement Teaching staff at first level - Total Personnel enseignant - 1er degré - 9.60 9.6 10.7 11.0 11.3 11.4 12.7 ... ... (thousands) Total (milliers) Teaching staff at second level - Total Personnel enseignant - 2ème degré - 3.13 3.2 3.2 3.4 3.6 4.1 4.6 ... ... (thousands) Total (milliers) 235 Teaching staff at third level - Total Personnel enseignant - 3ème degré - 0.3 ... ... 0.3 ... ... ... ... ... (thousands) Total (milliers) First level student enrollment - Total Elèves inscrits - 1er degré - Total 376 394 434 444 466 484 474 ... ... (thousands) (milliers) First level student enrollment - Elèves inscrits - 1er degré - Femmes 183 194 215 222 232 242 238 ... ... Female (thousands) (milliers) Second level student enrollment - Elèves inscrits - 2ème degré - Total 80 81 89 93 97 99 97 ... ... Total (thousands) (milliers) Second level student enrollment - Elèves inscrits - 2ème degré - 34 36 40 43 44 46 45 ... ... Female (thousands) Femmes (milliers) Third level student enrollment - Total Elèves inscrits - 3ème degré - Total 8.5 11.2 9.4 12.4 13.7 15.0 ... ... ... (thousands) (milliers) Third level student enrollment - Elèves inscrits - 3ème degré - ... ... ... ... ... ... ... ... ... Female (thousands) Femmes (milliers) Public expenditure on education (% Dépenses publiques consacrées à ... ... ... ... ... ... ... ... ... of budget) l'enseignement (% du budget) Health Santé Hospital beds - Total (per 10 000 Nombre de lits d'hôpitaux - Total ... ... 14 13 12 14 14 ... ... population) (pour 10 000) Nurses - Total (per 10 000 Nombre d'infirmières - Total (pour ... 29 44 56 58 59 53 ... ... population) 10 000) Physicians - Total (per 10 000 Nombre de médecins - Total (pour ... 6 15 ... 14 14 14 ... ... population) 10 000) Public expenditure on Health (% of Dépenses publiques consacrées à la 6 4 4 5 5 ... ... ... ... budget) santé (% du budget) African Statistical Yearbook 2011 / Annuaire Statistique pour l'Afrique 2011
  • 237.
    Mauritania Mauritanie II NATIONAL ACCOUNTS — COMPTES NATIONAUX 2002 2003 2004 2005 2006 2007 2008 2009 2010 Gross domestic product by kind of economic activity at current prices Produit intérieur brut par branche d'activité économique aux prix courants Ouguiya(Millions) Ouguiya(Millions) Agriculture 73 689 84 724 85 433 196 465 223 053 263 626 146 990 149 328 ... Agriculture Mining and quarrying 36 208 28 111 47 264 77 134 97 252 140 917 187 159 145 562 ... Industries extractives Manufacturing 15 016 15 097 6 933 28 432 40 123 49 865 29 615 30 082 ... Industries manufacturières Electricity, gas & water 2 600 3 419 3 192 7 477 150 628 69 496 57 219 34 940 ... Electricité, gaz et eau Construction 24 237 25 978 35 528 35 081 49 235 55 544 42 180 41 181 ... Bâtiments et travaux publics Wholesale & retail trade, restaurants, Commerce de gros et de détail, 39 678 43 888 47 134 55 405 69 888 95 088 85 293 81 113 ... hotels restaurants et hôtels Banques, assurances, affaires Finance, insurance, real estate, etc. ... ... ... ... ... ... ... ... ... immobilières Transport and communications 17 595 19 783 23 129 31 631 36 071 44 641 36 309 35 334 ... Transport(s) et communications Administrations publiques et Public administration and defense 38 005 41 479 47 728 48 720 60 090 61 061 111 969 116 834 ... défense Other services 48 796 57 052 54 552 68 967 77 794 80 108 82 535 92 171 ... Autres services Moins Services d’intermédiation Less Imputed Service Charges - 9 925 - 11 733 - 9 062 - 12 501 - 10 888 - 11 992 ... ... ... financière Gross domestic product at factor cost Produit intérieur brut aux couts des 285 899 307 798 341 831 536 811 793 246 848 354 779 269 726 545 ... / basic prices facteurs / prix de base Plus: Indirect Taxes / taxes on Plus taxes indirectes/impôts sur les 25 188 29 020 40 454 45 049 54 704 66 380 75 549 66 925 ... products, less subsidies produits, moins les subventions Expenditure on Gross domestic product at current purchaser's values Emploi du produit intérieur brut aux prix courants d'acquisition Ouguiya(Millions) Ouguiya(Millions) Consommation finale des Government final consumption 69 976 101 126 75 814 146 082 171 349 165 275 125 218 127 497 ... administrations publiques Private final consumption 229 812 244 881 291 296 282 598 380 652 414 789 667 897 589 487 ... Consommation finale privée Gross fixed capital formation 68 892 92 945 198 790 320 150 224 000 257 340 251 136 219 495 ... Formation brute de capital fixe Increase in inventories 602 - 598 - 23 602 128 431 128 288 278 460 ... ... ... Variation des stocks Exports of goods and services 101 066 86 960 152 411 185 008 408 593 326 663 465 067 388 691 ... Exportations de biens et services 236 Moins importations de biens et Less imports of goods and services 159 261 188 496 312 424 480 409 464 932 527 793 654 500 531 700 ... services GDP at purchasers' values 311 087 336 818 382 285 581 860 847 950 914 734 854 818 793 470 ... PIB aux prix d'acquisition Gross domestic product by kind of economic activity at constant prices Produit intérieur brut par branche d'activité economique aux prix constants Annual Growth Rates (%) Taux de croissance annuel (%) Agriculture -9.4 4.5 -4.5 4.5 0.0 4.6 8.1 1.5 ... Agriculture Mining and quarrying -3.3 6.3 18.2 -7.7 6.5 14.7 7.7 -2.0 ... Industries extractives Manufacturing -4.5 -1.0 10.4 -11.7 0.3 6.6 0.8 -0.9 ... Industries manufacturières Electricity, gas & water ... ... ... ... ... -67.3 -14.5 -11.3 ... Electricité, gaz et eau Construction 14.6 5.5 2.1 17.7 1.0 2.5 -10.7 -10.0 ... Bâtiments et travaux publics Wholesale & retail trade, restaurants, Commerce de gros et de 2.0 5.2 6.6 3.4 6.2 4.4 3.3 -7.2 ... hotels détail,restaurants et hôtels Banques, assurances, affaires Finance, insurance, real estate, etc. ... ... ... ... ... ... ... ... ... immobilières Transport and communications 29.5 3.4 30.0 -3.6 7.4 9.1 9.8 -3.4 ... Transport(s) et communications Administrations publiques et Public administartion and defense 5.0 7.9 -2.8 13.9 3.4 2.9 3.0 -0.7 ... défense Other services 5.5 5.7 -1.6 -8.1 4.7 4.4 4.1 9.0 ... Autres services Moins Services d’intérmediation Less Imputed Service Charges 5.4 5.2 -12.8 ... ... ... ... ... ... financière Gross domestic product at factor cost Produit intérieur brut aux couts des 1.4 5.1 4.7 3.8 11.8 0.5 3.6 -1.1 ... / basic prices facteurs / prix de base Plus: Indirect Taxes / taxes on Plus taxes indirectes/impôts sur les -2.5 11.1 30.9 4.9 8.6 6.4 4.2 -0.9 ... products, less subsidies produits, moins les subventions Gross domestic product at market Produit intérieur brut aux prix du 1.1 5.6 6.7 3.9 11.4 1.0 3.7 -1.1 ... prices marché 2008: semi-final 2009: Provisional 2008: semi-définitif 2009: provisoire African Statistical Yearbook 2011 / Annuaire Statistique pour l'Afrique 2011
  • 238.
    Mauritania Mauritanie Expenditure on Gross domestic product at constant purchasers' values Emplois du produit intérieur brut aux prix constants d'acquisition Annual Growth Rates (%) Taux de croissance annuel (%) Consommation finale des Government final consumption 15.1 51.9 -17.9 1.7 18.4 -1.9 -4.9 -1.2 ... administrations publiques Private final consumption -13.7 -1.0 23.5 17.2 10.3 13.3 17.1 -11.0 ... Consommation finale privée Gross fixed capital formation 16.6 19.1 4.1 -11.1 -21.5 128.8 -7.2 59.8 ... Formation brute de capital fixe Exports of goods and services -1.8 -17.3 15.2 10.1 28.6 -0.1 4.3 -7.9 ... Exportations de biens et services Moins importations de biens et Less imports of goods and services -8.4 6.0 13.7 14.8 10.1 51.6 9.2 8.9 ... services III INFLATION 2002 2003 2004 2005 2006 2007 2008 2009 2010 Annual Growth Rates (%) Taux de croissance annuel (%) All Item 5.4 5.3 10.5 12.1 6.3 7.3 7.3 2.2 5.0 Ensemble Food ... ... 10.4 13.9 5.4 9.7 9.6 2.6 5.9 Alimentation Health ... ... 6.6 18.7 11.6 7.5 0.6 3.3 1.1 Santé Energy ... ... 0.7 10.6 12.0 11.6 14.2 -9.4 3.2 Energie Transport ... ... 1.9 5.5 8.5 0.6 1.9 -0.9 2.2 Transport IV AGRICULTURAL PRODUCTION - PRODUCTION AGRICOLE 2002 2003 2004 2005 2006 2007 2008 2009 2010 Tons (Thousand) Tonnes (milliers) Millet and sorghum, Tons 58 79 84 20 86 79 81 ... ... Mil et sorgho, tonnes (milliers) (thousands) Rice, Tons (thousands) 59 85 79 86 90 50 82 ... ... Riz paddy, tonnes (milliers) Maize, Tons (thousands) 8 4 19 9 23 9 17 ... ... Maïs, tonnes (milliers) Vegetables, Tons (thousands) 53 53 55 48 53 75 ... ... ... Légumes, tonnes (milliers) Dates, Tons (thousands) 22 22 22 20 20 20 20 ... ... Dattes ( en milliers de tonnes) V MINING PRODUCTION - PRODUCTION MINIERE 237 2002 2003 2004 2005 2006 2007 2008 2009 2010 Iron ores and concentrates, metric 9 424.0 10 377.0 10 782.0 10 752.0 11 155.0 11 233.0 11 296.0 10 448.0 ... Minerais de fer, tonnes (milliers) tons (thousands) Gold ores and concentrates ... ... ... ... 10.0 82.8 200.2 ... ... Minerais d'or (Kilogrammes) (Kilograms) Copper, Tons (thousands) 6.0 6.0 6.0 0.0 5.0 28.9 32.9 ... ... Cuivre, tonnes (milliers) VI ENERGY - ENERGIE 2002 2003 2004 2005 2006 2007 2008 2009 2010 Electricity - total hydro production, Électricité - production hydraulique 276.4 318.0 342.2 383.2 401.7 423.9 486.9 ... ... kilowatt hours (millions) totale, kilowatt-heures (millions) Electricity - total thermal production, Électricité - production thermique 276.4 318.0 342.2 383.2 401.7 423.9 486.9 ... ... kilowatt hours (millions) totale, kilowatt-heures (millions) Electricity - total production, self- Electricité - Production totale privée ... ... 156 183 201 197 ... ... ... producer (Million Kilowatt Hours) (million de kilowatt heures) Electricity - total production, public Electricité - Production totale 276 318 186 200 201 227 ... ... ... (Million Kilowatt Hours) publique (million de kilowatt heures) African Statistical Yearbook 2011 / Annuaire Statistique pour l'Afrique 2011
  • 239.
    Mauritania Mauritanie VII TOURISM AND INFRASTRUCTURE - TOURISME ET INFRASTUCTURE 2002 2003 2004 2005 2006 2007 2008 2009 2010 Arrivals - Tourists (thousands) ... ... ... ... 3.76 10.148 ... ... ... Arrivées - touristes (milliers) Rooms in hotels and similar Chambres d'hotels et établissements establishments (thousands) ... ... ... ... ... ... ... ... ... assimilés (milliers) Paved Road (% of total) 55 55 53 53 58 58 ... ... ... Routes asphaltées (% du total) Total Network (Railways-km) 9 073 9 091 9 318 9 841 11 763 11 763 ... ... ... Réseau total voies ferrées-Km Main Telephone Lines (per 1,000 Lignes téléphoniques fixes (pour 1 1 1 1 1 1 2 ... ... inhabitants) 1000 habitants) Mobile Cellular Subscribers (per Abonnés aux téléphones mobiles 9 13 19 26 35 49 64 ... ... 1,000 inhabitants) (pour 1000 habitants) VII FINANCIAL AND MONETARY STATISTICS - FINANCES ET STATISTIQUES MONETAIRES 2002 2003 2004 2005 2006 2007 2008 2009 2010 VII-1 Monetary Statistics VII-1 Statistiques monétaires Ouguiya(Millions) Ouguiya(Millions) Money supply (M1) 78 183 100 127 111 104 128 282 148 741 171 057 203 399 231 193 251 555 Masse monétaire (M1) Quasi-money 14 548 18 146 23 455 25 527 29 177 40 501 37 576 45 924 41 142 Quasi-monnaie of which Demand Deposit 49 661 55 838 68 327 79 173 82 311 102 133 133 068 148 967 ... dont Monnaie scripturale Net foreign assets 52 751 58 557 - 72 139 - 75 281 - 3 034 8 186 - 9 412 - 7 750 - 14 828 Avoirs extérieurs nets Domestic credit 157 368 198 912 264 000 303 148 266 192 305 043 379 946 420 031 446 777 Crédit intérieur of which claims on private sector 95 925 116 926 134 100 143 496 153 892 183 182 238 200 247 114 280 866 dont créances sur le secteur privé of which Claims on government dont créances nettes sur le 61 443 81 986 129 900 159 652 112 300 121 861 141 746 172 917 165 911 sector, net gouvernement International reserves (millions of US Réserves internationales (millions de 74 32 39 70 194 209 195 238 ... $) $ EU) Average Exchange Rate (National Taux de change (moyen) (monnaie 271.50 263.20 256.20 268.60 268.60 250.60 256.60 262.70 273.67 Currency per us $) nationale par dollars) VII-2 Public Finance VII-2 Finances publiques Ouguiya(Millions) Ouguiya(Millions) Total Revenues and Grants 108 571 119 675 130 415 131 301 467 656 209 420 204 270 188 600 276 600 Recettes totales et dons Tax Revenue 41 549 44 887 59 178 74 877 104 509 106 881 125 330 106 700 ... Recettes fiscales Non Tax Revenue 53 486 59 040 58 748 46 124 110 626 86 248 75 740 75 800 ... Recettes non fiscales 238 Grants 13 536 15 748 12 489 10 300 252 521 16 291 3 200 6 100 ... Dons Total Expenditures and Net Lending 117 581 159 481 149 569 166 100 206 324 217 320 246 890 226 400 320 588 Dépenses totales et prêts nets Current expenditure 73 952 110 558 102 291 126 600 157 876 158 865 191 290 170 200 ... Dépenses courantes Of which Wages and Salaries 16 070 16 042 17 151 22 400 52 842 64 582 71 300 77 000 ... Dont rémunérations et salaires Capital expenditure 43 467 47 572 47 097 36 600 44 648 58 456 55 600 51 800 ... Dépenses d'équipement Net Lending 162 1 351 182 2 900 3 800 0 0 4 400 ... Prêts nets Fiscal Balance - 9 010 - 39 806 - 19 154 - 34 799 261 332 - 7 900 - 42 620 - 37 800 - 43 988 Solde global y compris les dons VII-3 Balance of Payments VII-3 Balance des paiements Ouguiya(Millions) Ouguiya(Millions) Trade balance - 6 807 - 18 077 - 229 594 - 191 193 74 684 9 271 27 827 - 15 949 ... Balance commerciale Services Balance - 22 096 - 37 493 - 55 098 - 79 221 - 85 844 - 136 664 - 152 362 - 128 828 ... Balance des services Net Income 34 288 15 187 17 403 17 102 - 19 957 - 16 110 7 366 - 17 837 ... Revenus nets Current transfers, net total 24 305 35 068 28 851 42 625 42 600 37 597 41 582 35 873 ... Transferts courants Current account balance 29 690 - 5 315 - 238 438 - 210 687 11 483 - 105 906 - 75 588 - 126 741 ... Solde du compte courant VII-4 External Debt and Financial Flows VII-4 Dette extérieure et flux financiers US $(Millions) $ E.U(Millions) Total external debt 2 711 2 869 3 151 2 469 2 541 2 749 2 948 3 123 2 432 Dette extérieure totale Private 48 60 114 181 196 67 67 67 67 Privée Public 2 663 2 809 3 037 2 288 2 345 2 682 2 882 3 057 2 366 Publique Total external debt service 10 21 25 31 80 47 71 56 108 Service de la dette extérieure Net Foreign Direct Investment Investissements étranger direct (flux 67 102 392 814 106 138 338 - 38 ... Inflows nets entrants) Net Total Official Development Aide publique au développement 363 255 194 187 208 346 320 287 ... assistance (nette totale) African Statistical Yearbook 2011 / Annuaire Statistique pour l'Afrique 2011
  • 240.
    Mauritania Mauritanie 2002 2003 2004 2005 2006 2007 2008 2009 2010 Ouguiya(Millions) Ouguiya Exports, fob Exportations, fàb Exports - Total 90 065 83 763 116 672 165 537 367 069 379 063 422 917 357 908 ... Exportations - Total Main Products Principaux produits Iron Ore 53 833 48 855 66 967 101 306 122 209 144 403 175 837 137 024 ... Minerai de fer Fishing Products 32 925 35 366 44 625 46 391 45 993 64 032 70 406 70 561 ... Produit Pêche Petroleum Products ... ... ... ... 170 504 88 105 81 726 57 269 ... Produits pétroliers ... ... ... ... ... ... ... ... ... ... ... ... ... ... ... ... ... ... Main Destinations Principales destinations France 15 547.2 14 178.3 19 275.1 25 885.6 29 338.7 38 144.1 64 101.5 ... ... France Spain 12 645.1 12 336.1 14 909.6 15 811.7 19 711.9 30 870.6 26 270.8 ... ... Espagne Italy 16 826.3 12 951.8 11 534.4 24 048.0 31 776.5 27 088.8 28 557.9 ... ... Italie Belgium 14 159.0 12 342.0 12 497.0 20 315.4 21 918.0 19 078.2 20 035.2 ... ... Belgique Japan 8 492.2 9 948.5 23 443.1 20 364.3 21 177.1 20 661.5 21 241.7 ... ... Japon 2002 2003 2004 2005 2006 2007 2008 2009 2010 Imports, cif Importations, cif Imports - Total 96 872 101 840 346 266 356 730 292 385 369 792 395 090 373 857 ... Importations - Total (millions) 239 Principaux produits Main Products Equipment goods 23 092 27 420 232 580 231 727 52 526 68 126 55 807 102 847 ... Biens d'équipement Petroleum Products 21 415 16 725 21 926 35 939 77 825 113 300 138 549 74 029 ... Produits pétroliers Food 19 795 22 569 33 767 32 329 64 963 84 015 105 271 89 070 ... Produits alimentaires Cars / spare parts 8 514 9 575 14 487 11 593 20 141 26 033 27 139 22 760 ... Voitures/pieces détachées Construction Equipment 9 612 9 382 20 607 17 601 24 326 31 293 24 068 26 620 ... Matériel construction Main Origin Principales provenances France 29 500.5 28 789.6 34 470.7 36 724.7 43 662.6 58 641.0 64 569.6 ... ... France Germany 5 910.4 7 194.7 9 945.0 854.4 12 081.8 14 416.2 12 433.9 ... ... Allemagne USA 6 435.5 4 417.2 11 287.7 28 697.4 15 947.2 16 578.2 12 719.9 ... ... Etats-Unis Spain 5 283.9 5 574.1 4 510.6 5 979.3 9 686.8 13 984.4 19 208.4 ... ... Espagne Belgium 4 723.3 5 477.4 9 982.2 9 905.3 14 017.2 16 662.5 24 060.7 ... ... Belgique African Statistical Yearbook 2011 / Annuaire Statistique pour l'Afrique 2011
  • 241.
    Mauritius Maurice AREA (KM 2) 2 040 SUPERFICIE (KM 2) CAPITAL CITY Port Louis Port Louis CAPITALE CURRENCY Mauritius Rupee Rupee Mauritien MONNAIE I SOCIAL AND DEMOGRAPHIC INDICATORS — INDICATEURS DEMOGRAPHIQUES ET SOCIAUX 2002 2003 2004 2005 2006 2007 2008 2009 2010 Population Population Population au milieu de l'année - Mid-year population - Total (Million) 1.2 1.2 1.2 1.3 1.3 1.3 1.3 1.3 1.3 Total (million) Population au milieu de l'année - Mid-year population - Urban (%) 42.5 42.4 42.3 42.3 42.3 42.3 42.4 42.5 42.6 Urbaine (%) Female (%) 50.3 50.3 50.3 50.3 50.4 50.4 50.4 50.4 50.5 Femme (%) Population by Age Group Population par groupe d'âge 0-14 311 959 312 154 311 484 309 580 306 269 301 780 296 648 291 638 287 305 0-14 15-64 833 612 842 644 851 871 861 543 871 783 882 414 893 016 903 006 911 955 15-64 65+ 73 629 76 011 78 510 81 165 83 977 86 951 90 136 93 575 97 309 65+ Active Population (000) 541.7 542.7 543.4 554.4 560.6 564.1 577.2 573.1 576.6 Population active (000) Female (%) 34.3 34.3 34.4 35.5 35.9 35.6 36.4 36.1 36.3 Femme (%) Taux brut de natalité - Total (par Crude birth rate - Total (per 1000) 7.0 7.0 7.0 7.0 7.0 7.0 7.0 7.0 7.0 1000) Taux brut de mortalité - Total (par Crude death rate - Total (per 1000) 7.0 7.0 7.0 7.0 7.0 7.0 7.0 7.0 ... 1000) Life expectancy at birth - Total Espérance de vie à la naissance - 72.0 72.0 72.0 72.0 72.0 73.0 73.0 73.0 ... (years) Total (années) Net reproduction rate - (per Taux net de reproduction - (par 1.0 1.0 1.0 1.0 1.0 1.0 1.0 1.0 ... woman) femme) Indice synthétique de fécondité - Total fertility rate - (p woman) y (per ) 2.0 2.0 2.0 2.0 2.0 2.0 2.0 2.0 ... (par femme) Education Enseignement Teaching staff at first level - Total Personnel enseignant - 1er degré - 5.26 5.6 5.7 5.5 5.6 5.5 5.5 5.5 ... (thousands) Total (milliers) Teaching staff at second level - Total Personnel enseignant - 2ème degré - 240 5.93 6.4 7.0 7.4 7.8 8.1 8.1 8.2 ... (thousands) Total (milliers) Teaching staff at third level - Total Personnel enseignant - 3ème degré - ... 1.1 1.1 1.3 1.3 1.1 1.2 1.3 ... (thousands) Total (milliers) First level student enrollment - Total Elèves inscrits - 1er degré - Total 132 130 126 124 121 119 119 118 ... (thousands) (milliers) First level student enrollment - Elèves inscrits - 1er degré - Femmes 65 64 62 61 60 59 58 58 ... Female (thousands) (milliers) Second level student enrollment - Elèves inscrits - 2ème degré - Total 112 118 123 128 132 133 132 131 ... Total (thousands) (milliers) Second level student enrollment - Elèves inscrits - 2ème degré - 55 58 60 63 65 66 65 65 ... Female (thousands) Femmes (milliers) Third level student enrollment - Total Elèves inscrits - 3ème degré - Total 16.9 17.0 17.6 20.5 22.2 23.0 25.6 ... ... (thousands) (milliers) Third level student enrollment - Elèves inscrits - 3ème degré - 8.3 8.1 8.6 10.3 11.0 12.3 14.0 ... ... Female (thousands) Femmes (milliers) Public expenditure on education (% Dépenses publiques consacrées à 13.3 13.3 13.7 14.1 13.0 12.6 12.7 13.5 ... of budget) l'enseignement (% du budget) Health Santé Hospital beds - Total (per 10 000 Nombre de lits d'hôpitaux - Total 36 34 34 34 34 33 34 35 ... population) (pour 10 000) Nurses - Total (per 10 000 Nombre d'infirmières - Total (pour 24 24 24 23 25 26 27 28 ... population) 10 000) Physicians - Total (per 10 000 Nombre de médecins - Total (pour 10 10 11 11 11 11 11 12 ... population) 10 000) Public expenditure on Health (% of Dépenses publiques consacrées à la 9 8 9 9 9 9 9 9 ... budget) santé (% du budget) African Statistical Yearbook 2011 / Annuaire Statistique pour l'Afrique 2011
  • 242.
    Mauritius Maurice II NATIONAL ACCOUNTS — COMPTES NATIONAUX 2002 2003 2004 2005 2006 2007 2008 2009 2010 Gross domestic product by kind of economic activity at current prices Produit intérieur brut par branche d'activité économique aux prix courants Mauritius Rupee (Millions) Rupee Mauritien(Millions) Agriculture 7 909 8 727 9 830 9 790 10 130 10 071 10 352 10 406 10 369 Agriculture Mining and quarrying 81 84 87 88 101 96 101 88 92 Industries extractives Manufacturing 28 227 29 581 31 942 32 187 36 356 41 076 46 929 47 396 47 888 Industries manufacturières Electricity, gas & water 3 012 3 409 3 546 3 355 3 521 3 668 4 893 6 089 6 569 Electricité, gaz et eau Construction 7 168 8 269 8 835 9 099 10 205 13 145 16 216 17 287 18 260 Bâtiments et travaux publics Wholesale & retail trade, Commerce de gros et de détail, 23 651 24 900 28 623 31 994 38 034 45 115 48 888 47 078 50 453 restaurants, hotels restaurants et hôtels Banques, assurances, affaires Finance, insurance, real estate, etc. 23 326 26 855 29 554 33 375 37 921 44 222 52 461 57 396 62 484 immobilières Transport and communications 16 944 18 496 19 682 20 447 22 169 24 517 25 062 26 153 27 308 Transport(s) et communications Administrations publiques et Public administration and defense 8 140 9 408 10 580 11 460 12 199 12 674 14 618 16 477 17 286 défense Other services 13 680 15 542 17 564 19 367 21 490 23 915 27 777 31 356 34 027 Autres services Moins Services d’intermédiation Less Imputed Service Charges - 6 712 - 7 683 - 7 818 - 8 991 - 10 117 - 11 528 - 14 000 - 16 052 - 17 700 financière Gross domestic product at factor Produit intérieur brut aux couts des 125 426 137 588 152 425 162 171 182 009 206 971 233 296 243 674 257 036 cost / basic prices facteurs / prix de base Plus: Indirect Taxes / taxes on Plus taxes indirectes/impôts sur les 17 059 19 806 23 172 23 177 24 319 28 549 31 201 30 739 32 874 products, less subsidies produits, moins les subventions Expenditure on Gross domestic product at current purchaser's values Emploi du produit intérieur brut aux prix courants d'acquisition Mauritius Rupee (Millions) Rupee Mauritien(Millions) Consommation finale des Government final consumption 19 855 22 272 25 043 27 368 29 355 30 743 34 920 40 132 42 184 administrations publiques Private final consumption 86 764 96 180 111 837 127 349 145 491 165 790 196 929 204 781 215 900 Consommation finale privée Gross fixed capital formation 31 075 35 554 38 003 39 731 50 048 59 170 65 176 71 848 70 800 Formation brute de capital fixe Increase in inventories 454 1 369 4 879 2 028 4 735 3 970 6 415 - 13 171 - 2 332 Variation des stocks Exports of goods and services 88 301 88 714 94 859 110 940 127 128 138 459 140 166 132 980 143 476 Exportations de biens et services Moins importations de biens et 241 Less imports of goods and services 83 964 86 694 99 024 122 067 150 429 162 612 179 108 162 156 180 118 services GDP at purchasers' values 142 485 157 394 175 597 185 348 206 328 235 520 264 498 274 414 289 910 PIB aux prix d'acquisition Gross domestic product by kind of economic activity at constant Produit intérieur brut par branche d'activité economique aux prix constants prices Annual Growth Rates (%) Taux de croissance annuel (%) Agriculture -16.3 1.9 8.1 -5.4 0.6 -5.2 1.5 10.7 4.0 Agriculture Mining and quarrying -49.2 1.6 0.0 -3.1 7.9 -9.1 0.0 -15.0 0.0 Industries extractives Manufacturing -2.4 0.0 0.5 -5.5 4.0 2.2 3.2 1.1 1.9 Industries manufacturières Electricity, gas & water 1.5 8.2 4.0 3.8 4.0 3.4 4.0 2.5 3.7 Electricité, gaz et eau Construction 6.3 10.2 0.5 -4.4 5.2 4.5 4.6 1.3 3.3 Bâtiments et travaux publics Wholesale & retail trade, Commerce de gros et de 3.2 1.7 4.7 5.6 4.9 4.5 4.6 1.3 3.3 restaurants, hotels détail,restaurants et hôtels Banques, assurances, affaires Finance, insurance, real estate, etc. 5.8 8.8 5.6 6.0 6.7 7.5 10.8 4.9 5.6 immobilières Transport and communications 7.7 6.6 8.1 7.7 7.4 7.7 5.8 4.9 5.5 Transport(s) et communications Administrations publiques et Public administartion and defense 6.1 5.6 4.3 5.3 4.0 0.5 1.7 2.5 2.8 défense Other services 8.4 4.5 7.2 1.8 -2.5 24.3 3.0 2.4 9.1 Autres services Moins Services d’intérmediation Less Imputed Service Charges 9.6 7.6 -0.4 7.3 6.9 7.5 10.4 5.3 5.9 financière Gross domestic product at factor Produit intérieur brut aux couts des 1.6 4.3 4.8 1.8 4.6 5.3 5.1 3.2 4.2 cost / basic prices facteurs / prix de base Plus: Indirect Taxes / taxes on Plus taxes indirectes/impôts sur les 3.6 4.2 11.9 -1.9 -0.3 6.9 1.9 -4.7 1.5 products, less subsidies produits, moins les subventions Gross domestic product at market Produit intérieur brut aux prix du 1.9 4.3 5.8 1.2 3.9 5.5 4.6 2.1 3.9 prices marché 2008: semi-final 2009: Provisional 2010:Estimated 2008: semi-définitif 2009: provisoire 2010:Estimée African Statistical Yearbook 2011 / Annuaire Statistique pour l'Afrique 2011
  • 243.
    Mauritius Maurice Expenditure on Gross domestic product at constant purchasers' Emplois du produit intérieur brut aux prix constants d'acquisition values Annual Growth Rates (%) Taux de croissance annuel (%) Consommation finale des Government final consumption 5.8 3.0 4.6 6.1 3.8 0.8 0.7 5.4 2.8 administrations publiques Private final consumption 3.3 5.1 7.8 7.3 5.9 4.5 7.0 2.1 2.5 Consommation finale privée Gross fixed capital formation -0.1 10.3 2.2 -1.9 19.0 8.6 3.6 9.1 -2.8 Formation brute de capital fixe Exports of goods and services -12.1 -3.9 -0.3 10.6 7.7 3.4 2.3 -4.8 13.6 Exportations de biens et services Moins importations de biens et Less imports of goods and services -3.2 -3.1 2.8 6.4 9.3 2.0 1.8 -4.6 5.8 services III INFLATION 2002 2003 2004 2005 2006 2007 2008 2009 2010 Annual Growth Rates (%) Taux de croissance annuel (%) All Item 6.4 3.9 4.7 4.9 8.9 8.8 9.7 2.5 1.1 Ensemble Food 7.8 2.6 6.2 5.8 10.0 15.6 15.8 4.1 1.5 Alimentation Health 6.6 6.0 6.4 4.6 7.7 5.3 6.9 5.4 2.3 Santé Energy 9.3 -1.5 0.2 2.7 20.5 6.4 17.9 2.0 0.1 Energie Transport 5.0 3.4 4.8 6.3 8.6 1.7 12.3 0.2 1.7 Transport IV AGRICULTURAL PRODUCTION - PRODUCTION AGRICOLE 2002 2003 2004 2005 2006 2007 2008 2009 2010 Tons (Thousand) Tonnes (milliers) Potato, Tons (thousands) 13 12 11 13 11 15 15 20 ... Pommes de terre, tonnes (milliers) Tomato, Tons (thousands) 12 13 14 13 15 11 12 13 ... Tomates, tonnes (milliers) Pumpkins, squash and gourds, Tons ... Citrouille, squash et gourdes, tonnes 7 16 18 14 18 15 14 17 (thousands) (milliers) Sugar cane, Tons (thousands) 4 874 5 200 5 280 4 984 4 749 4 236 4 533 ... ... Cane à sucre, tonnes (milliers) Foodcrop, Tons (thousands) 103 876 103 455 111 633 96 782 106 902 99 130 93 021 ... ... Cultures vivrières, tonnes (milliers) V MINING PRODUCTION - PRODUCTION MINIERE 242 2002 2003 2004 2005 2006 2007 2008 2009 2010 Salt and pure sodium chloride, Sel et chlorure de sodium pur, 7.0 7.0 7.0 7.0 7.0 6.7 ... ... ... metric tons (thousands) tonnes métriques (milliers) ... ... ... ... ... ... ... ... ... ... ... ... ... ... ... ... ... ... VI ENERGY - ENERGIE 2002 2003 2004 2005 2006 2007 2008 2009 2010 Electricity - total hydro production, Électricité - production hydraulique 1 948.9 2 081.5 2 165.2 2 272.2 2 350.2 2 464.7 2 557.2 2 577.4 ... kilowatt hours (millions) totale, kilowatt-heures (millions) Electricity - total thermal production, Électricité - production thermique 4.4 5.7 5.6 5.1 3.3 3.4 4.2 4.7 ... kilowatt hours (millions) totale, kilowatt-heures (millions) Electricity - total production, self- Electricité - Production totale privée 956 943 943 949 967 966 958 952 ... producer (Million Kilowatt Hours) (million de kilowatt heures) Electricity - total production, public Electricité - Production totale 991 1 135 1 225 1 208 1 106 1 003 ... ... ... (Million Kilowatt Hours) publique (million de kilowatt heures) African Statistical Yearbook 2011 / Annuaire Statistique pour l'Afrique 2011
  • 244.
    Mauritius Maurice VII TOURISM AND INFRASTRUCTURE - TOURISME ET INFRASTUCTURE 2002 2003 2004 2005 2006 2007 2008 2009 2010 Arrivals - Tourists (thousands) 681.648 702.018 718.861 761.063 788.276 906.971 930.456 871.4 ... Arrivées - touristes (milliers) Rooms in hotels and similar Chambres d'hotels et établissements establishments (thousands) 9.623 9.647 10.64 10.497 10.666 10.857 11.488 11.5 ... assimilés (milliers) Paved Road (% of total) 100 100 100 100 100 100 100 100 ... Routes asphaltées (% du total) Total Network (Railways-km) 2 000 2 015 2 020 2 020 2 021 2 028 2 028 2 066 ... Réseau total voies ferrées-Km Main Telephone Lines (per 1,000 Lignes téléphoniques fixes (pour 269 284 286 286 284 286 286 ... ... inhabitants) 1000 habitants) Mobile Cellular Subscribers (per Abonnés aux téléphones mobiles 286 380 443 526 615 734 812 850 ... 1,000 inhabitants) (pour 1000 habitants) VII FINANCIAL AND MONETARY STATISTICS - FINANCES ET STATISTIQUES MONETAIRES 2002 2003 2004 2005 2006 2007 2008 2009 2010 VII-1 Monetary Statistics VII-1 Statistiques monétaires Mauritius Rupee (Millions) Rupee Mauritien(Millions) Money supply (M1) 18 150 36 988 45 390 46 186 52 677 64 311 75 590 88 076 80 517 Masse monétaire (M1) Quasi-money 101 306 109 907 128 841 141 135 153 493 173 661 197 188 207 632 217 088 Quasi-monnaie of which Demand Deposit ... ... ... ... ... ... ... ... ... dont Monnaie scripturale Net foreign assets 43 385 92 235 116 321 145 913 238 282 265 602 285 016 332 684 370 796 Avoirs extérieurs nets Domestic credit 105 861 153 887 179 530 198 692 218 007 242 190 296 098 301 170 320 793 Crédit intérieur of which claims on private sector 83 690 114 649 128 278 139 524 153 085 183 106 232 514 233 629 257 367 dont créances sur le secteur privé of which Claims on government dont créances nettes sur le 20 723 30 953 42 693 45 251 46 181 45 524 46 967 49 849 48 187 sector, net gouvernement International reserves (millions of US Réserves internationales (millions de 1 227 1 577 1 606 1 340 1 270 1 780 1 743 2 179 2 442 $) $ EU) Average Exchange Rate (National Taux de change (moyen) (monnaie 29.96 27.90 27.50 29.50 31.71 31.31 28.45 31.96 30.78 Currency per us $) nationale par dollars) VII-2 Public Finance VII-2 Finances publiques Mauritius Rupee (Millions) Rupee Mauritien(Millions) Total Revenues and Grants 27 735 32 810 36 693 39 320 42 406 45 641 54 594 54 581 60 428 Recettes totales et dons Tax Revenue 22 865 27 242 30 612 34 339 37 117 40 053 46 927 45 484 50 524 Recettes fiscales Non Tax Revenue 4 553 5 206 5 463 4 538 4 800 5 266 7 213 6 914 7 470 Recettes non fiscales Grants 317 363 618 444 489 322 454 2 183 2 434 Dons 243 Total Expenditures and Net Lending 33 343 38 846 42 341 43 752 48 930 50 985 60 521 73 828 74 686 Dépenses totales et prêts nets Current expenditure 14 658 15 827 18 240 19 809 21 571 22 050 23 755 26 241 25 258 Dépenses courantes Of which Wages and Salaries 10 975 11 809 13 887 15 022 15 778 16 512 18 006 19 307 19 942 Dont rémunérations et salaires Capital expenditure 5 085 7 129 7 129 6 063 6 915 6 843 8 548 19 668 19 857 Dépenses d'équipement Net Lending 500 959 439 648 689 375 4 040 2 624 4 385 Prêts nets Fiscal Balance - 5 608 - 6 036 - 5 648 - 4 432 - 6 524 - 5 343 - 5 928 - 19 247 - 14 258 Solde global y compris les dons VII-3 Balance of Payments VII-3 Balance des paiements Mauritius Rupee (Millions) Rupee Mauritien(Millions) Trade balance - 6 329 - 8 389 - 16 006 - 23 515 - 34 532 - 43 939 - 56 597 - 49 223 - 55 693 Balance commerciale Services Balance 10 666 10 409 11 841 12 388 11 231 19 786 17 655 20 047 21 914 Balance des services Net Income 396 - 833 - 390 - 239 1 633 7 023 4 900 825 4 635 Revenus nets Current transfers, net total 2 739 1 471 1 374 1 797 2 269 3 882 6 409 6 909 4 012 Transferts courants Current account balance 7 472 2 658 - 3 181 - 9 569 - 19 399 - 13 248 - 27 633 - 21 442 - 25 132 Solde du compte courant VII-4 External Debt and Financial Flows VII-4 Dette extérieure et flux financiers US $ (Millions) $ E.U (Millions) Total external debt 1 049 1 011 934 898 850 849 1 171 1 337 1 315 Dette extérieure totale Private 90 79 71 151 133 99 109 669 422 Privée Public 958 932 862 747 717 751 1 061 668 893 Publique Total external debt service 235 250 214 220 227 175 152 186 176 Service de la dette extérieure Net Foreign Direct Investment Investissements étranger direct (flux 32 62 11 42 105 339 383 257 ... Inflows nets entrants) Net Total Official Development Aide publique au développement 24 - 14 33 34 19 69 110 156 ... assistance (nette totale) African Statistical Yearbook 2011 / Annuaire Statistique pour l'Afrique 2011
  • 245.
    Mauritius Maurice 2002 2003 2004 2005 2006 2007 2008 2009 2010 Mauritius Rupee (Millions) Rupee Mauritien Exports, fob Exportations, fàb Exports - Total 53 893 53 022 54 905 63 219 74 037 69 708 67 970 61 784 ... Exportations - Total Main Products Principaux produits Prepared or preserved tuna, skipjack Prepared or preserved tuna, 8 869 8 775 9 631 10 181 11 197 9 264 6 009 6 735 ... and atlantic bonito skipjack and atlantic bonito Raw cane sugar 2 015 1 994 2 220 3 175 4 981 6 140 8 268 6 610 ... Raw cane sugar T-shirt, singlet & other vest of other T-shirt, singlet & other vest of other 9 799 10 925 12 003 11 171 12 360 12 556 10 357 9 743 ... textile excl cotton, knitted/crocheted textile excl cotton, knitted/crocheted Men's or boys' shirts of cotton, not Men's or boys' shirts of cotton, not 2 807 2 632 3 542 3 393 3 592 4 057 3 487 3 416 ... knitted or crochetd knitted or crochetd Men's/boys' trouser, short etc. of Men's/boys' trouser, short etc. of 3 997 3 039 1 845 1 363 1 736 2 282 2 284 2 563 ... cotton, not knitted/crocheted cotton, not knitted/crocheted Main Destinations Principales destinations France 9 403.4 9 403.4 9 083.8 8 447.1 8 704.0 8 889.0 7 915.0 9 336.0 ... France Italy 1 899.5 1 899.5 2 156.4 3 349.0 2 754.4 3 568.0 2 686.0 3 119.0 ... Italie Madagascar 3 184.3 3 184.3 2 689.1 3 380.7 3 288.2 3 865.0 3 451.0 3 606.0 ... Madagascar UK 15 679.9 15 914.7 17 356.3 18 932.7 22 362.3 21 924.0 20 134.0 15 170.0 ... Royaume-Uni USA 8 771.8 8 771.8 7 768.1 5 715.4 5 754.2 4 760.0 3 926.0 4 656.0 ... Etats-Unis 2002 2003 2004 2005 2006 2007 2008 2009 2010 Imports, cif Importations, cif 244 Imports - Total 64 608 65 942 76 387 93 282 115 502 121 037 132 165 118 303 ... Importations - Total (millions) Principaux produits Main Products Fish and fish preparation 3 985 2 542 3 170 4 266 6 687 7 066 8 474 7 108 ... Fish and fish preparation Refined petroleum products 5 673 6 391 8 791 13 471 17 025 18 969 24 042 15 107 ... Refined petroleum products Textile yarn and fabrics 101 112 112 67 84 86 62 43 ... Textile yarn and fabrics Telecommunications and sound Telecommunications and sound 14 47 60 286 286 112 96 37 ... recording recording Road vehicles 2 718 2 805 4 028 4 216 4 505 5 228 6 057 5 446 ... Road vehicles Main Origin Principales provenances China 5 434.4 5 539.1 7 067.9 9 166.1 9 987.6 13 768.0 15 288.0 14 908.0 ... China France 7 130.7 7 841.4 6 818.4 6 957.6 16 440.0 12 813.0 10 159.0 13 800.0 ... France India 4 724.7 5 438.1 6 989.1 6 460.6 15 687.3 35 633.0 31 699.0 22 152.0 ... India Japan 2 286.9 2 326.1 3 082.6 3 333.1 3 253.6 4 334.0 5 221.0 3 823.0 ... Japan South Africa 8 116.1 8 068.3 8 561.8 8 065.8 8 433.5 8 910.0 10 723.0 10 237.0 ... South Africa African Statistical Yearbook 2011 / Annuaire Statistique pour l'Afrique 2011
  • 246.
    Morocco Maroc AREA (KM 2) 710 850 SUPERFICIE (KM 2) CAPITAL CITY Rabat Rabat CAPITALE CURRENCY Dirham Dirham MONNAIE I SOCIAL AND DEMOGRAPHIC INDICATORS — INDICATEURS DEMOGRAPHIQUES ET SOCIAUX 2002 2003 2004 2005 2006 2007 2008 2009 2010 Population Population Population au milieu de l'année - Mid-year population - Total (Million) 29.5 29.8 30.2 30.5 30.9 31.2 31.6 32.0 32.4 Total (million) Population au milieu de l'année - Mid-year population - Urban (%) 54.0 54.3 54.6 55.0 55.3 55.7 56.0 56.4 56.7 Urbaine (%) Female (%) 50.6 50.7 50.7 50.8 50.8 50.8 50.9 50.9 50.9 Femme (%) Population by Age Group Population par groupe d'âge 0-14 9496 568 9398 493 9309 446 9233 505 9172 961 9128 149 9098 484 9082 269 9077 934 0-14 15-64 18549 540 18919 701 19289 950 19666 178 20049 702 20436 694 20821 720 21197 106 21557 099 15-64 65+ 1449 270 1502 583 1552 393 1595 308 1630 308 1659 293 1685 412 1713 217 1746 250 65+ Active Population (000) 10 239.9 10 650.9 10 987.1 11 116.9 11 319.8 11 585.4 11 803.1 11 981.8 12 189.9 Population active (000) Female (%) 24.1 25.5 26.1 25.8 25.8 26.1 26.1 25.8 25.8 Femme (%) Taux brut de natalité - Total (par Crude birth rate - Total (per 1000) 21.0 20.0 20.0 20.0 20.0 20.0 19.0 19.0 ... 1000) Taux brut de mortalité - Total (par Crude death rate - Total (per 1000) 6.0 6.0 6.0 6.0 6.0 6.0 6.0 6.0 ... 1000) Life expectancy at birth - Total Espérance de vie à la naissance - 70.0 71.0 71.0 72.0 72.0 72.0 73.0 73.0 ... (years) Total (années) Net reproduction rate - (per Taux net de reproduction - (par ... ... ... 1.1 ... ... ... ... ... woman) femme) Indice synthétique de fécondité - Total fertility rate - (p woman) y (per ) 2.6 2.5 2.5 2.4 2.4 2.3 2.3 2.2 ... (par femme) Education Enseignement Teaching staff at first level - Total Personnel enseignant - 1er degré - 142.34 145.6 147.7 148.4 146.3 143.8 146.2 144.7 ... (thousands) Total (milliers) Teaching staff at second level - Total Personnel enseignant - 2ème degré - ... 97.1 100.4 ... ... ... ... ... ... 245 (thousands) Total (milliers) Teaching staff at third level - Total Personnel enseignant - 3ème degré - 18.0 18.0 18.6 19.4 19.3 18.5 19.1 19.6 ... (thousands) Total (milliers) First level student enrollment - Total Elèves inscrits - 1er degré - Total 4 029 4 101 4 070 4 023 3 944 3 939 3 879 3 851 ... (thousands) (milliers) First level student enrollment - Elèves inscrits - 1er degré - Femmes 1 859 1 905 1 892 1 865 1 826 1 830 1 811 1 811 ... Female (thousands) (milliers) Second level student enrollment - Elèves inscrits - 2ème degré - Total 1 685 1 758 1 879 1 952 2 061 2 173 ... ... ... Total (thousands) (milliers) Second level student enrollment - Elèves inscrits - 2ème degré - 742 783 843 880 ... 989 ... ... ... Female (thousands) Femmes (milliers) Third level student enrollment - Total Elèves inscrits - 3ème degré - Total 315.3 335.8 343.6 366.9 384.6 369.1 401.1 418.8 ... (thousands) (milliers) Third level student enrollment - Elèves inscrits - 3ème degré - 137.9 150.7 157.0 165.6 173.7 175.6 189.6 196.3 ... Female (thousands) Femmes (milliers) Public expenditure on education (% Dépenses publiques consacrées à 27.1 28.2 28.0 23.9 27.8 26.6 21.6 23.5 ... of budget) l'enseignement (% du budget) Health Santé Hospital beds - Total (per 10 000 Nombre de lits d'hôpitaux - Total 88 87 87 87 87 87 87 87 ... population) (pour 10 000) Nurses - Total (per 10 000 Nombre d'infirmières - Total (pour 91 89 90 85 87 86 89 89 ... population) 10 000) Physicians - Total (per 10 000 Nombre de médecins - Total (pour 48 49 56 57 60 59 62 61 ... population) 10 000) Public expenditure on Health (% of Dépenses publiques consacrées à la 5 5 6 5 5 5 5 5 ... budget) santé (% du budget) African Statistical Yearbook 2011 / Annuaire Statistique pour l'Afrique 2011
  • 247.
    Morocco Maroc II NATIONAL ACCOUNTS — COMPTES NATIONAUX 2002 2003 2004 2005 2006 2007 2008 2009 2010 Gross domestic product by kind of economic activity at current prices Produit intérieur brut par branche d'activité économique aux prix courants Dirham (Millions) Dirham(Millions) Agriculture 65 457 73 933 74 131 69 565 87 482 74 928 90 690 107 183 ... Agriculture Mining and quarrying 8 501 7 822 8 116 8 994 10 534 13 155 45 121 16 925 ... Industries extractives Manufacturing 66 276 74 026 79 585 78 650 82 498 82 915 87 959 105 088 ... Industries manufacturières Electricity, gas & water 11 731 13 191 13 047 14 583 14 687 15 749 16 123 18 953 ... Electricité, gaz et eau Construction 21 681 24 379 28 822 31 522 32 912 37 233 38 663 45 776 ... Bâtiments et travaux publics Wholesale & retail trade, Commerce de gros et de détail, 62 759 62 617 65 285 69 417 74 221 81 352 86 875 88 829 ... restaurants, hotels restaurants et hôtels Banques, assurances, affaires Finance, insurance, real estate, etc. 103 672 113 137 120 304 133 711 146 164 167 725 179 138 189 759 ... immobilières Transport and communications 29 865 31 072 34 000 34 522 36 491 43 151 45 262 47 892 ... Transport(s) et communications Administrations publiques et Public administration and defense 38 481 39 493 44 208 47 917 50 664 51 910 54 000 58 860 ... défense Other services 6 455 6 971 7 855 7 761 8 246 8 664 9 126 9 502 ... Autres services Moins Services d’intermédiation Less Imputed Service Charges - 18 801 - 19 708 - 21 085 - 23 212 - 25 951 - 31 089 - 33 325 - 34 302 ... financière Gross domestic product at factor Produit intérieur brut aux couts des 396 077 426 933 454 268 473 430 517 948 545 693 619 632 654 465 ... cost / basic prices facteurs / prix de base Plus: Indirect Taxes / taxes on Plus taxes indirectes/impôts sur les 49 615 49 460 50 737 53 723 59 396 70 561 69 211 81 741 ... products, less subsidies produits, moins les subventions Expenditure on Gross domestic product at current purchaser's values Emploi du produit intérieur brut aux prix courants d'acquisition Dirham (Millions) Dirham(Millions) Consommation finale des Government final consumption 81 339 86 470 94 321 102 110 107 071 112 234 118 132 132 277 135 319 administrations publiques Private final consumption 258 256 272 934 288 592 302 646 331 996 360 008 400 395 419 392 444 556 Consommation finale privée Gross fixed capital formation 112 320 119 802 132 719 145 256 162 456 192 573 227 465 226 054 249 338 Formation brute de capital fixe Increase in inventories 3 170 10 679 14 390 6 699 7 446 7 614 35 095 38 783 47 214 Variation des stocks Exports of goods and services 134 303 136 737 148 325 170 513 197 459 220 302 258 165 210 459 224 560 Exportations de biens et services 246 Moins importations de biens et Less imports of goods and services 143 696 150 229 173 342 200 071 229 084 276 477 350 409 290 759 316 927 services GDP at purchasers' values 445 692 476 393 505 005 527 153 577 344 616 254 688 843 736 206 784 059 PIB aux prix d'acquisition Gross domestic product by kind of economic activity at constant Produit intérieur brut par branche d'activité economique aux prix constants prices Annual Growth Rates (%) Taux de croissance annuel (%) Agriculture 4.3 20.3 4.5 -11.1 24.5 -20.4 16.4 29.6 ... Agriculture Mining and quarrying -0.6 1.6 15.8 7.4 1.6 9.1 -5.9 -23.8 ... Industries extractives Manufacturing 4.6 4.3 -0.2 3.5 3.9 4.4 2.0 0.1 ... Industries manufacturières Electricity, gas & water 2.1 10.2 5.3 7.7 6.9 5.8 5.9 3.5 ... Electricité, gaz et eau Construction 1.0 8.0 8.0 6.1 8.7 11.7 9.4 3.4 ... Bâtiments et travaux publics Wholesale & retail trade, Commerce de gros et de 3.0 2.1 5.5 4.5 5.2 2.7 3.9 2.8 ... restaurants, hotels détail,restaurants et hôtels Banques, assurances, affaires Finance, insurance, real estate, etc. 2.4 5.1 3.3 10.7 27.3 12.6 3.4 -3.6 ... immobilières Transport and communications 2.9 6.0 11.7 7.3 7.9 9.4 5.9 2.8 ... Transport(s) et communications Administrations publiques et Public administartion and defense 1.3 2.9 4.7 4.8 3.2 2.4 3.9 7.6 ... défense Other services 3.4 4.7 8.4 -3.0 3.0 3.9 1.7 2.3 ... Autres services Moins Services d’intérmediation Less Imputed Service Charges -1.2 3.6 5.4 9.0 8.9 17.5 3.2 1.5 ... financière Gross domestic product at factor Produit intérieur brut aux couts des 3.2 7.3 4.8 2.8 12.8 1.7 5.7 5.0 ... cost / basic prices facteurs / prix de base Plus: Indirect Taxes / taxes on Plus taxes indirectes/impôts sur les 3.8 1.2 4.5 4.2 -20.4 10.6 5.0 4.6 ... products, less subsidies produits, moins les subventions Gross domestic product at market Produit intérieur brut aux prix du 3.3 6.3 4.8 3.0 7.8 2.7 5.6 4.9 4.1 prices marché 2009: Estimated 2010: Provisional 2009: Estimée 2010:Provisoire African Statistical Yearbook 2011 / Annuaire Statistique pour l'Afrique 2011
  • 248.
    Morocco Maroc Expenditure on Gross domestic product at constant purchasers' Emplois du produit intérieur brut aux prix constants d'acquisition values Annual Growth Rates (%) Taux de croissance annuel (%) Consommation finale des Government final consumption 0.6 2.2 4.3 3.5 2.9 4.3 4.8 11.2 ... administrations publiques Private final consumption 3.6 7.3 4.9 2.3 4.9 2.9 5.4 6.5 ... Consommation finale privée Gross fixed capital formation 7.3 7.7 8.4 7.4 9.7 14.3 11.0 3.0 ... Formation brute de capital fixe Exports of goods and services 5.7 0.6 6.3 13.3 11.6 5.2 7.3 -13.1 ... Exportations de biens et services Moins importations de biens et Less imports of goods and services 6.4 7.1 9.9 9.6 8.2 15.0 12.2 -6.0 ... services III INFLATION 2002 2003 2004 2005 2006 2007 2008 2009 2010 Annual Growth Rates (%) Taux de croissance annuel (%) All Item 2.8 1.2 1.5 1.0 3.3 2.0 3.9 0.2 0.2 Ensemble Food 4.3 1.3 1.6 0.3 3.9 3.2 6.8 0.3 2.1 Alimentation Health 1.1 1.8 1.8 1.1 0.8 0.7 0.3 -0.2 0.0 Santé Energy 1.4 1.1 2.3 1.1 3.0 4.0 0.3 0.0 -0.1 Energie Transport 0.6 0.2 0.9 4.5 8.9 -2.8 1.4 -0.1 0.1 Transport IV AGRICULTURAL PRODUCTION - PRODUCTION AGRICOLE 2002 2003 2004 2005 2006 2007 2008 2009 2010 Tons (Thousand) Tonnes (milliers) Wheat, Tons (thousands) 23 252 33 806 35 151 21 024 42 313 10 688 25 295 43 384 ... Blé tendre, tonnes (milliers) Barley, Tons (thousands) 16 690 26 204 27 603 11 021 25 351 7 626 13 532 37 860 ... Orge, tonnes (milliers) Wheat (Triticum durum), Tons 10 315 17 662 20 248 9 407 20 955 5 138 12 400 20 330 ... Blé dur, tonnes (milliers) (thousands) Sugar cane, Tons (thousands) 9 491 8 986 8 722 7 823 9 966 9 339 9 126 8 130 ... Canne à sucre, tonnes (milliers) Maize, Tons (thousands) 1 989 1 386 2 241 501 2 974 949 1 210 2 045 ... Maïs, tonnes (milliers) V MINING PRODUCTION - PRODUCTION MINIERE 247 2002 2003 2004 2005 2006 2007 2008 2009 2010 Phosphates (dry), Tons (thousands) 23 038.0 22 877.0 25 369.0 27 254.0 27 386.0 27 834.0 24 788.0 18 307.0 ... Phosphates secs, tonnes (milliers) Copper, Tons 17 799.0 17 539.0 10 308.0 12 654.0 17 811.0 19 891.0 27 619.0 42 100.0 ... Cuivre, tonnes Zinc, Tons 178 476.0 136 433.0 139 309.0 151 273.0 148 690.0 111 081.0 161 493.0 88 400.0 ... Zinc, tonnes VI ENERGY - ENERGIE 2002 2003 2004 2005 2006 2007 2008 2009 2010 Electricity - total hydro production, Électricité - production hydraulique 846.2 1 441.9 1 605.6 1 417.7 1 585.8 1 315.8 1 360.6 2 951.1 ... kilowatt hours (millions) totale, kilowatt-heures (millions) Electricity - total thermal production, Électricité - production thermique 13 073.9 13 698.3 14 581.4 17 548.7 18 058.1 18 047.4 18 641.6 21 932.9 ... kilowatt hours (millions) totale, kilowatt-heures (millions) Electricity - total production, self- Electricité - Production totale privée 282 291 279 287 278 295 284 125 ... producer (Million Kilowatt Hours) (million de kilowatt heures) Electricity - total production, public Electricité - Production totale 13 821 15 048 16 105 18 871 19 545 19 344 20 023 24 884 ... (Million Kilowatt Hours) publique (million de kilowatt heures) African Statistical Yearbook 2011 / Annuaire Statistique pour l'Afrique 2011
  • 249.
    Morocco Maroc VII TOURISM AND INFRASTRUCTURE - TOURISME ET INFRASTUCTURE 2002 2003 2004 2005 2006 2007 2008 2009 2010 Arrivals - Tourists (thousands) 4.303 4.761 5.516 5.174 5.217 5.412 5.412 6.239 ... Arrivées - touristes (milliers) Rooms in hotels and similar Chambres d'hotels et établissements establishments (thousands) 49 53 57.4 59.8 64 68 73 78 ... assimilés (milliers) Paved Road (% of total) 55 55 60 60 60 62 62 62 ... Routes asphaltées (% du total) Total Network (Railways-km) 57 227 57 227 58 523 58 467 58 410 58 309 58 309 58 309 ... Réseau total voies ferrées-Km Main Telephone Lines (per 1,000 Lignes téléphoniques fixes (pour 38 41 44 45 42 79 97 113 ... inhabitants) 1000 habitants) Mobile Cellular Subscribers (per Abonnés aux téléphones mobiles 209 245 312 415 535 657 740 812 ... 1,000 inhabitants) (pour 1000 habitants) VII FINANCIAL AND MONETARY STATISTICS - FINANCES ET STATISTIQUES MONETAIRES 2002 2003 2004 2005 2006 2007 2008 2009 2010 VII-1 Monetary Statistics VII-1 Statistiques monétaires Dirham (Millions) Dirham(Millions) Money supply (M1) 217 424 238 573 262 830 301 485 355 537 428 959 452 624 478 332 503 861 Masse monétaire (M1) Quasi-money 127 232 133 260 142 565 167 425 201 073 228 405 289 989 301 016 305 624 Quasi-monnaie of which Demand Deposit ... ... ... ... ... ... ... ... ... dont Monnaie scripturale Net foreign assets 100 529 124 791 143 163 165 997 191 537 208 069 197 099 192 714 193 036 Avoirs extérieurs nets Domestic credit 317 162 328 070 345 466 387 113 454 910 563 125 681 168 739 719 790 957 Crédit intérieur of which claims on private sector 193 248 202 289 215 161 243 538 280 858 359 834 435 630 474 159 525 443 dont créances sur le secteur privé of which Claims on government dont créances nettes sur le 88 740 88 715 83 006 91 509 96 507 101 087 99 897 91 337 94 651 sector, net gouvernement International reserves (millions of US Réserves internationales (millions de 10 133 13 851 16 337 16 187 20 341 24 123 22 104 22 797 22 588 $) $ EU) Average Exchange Rate (National Taux de change (moyen) (monnaie 11.02 9.57 8.87 8.87 8.80 8.19 7.75 8.06 8.42 Currency per us $) nationale par dollars) VII-2 Public Finance VII-2 Finances publiques Dirham (Millions) Dirham(Millions) Total Revenues and Grants 98 883 109 386 117 482 132 223 147 104 171 707 204 675 190 525 ... Recettes totales et dons Tax Revenue 87 667 91 219 97 564 110 384 125 305 150 123 185 651 169 008 ... Recettes fiscales Non Tax Revenue 7 862 14 939 16 427 17 807 18 870 18 400 16 269 18 302 ... Recettes non fiscales 248 Grants 500 500 1 300 2 500 2 928 3 183 9 068 2 800 ... Dons Total Expenditures and Net Lending 93 463 101 429 113 472 119 219 138 143 166 569 194 776 198 451 ... Dépenses totales et prêts nets Current expenditure 90 491 97 545 105 098 127 229 123 919 133 869 157 036 152 090 ... Dépenses courantes Of which Wages and Salaries 48 580 53 225 56 559 61 897 63 164 65 665 70 315 75 264 ... Dont rémunérations et salaires Capital expenditure 20 253 19 818 21 403 20 519 23 846 28 212 37 740 46 361 ... Dépenses d'équipement Net Lending 17 281 15 934 13 030 28 529 9 622 4 488 6 829 8 008 ... Prêts nets Fiscal Balance 8 392 11 841 12 384 4 994 23 184 37 838 47 639 38 435 ... Solde global y compris les dons VII-3 Balance of Payments VII-3 Balance des paiements Dirham (Millions) Dirham(Millions) Trade balance - 44 020 - 41 493 - 57 546 - 72 766 - 82 639 - 115 327 - 150 963 - 133 332 ... Balance commerciale Services Balance 21 452 25 053 30 046 37 764 47 119 55 179 51 475 45 427 ... Balance des services Net Income - 8 137 - 7 559 - 5 773 - 2 737 - 3 699 - 3 320 - 4 070 - 7 352 ... Revenus nets Current transfers, net total 36 700 39 237 43 106 47 760 55 544 62 897 67 622 58 449 ... Transferts courants Current account balance 5 995 15 238 9 833 10 020 16 325 - 571 - 35 937 - 36 808 ... Solde du compte courant VII-4 External Debt and Financial Flows VII-4 Dette extérieure et flux financiers US $ (Millions) $ E.U (Millions) Total external debt 15 721 16 752 16 588 14 431 15 661 17 821 18 291 21 163 22 144 Dette extérieure totale Private 4 262 5 092 4 962 3 770 3 776 4 039 2 987 3 243 3 394 Privée Public 11 459 11 660 11 626 10 661 11 885 13 781 15 305 17 919 18 750 Publique Total external debt service 2 800 3 352 2 826 2 645 2 336 2 702 2 601 1 971 2 037 Service de la dette extérieure Net Foreign Direct Investment Investissements étranger direct (flux 481 2 314 895 1 653 2 450 2 803 2 487 1 331 ... Inflows nets entrants) Net Total Official Development Aide publique au développement 353 548 705 691 1 044 1 073 1 063 912 ... assistance (nette totale) African Statistical Yearbook 2011 / Annuaire Statistique pour l'Afrique 2011
  • 250.
    Morocco Maroc 2002 2003 2004 2005 2006 2007 2008 2009 2010 Dirham (Millions) Dirham Exports, fob Exportations, fàb Exports - Total 86 389 83 887 86 365 94 825 104 785 123 941 155 740 111 967 ... Exportations - Total Main Products Principaux produits Clothing finished 18 451 18 549 18 676 17 899 20 699 20 474 18 923 17 752 ... Vëtements finis Hosiery 7 936 8 109 7 641 6 847 7 192 7 882 6 659 6 460 ... Articles de bonneterie Crustaceans, molluscs and shellfish 5 926 4 260 2 657 3 945 4 266 5 165 2 108 2 028 ... Crustacés, mollusques et coquillages Phosphoric acid 5 128 4 856 6 320 7 641 7 891 9 069 22 830 8 042 ... Acide phosphorique Phosphates 364 363 421 518 545 712 2 306 643 ... Phosphates Main Destinations Principales destinations France 29 084.0 28 679.0 29 521.0 29 829.0 32 518.0 34 104.0 31 384.0 27 464.0 ... France Spain 13 520.0 14 967.0 15 358.0 19 844.0 22 620.0 25 184.0 27 862.0 23 710.0 ... Espagne Italy 4 677.0 4 321.0 4 099.0 4 962.0 5 587.0 6 480.0 10 520.0 3 673.0 ... Italie United Kingdom 6 834.0 6 110.0 6 710.0 6 289.0 6 867.0 6 388.0 7 538.0 3 469.0 ... Grande Bretagne India 2 851.0 2 612.0 3 001.0 3 939.0 4 456.0 4 853.0 7 260.0 5 950.0 ... Inde 2002 2003 2004 2005 2006 2007 2008 2009 2010 Imports, cif Importations, cif Imports - Total 130 409 136 070 157 921 184 380 210 554 261 288 326 042 265 188 ... Importations - Total (millions) 249 Principaux produits Main Products Petroleum oils, crude 1 172 965 1 641 2 702 2 866 3 217 3 983 2 139 ... Huile brute de pétrole Gaz-oils & fuel-oils 1 546 4 375 3 201 4 990 7 365 10 024 17 684 15 721 ... Gaz-oils et fuel-oils Machinery and apparatus, diverse 4 909 5 604 6 247 7 210 8 693 9 636 11 087 10 235 ... Machines et appareils divers Fabrics 9 025 8 735 8 179 7 897 8 223 8 426 3 379 3 260 ... Tissus Passenger Cars 2 417 2 477 3 904 5 026 6 235 7 691 9 873 8 314 ... Voitures de tourisme Main Origin Principales provenances France 26 761.0 27 895.0 29 148.0 33 483.0 37 140.0 41 607.0 48 950.0 41 584.0 ... France Spain 15 159.0 16 873.0 19 246.0 21 448.0 24 128.0 27 544.0 36 447.0 31 968.0 ... Espagne Italy 7 566.0 9 693.0 10 312.0 11 103.0 13 299.0 16 695.0 21 820.0 18 850.0 ... Italie USA 5 615.0 5 513.0 6 501.0 6 104.0 9 492.0 15 442.0 21 742.0 14 409.0 ... Etats-Unis China 3 753.0 4 656.0 6 602.0 9 399.0 11 069.0 15 146.0 18 538.0 17 298.0 ... Chine African Statistical Yearbook 2011 / Annuaire Statistique pour l'Afrique 2011
  • 251.
    Mozambique Mozambique AREA (KM 2) 801 590 SUPERFICIE (KM 2) CAPITAL CITY Maputo Maputo CAPITALE CURRENCY New Metical Metical MONNAIE I SOCIAL AND DEMOGRAPHIC INDICATORS — INDICATEURS DEMOGRAPHIQUES ET SOCIAUX 2002 2003 2004 2005 2006 2007 2008 2009 2010 Population Population Population au milieu de l'année - Mid-year population - Total (Million) 18.1 18.5 19.0 19.4 19.9 20.4 20.9 21.4 ... Total (million) Population au milieu de l'année - Mid-year population - Urban (%) 30.1 30.4 30.7 31.0 30.2 29.8 31.7 31.9 ... Urbaine (%) Female (%) 51.9 51.8 51.8 51.8 51.7 51.7 51.6 51.6 ... Femme (%) Population by Age Group Population par groupe d'âge 0-14 8026 107 8180 899 8329 883 8476 450 8624 600 9398 100 9652 100 9909 100 1017 060 0-14 15-64 9564 288 9837 802 10127 492 10429 508 10739 210 10589 400 10896 500 11664 771 11555 300 15-64 65+ 487 175 495 125 504 128 514 078 524 866 645 000 659 300 562 120 690 900 65+ Active Population (000) 8 963.1 9 157.3 9 341.9 9 517.9 9 691.2 9 873.2 10 049.4 12 226.9 ... Population active (000) Female (%) 56.0 56.0 56.1 56.1 56.1 56.0 55.9 55.9 ... Femme (%) Taux brut de natalité - Total (par Crude birth rate - Total (per 1000) 41.8 41.3 40.9 40.5 40.2 42.2 42.0 41.8 41.6 1000) Taux brut de mortalité - Total (par Crude death rate - Total (per 1000) 17.8 17.2 16.8 16.4 16.2 14.6 14.3 14.0 13.7 1000) Life expectancy at birth - Total Espérance de vie à la naissance - 45.6 46.3 46.7 47.1 47.4 50.9 51.3 51.7 52.1 (years) Total (années) Net reproduction rate - (per Taux net de reproduction - (par ... ... ... 1.7 ... ... ... ... ... woman) femme) Indice synthétique de fécondité - Total fertility rate - (p woman) y (per ) 5.5 5.5 5.4 5.4 5.3 5.7 5.7 5.6 5.6 (par femme) Education Enseignement Teaching staff at first level - Total Personnel enseignant - 1er degré - 38.75 42.8 46.6 45.9 48.5 53.1 56.6 ... ... (thousands) Total (milliers) Teaching staff at second level - Total Personnel enseignant - 2ème degré - 250 7.43 9.1 10.5 11.0 12.1 14.9 17.3 ... ... (thousands) Total (milliers) Teaching staff at third level - Total Personnel enseignant - 3ème degré - 3.5 4.1 5.2 5.9 6.4 8.1 10.0 ... ... (thousands) Total (milliers) First level student enrollment - Total Elèves inscrits - 1er degré - Total 3 023 3 250 3 569 3 942 4 171 4 566 4 900 5 060 5 352 (thousands) (milliers) First level student enrollment - Elèves inscrits - 1er degré - Femmes 1 334 1 455 1 618 1 803 1 936 2 121 2 285 2 371 2 533 Female (thousands) (milliers) Second level student enrollment - Elèves inscrits - 2ème degré - Total 303 351 409 453 496 616 637 735 908 Total (thousands) (milliers) Second level student enrollment - Elèves inscrits - 2ème degré - 119 140 166 185 208 265 274 325 414 Female (thousands) Femmes (milliers) Third level student enrollment - Total Elèves inscrits - 3ème degré - Total ... 17.2 22.3 28.3 ... 63.5 75.5 81.3 ... (thousands) (milliers) Third level student enrollment - Elèves inscrits - 3ème degré - ... 5.5 7.0 9.4 ... 24.2 29.1 30.8 ... Female (thousands) Femmes (milliers) Public expenditure on education (% Dépenses publiques consacrées à 22.9 19.2 20.9 20.4 21.5 19.5 20.0 19.5 20.2 of budget) l'enseignement (% du budget) Health Santé Hospital beds - Total (per 10 000 Nombre de lits d'hôpitaux - Total 91 89 90 87 89 78 83 86 89 population) (pour 10 000) Nurses - Total (per 10 000 Nombre d'infirmières - Total (pour 27 27 33 30 22 23 24 24 24 population) 10 000) Physicians - Total (per 10 000 Nombre de médecins - Total (pour 3 2 3 3 3 3 4 4 4 population) 10 000) Public expenditure on Health (% of Dépenses publiques consacrées à la 10 10 9 13 16 15 17 17 17 budget) santé (% du budget) African Statistical Yearbook 2011 / Annuaire Statistique pour l'Afrique 2011
  • 252.
    Mozambique Mozambique II NATIONAL ACCOUNTS — COMPTES NATIONAUX 2002 2003 2004 2005 2006 2007 2008 2009 2010 Gross domestic product by kind of economic activity at current prices Produit intérieur brut par branche d'activité économique aux prix courants New Metical (Millions) Metical(Millions) Agriculture 25 289 28 132 31 879 37 122 45 853 52 829 64 368 71 651 ... Agriculture Mining and quarrying 523 657 1 161 1 476 2 337 2 967 3 318 3 566 ... Industries extractives Manufacturing 12 623 16 636 20 529 21 304 26 355 29 370 33 610 34 449 ... Industries manufacturières Electricity, gas & water 4 415 5 071 6 359 7 606 9 579 11 065 10 044 11 586 ... Electricité, gaz et eau Construction 3 482 3 826 3 835 4 507 5 213 5 936 6 860 7 533 ... Bâtiments et travaux publics Wholesale & retail trade, Commerce de gros et de détail, 12 187 12 645 13 712 20 355 25 579 32 051 37 238 41 638 ... restaurants, hotels restaurants et hôtels Banques, assurances, affaires Finance, insurance, real estate, etc. 13 979 14 320 15 720 18 056 19 318 21 313 23 016 24 762 ... immobilières Transport and communications 9 896 10 421 12 415 14 560 16 458 19 011 22 180 24 913 ... Transport(s) et communications Administrations publiques et Public administration and defense 3 706 4 134 5 005 5 659 6 640 7 350 8 519 9 848 ... défense Other services 6 605 7 365 8 760 10 185 11 984 14 094 16 512 18 777 ... Autres services Moins Services d’intermédiation Less Imputed Service Charges - 1 806 - 2 867 - 3 085 - 3 137 - 4 732 - 5 335 - 5 688 - 6 403 ... financière Gross domestic product at factor Produit intérieur brut aux couts des 90 897 100 341 116 290 137 692 164 584 190 652 219 977 242 322 ... cost / basic prices facteurs / prix de base Plus: Indirect Taxes / taxes on Plus taxes indirectes/impôts sur les 8 582 10 632 12 379 14 015 15 658 16 991 20 380 23 891 ... products, less subsidies produits, moins les subventions Expenditure on Gross domestic product at current purchaser's values Emploi du produit intérieur brut aux prix courants d'acquisition New Metical (Millions) Metical(Millions) Consommation finale des Government final consumption 12 247 14 156 17 729 19 663 22 228 24 738 29 691 34 368 ... administrations publiques Private final consumption 87 757 98 481 109 881 126 354 143 382 166 398 192 513 214 369 ... Consommation finale privée Gross fixed capital formation 29 802 24 721 23 997 28 361 31 819 33 504 39 614 43 959 ... Formation brute de capital fixe Increase in inventories - 367 226 - 392 - 1 544 - 1 187 - 1 721 2 677 - 4 164 ... Variation des stocks Exports of goods and services 24 816 29 137 38 341 46 213 54 861 64 146 72 638 73 799 ... Exportations de biens et services Moins importations de biens et 251 Less imports of goods and services 54 776 55 747 60 888 67 340 70 861 79 423 96 775 96 119 ... services GDP at purchasers' values 99 479 110 973 128 668 151 707 180 242 207 644 240 358 266 213 ... PIB aux prix d'acquisition Gross domestic product by kind of economic activity at constant Produit intérieur brut par branche d'activité economique aux prix constants prices Annual Growth Rates (%) Taux de croissance annuel (%) Agriculture 11.2 5.4 4.8 6.5 10.2 8.2 9.1 6.0 5.9 Agriculture Mining and quarrying 28.7 16.1 71.6 0.7 27.8 19.3 7.2 3.0 6.6 Industries extractives Manufacturing 8.7 17.0 13.2 2.1 3.0 3.1 4.9 2.4 1.8 Industries manufacturières Electricity, gas & water 10.4 10.1 16.3 17.2 13.1 8.6 -12.2 13.0 4.9 Electricité, gaz et eau Construction 10.8 9.7 -7.0 13.2 10.4 11.8 12.5 5.8 8.3 Bâtiments et travaux publics Wholesale & retail trade, Commerce de gros et de 4.6 6.5 6.6 12.3 19.9 9.4 7.6 5.6 5.8 restaurants, hotels détail,restaurants et hôtels Banques, assurances, affaires Finance, insurance, real estate, etc. 4.0 3.4 10.9 15.3 1.9 3.4 1.7 5.2 7.3 immobilières Transport and communications 8.4 2.9 9.6 7.9 10.4 9.7 13.0 10.2 7.3 Transport(s) et communications Administrations publiques et Public administartion and defense 7.4 4.8 4.6 6.9 11.2 5.1 7.2 7.5 11.8 défense Other services 4.4 5.9 7.9 8.1 7.7 10.6 6.2 8.1 5.3 Autres services Moins Services d’intérmediation Less Imputed Service Charges 23.7 65.5 15.0 6.6 27.7 2.9 6.5 9.3 16.1 financière Gross domestic product at factor Produit intérieur brut aux couts des 7.7 6.1 8.3 8.8 8.7 7.6 6.2 6.2 5.6 cost / basic prices facteurs / prix de base Plus: Indirect Taxes / taxes on Plus taxes indirectes/impôts sur les 26.3 10.3 4.2 4.6 8.6 4.5 13.0 7.6 16.7 products, less subsidies produits, moins les subventions Gross domestic product at market Produit intérieur brut aux prix du 9.2 6.5 7.9 8.4 8.7 7.3 6.8 6.3 6.6 prices marché 2009: semi-final 2010:Estimated 2009: semi-définitif 2010:Estimée African Statistical Yearbook 2011 / Annuaire Statistique pour l'Afrique 2011
  • 253.
    Mozambique Mozambique Expenditure on Gross domestic product at constant purchasers' Emplois du produit intérieur brut aux prix constants d'acquisition values Annual Growth Rates (%) Taux de croissance annuel (%) Consommation finale des Government final consumption 25.4 8.7 9.1 5.3 10.2 7.2 12.4 8.7 ... administrations publiques Private final consumption 34.9 5.4 4.3 7.0 4.5 7.5 8.7 4.6 ... Consommation finale privée Gross fixed capital formation 33.6 -7.8 -5.6 10.2 6.2 5.8 17.8 5.4 ... Formation brute de capital fixe Exports of goods and services 38.3 19.0 21.3 6.3 12.2 15.9 0.3 2.3 ... Exportations de biens et services Moins importations de biens et Less imports of goods and services 104.6 4.6 1.7 5.5 1.2 12.8 18.0 1.0 ... services III INFLATION 2002 2003 2004 2005 2006 2007 2008 2009 2010 Annual Growth Rates (%) Taux de croissance annuel (%) All Item 9.1 11.4 9.3 13.1 8.1 12.1 11.8 2.3 17.4 Ensemble Food 8.0 11.8 7.7 15.4 7.9 16.1 16.8 3.4 21.6 Alimentation Health 18.8 10.3 2.6 4.9 11.6 5.0 7.1 5.9 6.1 Santé Energy 12.7 11.2 23.3 19.1 16.9 14.9 8.3 -7.0 14.6 Energie Transport 13.9 10.7 7.7 22.9 2.5 6.4 3.4 -0.6 7.5 Transport IV AGRICULTURAL PRODUCTION - PRODUCTION AGRICOLE 2002 2003 2004 2005 2006 2007 2008 2009 2010 Tons (Thousand) Tonnes (milliers) Cassava, Tons (thousands) 5 925 6 825 6 916 7 276 7 552 8 160 8 462 9 600 9 738 Manioc, tonnes (milliers) Maize, Tons (thousands) 1 236 1 248 1 435 1 464 1 534 1 579 1 709 1 854 2 090 Maïs, tonnes (milliers) Beans, Tons (thousands) 198 205 194 209 219 225 240 252 264 Haricots, tonnes (milliers) Rice, Tons (thousands) 168 200 187 177 183 196 213 369 258 Riz, tonnes (milliers) Sorghum, Tons (thousands) 314 322 310 330 339 348 380 391 389 Sorgho, tonnes (milliers) V MINING PRODUCTION - PRODUCTION MINIERE 252 2002 2003 2004 2005 2006 2007 2008 2009 2010 Natural Gaz, terajoule (thousands) 88.6 54.8 49.7 88.9 104.2 104.5 116.6 120.9 124.8 Gaz naturel, térajoule (milliers) Bauxite, Tons 9 119.0 11 793.0 8 977.3 9 518.0 11 069.0 8 650.0 5 443.0 3 612.0 8 556.2 Bauxite, tonnes Natural Coal, Tons (thousands) 9.1 11.8 16.5 3.4 41.0 23.6 37.7 25.9 38.2 Houille naturelle, tonnes (milliers) VI ENERGY - ENERGIE 2002 2003 2004 2005 2006 2007 2008 2009 2010 Electricity - total hydro production, Électricité - production hydraulique 11 583.6 10 626.6 11 559.4 13 105.0 14 490.7 16 287.1 14 767.6 16 289.7 16 526.5 kilowatt hours (millions) totale, kilowatt-heures (millions) Electricity - total thermal production, Électricité - production thermique 296.4 276.5 148.3 167.5 224.6 200.1 351.9 386.2 ... kilowatt hours (millions) totale, kilowatt-heures (millions) Electricity - total production, self- Electricité - Production totale privée ... ... ... ... ... ... ... ... ... producer (Million Kilowatt Hours) (million de kilowatt heures) Electricity - total production, public Electricité - Production totale 11 880 10 903 11 708 13 272 14 664 16 356 15 120 16 676 ... (Million Kilowatt Hours) publique (million de kilowatt heures) African Statistical Yearbook 2011 / Annuaire Statistique pour l'Afrique 2011
  • 254.
    Mozambique Mozambique VII TOURISM AND INFRASTRUCTURE - TOURISME ET INFRASTUCTURE 2002 2003 2004 2005 2006 2007 2008 2009 2010 Arrivals - Tourists (thousands) 541 441 470 578 664.3 771 1951.49 ... ... Arrivées - touristes (milliers) Rooms in hotels and similar Chambres d'hotels et établissements establishments (thousands) 3.7440576 3.7964601 4.9744469 5.0629439 5.1565433 5.251546988 5.3762415 ... ... assimilés (milliers) Paved Road (% of total) 19 19 19 18 18 18 18 ... ... Routes asphaltées (% du total) Total Network (Railways-km) 28 463 28 463 28 463 29 341 29 341 29 323 29 324 ... ... Réseau total voies ferrées-Km Main Telephone Lines (per 1,000 Lignes téléphoniques fixes (pour 4 4 4 3 3 3 3 ... ... inhabitants) 1000 habitants) Mobile Cellular Subscribers (per Abonnés aux téléphones mobiles 13 22 35 73 112 154 197 ... ... 1,000 inhabitants) (pour 1000 habitants) VII FINANCIAL AND MONETARY STATISTICS - FINANCES ET STATISTIQUES MONETAIRES 2002 2003 2004 2005 2006 2007 2008 2009 2010 VII-1 Monetary Statistics VII-1 Statistiques monétaires New Metical (Millions) Metical(Millions) Money supply (M1) 20 459 23 661 24 921 32 006 38 037 46 364 53 867 73 901 88 802 Masse monétaire (M1) Quasi-money 7 677 8 825 9 198 10 400 13 437 18 620 26 652 33 174 40 027 Quasi-monnaie of which Demand Deposit ... ... ... ... ... ... ... ... ... dont Monnaie scripturale Net foreign assets 11 006 14 764 26 117 34 084 47 607 54 283 56 957 63 737 76 677 Avoirs extérieurs nets Domestic credit 12 161 11 370 10 475 12 596 14 558 20 895 33 520 60 111 81 144 Crédit intérieur of which claims on private sector 12 817 12 656 12 179 17 965 23 898 28 055 43 995 65 981 85 342 dont créances sur le secteur privé of which Claims on government dont créances nettes sur le - 2 321 - 2 856 - 3 123 - 7 381 - 11 932 - 9 983 - 11 523 - 11 330 - 11 835 sector, net gouvernement International reserves (millions of US Réserves internationales (millions de 802 938 1 131 1 054 1 156 1 445 1 578 2 099 1 925 $) $ EU) Average Exchange Rate (National Taux de change (moyen) (monnaie 23.68 23.78 22.58 23.06 25.40 25.84 24.30 27.52 33.95 Currency per us $) nationale par dollars) VII-2 Public Finance VII-2 Finances publiques New Metical (Millions) Metical(Millions) Total Revenues and Grants 22 003 25 304 27 865 30 320 44 954 51 841 60 903 52 762 ... Recettes totales et dons Tax Revenue 10 629 13 695 14 434 16 721 23 314 29 310 33 344 29 848 ... Recettes fiscales Non Tax Revenue 1 427 1 019 2 128 3 662 3 683 3 748 4 924 3 956 ... Recettes non fiscales Grants 9 947 10 590 11 303 9 937 17 957 18 783 22 635 18 958 ... Dons 253 Total Expenditures and Net Lending 28 709 33 373 32 728 35 637 46 871 56 777 67 275 58 933 ... Dépenses totales et prêts nets Current expenditure 13 469 16 342 19 006 20 365 26 602 31 838 37 634 34 367 ... Dépenses courantes Of which Wages and Salaries 6 206 7 734 9 195 10 358 12 993 16 091 19 273 18 149 ... Dont rémunérations et salaires Capital expenditure 12 073 13 369 12 880 13 101 18 635 23 298 27 742 21 740 ... Dépenses d'équipement Net Lending 3 167 3 662 842 2 171 1 634 1 641 1 899 2 826 ... Prêts nets Fiscal Balance - 6 706 - 8 069 - 4 863 - 5 317 - 1 917 - 4 936 - 6 372 - 6 171 ... Solde global y compris les dons VII-3 Balance of Payments VII-3 Balance des paiements New Metical (Millions) Metical(Millions) Trade balance - 667 - 604 - 346 - 497 - 268 - 399 - 990 - 1 275 - 997 Balance commerciale Services Balance - 238 - 270 - 276 - 307 - 372 - 397 - 410 - 457 - 493 Balance des services Net Income - 603 - 166 - 300 - 360 - 388 - 592 - 631 - 251 - 85 Revenus nets Current transfers, net total 638 223 314 403 501 592 852 763 671 Transferts courants Current account balance - 869 - 817 - 607 - 761 - 526 - 795 - 1 179 - 1 220 - 904 Solde du compte courant VII-4 External Debt and Financial Flows VII-4 Dette extérieure et flux financiers US $ (Millions) $ E.U (Millions) Total external debt 4 988 5 179 8 750 9 040 7 431 5 859 6 102 6 291 6 478 Dette extérieure totale Private 0 0 4 334 4 391 4 149 2 542 2 418 2 173 1 983 Privée Public 3 606 3 939 4 416 4 649 3 282 3 317 3 684 4 118 4 495 Publique Total external debt service 49 57 59 65 62 48 50 47 67 Service de la dette extérieure Net Foreign Direct Investment Investissements étranger direct (flux 348 337 245 108 154 427 587 893 789 Inflows nets entrants) Net Total Official Development Aide publique au développement ... ... ... ... ... ... ... ... ... assistance (nette totale) African Statistical Yearbook 2011 / Annuaire Statistique pour l'Afrique 2011
  • 255.
    Mozambique Mozambique 2002 2003 2004 2005 2006 2007 2008 2009 2010 US $ (Millions) Metical Exports, fob Exportations, fàb Exports - Total 810 1 044 1 504 1 745 2 381 2 412 2 653 2 147 2 243 Exportations - Total Main Products Principaux produits Aluminium 361 568 915 1 021 1 401 1 480 1 452 868 1 160 Aluminium Electricity 107 113 102 142 178 240 221 274 277 Électricité Natural Gas ... ... 31 100 110 121 152 78 153 Gas naturel Prawns 114 76 92 71 87 62 45 24 52 Crevettes Cotton 16 32 36 56 46 42 48 26 8 Coton Main Destinations Principales destinations Escandinavian Countries 20.8 29.6 916.5 1 042.9 1 422.2 1 491.7 1 476.4 893.9 1 181.9 Pays scandinaves South Africa 125.0 169.6 211.4 280.4 361.7 414.5 265.5 460.3 466.3 Afrique du Sud Zimbabwe 54.7 29.5 33.4 46.0 76.1 71.1 81.3 73.8 72.1 Zimbabwe Spain 76.0 70.0 37.9 32.9 43.5 37.1 51.0 31.4 30.6 Espagne Portugal 39.9 38.9 47.0 21.9 29.7 31.2 26.4 32.2 108.3 Portugal 2002 2003 2004 2005 2006 2007 2008 2009 2010 Imports, cif Importations, cif 254 Imports - Total 1 543 1 753 2 035 2 408 2 869 3 050 4 008 3 764 3 564 Importations - Total (millions) Principaux produits Main Products Machinery 149 285 305 345 398 418 532 536 425 Machines Vehicles 161 113 118 150 208 217 300 301 249 Véhicules Patrol 59 114 145 171 234 256 467 324 492 Patrol Row Material for Alumina 320 270 308 386 564 603 675 426 561 Materiau pour Allumine Cereals 113 127 145 173 180 194 244 251 141 Céréales Main Origin Principales provenances South Africa 499.2 654.4 666.9 1 002.9 947.9 970.8 1 164.9 1 116.7 1 227.2 Afrique du Sud Portugal 8.4 9.2 223.2 91.6 180.8 383.9 698.0 57.5 154.3 Portugal United States of America 92.6 62.4 70.6 85.4 89.5 103.6 115.8 146.8 74.3 Etats-Unis India 78.2 104.3 47.8 70.7 101.6 80.8 160.4 137.4 201.7 Espagne Escandinavian Countries 79.3 72.9 0.6 ... ... ... 144.4 158.1 643.0 Pays scandinaves African Statistical Yearbook 2011 / Annuaire Statistique pour l'Afrique 2011
  • 256.
    Namibia Namibie AREA (KM 2) 824 292 SUPERFICIE (KM 2) CAPITAL CITY Windhoek Windhoek CAPITALE CURRENCY Namibian Dollar Dollar Namibien MONNAIE I SOCIAL AND DEMOGRAPHIC INDICATORS — INDICATEURS DEMOGRAPHIQUES ET SOCIAUX 2002 2003 2004 2005 2006 2007 2008 2009 2010 Population Population Population au milieu de l'année - Mid-year population - Total (Million) 1.9 1.9 2.0 2.0 2.0 2.1 2.1 2.2 2.2 Total (million) Population au milieu de l'année - Mid-year population - Urban (%) 33.4 34.0 34.5 35.1 35.6 36.2 36.8 37.4 38.0 Urbaine (%) Female (%) 51.0 50.9 50.9 50.8 50.8 50.8 50.7 50.7 50.7 Femme (%) Population by Age Group Population par groupe d'âge 0-14 763 948 770 965 777 205 782 771 787 664 791 978 796 000 800 103 804 560 0-14 15-64 1069 208 1096 806 1125 559 1156 014 1188 415 1222 435 1257 355 1292 161 1326 102 15-64 65+ 65 314 66 845 68 474 70 244 72 174 74 258 76 499 78 873 81 375 65+ Active Population (000) 637.1 654.6 670.5 691.0 711.6 734.9 759.7 782.7 807.0 Population active (000) Female (%) 45.4 45.6 45.7 46.0 46.2 46.5 46.8 46.5 46.6 Femme (%) Taux brut de natalité - Total (par Crude birth rate - Total (per 1000) 30.0 30.0 29.0 29.0 28.0 28.0 28.0 27.0 28.0 1000) Taux brut de mortalité - Total (par Crude death rate - Total (per 1000) 10.0 10.0 10.0 10.0 9.0 9.0 9.0 8.0 8.0 1000) Life expectancy at birth - Total Espérance de vie à la naissance - 58.0 58.0 58.0 59.0 59.0 60.0 61.0 62.0 61.0 (years) Total (années) Net reproduction rate - (per Taux net de reproduction - (par ... ... ... 1.0 ... ... ... ... 1.0 woman) femme) Indice synthétique de fécondité - Total fertility rate - (p woman) y (per ) 4.0 4.0 4.0 4.0 4.0 3.0 3.0 3.0 3.0 (par femme) Education Enseignement Teaching staff at first level - Total Personnel enseignant - 1er degré - ... 12.9 12.2 13.1 12.8 13.7 13.9 13.5 ... (thousands) Total (milliers) Teaching staff at second level - Total Personnel enseignant - 2ème degré - 5.87 5.6 6.4 5.9 6.0 6.4 6.7 ... ... 255 (thousands) Total (milliers) Teaching staff at third level - Total Personnel enseignant - 3ème degré - 0.9 0.9 ... ... 0.8 ... 1.2 ... ... (thousands) Total (milliers) First level student enrollment - Total Elèves inscrits - 1er degré - Total 405 409 403 404 403 410 407 407 ... (thousands) (milliers) First level student enrollment - Elèves inscrits - 1er degré - Femmes 203 204 202 201 200 203 202 201 ... Female (thousands) (milliers) Second level student enrollment - Elèves inscrits - 2ème degré - Total 138 141 144 148 153 158 164 ... ... Total (thousands) (milliers) Second level student enrollment - Elèves inscrits - 2ème degré - 73 75 76 79 81 85 88 ... ... Female (thousands) Femmes (milliers) Third level student enrollment - Total Elèves inscrits - 3ème degré - Total 11.0 11.8 ... 13.6 13.2 ... 19.7 ... ... (thousands) (milliers) Third level student enrollment - Elèves inscrits - 3ème degré - 6.4 6.3 ... 6.3 6.2 ... 11.2 ... ... Female (thousands) Femmes (milliers) Public expenditure on education (% Dépenses publiques consacrées à ... ... ... ... ... ... ... ... ... of budget) l'enseignement (% du budget) Health Santé Hospital beds - Total (per 10 000 Nombre de lits d'hôpitaux - Total ... ... 30 33 33 ... ... 27 ... population) (pour 10 000) Nurses - Total (per 10 000 Nombre d'infirmières - Total (pour ... ... 308 ... ... ... ... 310 ... population) 10 000) Physicians - Total (per 10 000 Nombre de médecins - Total (pour ... ... 30 ... ... ... ... 30 ... population) 10 000) Public expenditure on Health (% of Dépenses publiques consacrées à la 11 11 11 13 11 ... ... ... ... budget) santé (% du budget) African Statistical Yearbook 2011 / Annuaire Statistique pour l'Afrique 2011
  • 257.
    Namibia Namibie II NATIONAL ACCOUNTS — COMPTES NATIONAUX 2002 2003 2004 2005 2006 2007 2008 2009 2010 Gross domestic product by kind of economic activity at current prices Produit intérieur brut par branche d'activité économique aux prix courants Namibian Dollar (Millions) Dollar Namibien(Millions) Agriculture 3 544 3 807 3 816 4 792 5 223 5 375 6 387 6 706 ... Agriculture Mining and quarrying 4 793 2 992 4 147 4 257 6 654 6 816 11 772 7 744 ... Industries extractives Manufacturing 4 228 5 149 5 339 5 738 7 792 9 767 9 404 10 489 ... Industries manufacturières Electricity, gas & water 731 740 900 1 091 1 012 1 558 1 663 1 934 ... Electricité, gaz et eau Construction 716 983 1 138 1 259 1 826 2 286 3 013 2 922 ... Bâtiments et travaux publics Wholesale & retail trade, Commerce de gros et de détail, 4 215 4 784 5 408 6 031 6 819 7 884 8 965 10 096 ... restaurants, hotels restaurants et hôtels Banques, assurances, affaires Finance, insurance, real estate, etc. 9 644 10 936 12 293 12 525 13 870 16 020 17 944 20 032 ... immobilières Transport and communications 1 462 1 955 2 403 2 662 2 535 2 955 3 400 3 717 ... Transport(s) et communications Administrations publiques et Public administration and defense 3 254 3 677 3 857 4 115 4 423 5 105 6 219 8 088 ... défense Other services 294 322 343 358 384 424 492 559 ... Autres services Moins Services d’intermédiation Less Imputed Service Charges - 488 - 546 - 469 - 517 - 644 - 765 - 855 - 907 ... financière Gross domestic product at factor Produit intérieur brut aux couts des 32 391 34 798 39 175 42 311 49 894 57 425 68 404 71 380 ... cost / basic prices facteurs / prix de base Plus: Indirect Taxes / taxes on Plus taxes indirectes/impôts sur les 3 039 2 506 3 502 3 864 4 133 4 678 5 598 6 434 ... products, less subsidies produits, moins les subventions Expenditure on Gross domestic product at current purchaser's values Emploi du produit intérieur brut aux prix courants d'acquisition Namibian Dollar (Millions) Dollar Namibien(Millions) Consommation finale des Government final consumption 7 613 8 283 8 693 8 905 10 526 12 840 15 158 18 951 ... administrations publiques Private final consumption 21 797 24 534 25 916 26 734 30 340 35 664 40 939 45 717 ... Consommation finale privée Gross fixed capital formation 7 066 7 121 7 922 8 594 11 686 14 696 18 815 19 351 ... Formation brute de capital fixe Increase in inventories - 504 105 216 498 342 32 1 794 1 871 ... Variation des stocks Exports of goods and services 16 299 16 185 16 991 18 678 24 566 31 496 38 777 34 581 ... Exportations de biens et services 256 Moins importations de biens et Less imports of goods and services 17 032 19 574 17 959 18 615 22 454 32 310 39 080 41 488 ... services GDP at purchasers' values 35 430 37 304 42 677 46 175 54 027 62 103 74 002 77 814 ... PIB aux prix d'acquisition Gross domestic product by kind of economic activity at constant Produit intérieur brut par branche d'activité economique aux prix constants prices Annual Growth Rates (%) Taux de croissance annuel (%) Agriculture 10.2 4.1 1.1 5.5 -0.7 -9.3 0.4 -4.1 ... Agriculture Mining and quarrying 36.0 -8.2 45.0 -10.9 27.6 0.5 -2.9 -45.0 ... Industries extractives Manufacturing 4.0 13.9 0.4 7.5 2.7 8.4 2.2 6.5 ... Industries manufacturières Electricity, gas & water -2.2 0.9 7.0 24.3 5.6 4.4 3.2 6.0 ... Electricité, gaz et eau Construction -31.0 27.2 5.9 2.5 37.2 14.6 15.1 -7.3 ... Bâtiments et travaux publics Wholesale & retail trade, Commerce de gros et de 6.4 5.9 8.3 8.6 7.6 8.2 2.8 3.3 ... restaurants, hotels détail,restaurants et hôtels Banques, assurances, affaires Finance, insurance, real estate, etc. -3.3 6.3 11.0 0.0 3.3 6.8 6.2 4.9 ... immobilières Transport and communications 10.3 15.7 25.8 9.3 14.2 5.4 2.7 5.4 ... Transport(s) et communications Administrations publiques et Public administartion and defense 4.7 6.6 4.0 -4.8 3.9 10.4 11.7 4.1 ... défense Other services 2.2 2.2 2.4 2.0 2.3 3.4 5.1 4.4 ... Autres services Moins Services d’intérmediation Less Imputed Service Charges -0.8 7.5 10.6 10.7 14.3 9.9 2.8 -0.6 ... financière Gross domestic product at factor Produit intérieur brut aux couts des 3.7 6.5 10.5 2.2 7.3 5.4 4.3 -1.2 ... cost / basic prices facteurs / prix de base Plus: Indirect Taxes / taxes on Plus taxes indirectes/impôts sur les 17.8 -19.9 37.5 5.9 4.1 4.8 4.0 4.3 ... products, less subsidies produits, moins les subventions Gross domestic product at market Produit intérieur brut aux prix du 4.8 4.2 12.3 2.5 7.1 5.4 4.3 -0.7 ... prices marché Break in the serie from 2004 Rupture de la série à partir 2004 African Statistical Yearbook 2011 / Annuaire Statistique pour l'Afrique 2011
  • 258.
    Namibia Namibie Expenditure on Gross domestic product at constant purchasers' Emplois du produit intérieur brut aux prix constants d'acquisition values Annual Growth Rates (%) Taux de croissance annuel (%) Consommation finale des Government final consumption -2.6 3.1 5.0 -5.9 11.0 12.6 8.2 9.8 ... administrations publiques Private final consumption 7.3 7.7 3.0 5.1 1.3 18.8 1.3 9.6 ... Consommation finale privée Gross fixed capital formation -0.8 -5.0 6.2 3.6 29.8 12.1 13.1 -1.6 ... Formation brute de capital fixe Exports of goods and services 16.2 8.9 5.4 -0.8 15.3 6.4 5.2 -14.9 ... Exportations de biens et services Moins importations de biens et Less imports of goods and services 6.2 10.5 -10.0 0.9 16.3 31.8 6.9 4.1 ... services III INFLATION 2002 2003 2004 2005 2006 2007 2008 2009 2010 Annual Growth Rates (%) Taux de croissance annuel (%) All Item 11.4 7.1 4.2 2.2 5.0 6.7 10.3 8.8 3.2 Ensemble Food ... 9.5 0.8 1.5 6.5 12.3 16.3 10.7 ... Alimentation Health ... 5.9 2.9 0.7 -2.2 4.7 2.2 5.6 ... Santé Energy ... 7.2 6.8 1.6 3.2 3.4 3.8 7.7 ... Energie Transport ... 7.6 5.3 6.8 8.1 6.0 12.9 5.9 ... Transport IV AGRICULTURAL PRODUCTION - PRODUCTION AGRICOLE 2002 2003 2004 2005 2006 2007 2008 2009 2010 Tons (Thousand) Tonnes (milliers) Millet, Tons (thousands) 56 52 74 48 59 60 60 ... ... Millet, tonnes (milliers) Maize, Tons (thousands) 28 29 28 41 61 60 60 ... ... Maïs, tonnes (milliers) Wheat, Tons (thousands) 10 10 8 11 13 13 13 ... ... Blé, tonnes (milliers) Grapes, Tons (thousands) 9 10 12 16 19 20 20 ... ... Raisins, tonnes (milliers) Sorghum, Tons (thousands) 6 6 7 8 10 10 10 ... ... Sorgho, tonnes (milliers) V MINING PRODUCTION - PRODUCTION MINIERE 257 2002 2003 2004 2005 2006 2007 2008 2009 2010 Uranium ores and concentrates, Minerais et concentrés d'uranium, 3.0 2.0 3.0 2.0 3.0 3.0 3.0 3.0 ... metric tons (thousands) tonnes métriques (milliers) Silver ores and concentrates 9 000.0 20 000.0 44 000.0 45 000.0 50 000.0 34 102.0 31 307.0 8 000.0 ... Minerais d'argent et concentrés (Kilograms) (kilogrammes) Lead ores and concentrates, metric Minerais de plomb et concentrés, 11.0 13.0 13.0 19.0 16.0 14.0 12.0 11.0 ... tons (thousands) tonnes métriques (milliers) VI ENERGY - ENERGIE 2002 2003 2004 2005 2006 2007 2008 2009 2010 Electricity - total hydro production, Électricité - production hydraulique 850.0 1 456.0 1 616.0 1 426.0 1 601.0 1 331.0 ... ... ... kilowatt hours (millions) totale, kilowatt-heures (millions) Electricity - total thermal production, Électricité - production thermique 15 636.0 16 448.0 17 521.0 20 824.0 21 408.0 21 248.0 ... ... ... kilowatt hours (millions) totale, kilowatt-heures (millions) Electricity - total production, self- Electricité - Production totale privée 1 653 1 794 1 916 2 225 2 298 2 265 ... ... ... producer (Million Kilowatt Hours) (million de kilowatt heures) Electricity - total production, public Electricité - Production totale 15 027 16 313 17 420 20 231 20 894 20 593 ... ... ... (Million Kilowatt Hours) publique (million de kilowatt heures) African Statistical Yearbook 2011 / Annuaire Statistique pour l'Afrique 2011
  • 259.
    Namibia Namibie VII TOURISM AND INFRASTRUCTURE - TOURISME ET INFRASTUCTURE 2002 2003 2004 2005 2006 2007 2008 2009 2010 Arrivals - Tourists (thousands) 757 695 ... 778 833 929 ... ... ... Arrivées - touristes (milliers) Rooms in hotels and similar Chambres d'hotels et établissements establishments (thousands) 3 3 ... ... ... ... ... ... ... assimilés (milliers) Paved Road (% of total) 13 ... ... ... ... ... ... ... ... Routes asphaltées (% du total) Total Network (Railways-km) ... ... ... ... ... ... ... ... ... Réseau total voies ferrées-Km Main Telephone Lines (per 1,000 Lignes téléphoniques fixes (pour 60 70 60 70 70 70 70 70 ... inhabitants) 1000 habitants) Mobile Cellular Subscribers (per Abonnés aux téléphones mobiles 80 120 150 220 300 380 490 560 ... 1,000 inhabitants) (pour 1000 habitants) VII FINANCIAL AND MONETARY STATISTICS - FINANCES ET STATISTIQUES MONETAIRES 2002 2003 2004 2005 2006 2007 2008 2009 2010 VII-1 Monetary Statistics VII-1 Statistiques monétaires Namibian Dollar (Millions) Dollar Namibien(Millions) Money supply (M1) 6 887 8 081 9 563 9 409 13 679 14 636 18 571 20 897 ... Masse monétaire (M1) Quasi-money 5 547 5 546 6 259 7 961 8 833 10 166 10 666 10 068 ... Quasi-monnaie of which Demand Deposit ... ... ... ... ... ... ... ... ... dont Monnaie scripturale Net foreign assets 2 084 684 493 - 157 4 853 6 844 13 575 15 425 ... Avoirs extérieurs nets Domestic credit 14 933 17 347 21 170 25 670 28 454 30 275 31 930 34 042 ... Crédit intérieur of which claims on private sector 14 834 16 676 19 919 23 922 27 453 30 990 33 260 36 578 ... dont créances sur le secteur privé of which Claims on government dont créances nettes sur le - 151 507 872 1 406 121 - 2 135 - 4 643 - 5 846 ... sector, net gouvernement International reserves (millions of US Réserves internationales (millions de 323 325 345 312 450 896 1 293 2 051 ... $) $ EU) Average Exchange Rate (National Taux de change (moyen) (monnaie 10.54 7.56 6.46 6.36 6.77 7.05 8.26 8.47 7.32 Currency per us $) nationale par dollars) VII-2 Public Finance VII-2 Finances publiques Namibian Dollar (Millions) Dollar Namibien(Millions) Total Revenues and Grants 8 981 10 485 9 767 11 425 13 108 17 593 20 672 23 449 23 542 Recettes totales et dons Tax Revenue 8 166 9 330 8 763 10 468 11 963 15 843 19 026 21 106 21 595 Recettes fiscales Non Tax Revenue 757 1 121 971 886 1 105 1 701 1 568 2 260 1 671 Recettes non fiscales 258 Grants 58 34 34 70 39 50 78 83 276 Dons Total Expenditures and Net Lending 10 302 11 399 12 245 12 771 13 198 15 278 17 542 21 898 25 824 Dépenses totales et prêts nets Current expenditure 8 674 9 503 10 448 10 786 7 815 8 378 9 669 11 242 13 499 Dépenses courantes Of which Wages and Salaries 4 326 4 709 5 117 5 527 5 889 6 214 6 805 7 559 8 920 Dont rémunérations et salaires Capital expenditure 1 150 1 246 1 397 1 619 1 443 2 026 2 530 3 925 5 702 Dépenses d'équipement Net Lending 478 650 400 366 208 863 1 200 1 119 443 Prêts nets Fiscal Balance - 1 321 - 913 - 2 478 - 1 346 - 90 2 315 3 130 1 551 - 2 282 Solde global y compris les dons VII-3 Balance of Payments VII-3 Balance des paiements US $ (Millions) $ E.U(Millions) Trade balance - 1 220 - 4 658 - 1 558 - 243 1 438 - 1 429 189 - 6 511 - 8 119 Balance commerciale Services Balance 486 1 269 591 306 674 615 - 492 - 396 577 Balance des services Net Income 238 500 612 - 102 - 252 - 769 - 1 291 - 2 517 - 2 938 Revenus nets Current transfers, net total 3 202 3 670 4 529 4 547 6 733 7 421 9 762 10 618 7 805 Transferts courants Current account balance 2 706 781 4 174 4 508 8 593 5 838 8 168 1 194 - 2 674 Solde du compte courant VII-4 External Debt and Financial Flows VII-4 Dette extérieure et flux financiers US $ (Millions) $ E.U (Millions) Total external debt 1 152 1 618 2 060 1 848 2 245 2 261 2 002 2 262 2 396 Dette extérieure totale Private 980 1 377 1 720 1 532 1 883 1 815 1 624 1 795 1 862 Privée Public 171 241 341 316 362 446 377 467 534 Publique Total external debt service 319 442 609 764 891 1 085 921 565 510 Service de la dette extérieure Net Foreign Direct Investment Investissements étranger direct (flux 181 149 226 348 387 733 720 516 ... Inflows nets entrants) Net Total Official Development Aide publique au développement 142 146 173 125 152 217 210 326 ... assistance (nette totale) African Statistical Yearbook 2011 / Annuaire Statistique pour l'Afrique 2011
  • 260.
    Namibia Namibie 2002 2003 2004 2005 2006 2007 2008 2009 2010 US $ (Millions) Dollar Namibien Exports, fob Exportations, fàb Exports - Total 1 070 1 251 1 821 2 068 2 651 2 919 ... ... ... Exportations - Total Main Products Principaux produits Diamonds 532 511 823 849 1 083 911 770 ... ... Diamants Zinc ... ... ... ... ... 91 57 ... ... Zinc Lead ... ... ... ... ... 17 19 ... ... Plomb Silver ... ... ... ... ... 7 4 ... ... Argent ... ... ... ... ... ... ... ... ... Main Destinations Principales destinations United Kingdom 314.4 172.8 479.0 584.0 907.2 378.5 54.0 177.3 ... Royaume-Uni Spain 176.7 246.2 247.1 214.2 215.1 254.6 260.4 225.0 ... Espagne United States 58.8 127.8 250.7 133.3 118.8 222.9 302.3 329.3 ... États-Unis Italy 25.8 38.7 68.2 129.1 267.2 413.0 117.5 48.2 ... Italie China 28.9 37.0 46.6 76.4 121.9 157.7 282.2 312.4 ... Chine 2002 2003 2004 2005 2006 2007 2008 2009 2010 Imports, cif Importations, cif Imports - Total 296 309 417 488 693 962 1 417 1 358 ... Importations - Total (millions) 259 Principaux produits Main Products Petroleum oils&oils obtained from Huiles de pétrole, bitumineux, bituminous minerals,o/than crude 0 7 9 17 2 25 212 103 ... distilles, sauf brut etc Minerais de cuivre et leurs Copper ores and concentrates 1 0 ... 7 16 53 69 161 ... concentrés Diesel powered trucks with a GVW Diesel chariots de manutention d'un 0 1 1 2 3 31 50 7 ... not exceeding five tonnes PTAC n'excédant pas cinq tonnes Sulphuric acid; oleum 1 1 3 5 3 13 37 14 ... Acide sulfurique, oléum Linge de lit, de fibres synthétiques Bed linen, of man-made fibres, nes 0 0 0 2 4 21 34 27 ... ou artificielles, nda Main Origin Principales provenances United States 57.8 28.0 72.9 113.7 126.9 127.9 280.3 ... ... États-Unis China 20.2 37.6 52.5 60.4 133.2 246.5 243.2 ... ... Chine Germany 42.6 32.1 49.8 48.2 76.3 70.2 106.6 ... ... Allemagne Netherlands 3.7 7.2 8.4 5.1 12.8 27.2 125.7 ... ... Pays-Bas United Kingdom 12.6 16.5 31.9 31.5 24.3 23.8 31.0 ... ... Royaume-Uni African Statistical Yearbook 2011 / Annuaire Statistique pour l'Afrique 2011
  • 261.
    Niger Niger AREA (KM 2) 1 267 000 SUPERFICIE (KM 2) CAPITAL CITY Niamey Niamey CAPITALE CURRENCY CFA Franc Franc CFA MONNAIE I SOCIAL AND DEMOGRAPHIC INDICATORS — INDICATEURS DEMOGRAPHIQUES ET SOCIAUX 2002 2003 2004 2005 2006 2007 2008 2009 2010 Population Population Population au milieu de l'année - Mid-year population - Total (Million) 11.5 11.8 12.2 12.8 13.2 13.7 14.2 14.7 ... Total (million) Population au milieu de l'année - Mid-year population - Urban (%) 16.4 16.5 16.6 16.7 16.8 16.6 18.4 19.8 ... Urbaine (%) Female (%) 50.1 50.1 50.1 50.1 50.1 50.1 50.1 50.1 ... Femme (%) Population by Age Group Population par groupe d'âge 0-14 5564 230 5747 850 5937 530 6385 905 6626 927 6860 460 7087 227 7308 892 ... 0-14 15-64 5523 640 5705 920 5894 210 6060 881 6272 628 6500 957 6746 320 7008 603 ... 15-64 65+ 368 370 380 520 393 080 345 289 348 432 354 817 364 054 375 616 ... 65+ Active Population (000) 3 898.0 4 028.0 4 163.0 4 312.0 4 475.0 4 647.0 4 832.0 5 026.0 ... Population active (000) Female (%) 31.4 31.4 31.3 31.3 31.4 31.3 31.3 31.3 ... Femme (%) Taux brut de natalité - Total (par Crude birth rate - Total (per 1000) 52.6 52.7 52.9 53.2 53.5 53.6 53.5 53.2 ... 1000) Taux brut de mortalité - Total (par Crude death rate - Total (per 1000) 17.7 17.2 16.7 16.2 15.8 15.3 14.9 14.5 ... 1000) Life expectancy at birth - Total Espérance de vie à la naissance - 55.2 55.6 56.0 56.4 56.8 57.2 57.6 58.0 ... (years) Total (années) Net reproduction rate - (per Taux net de reproduction - (par ... ... ... 2.6 ... ... ... ... ... woman) femme) Indice synthétique de fécondité - Total fertility rate - (p woman) y (per ) 7.4 7.4 7.3 7.3 7.1 7.2 7.1 7.1 ... (par femme) Education Enseignement Teaching staff at first level - Total Personnel enseignant - 1er degré - 18.44 20.6 22.4 24.1 28.2 31.1 34.1 40.0 ... (thousands) Total (milliers) Teaching staff at second level - Total Personnel enseignant - 2ème degré - 260 3.96 4.0 5.0 3.7 4.1 4.3 4.4 8.7 ... (thousands) Total (milliers) Teaching staff at third level - Total Personnel enseignant - 3ème degré - 0.3 0.3 0.3 0.3 0.3 0.3 0.3 1.2 ... (thousands) Total (milliers) First level student enrollment - Total Elèves inscrits - 1er degré - Total 761 858 980 1 064 1 126 1 235 1 389 1 554 ... (thousands) (milliers) First level student enrollment - Elèves inscrits - 1er degré - Femmes 303 344 395 434 462 512 593 670 ... Female (thousands) (milliers) Second level student enrollment - Elèves inscrits - 2ème degré - Total 109 124 155 177 211 211 230 250 ... Total (thousands) (milliers) Second level student enrollment - Elèves inscrits - 2ème degré - 42 48 60 69 81 81 87 95 ... Female (thousands) Femmes (milliers) Third level student enrollment - Total Elèves inscrits - 3ème degré - Total ... 8.9 8.8 10.8 11.2 10.9 12.8 15.3 ... (thousands) (milliers) Third level student enrollment - Elèves inscrits - 3ème degré - ... 2.4 2.4 3.2 3.0 3.1 3.8 4.3 ... Female (thousands) Femmes (milliers) Public expenditure on education (% Dépenses publiques consacrées à 9.8 8.6 11.9 12.4 13.0 13.8 15.1 13.5 ... of budget) l'enseignement (% du budget) Health Santé Hospital beds - Total (per 10 000 Nombre de lits d'hôpitaux - Total 25 33 20 19 30 30 30 49 ... population) (pour 10 000) Nurses - Total (per 10 000 Nombre d'infirmières - Total (pour 23 22 22 24 23 23 30 30 ... population) 10 000) Physicians - Total (per 10 000 Nombre de médecins - Total (pour 3 3 3 5 5 5 4 4 ... population) 10 000) Public expenditure on Health (% of Dépenses publiques consacrées à la 8 9 6 6 7 10 11 10 ... budget) santé (% du budget) African Statistical Yearbook 2011 / Annuaire Statistique pour l'Afrique 2011
  • 262.
    Niger Niger II NATIONAL ACCOUNTS — COMPTES NATIONAUX 2002 2003 2004 2005 2006 2007 2008 2009 2010 Gross domestic product by kind of economic activity at current prices Produit intérieur brut par branche d'activité économique aux prix courants CFA Franc (Millions) Franc CFA (Millions) Agriculture 658 069 676 833 615 991 754 411 817 662 842 042 1 044 840 1 018 962 ... Agriculture Mining and quarrying 29 067 29 668 31 428 35 659 40 096 90 775 139 239 149 840 ... Industries extractives Manufacturing 87 467 90 753 94 107 98 349 102 635 106 578 117 676 127 776 ... Industries manufacturières Electricity, gas & water 15 042 19 174 17 969 19 576 24 590 26 024 29 745 31 972 ... Electricité, gaz et eau Construction 33 978 36 635 38 697 41 622 47 471 51 584 57 484 64 507 ... Bâtiments et travaux publics Wholesale & retail trade, Commerce de gros et de détail, 219 740 225 612 239 493 260 404 273 887 290 831 325 607 342 825 ... restaurants, hotels restaurants et hôtels Banques, assurances, affaires Finance, insurance, real estate, etc. 73 268 75 864 83 274 93 035 102 311 115 974 122 580 127 827 ... immobilières Transport and communications 87 299 93 980 106 494 115 068 124 105 134 886 145 657 158 611 ... Transport(s) et communications Administrations publiques et Public administration and defense 120 022 125 900 122 407 153 027 166 930 184 453 191 824 213 565 ... défense Other services 67 724 62 393 67 193 74 231 68 955 68 823 73 003 81 277 ... Autres services Moins Services d’intermédiation Less Imputed Service Charges - 8 025 - 10 448 - 12 719 - 14 599 ... ... ... ... ... financière Gross domestic product at factor Produit intérieur brut aux couts des 1 383 651 1 426 364 1 404 335 1 630 783 1 768 642 1 911 970 2 247 655 2 317 162 ... cost / basic prices facteurs / prix de base Plus: Indirect Taxes / taxes on Plus taxes indirectes/impôts sur les 111 135 107 942 126 108 146 660 138 196 144 737 156 549 158 836 ... products, less subsidies produits, moins les subventions Expenditure on Gross domestic product at current purchaser's values Emploi du produit intérieur brut aux prix courants d'acquisition CFA Franc (Millions) Franc CFA (Millions) Consommation finale des Government final consumption 245 417 247 354 263 300 280 150 286 186 321 865 363 080 425 451 ... administrations publiques Private final consumption 1 125 078 1 170 872 1 211 092 1 307 056 1 389 307 1 517 062 1 714 569 1 840 605 ... Consommation finale privée Gross fixed capital formation 229 894 231 797 258 139 384 618 430 199 467 984 672 559 721 142 ... Formation brute de capital fixe Increase in inventories 29 212 18 803 - 34 800 25 754 19 501 6 726 29 996 ... ... Variation des stocks Exports of goods and services 230 006 261 276 282 791 333 068 344 704 358 453 454 900 490 500 ... Exportations de biens et services Moins importations de biens et 261 Less imports of goods and services 364 821 395 796 450 078 553 202 563 059 615 383 830 900 1 001 700 ... services GDP at purchasers' values 1 494 786 1 534 306 1 530 443 1 777 443 1 906 838 2 056 707 2 404 204 2 475 998 ... PIB aux prix d'acquisition Gross domestic product by kind of economic activity at constant Produit intérieur brut par branche d'activité economique aux prix constants prices Annual Growth Rates (%) Taux de croissance annuel (%) Agriculture 7.4 5.2 -8.1 13.6 10.3 4.6 16.2 -6.9 ... Agriculture Mining and quarrying 3.8 1.5 6.1 -3.6 0.7 -5.8 -2.1 6.0 ... Industries extractives Manufacturing 2.5 1.6 6.3 0.4 2.4 0.3 3.9 3.2 ... Industries manufacturières Electricity, gas & water 0.0 0.2 -6.9 1.3 -1.1 3.3 8.8 5.2 ... Electricité, gaz et eau Construction 6.3 10.5 5.0 6.1 5.1 3.6 5.0 6.3 ... Bâtiments et travaux publics Wholesale & retail trade, Commerce de gros et de 16.5 3.5 4.7 3.8 44.9 1.2 4.4 3.8 ... restaurants, hotels détail,restaurants et hôtels Banques, assurances, affaires Finance, insurance, real estate, etc. 1.3 7.7 4.3 10.5 13.5 7.7 4.6 1.5 ... immobilières Transport and communications 3.7 2.2 5.2 2.0 0.2 2.3 5.0 3.7 ... Transport(s) et communications Administrations publiques et Public administartion and defense -1.1 0.9 -4.0 4.7 5.0 5.8 1.9 6.5 ... défense Other services 6.7 -5.6 5.8 -5.0 -10.4 -2.6 1.7 8.2 ... Autres services Moins Services d’intérmediation Less Imputed Service Charges 5.3 -3.3 29.7 12.9 ... ... ... ... ... financière Gross domestic product at factor Produit intérieur brut aux couts des 6.1 3.6 -2.4 7.5 12.2 3.4 9.6 -1.2 ... cost / basic prices facteurs / prix de base Plus: Indirect Taxes / taxes on Plus taxes indirectes/impôts sur les -1.0 1.7 11.8 7.0 -39.1 3.2 5.9 2.6 ... products, less subsidies produits, moins les subventions Gross domestic product at market Produit intérieur brut aux prix du 5.3 3.4 -0.8 7.4 5.8 3.4 9.3 -0.9 ... prices marché 2008: semi-final 2009:Estimated 2008: semi-définitif 2009:Estimée African Statistical Yearbook 2011 / Annuaire Statistique pour l'Afrique 2011
  • 263.
    Niger Niger Expenditure on Gross domestic product at constant purchasers' Emplois du produit intérieur brut aux prix constants d'acquisition values Annual Growth Rates (%) Taux de croissance annuel (%) Consommation finale des Government final consumption 3.0 2.3 -8.7 5.1 5.7 5.8 6.8 5.8 ... administrations publiques Private final consumption 5.7 5.7 3.1 -0.6 3.3 4.4 5.5 3.1 ... Consommation finale privée Gross fixed capital formation 8.5 -6.0 6.8 31.9 7.6 4.2 19.8 3.6 ... Formation brute de capital fixe Exports of goods and services -8.0 1.1 4.4 6.6 5.5 2.7 13.7 1.7 ... Exportations de biens et services Moins importations de biens et Less imports of goods and services 0.8 0.0 6.6 6.7 -0.8 4.9 9.7 16.1 ... services III INFLATION 2002 2003 2004 2005 2006 2007 2008 2009 2010 Annual Growth Rates (%) Taux de croissance annuel (%) All Item 2.6 -1.6 0.2 7.8 0.4 0.4 11.3 4.9 3.4 Ensemble Food 4.2 -4.8 -1.3 10.1 2.5 -0.5 20.5 10.3 0.7 Alimentation Health -2.4 -2.5 -4.4 -2.2 -1.8 -0.5 -3.3 -2.1 9.1 Santé Energy 2.1 2.5 1.2 2.5 -0.3 0.5 4.9 1.9 -0.9 Energie Transport -1.3 0.9 4.8 9.2 3.2 -1.6 3.7 -9.2 2.5 Transport IV AGRICULTURAL PRODUCTION - PRODUCTION AGRICOLE 2002 2003 2004 2005 2006 2007 2008 2009 2010 Tons (Thousand) Tonnes (milliers) Millet, Tons (thousands) 2 504 2 745 2 038 2 652 3 015 2 782 3 489 2 678 ... Mil, tonnes (milliers) Sorghum, Tons (thousands) 636 758 600 944 935 975 1 311 739 ... Sorgho, tonnes (milliers) Rice, Tons (thousands) 82 69 18 3 7 7 32 20 ... Riz paddy, tonnes (milliers) Cow pea, Tons (thousands) 612 549 340 586 693 1 001 1 548 787 ... Niébé, tonnes (milliers) Groundnuts in shells, Tons 150 386 159 139 136 148 305 253 ... Arachides en coques, tonnes (thousands) (milliers) V MINING PRODUCTION - PRODUCTION MINIERE 262 2002 2003 2004 2005 2006 2007 2008 2009 2010 Uranium, Tons 3 072.0 3 143.0 3 273.0 3 093.0 3 434.0 3 153.0 2 993.0 3 245.0 ... Uranium (tonnes) Hard Coal, metric tons (thousands) 182.9 188.9 200.4 182.1 176.3 171.3 182.9 225.1 ... Charbon minéral, tonne (milliers) Gold, industrial (Kilograms) 28.0 34.0 669.0 3 001.0 1 481.0 2 467.0 2 168.0 1 770.0 ... Or industriel ( Kilogrammes ) VI ENERGY - ENERGIE 2002 2003 2004 2005 2006 2007 2008 2009 2010 Electricity - total hydro production, Électricité - production hydraulique ... ... ... ... ... ... ... ... ... kilowatt hours (millions) totale, kilowatt-heures (millions) Electricity - total thermal production, Électricité - production thermique ... ... ... ... ... ... ... ... ... kilowatt hours (millions) totale, kilowatt-heures (millions) Electricity - total production, self- Electricité - Production totale privée 40 43 46 43 26 43 40 153 ... producer (Million Kilowatt Hours) (million de kilowatt heures) Electricity - total production, public Electricité - Production totale 204 204 204 204 204 204 204 204 ... (Million Kilowatt Hours) publique (million de kilowatt heures) African Statistical Yearbook 2011 / Annuaire Statistique pour l'Afrique 2011
  • 264.
    Niger Niger VII TOURISM AND INFRASTRUCTURE - TOURISME ET INFRASTUCTURE 2002 2003 2004 2005 2006 2007 2008 2009 2010 Arrivals - Tourists (thousands) 33.241 46.145 48.165 56.2 52.489 65 61.87 48.951 ... Arrivées - touristes (milliers) Rooms in hotels and similar Chambres d'hotels et établissements establishments (thousands) 1.42 1.472 1.741 1.873 1.919 1.973 1.99 2.01 ... assimilés (milliers) Paved Road (% of total) ... ... ... ... ... ... ... ... ... Routes asphaltées (% du total) Total Network (Railways-km) 9 460 9 877 10 041 10 077 10 204 10 722 10 722 10 824 ... Réseau total voies ferrées-Km Main Telephone Lines (per 1,000 Lignes téléphoniques fixes (pour 2 2 2 2 3 3 5 ... ... inhabitants) 1000 habitants) Mobile Cellular Subscribers (per Abonnés aux téléphones mobiles 3 5 12 24 41 59 133 ... ... 1,000 inhabitants) (pour 1000 habitants) VII FINANCIAL AND MONETARY STATISTICS - FINANCES ET STATISTIQUES MONETAIRES 2002 2003 2004 2005 2006 2007 2008 2009 2010 VII-1 Monetary Statistics VII-1 Statistiques monétaires CFA Franc (Millions) Franc CFA (Millions) Money supply (M1) 95 558 149 474 181 854 192 170 225 386 269 346 291 220 356 352 417 935 Masse monétaire (M1) Quasi-money 40 532 44 430 50 328 56 205 59 819 86 307 106 894 116 182 127 743 Quasi-monnaie of which Demand Deposit ... ... ... ... ... ... ... ... ... dont Monnaie scripturale Net foreign assets 21 355 67 143 71 252 75 130 168 394 255 667 320 813 238 383 296 061 Avoirs extérieurs nets Domestic credit 128 866 146 320 185 456 191 796 151 092 142 089 147 761 311 277 341 120 Crédit intérieur of which claims on private sector 75 803 83 026 101 446 121 286 159 066 191 922 262 603 310 891 346 904 dont créances sur le secteur privé of which Claims on government dont créances nettes sur le 53 063 63 294 84 010 70 510 - 7 974 - 49 833 - 114 842 386 - 5 784 sector, net gouvernement International reserves (millions of US Réserves internationales (millions de 134 260 258 250 371 593 705 656 650 $) $ EU) Average Exchange Rate (National Taux de change (moyen) (monnaie 696.99 581.20 528.29 527.47 522.89 479.27 447.81 472.19 495.28 Currency per us $) nationale par dollars) VII-2 Public Finance VII-2 Finances publiques CFA Franc (Millions) Franc CFA (Millions) Total Revenues and Grants 235 500 232 700 262 000 323 000 1 130 300 427 500 604 000 468 000 439 412 Recettes totales et dons Tax Revenue 144 600 152 100 167 600 181 300 204 000 233 200 273 800 336 500 234 516 Recettes fiscales Non Tax Revenue 16 300 4 700 6 200 7 700 43 400 75 800 160 900 20 600 10 821 Recettes non fiscales Grants 74 600 76 000 89 200 134 000 882 900 118 500 169 300 110 900 194 075 Dons 263 Total Expenditures and Net Lending 278 000 274 600 317 600 358 300 362 700 446 300 570 900 631 900 627 432 Dépenses totales et prêts nets Current expenditure 161 700 159 100 170 200 165 100 125 800 173 800 183 900 201 500 140 255 Dépenses courantes Of which Wages and Salaries 55 300 57 100 59 000 63 000 68 000 72 200 83 800 93 300 69 955 Dont rémunérations et salaires Capital expenditure 116 300 115 500 144 000 193 100 182 700 207 100 283 400 333 800 376 877 Dépenses d'équipement Net Lending - 200 0 800 - 200 0 0 0 0 0 Prêts nets Fiscal Balance - 37 900 - 30 900 - 32 200 - 10 900 767 600 - 18 800 33 100 - 163 900 - 188 020 Solde global y compris les dons VII-3 Balance of Payments VII-3 Balance des paiements CFA Franc (Millions) Franc CFA (Millions) Trade balance - 63 930 - 79 400 - 80 840 - 153 962 - 125 668 - 120 463 - 195 871 - 235 298 ... Balance commerciale Services Balance - 70 885 - 75 098 - 89 187 - 101 172 - 124 432 - 136 467 - 210 512 - 295 041 ... Balance des services Net Income - 16 871 - 15 186 - 6 810 - 5 012 634 - 211 - 8 482 - 15 790 ... Revenus nets Current transfers, net total 36 801 42 608 54 877 95 834 85 421 88 791 103 147 65 371 ... Transferts courants Current account balance - 114 885 - 127 098 - 121 960 - 164 312 - 164 045 - 168 350 - 311 718 - 480 758 ... Solde du compte courant VII-4 External Debt and Financial Flows VII-4 Dette extérieure et flux financiers US $ (Millions) $ E.U (Millions) Total external debt 1 843 1 848 1 707 1 743 575 682 752 832 979 Dette extérieure totale Private 0 0 0 0 0 0 0 0 0 Privée Public 1 843 1 848 1 707 1 743 575 682 752 832 979 Publique Total external debt service 55 56 43 45 40 38 42 20 17 Service de la dette extérieure Net Foreign Direct Investment Investissements étranger direct (flux 2 11 20 30 51 129 566 739 ... Inflows nets entrants) Net Total Official Development Aide publique au développement 300 461 547 520 526 542 607 470 ... assistance (nette totale) African Statistical Yearbook 2011 / Annuaire Statistique pour l'Afrique 2011
  • 265.
    Niger Niger 2002 2003 2004 2005 2006 2007 2008 2009 2010 US $ (Millions) Franc CFA Exports, fob Exportations, fàb Exports - Total 195 204 231 252 266 318 409 417 ... Exportations - Total Main Products Principaux produits Uranium 62 66 70 79 80 143 198 195 ... Uranium Gold ... ... 9 34 20 26 19 23 ... Or Cattles, live 9 11 10 10 11 9 30 9 ... Bovins sur pieds Goats, live 5 5 5 3 3 3 15 3 ... Caprins sur pieds Onions 13 13 15 14 12 13 13 5 ... Oignons Main Destinations Principales destinations France 42.4 44.3 48.3 56.5 50.0 99.6 116.4 147.7 ... France Nigeria 37.5 34.4 28.7 23.6 24.1 19.6 79.0 19.8 ... Nigeria United States 0.1 0.2 0.3 0.5 0.3 11.0 44.8 22.3 ... Etats-Unis Japan 18.6 18.0 18.0 21.6 19.1 31.9 32.9 22.4 ... Japon Switzerland 0.0 0.0 8.9 31.8 17.0 27.0 17.6 22.8 ... Suisse 2002 2003 2004 2005 2006 2007 2008 2009 2010 Imports, cif Importations, cif 264 Imports - Total 314 342 376 498 496 551 760 817 ... Importations - Total (millions) Principaux produits Main Products Petroleum products 29 32 39 46 54 62 78 76 ... Produits pétroliers Rice 33 21 29 48 31 25 46 26 ... Riz Medicaments 6 8 17 8 16 33 50 25 ... Médicaments Hydraulic cements 8 7 12 15 17 18 23 23 ... Ciments hydrauliques Tourism cars 8 10 12 10 11 12 12 14 ... Voitures de tourisme Main Origin Principales provenances France 46.4 47.0 52.5 60.7 68.2 85.7 68.8 101.2 ... France China 27.1 30.1 17.2 19.6 54.2 27.0 66.8 228.9 ... Chine United States 14.3 15.8 32.6 13.6 29.7 34.3 37.3 33.0 ... Etats-Unis Nigeria 20.3 22.3 24.6 21.3 27.2 21.5 24.8 38.1 ... Nigeria Cote d'Ivoire 40.9 39.6 32.1 33.6 26.1 31.9 23.3 25.5 ... Côte d'Ivoire African Statistical Yearbook 2011 / Annuaire Statistique pour l'Afrique 2011
  • 266.
    Nigeria Nigéria AREA (KM 2) 923 768 SUPERFICIE (KM 2) CAPITAL CITY Abuja Abuja CAPITALE CURRENCY Naira Naira MONNAIE I SOCIAL AND DEMOGRAPHIC INDICATORS — INDICATEURS DEMOGRAPHIQUES ET SOCIAUX 2002 2003 2004 2005 2006 2007 2008 2009 2010 Population Population Population au milieu de l'année - Mid-year population - Total (Million) 125.8 129.9 134.1 138.5 140.4 147.6 152.3 157.1 ... Total (million) Population au milieu de l'année - Mid-year population - Urban (%) ... ... 45.0 46.0 47.0 48.0 48.0 49.1 ... Urbaine (%) Female (%) 49.9 49.9 49.9 49.9 49.2 49.8 49.8 49.8 ... Femme (%) Population by Age Group Population par groupe d'âge 0-14 56500 000 58300 000 60100 000 61900 000 58700 000 65800 000 67700 000 69600 000 ... 0-14 15-64 65800 000 67900 000 70300 000 72700 000 77200 000 77600 000 80200 000 82900 000 ... 15-64 65+ 3500 000 3600 000 3800 000 3900 000 4600 000 4200 000 4300 000 4500 000 ... 65+ Active Population (000) 39 631.0 40 665.0 41 735.0 42 854.0 44 002.0 45 210.0 46 472.0 47 783.0 ... Population active (000) Female (%) 34.3 34.8 35.2 35.2 35.4 35.8 36.2 36.5 ... Femme (%) Taux brut de natalité - Total (par Crude birth rate - Total (per 1000) ... ... ... ... 40.7 40.3 39.8 39.3 ... 1000) Taux brut de mortalité - Total (par Crude death rate - Total (per 1000) 16.9 15.9 19.3 17.8 16.7 16.6 16.4 16.2 ... 1000) Life expectancy at birth - Total Espérance de vie à la naissance - 57.1 57.1 57.1 58.7 58.7 58.7 58.7 58.7 ... (years) Total (années) Net reproduction rate - (per Taux net de reproduction - (par ... ... ... 1.8 ... ... ... ... ... woman) femme) Indice synthétique de fécondité - Total fertility rate - (per woman) 5.8 5.8 5.8 5.6 5.6 5.6 5.6 5.6 ... (par femme) Education Enseignement Teaching staff at first level - Total Personnel enseignant - 1er degré - 492.00 591.0 598.0 599.0 535.0 468.2 586.9 ... ... (thousands) Total (milliers) Teaching staff at second level - Personnel enseignant - 2ème degré - 133.70 180.3 154.6 144.4 199.2 ... ... ... ... Total (thousands) Total (milliers) 265 Teaching staff at third level - Total Personnel enseignant - 3ème degré - 36.1 40.1 40.4 ... ... ... ... ... ... (thousands) Total (milliers) First level student enrollment - Total Elèves inscrits - 1er degré - Total 19 353 21 396 23 115 23 047 22 466 21 632 21 295 21 857 ... (thousands) (milliers) First level student enrollment - Elèves inscrits - 1er degré - Femmes 8 791 9 181 9 571 9 926 10 370 9 949 ... ... ... Female (thousands) (milliers) Second level student enrollment - Elèves inscrits - 2ème degré - Total 4 866 6 316 6 719 6 909 6 617 6 138 6 625 ... ... Total (thousands) (milliers) Second level student enrollment - Elèves inscrits - 2ème degré - 2 267 2 561 2 854 2 973 2 842 2 608 ... ... ... Female (thousands) Femmes (milliers) Third level student enrollment - Elèves inscrits - 3ème degré - Total 963.4 1 127.9 1 304.7 1 391.5 ... ... ... ... ... Total (thousands) (milliers) Third level student enrollment - Elèves inscrits - 3ème degré - ... ... ... ... ... ... ... ... ... Female (thousands) Femmes (milliers) Public expenditure on education (% Dépenses publiques consacrées à 9.2 6.5 5.9 6.2 7.8 8.7 6.9 ... ... of budget) l'enseignement (% du budget) Health Santé Hospital beds - Total (per 10 000 Nombre de lits d'hôpitaux - Total 6 6 5 6 6 7 ... ... ... population) (pour 10 000) Nurses - Total (per 10 000 Nombre d'infirmières - Total (pour 10 11 12 12 16 15 ... ... ... population) 10 000) Physicians - Total (per 10 000 Nombre de médecins - Total (pour 3 3 3 3 4 4 ... ... ... population) 10 000) Public expenditure on Health (% of Dépenses publiques consacrées à la 5 3 4 4 5 6 6 ... ... budget) santé (% du budget) African Statistical Yearbook 2011 / Annuaire Statistique pour l'Afrique 2011
  • 267.
    Nigeria Nigéria II NATIONAL ACCOUNTS — COMPTES NATIONAUX 2002 2003 2004 2005 2006 2007 2008 2009 2010 Gross domestic product by kind of economic activity at current prices Produit intérieur brut par branche d'activité économique aux prix courants Naira (Millions) Naira(Millions) Agriculture 3 357 063 3 624 579 3 903 759 4 773 198 5 940 237 6 791 237 7 601 546 9 063 718 ... Agriculture Mining and quarrying 1 805 891 2 749 967 4 260 767 5 682 185 7 010 219 7 564 497 9 133 941 7 359 875 ... Industries extractives Manufacturing 223 017 270 372 326 860 383 669 441 066 479 527 537 991 558 655 ... Industries manufacturières Electricity, gas & water 32 633 39 764 49 286 58 425 80 073 87 134 100 253 116 109 ... Electricité, gaz et eau Construction 47 985 58 905 166 078 215 786 250 332 266 464 306 582 347 691 ... Bâtiments et travaux publics Wholesale & retail trade, Commerce de gros et de détail, 782 107 933 571 1 519 672 1 914 331 2 799 406 3 150 982 3 209 389 4 060 645 ... restaurants, hotels restaurants et hôtels Banques, assurances, affaires Finance, insurance, real estate, etc. 302 175 376 039 566 195 843 585 1 105 260 1 266 503 1 456 478 1 657 246 ... immobilières Transport and communications 188 600 238 088 387 340 424 995 607 346 716 996 729 010 762 725 ... Transport(s) et communications Administrations publiques et Public administration and defense 81 998 90 206 101 039 115 191 131 329 151 330 174 030 197 262 ... défense Other services 90 912 105 539 130 071 160 874 199 325 249 385 287 408 328 477 ... Autres services Moins Services d’intermédiation Less Imputed Service Charges ... ... ... ... ... ... ... ... ... financière Gross domestic product at factor Produit intérieur brut aux couts des 6 912 381 8 487 032 11 411 067 14 572 239 18 564 595 20 724 056 23 536 626 24 452 403 ... cost / basic prices facteurs / prix de base Plus: Indirect Taxes / taxes on Plus taxes indirectes/impôts sur les 215 822 255 615 262 535 163 085 144 982 216 855 1 128 618 772 736 ... products, less subsidies produits, moins les subventions Expenditure on Gross domestic product at current purchaser's values Emploi du produit intérieur brut aux prix courants d'acquisition Naira (Millions) Naira(Millions) Consommation finale des Government final consumption 478 293 450 490 785 819 1 003 104 1 283 403 2 608 600 3 134 150 3 213 150 ... administrations publiques Private final consumption 5 540 186 7 044 545 8 637 732 11 075 059 11 834 368 15 682 906 15 756 158 18 859 553 ... Consommation finale privée Gross fixed capital formation 499 682 865 876 863 073 804 401 1 546 526 1 935 040 2 050 763 3 048 023 ... Formation brute de capital fixe Increase in inventories 742 827 928 1 182 1 470 1 571 1 661 1 768 ... Variation des stocks Exports of goods and services 2 563 707 3 478 515 3 520 846 4 664 757 8 066 038 7 063 060 9 837 271 7 766 227 ... Exportations de biens et services 266 Less imports of goods and services 1 954 407 3 097 607 2 134 796 2 813 178 4 022 227 6 350 266 6 114 759 7 663 582 ... Moins importations de biens et services GDP at purchasers' values 7 128 203 8 742 647 11 673 602 14 735 324 18 709 577 20 940 911 24 665 244 25 225 139 ... PIB aux prix d'acquisition Gross domestic product by kind of economic activity at constant Produit intérieur brut par branche d'activité economique aux prix constants prices Annual Growth Rates (%) Taux de croissance annuel (%) Agriculture 55.2 7.0 6.3 7.1 7.4 7.2 6.3 5.9 ... Agriculture Mining and quarrying -5.6 23.7 3.4 0.6 -4.3 -4.3 -5.9 -1.1 ... Industries extractives Manufacturing 10.8 5.5 12.0 9.6 9.4 9.5 8.9 7.9 ... Industries manufacturières Electricity, gas & water 12.8 16.5 16.6 6.7 5.0 5.1 4.0 3.5 ... Electricité, gaz et eau Construction 4.3 8.7 -6.8 12.1 13.0 13.0 13.1 12.3 ... Bâtiments et travaux publics Wholesale & retail trade, Commerce de gros et de 6.5 5.7 38.3 13.4 15.2 15.1 14.0 11.3 ... restaurants, hotels détail,restaurants et hôtels Banques, assurances, affaires Finance, insurance, real estate, etc. 22.4 -6.7 4.6 4.9 6.7 6.9 6.8 6.1 ... immobilières Transport and communications 19.8 7.1 51.7 13.6 16.4 17.9 19.5 21.1 ... Transport(s) et communications Administrations publiques et Public administartion and defense 18.1 0.0 10.8 4.0 4.5 4.5 4.4 4.4 ... défense Other services 12.4 2.6 10.8 10.3 10.5 10.5 10.6 9.8 ... Autres services Moins Services d’intérmediation Less Imputed Service Charges ... ... ... ... ... ... ... ... ... financière Gross domestic product at factor Produit intérieur brut aux couts des 21.3 10.2 10.5 6.5 6.0 6.4 6.0 6.7 ... cost / basic prices facteurs / prix de base Plus: Indirect Taxes / taxes on Plus taxes indirectes/impôts sur les 14.6 14.5 14.7 -37.0 17.7 37.1 6.0 6.7 ... products, less subsidies produits, moins les subventions Gross domestic product at market Produit intérieur brut aux prix du 21.2 10.3 10.6 5.4 6.2 7.0 6.0 6.7 ... prices marché 2009: Provisional 2009: provisoire African Statistical Yearbook 2011 / Annuaire Statistique pour l'Afrique 2011
  • 268.
    Nigeria Nigéria Expenditure on Gross domestic product at constant purchasers' values Emplois du produit intérieur brut aux prix constants d'acquisition Annual Growth Rates (%) Taux de croissance annuel (%) Consommation finale des Government final consumption 5.8 -23.9 565.5 10.5 35.8 21.4 15.4 -26.1 ... administrations publiques Private final consumption 19.9 16.7 -25.8 6.1 -18.1 28.1 0.7 5.6 ... Consommation finale privée Gross fixed capital formation 25.4 63.7 457.1 27.5 27.8 -24.4 -5.4 12.0 ... Formation brute de capital fixe Exports of goods and services 11.6 31.4 -1.0 12.4 70.4 -6.7 5.5 31.0 ... Exportations de biens et services Moins importations de biens et Less imports of goods and services 6.4 53.4 -33.2 33.6 36.0 13.7 -2.4 -13.8 ... services III INFLATION 2002 2003 2004 2005 2006 2007 2008 2009 2010 Annual Growth Rates (%) Taux de croissance annuel (%) All Item 12.2 23.8 10.0 11.6 8.5 6.6 15.1 12.0 13.7 Ensemble Food 9.1 15.4 12.1 15.5 3.9 8.2 18.0 13.6 14.7 Alimentation Health 40.8 13.3 -17.5 24.4 9.9 -6.5 14.0 3.5 10.7 Santé Energy 27.9 48.8 14.1 1.1 18.3 8.4 11.7 7.2 13.0 Energie Transport 4.5 29.9 0.1 12.5 23.6 7.2 1.2 8.6 10.9 Transport IV AGRICULTURAL PRODUCTION - PRODUCTION AGRICOLE 2002 2003 2004 2005 2006 2007 2008 2009 2010 Tons (Thousand) Tonnes (milliers) Cassava, Tons (thousands) 30 393 30 668 33 393 35 835 38 041 39 130 33 216 ... ... Manioc, tonnes (milliers) Yam, Tons (thousands) 23 412 26 261 26 631 32 337 28 280 26 751 27 211 ... ... Ignames, tonnes (milliers) Sorghun, Tons (thousands) 5 083 4 653 9 994 6 579 6 474 5 429 5 218 ... ... Sorgho, tonnes (milliers) Maize, Tons (thousands) 5 657 5 191 9 401 7 469 7 023 5 797 9 113 ... ... Maïs, tonnes (milliers) Millet, Tons (thousands) 4 195 4 233 6 963 5 779 5 940 4 388 4 367 ... ... Mil, tonnes (milliers) V MINING PRODUCTION - PRODUCTION MINIERE 267 2002 2003 2004 2005 2006 2007 2008 2009 2010 Limestone, metric tons (thousands) 11 414.9 12 556.4 14 693.1 1 160.6 15 280.8 ... ... ... ... Calcaire, tonnes métriques (milliers) Shale, metric tons (thousands) 1071 883.4 1179 071.7 1203 687.0 67 229.0 1263 834.5 1268 183.0 ... ... ... Schiste argileux, tonnes métriques (milliers) Granite, metric tons (thousands) 1551 329.1 ... ... 2285 493.3 1635 555.6 ... ... ... ... Granite, tonnes métriques (milliers) VI ENERGY - ENERGIE 2002 2003 2004 2005 2006 2007 2008 2009 2010 Electricity - total hydro production, Électricité - production hydraulique 13 248.8 142 048.2 17 325.1 18 094.9 16 422.2 15 142.6 ... ... ... kilowatt hours (millions) totale, kilowatt-heures (millions) Electricity - total thermal production, Électricité - production thermique 6 350.0 78 181.6 5 591.7 6 128.5 8 052.0 7 835.5 ... ... ... kilowatt hours (millions) totale, kilowatt-heures (millions) Electricity - total production, self- Electricité - Production totale privée ... ... ... ... ... ... ... ... ... producer (Million Kilowatt Hours) (million de kilowatt heures) Electricity - total production, public Electricité - Production totale 19 599 220 230 22 917 24 223 24 474 22 978 ... ... ... (Million Kilowatt Hours) publique (million de kilowatt heures) African Statistical Yearbook 2011 / Annuaire Statistique pour l'Afrique 2011
  • 269.
    Nigeria Nigéria VII TOURISM AND INFRASTRUCTURE - TOURISME ET INFRASTUCTURE 2002 2003 2004 2005 2006 2007 2008 2009 2010 Arrivals - Tourists (thousands) 3.1 3.897 4.059 3.109 3.055 3.784 ... ... ... Arrivées - touristes (milliers) Rooms in hotels and similar Chambres d'hotels et établissements establishments (thousands) 30.699 37.528 37.738 38.87 40.814 42.723 ... ... ... assimilés (milliers) Paved Road (% of total) 81 81 81 83 69 72 ... ... ... Routes asphaltées (% du total) Total Network (Railways-km) 34 403 34 403 34 403 34 403 40 712 40 713 ... ... ... Réseau total voies ferrées-Km Main Telephone Lines (per 1,000 Lignes téléphoniques fixes (pour 7 9 10 12 17 16 9 ... ... inhabitants) 1000 habitants) Mobile Cellular Subscribers (per Abonnés aux téléphones mobiles 16 32 92 186 313 404 417 ... ... 1,000 inhabitants) (pour 1000 habitants) VII FINANCIAL AND MONETARY STATISTICS - FINANCES ET STATISTIQUES MONETAIRES 2002 2003 2004 2005 2006 2007 2008 2009 2010 VII-1 Monetary Statistics VII-1 Statistiques monétaires Naira (Millions) Naira(Millions) Money supply (M1) 902 558 1 006 378 1 198 219 1 523 436 1 823 061 3 164 427 4 678 188 4 502 736 4 985 078 Masse monétaire (M1) Quasi-money 653 242 759 633 932 951 1 089 460 1 739 640 2 686 840 4 247 830 5 707 990 5 859 250 Quasi-monnaie of which Demand Deposit ... ... ... ... ... ... ... ... ... dont Monnaie scripturale Net foreign assets 1 255 210 1 356 360 2 612 380 3 865 390 6 188 680 7 332 630 8 598 020 7 287 960 6 219 510 Avoirs extérieurs nets Domestic credit 1 393 500 1 853 170 1 365 970 1 267 300 918 539 4 209 530 6 562 850 9 259 390 11 542 600 Crédit intérieur of which claims on private sector 929 817 1 207 860 1 533 600 1 950 350 2 466 570 5 287 330 8 324 800 9 687 251 10 406 200 dont créances sur le secteur privé of which Claims on government dont créances nettes sur le 372 684 528 344 - 272 377 - 837 353 -1 812 020 -1 668 730 -3 107 580 -1 971 830 - 438 325 sector, net gouvernement International reserves (millions of US Réserves internationales (millions de 7 331 7 128 16 956 28 280 42 299 51 334 53 002 44 763 34 919 $) $ EU) Average Exchange Rate (National Taux de change (moyen) (monnaie 120.58 129.22 132.89 131.27 128.65 125.81 118.55 148.90 150.30 Currency per us $) nationale par dollars) VII-2 Public Finance VII-2 Finances publiques Naira (Millions) Naira(Millions) Total Revenues and Grants 2 052 825 2 795 000 4 127 000 5 619 300 6 061 000 5 715 500 7 866 600 4 844 600 6 197 043 Recettes totales et dons Tax Revenue 1 984 691 2 740 800 4 068 000 5 407 200 6 027 700 5 446 800 7 752 600 4 771 400 ... Recettes fiscales Non Tax Revenue 68 134 54 200 59 000 212 100 33 300 268 700 114 000 73 200 ... Recettes non fiscales Grants 0 0 0 0 0 0 0 0 ... Dons 268 Total Expenditures and Net Lending 2 290 434 2 795 000 3 177 000 1 919 700 2 038 000 2 450 900 3 240 800 3 456 900 4 107 531 Dépenses totales et prêts nets Current expenditure 507 166 515 000 571 000 809 400 983 100 1 337 700 1 700 600 1 884 600 ... Dépenses courantes Of which Wages and Salaries 368 484 367 950 443 000 527 400 629 100 867 300 1 080 700 1 148 300 ... Dont rémunérations et salaires Capital expenditure 615 453 718 000 716 000 519 500 552 400 759 300 960 900 1 152 800 ... Dépenses d'équipement Net Lending 761 887 1 190 000 1 523 000 ... ... ... ... ... ... Prêts nets Fiscal Balance - 237 609 0 950 000 3 699 600 4 023 000 3 264 600 4 625 800 1 387 700 2 089 512 Solde global y compris les dons VII-3 Balance of Payments VII-3 Balance des paiements Naira (Millions) Naira(Millions) Trade balance 382 752 1 215 675 2 615 736 3 832 996 4 495 928 4 749 881 5 537 792 4 507 331 ... Balance commerciale Services Balance - 288 177 - 288 699 - 349 150 - 634 172 -1 214 702 -1 639 796 -2 547 340 -2 284 030 ... Balance des services Net Income - 381 459 - 422 582 - 568 168 - 296 211 -1 103 385 -1 478 573 -1 463 834 -1 491 906 ... Revenus nets Current transfers, net total 169 847 200 166 357 908 1 989 132 2 179 755 2 247 714 2 221 729 2 676 713 ... Transferts courants Current account balance - 117 037 704 560 2 056 326 4 891 744 4 357 587 3 879 226 3 748 347 3 408 109 ... Solde du compte courant VII-4 External Debt and Financial Flows VII-4 Dette extérieure et flux financiers US $ (Millions) $ E.U (Millions) Total external debt 3 932 885 4 478 329 4 890 270 2 695 072 451 462 428 059 494 020 584 600 ... Dette extérieure totale Private 0 0 0 0 0 0 0 ... ... Privée Public 3 932 885 4 478 329 4 890 270 2 695 072 451 462 428 059 494 020 ... ... Publique Total external debt service 141 342 234 227 234 261 180 000 856 900 128 700 14 000 63 400 ... Service de la dette extérieure Net Foreign Direct Investment Investissements étranger direct ... ... ... ... 1 067 974 2 479 003 3 449 512 2 484 057 ... Inflows (flux nets entrants) Net Total Official Development Aide publique au développement ... ... ... ... ... ... ... ... ... assistance (nette totale) African Statistical Yearbook 2011 / Annuaire Statistique pour l'Afrique 2011
  • 270.
    Nigeria Nigéria 2002 2003 2004 2005 2006 2007 2008 2009 2010 Naira (Millions) Naira Exports, fob Exportations, fàb Exports - Total 1 744 178 3 087 886 4 602 782 7 246 535 7 324 681 8 120 148 9 599 805 ... ... Exportations - Total Main Products Principaux produits Crude Petroleum 1 925 613 2 947 549 4 473 543 6 252 882 7 006 591 6 395 167 8 751 618 6 284 406 ... Pétrole Brut Natural Gas 74 852 34 177 28 490 20 104 ... 43 314 26 261 321 096 ... Gaz naturel Palm Nuts & Kernels 760 60 14 ... 24 234 16 ... ... Noix de palme et noix Light Vessels etc, nes 8 359 10 759 73 658 23 238 35 478 18 914 5 972 1 319 ... Bâtiments légers etc, nda Sesamum Seeds ... ... ... ... 335 15 079 17 695 28 941 ... Graines de sésame Main Destinations Principales destinations U.S.A 701 064.4 1 189 476.6 2 201 793.4 2 703 093.7 3 400 558.4 3 395 448.0 4 051 344.8 2 026 629.5 ... États-Unis Brazil 185 454.3 211 362.9 410 182.3 561 845.2 319 463.3 241 407.5 620 773.8 593 511.2 ... Brésil Spain 122 842.2 191 663.0 375 399.4 534 353.3 602 954.5 474 025.9 327 299.7 324 292.4 ... Espagne France 120 212.1 175 559.0 227 059.2 340 766.1 427 505.6 377 014.0 394 192.0 407 357.8 ... France Japan 66 103.3 124 698.8 149 851.3 201 133.1 142 026.1 131 327.9 34 480.3 34 484.7 ... Japon 2002 2003 2004 2005 2006 2007 2008 2009 2010 Imports, cif Importations, cif Imports - Total ... ... ... ... ... ... ... ... ... Importations - Total (millions) 269 Principaux produits Main Products Spelt,Wheat & Meslin 41 711 50 148 61 878 79 988 163 189 233 061 73 553 159 894 ... Epeautre, blé et méteil Urea 4 754 3 889 6 549 6 681 19 655 18 857 24 169 8 799 ... Urée F/cold rolled iron steel 14 837 15 949 12 059 14 891 18 787 36 445 24 350 27 755 ... F / acier laminé à froid en acier Coffee Products 336 39 707 1 036 18 766 445 1 368 480 302 ... Produits du café Paper 10 621 15 261 13 776 17 639 472 8 ... ... ... Papier Main Origin Principales provenances U.S.A 134 988.8 298 416.1 174 209.4 361 048.0 455 165.2 623 645.2 267 722.0 303 733.6 ... Etats-Unis U.K 132 032.0 183 478.6 205 957.2 151 043.4 344 609.9 218 841.0 143 627.1 229 514.9 ... Royaume-Uni Germany 64 046.3 140 572.9 148 623.4 84 781.9 163 057.3 201 228.2 223 026.7 45 393.9 ... Allemagne Japan 52 040.7 47 027.7 39 032.3 62 946.6 96 813.2 95 422.1 88 834.2 144 074.9 ... Japon France 43 574.2 61 271.1 64 431.3 125 909.8 128 683.7 158 564.7 155 688.6 292 084.1 ... France African Statistical Yearbook 2011 / Annuaire Statistique pour l'Afrique 2011
  • 271.
    Rwanda Rwanda AREA (KM 2) 26 340 SUPERFICIE (KM 2) CAPITAL CITY Kigali Kigali CAPITALE CURRENCY Rwandan Franc Franc Rwandais MONNAIE I SOCIAL AND DEMOGRAPHIC INDICATORS — INDICATEURS DEMOGRAPHIQUES ET SOCIAUX 2002 2003 2004 2005 2006 2007 2008 2009 2010 Population Population Population au milieu de l'année - Mid-year population - Total (Million) 8.5 8.7 8.8 9.0 9.2 9.5 9.7 10.0 10.3 Total (million) Population au milieu de l'année - Mid-year population - Urban (%) ... ... 17.0 18.0 17.0 18.0 18.0 18.6 ... Urbaine (%) Female (%) 51.9 51.8 51.8 51.7 51.7 51.6 51.6 51.6 51.5 Femme (%) Population by Age Group Population par groupe d'âge 0-14 3784 402 3785 910 3789 256 3823 044 3892 538 3987 352 4101 949 4226 302 4352 668 0-14 15-64 4526 932 4668 988 4797 639 4933 715 5078 952 5225 392 5373 388 5522 043 5670 933 15-64 65+ 227 363 230 559 232 793 235 381 238 507 241 790 245 357 249 269 253 611 65+ Active Population (000) 4 058.6 4 176.8 4 282.3 4 399.3 4 532.0 4 671.7 4 813.4 4 960.6 5 104.9 Population active (000) Female (%) 53.1 53.1 53.1 53.1 53.0 52.9 52.8 52.9 52.9 Femme (%) Taux brut de natalité - Total (par Crude birth rate - Total (per 1000) 41.0 41.0 41.0 41.0 41.0 41.0 41.0 41.0 45.0 1000) Taux brut de mortalité - Total (par Crude death rate - Total (per 1000) 17.0 16.0 16.0 15.0 15.0 15.0 14.0 14.0 17.0 1000) Life expectancy at birth - Total Espérance de vie à la naissance - 46.0 47.0 48.0 48.0 49.0 50.0 50.0 51.0 46.0 (years) Total (années) Net reproduction rate - (per Taux net de reproduction - (par ... ... ... 2.0 ... ... ... ... 2.0 woman) femme) Indice synthétique de fécondité - Total fertility rate - (p woman) y (per ) 6.0 6.0 6.0 6.0 6.0 5.0 5.0 5.0 6.0 (par femme) Education Enseignement Teaching staff at first level - Total Personnel enseignant - 1er degré - 26.02 27.3 28.3 26.9 30.6 31.0 32.3 33.2 ... (thousands) Total (milliers) Teaching staff at second level - Total Personnel enseignant - 2ème degré - 270 6.33 7.1 7.8 7.6 7.8 12.1 16.1 ... ... (thousands) Total (milliers) Teaching staff at third level - Total Personnel enseignant - 3ème degré - 1.3 1.3 1.7 1.8 ... ... ... 1.2 ... (thousands) Total (milliers) First level student enrollment - Total Elèves inscrits - 1er degré - Total 1 535 1 637 1 753 1 858 2 020 2 150 2 190 2 265 ... (thousands) (milliers) First level student enrollment - Elèves inscrits - 1er degré - Femmes 771 826 890 946 1 036 1 094 1 114 1 150 ... Female (thousands) (milliers) Second level student enrollment - Elèves inscrits - 2ème degré - Total 157 179 204 219 240 267 288 347 ... Total (thousands) (milliers) Second level student enrollment - Elèves inscrits - 2ème degré - 78 85 97 103 115 127 138 170 ... Female (thousands) Femmes (milliers) Third level student enrollment - Total Elèves inscrits - 3ème degré - Total 15.9 20.4 25.2 26.4 ... ... 45.1 55.2 ... (thousands) (milliers) Third level student enrollment - Elèves inscrits - 3ème degré - 5.4 7.5 9.9 10.3 ... ... ... 24.0 ... Female (thousands) Femmes (milliers) Public expenditure on education (% Dépenses publiques consacrées à ... ... ... 12.2 ... 19.0 ... ... ... of budget) l'enseignement (% du budget) Health Santé Hospital beds - Total (per 10 000 Nombre de lits d'hôpitaux - Total ... 170 170 ... 160 160 ... ... ... population) (pour 10 000) Nurses - Total (per 10 000 Nombre d'infirmières - Total (pour 20 ... 40 26 32 32 ... ... ... population) 10 000) Physicians - Total (per 10 000 Nombre de médecins - Total (pour 2 2 2 2 2 3 ... ... ... population) 10 000) Public expenditure on Health (% of Dépenses publiques consacrées à la 9 18 17 18 19 ... ... ... ... budget) santé (% du budget) African Statistical Yearbook 2011 / Annuaire Statistique pour l'Afrique 2011
  • 272.
    Rwanda Rwanda II NATIONAL ACCOUNTS — COMPTES NATIONAUX 2002 2003 2004 2005 2006 2007 2008 2009 2010 Gross domestic product by kind of economic activity at current prices Produit intérieur brut par branche d'activité économique aux prix courants Rwandan Franc (Millions) Franc Rwandais(Millions) Agriculture 282 000 380 000 465 000 553 000 660 000 729 000 834 000 1 012 000 1 050 240 Agriculture Mining and quarrying 2 000 3 000 8 000 10 000 11 000 21 000 25 000 16 000 32 820 Industries extractives Manufacturing 60 000 67 000 84 000 101 000 117 000 124 500 158 500 189 500 213 330 Industries manufacturières Electricity, gas & water 3 000 2 000 1 000 3 000 3 000 8 000 5 000 6 000 16 410 Electricité, gaz et eau Construction 45 000 55 000 74 000 88 000 105 000 131 500 193 500 218 500 229 740 Bâtiments et travaux publics Wholesale & retail trade, Commerce de gros et de détail, 92 000 116 000 147 000 188 000 232 000 289 000 415 000 449 000 491 640 restaurants, hotels restaurants et hôtels Banques, assurances, affaires Finance, insurance, real estate, etc. 97 000 118 000 131 000 145 000 162 000 230 000 301 000 351 000 361 020 immobilières Transport and communications 53 000 60 000 74 000 90 000 117 000 145 000 197 000 223 000 262 560 Transport(s) et communications Administrations publiques et Public administration and defense 56 000 63 000 68 000 75 000 87 000 97 000 112 000 128 000 164 100 défense Other services 54 000 64 000 77 000 98 000 122 000 152 000 174 000 214 000 262 560 Autres services Moins Services d’intermédiation Less Imputed Service Charges - 11 000 - 14 000 - 17 000 - 19 000 - 24 000 - 31 000 - 40 000 - 41 000 - 65 640 financière Gross domestic product at factor Produit intérieur brut aux couts des 733 000 914 000 1 112 000 1 332 000 1 592 000 1 896 000 2 375 000 2 766 000 3 018 780 cost / basic prices facteurs / prix de base Plus: Indirect Taxes / taxes on Plus taxes indirectes/impôts sur les 64 000 79 000 94 000 108 000 123 000 150 000 204 000 226 000 262 560 products, less subsidies produits, moins les subventions Expenditure on Gross domestic product at current purchaser's values Emploi du produit intérieur brut aux prix courants d'acquisition Rwandan Franc (Millions) Franc Rwandais(Millions) Consommation finale des Government final consumption 156 000 191 000 221 000 262 400 312 000 338 000 378 000 457 000 507 000 administrations publiques Private final consumption 666 000 814 000 970 000 1 149 400 1 372 500 1 633 000 2 021 000 2 466 000 2 733 340 Consommation finale privée Gross fixed capital formation 108 000 138 000 181 000 227 000 274 500 369 000 585 000 645 000 689 000 Formation brute de capital fixe Increase in inventories ... ... ... ... ... ... ... ... ... Variation des stocks Exports of goods and services 56 000 84 000 134 000 164 200 190 000 229 000 373 000 303 000 356 000 Exportations de biens et services Moins importations de biens et 271 Less imports of goods and services 189 000 234 000 300 000 363 000 434 000 523 000 778 000 879 000 1 004 000 services GDP at purchasers' values 797 000 993 000 1 206 000 1 440 000 1 715 000 2 046 000 2 579 000 2 992 000 3 281 340 PIB aux prix d'acquisition Gross domestic product by kind of economic activity at constant Produit intérieur brut par branche d'activité economique aux prix constants prices Annual Growth Rates (%) Taux de croissance annuel (%) Agriculture 16.8 -3.1 1.9 6.5 2.8 2.6 6.5 7.6 4.9 Agriculture Mining and quarrying -27.3 -12.5 42.9 30.0 -15.4 45.5 -18.8 -15.4 -9.1 Industries extractives Manufacturing 15.7 4.9 11.8 8.4 13.6 0.9 5.1 3.2 9.4 Industries manufacturières Electricity, gas & water 0.0 -14.3 -33.3 0.0 -25.0 33.3 0.0 0.0 50.0 Electricité, gaz et eau Construction 3.1 7.6 19.7 9.4 12.9 15.2 28.1 1.3 8.9 Bâtiments et travaux publics Wholesale & retail trade, Commerce de gros et de 16.8 5.8 14.3 16.7 18.4 13.4 17.5 2.3 8.2 restaurants, hotels détail,restaurants et hôtels Banques, assurances, affaires Finance, insurance, real estate, etc. -47.6 6.2 17.4 17.3 23.2 14.5 23.9 9.0 8.8 immobilières Transport and communications 78.2 23.5 11.6 8.9 9.5 11.8 12.8 5.9 5.6 Transport(s) et communications Administrations publiques et Public administartion and defense 1.4 5.5 0.0 2.6 10.1 5.7 4.3 7.3 13.6 défense Other services 370.6 2.5 17.1 15.6 9.9 13.9 11.5 9.0 13.6 Autres services Moins Services d’intérmediation Less Imputed Service Charges -5.6 5.9 11.1 5.0 14.3 20.8 6.9 -3.2 16.7 financière Gross domestic product at factor Produit intérieur brut aux couts des 16.0 2.3 7.7 9.6 8.8 7.8 11.7 6.0 7.4 cost / basic prices facteurs / prix de base Plus: Indirect Taxes / taxes on Plus taxes indirectes/impôts sur les 9.6 0.0 3.9 6.5 8.8 7.3 12.0 6.0 7.6 products, less subsidies produits, moins les subventions Gross domestic product at market Produit intérieur brut aux prix du 15.5 2.1 7.4 9.4 8.8 7.8 11.7 6.0 7.4 prices marché 2008: semi-final 2009: Provisional 2010:Estimated 2008: semi-définitif 2009: provisoire 2010:Estimée African Statistical Yearbook 2011 / Annuaire Statistique pour l'Afrique 2011
  • 273.
    Rwanda Rwanda Expenditure on Gross domestic product at constant purchasers' Emplois du produit intérieur brut aux prix constants d'acquisition values Annual Growth Rates (%) Taux de croissance annuel (%) Consommation finale des Government final consumption 14.0 11.8 9.7 9.6 9.5 1.0 4.8 9.7 8.6 administrations publiques Private final consumption 16.3 -5.9 6.1 8.8 13.7 8.3 5.5 13.5 8.4 Consommation finale privée Gross fixed capital formation 7.3 9.9 13.5 15.8 17.3 25.3 32.3 2.6 7.3 Formation brute de capital fixe Exports of goods and services 3.8 16.5 30.7 11.4 2.7 11.6 40.1 -25.3 10.4 Exportations de biens et services Moins importations de biens et Less imports of goods and services 8.1 -12.5 20.8 13.2 29.6 17.3 15.1 9.7 11.7 services III INFLATION 2002 2003 2004 2005 2006 2007 2008 2009 2010 Annual Growth Rates (%) Taux de croissance annuel (%) All Item 2.0 7.4 12.0 9.1 8.9 9.1 15.5 10.3 3.1 Ensemble Food ... ... ... ... ... ... ... ... ... Alimentation Health ... ... ... ... ... ... ... ... ... Santé Energy ... ... ... ... ... ... ... ... ... Energie Transport ... ... ... ... ... ... ... ... ... Transport IV AGRICULTURAL PRODUCTION - PRODUCTION AGRICOLE 2002 2003 2004 2005 2006 2007 2008 2009 2010 Tons (Thousand) Tonnes (milliers) Plantains, Tons (thousands) 2 785 2 408 2 470 2 593 2 653 2 686 2 604 2 600 ... Plantains, tonnes (milliers) Potato, Tons (thousands) 1 039 1 100 1 073 1 314 1 285 967 1 162 1 200 ... Pommes de terre, tonnes (milliers) Sweet Potato, Tons (thousands) 1 292 868 908 886 777 841 826 850 ... Patates douces, tonnes (milliers) Cassava, Tons (thousands) 1 031 1 003 766 782 765 779 979 980 ... Manioc, tonnes (milliers) Pumpkins, squash and gourds, Tons Citrouilles, squash et gourdes, 210 210 210 210 215 215 215 ... ... (thousands) tonnes (milliers) V MINING PRODUCTION - PRODUCTION MINIERE 272 2002 2003 2004 2005 2006 2007 2008 2009 2010 Natural gaz (terajoules) 54.0 32.0 4.0 12.0 20.0 23.0 24.0 24.0 ... Gaz naturel (térajoules) Gold ores and concentrates 10.0 10.0 10.0 2.0 ... ... ... ... ... Minerais d'or et concentrés (Kilogrammes) (Kilogrammes) Tin ores and concentrates, metric Minerais d'étain et concentrés, 0.0 0.0 0.0 0.0 0.0 5.0 4.0 5.0 ... tons (thousands) tonnes métriques (milliers) VI ENERGY - ENERGIE 2002 2003 2004 2005 2006 2007 2008 2009 2010 Electricity - total hydro production, Électricité - production hydraulique 98.0 117.6 84.3 60.7 41.3 33.7 ... ... ... kilowatt hours (millions) totale, kilowatt-heures (millions) Electricity - total thermal production, Électricité - production thermique 2.0 2.0 8.3 52.1 129.4 135.2 ... ... ... kilowatt hours (millions) totale, kilowatt-heures (millions) Electricity - total production, self- Electricité - Production totale privée 2 2 2 2 2 2 ... ... ... producer (Million Kilowatt Hours) (million de kilowatt heures) Electricity - total production, public Electricité - Production totale 98 118 91 111 169 167 ... ... ... (Million Kilowatt Hours) publique (million de kilowatt heures) African Statistical Yearbook 2011 / Annuaire Statistique pour l'Afrique 2011
  • 274.
    Rwanda Rwanda VII TOURISM AND INFRASTRUCTURE - TOURISME ET INFRASTUCTURE 2002 2003 2004 2005 2006 2007 2008 2009 2010 Arrivals - Tourists (thousands) ... ... ... ... ... ... ... ... ... Arrivées - touristes (milliers) Rooms in hotels and similar Chambres d'hotels et établissements establishments (thousands) ... ... ... ... ... ... ... ... ... assimilés (milliers) Paved Road (% of total) ... ... 19 ... ... ... ... ... ... Routes asphaltées (% du total) Total Network (Railways-km) ... ... ... ... ... ... ... ... ... Réseau total voies ferrées-Km Main Telephone Lines (per 1,000 Lignes téléphoniques fixes (pour 3 3 3 3 3 2 2 ... ... inhabitants) 1000 habitants) Mobile Cellular Subscribers (per Abonnés aux téléphones mobiles 10 20 20 20 30 70 140 240 ... 1,000 inhabitants) (pour 1000 habitants) VII FINANCIAL AND MONETARY STATISTICS - FINANCES ET STATISTIQUES MONETAIRES 2002 2003 2004 2005 2006 2007 2008 2009 2010 VII-1 Monetary Statistics VII-1 Statistiques monétaires Rwandan Franc (Millions) Franc Rwandais(Millions) Money supply (M1) 70 373 82 305 99 941 129 326 ... ... ... ... ... Masse monétaire (M1) Quasi-money 72 621 82 727 114 621 123 751 ... ... ... ... ... Quasi-monnaie of which Demand Deposit ... ... ... ... ... ... ... ... ... dont Monnaie scripturale Net foreign assets 93 745 90 680 160 423 211 253 ... ... ... ... ... Avoirs extérieurs nets Domestic credit 91 816 122 615 113 785 115 815 ... ... ... ... ... Crédit intérieur of which claims on private sector 84 997 96 963 130 323 161 352 ... ... ... ... ... dont créances sur le secteur privé of which Claims on government dont créances nettes sur le 2 623 20 224 - 22 796 - 49 847 ... ... ... ... ... sector, net gouvernement International reserves (millions of US Réserves internationales (millions de 244 215 315 406 440 553 596 743 813 $) $ EU) Average Exchange Rate (National Taux de change (moyen) (monnaie 475.37 537.66 577.45 557.82 551.71 546.96 546.85 568.28 583.13 Currency per us $) nationale par dollars) VII-2 Public Finance VII-2 Finances publiques Rwandan Franc (Millions) Franc Rwandais(Millions) Total Revenues and Grants 148 159 195 100 272 500 344 800 374 700 443 450 623 800 735 750 662 587 Recettes totales et dons Tax Revenue 79 515 114 300 134 600 162 600 191 000 237 800 328 700 368 900 ... Recettes fiscales Non Tax Revenue 6 691 7 700 12 400 17 700 14 600 14 300 52 300 33 350 ... Recettes non fiscales Grants 61 953 73 100 125 500 164 500 169 100 191 350 242 800 333 500 ... Dons 273 Total Expenditures and Net Lending 158 064 216 200 275 000 340 700 383 700 491 600 639 100 801 050 675 411 Dépenses totales et prêts nets Current expenditure 86 043 129 900 114 500 151 000 176 400 198 700 225 400 256 750 ... Dépenses courantes Of which Wages and Salaries 38 942 44 000 48 600 51 200 62 200 73 800 84 200 98 850 ... Dont rémunérations et salaires Capital expenditure 50 024 51 100 89 500 121 400 118 700 186 300 267 800 311 650 ... Dépenses d'équipement Net Lending 628 4 000 21 600 4 400 9 600 - 8 100 2 900 74 000 ... Prêts nets Fiscal Balance - 9 905 - 21 100 - 2 500 4 100 - 9 000 - 48 150 - 15 300 - 65 300 - 12 824 Solde global y compris les dons VII-3 Balance of Payments VII-3 Balance des paiements US $ (Millions) $ E.U(Millions) Trade balance - 141 - 170 - 185 - 247 - 310 - 404 - 688 - 832 - 838 Balance commerciale Services Balance - 142 - 143 - 157 - 167 - 206 - 123 - 81 - 179 9 Balance des services Net Income - 19 - 31 - 34 - 27 - 29 - 17 - 35 - 37 - 31 Revenus nets Current transfers, net total 147 224 313 365 326 461 519 604 560 Transferts courants Current account balance - 155 - 120 - 63 - 76 - 220 - 84 - 285 - 444 - 299 Solde du compte courant VII-4 External Debt and Financial Flows VII-4 Dette extérieure et flux financiers US $ (Millions) $ E.U (Millions) Total external debt 1 477 1 572 1 683 1 511 486 574 677 749 912 Dette extérieure totale Private 0 0 0 0 0 0 0 0 0 Privée Public 1 477 1 572 1 683 1 511 486 574 677 749 912 Publique Total external debt service 8 13 23 31 91 10 9 10 19 Service de la dette extérieure Net Foreign Direct Investment Investissements étranger direct (flux 2 3 11 14 31 82 103 119 ... Inflows nets entrants) Net Total Official Development Aide publique au développement 363 335 490 577 589 722 933 934 ... assistance (nette totale) African Statistical Yearbook 2011 / Annuaire Statistique pour l'Afrique 2011
  • 275.
    Rwanda Rwanda 2002 2003 2004 2005 2006 2007 2008 2009 2010 US $ (Millions) Franc Rwandais Exports, fob Exportations, fàb Exports - Total 68 63 98 125 144 159 211 ... ... Exportations - Total Main Products Principaux produits Coffee 15 15 32 38 54 37 46 ... ... Café Tea 22 23 22 24 32 32 40 ... ... Thé Coltan 14 6 13 17 11 19 50 ... ... Coltan Cassiterite (Tins) 1 5 16 18 16 32 55 ... ... Cassitérite (conserves) 1 0 0 3 10 19 12 ... ... Main Destinations Principales destinations Indonesia 59.0 66.1 271.7 0.0 0.1 0.0 0.1 0.0 ... Indonésie China 5.2 7.1 16.0 11.5 21.9 23.6 29.6 25.7 ... Chine Germany 4.9 8.1 11.6 18.6 20.8 18.0 23.5 16.8 ... Allemagne United States 3.3 2.9 5.8 6.7 9.3 13.2 14.3 19.8 ... États-Unis Hong Kong, China 10.1 4.2 3.6 4.6 0.5 12.7 7.4 10.1 ... Hong Kong, Chine 2002 2003 2004 2005 2006 2007 2008 2009 2010 Imports, cif Importations, cif 274 Imports - Total 303 370 443 524 623 802 1 146 967 ... Importations - Total (millions) Principaux produits Main Products Wheat or meslin flour 2 1 5 3 2 7 76 2 ... Blé nda et méteil Portland cement nes 0 1 0 0 0 4 30 35 ... Ciment Portland NDA Electrical apparatus for line Appareils électriques pour la 0 2 2 8 5 2 7 23 ... telephony/telegraphy nes téléphonie/télégraphie NDA Transmission apparatus,for Appareils de transmission, pour les radioteleph incorporatg reception 5 2 1 6 2 7 18 18 ... appareils de réception radioteleph apparatus incorporatg Apparatus for carrier-current/digital Appareils pour systèmes de 0 0 0 1 1 6 17 8 ... line systems canalisation carrier-current/digital Main Origin Principales provenances Kenya 39.9 79.8 81.8 96.4 66.1 86.2 130.4 123.4 ... Kenya Uganda 12.9 20.8 24.7 36.1 30.5 83.3 136.9 135.3 ... Ouganda United Arab Emirates 3.1 3.7 5.0 13.1 116.2 99.4 134.0 90.9 ... Émirats arabes unis Belgium 23.0 22.0 29.2 28.3 28.2 43.0 54.8 49.4 ... Belgique Germany 17.4 24.3 32.1 26.7 44.5 43.3 45.4 45.9 ... Allemagne African Statistical Yearbook 2011 / Annuaire Statistique pour l'Afrique 2011
  • 276.
    Sao Tome andPrincipe Sao Tomé-et-Principe AREA (KM 2) 964 SUPERFICIE (KM 2) CAPITAL CITY Sao Tome Sao Tomé CAPITALE CURRENCY Dobra Dobra MONNAIE I SOCIAL AND DEMOGRAPHIC INDICATORS — INDICATEURS DEMOGRAPHIQUES ET SOCIAUX 2002 2003 2004 2005 2006 2007 2008 2009 2010 Population Population Population au milieu de l'année - Mid-year population - Total (Million) 0.1 0.1 0.2 0.2 0.2 0.2 0.2 0.2 0.2 Total (million) Population au milieu de l'année - Mid-year population - Urban (%) 55.3 56.3 57.2 58.1 58.9 59.8 60.6 61.4 62.2 Urbaine (%) Female (%) 50.4 50.4 50.4 50.4 50.5 50.5 50.5 50.5 50.5 Femme (%) Population by Age Group Population par groupe d'âge 0-14 60 713 61 654 62 595 63 464 64 245 64 954 65 589 66 165 66 685 0-14 15-64 78 009 79 435 80 899 82 477 84 195 86 044 88 018 90 110 92 308 15-64 65+ 6 384 6 522 6 624 6 681 6 686 6 639 6 567 6 480 6 404 65+ Active Population (000) 48.8 50.0 51.2 52.5 53.8 55.1 56.4 57.8 59.2 Population active (000) Female (%) 37.3 37.3 37.4 37.4 37.5 37.7 37.9 38.0 38.1 Femme (%) Taux brut de natalité - Total (par Crude birth rate - Total (per 1000) 35.0 35.0 34.0 34.0 33.0 33.0 32.0 32.0 ... 1000) Taux brut de mortalité - Total (par Crude death rate - Total (per 1000) 8.0 8.0 8.0 8.0 7.0 7.0 7.0 7.0 ... 1000) Life expectancy at birth - Total Espérance de vie à la naissance - 64.0 65.0 65.0 66.0 66.0 66.0 67.0 67.0 ... (years) Total (années) Net reproduction rate - (per Taux net de reproduction - (par ... ... ... ... 2.0 ... ... ... 2.0 woman) femme) Indice synthétique de fécondité - Total fertility rate - (p woman) y (per ) 2.0 2.0 2.0 2.0 2.0 2.0 2.0 2.0 ... (par femme) Education Enseignement Teaching staff at first level - Total Personnel enseignant - 1er degré - 0.87 0.7 1.0 1.0 1.0 1.0 0.9 0.9 ... (thousands) Total (milliers) Teaching staff at second level - Total Personnel enseignant - 2ème degré - ... ... 0.5 0.5 ... 0.6 0.2 0.2 ... 275 (thousands) Total (milliers) Teaching staff at third level - Total Personnel enseignant - 3ème degré - 0.1 0.1 0.1 0.1 ... 0.1 0.0 0.0 ... (thousands) Total (milliers) First level student enrollment - Total Elèves inscrits - 1er degré - Total 27 27 28 29 31 31 33 34 ... (thousands) (milliers) First level student enrollment - Elèves inscrits - 1er degré - Femmes 14 14 15 15 15 15 16 17 ... Female (thousands) (milliers) Second level student enrollment - Elèves inscrits - 2ème degré - Total 6 5 6 7 8 8 7 8 ... Total (thousands) (milliers) Second level student enrollment - Elèves inscrits - 2ème degré - ... 4 4 4 4 5 4 5 ... Female (thousands) Femmes (milliers) Third level student enrollment - Total Elèves inscrits - 3ème degré - Total ... ... ... ... ... ... ... 0.7 ... (thousands) (milliers) Third level student enrollment - Elèves inscrits - 3ème degré - ... ... ... ... ... ... ... 0.3 ... Female (thousands) Femmes (milliers) Public expenditure on education (% Dépenses publiques consacrées à 3.2 3.5 1.7 1.6 2.3 2.2 2.3 ... ... of budget) l'enseignement (% du budget) Health Santé Hospital beds - Total (per 10 000 Nombre de lits d'hôpitaux - Total 2 2 2 2 2 2 2 2 ... population) (pour 10 000) Nurses - Total (per 10 000 Nombre d'infirmières - Total (pour 11 11 11 11 11 11 11 11 ... population) 10 000) Physicians - Total (per 10 000 Nombre de médecins - Total (pour 4 5 5 4 4 5 4 4 ... population) 10 000) Public expenditure on Health (% of Dépenses publiques consacrées à la 13 14 7 7 5 5 5 ... ... budget) santé (% du budget) African Statistical Yearbook 2011 / Annuaire Statistique pour l'Afrique 2011
  • 277.
    Sao Tome andPrincipe Sao Tomé-et-Principe II NATIONAL ACCOUNTS — COMPTES NATIONAUX 2002 2003 2004 2005 2006 2007 2008 2009 2010 Gross domestic product by kind of economic activity at current prices Produit intérieur brut par branche d'activité économique aux prix courants Dobra (Millions) Dobra(Millions) Agriculture 162 773 193 580 210 970 235 900 274 142 334 984 463 051 ... ... Agriculture Mining and quarrying 2 864 4 097 5 139 5 280 8 832 11 475 14 569 ... ... Industries extractives Manufacturing 61 203 70 883 76 755 87 050 106 064 122 349 207 848 ... ... Industries manufacturières Electricity, gas & water 13 841 18 133 22 347 28 968 36 887 43 271 69 317 ... ... Electricité, gaz et eau Construction 49 359 60 699 76 308 84 228 127 537 157 334 191 059 ... ... Bâtiments et travaux publics Wholesale & retail trade, Commerce de gros et de détail, 200 159 241 242 261 817 318 012 399 211 473 280 651 152 ... ... restaurants, hotels restaurants et hôtels Banques, assurances, affaires Finance, insurance, real estate, etc. 48 378 83 343 107 718 139 087 195 547 265 650 371 091 ... ... immobilières Transport and communications 98 354 121 356 155 352 184 993 245 955 289 813 350 550 ... ... Transport(s) et communications Administrations publiques et Public administration and defense 39 354 52 740 73 164 104 913 116 811 107 004 123 065 ... ... défense Other services 44 754 51 110 56 801 69 158 83 999 103 879 125 719 ... ... Autres services Moins Services d’intermédiation Less Imputed Service Charges - 13 037 - 27 339 - 42 349 - 65 030 - 89 479 - 130 555 - 186 501 ... ... financière Gross domestic product at factor Produit intérieur brut aux couts des 708 002 869 843 1 004 023 1 192 558 1 505 506 1 778 482 2 380 920 ... ... cost / basic prices facteurs / prix de base Plus: Indirect Taxes / taxes on Plus taxes indirectes/impôts sur les 66 761 79 278 96 637 121 322 184 169 213 614 283 882 ... ... products, less subsidies produits, moins les subventions Expenditure on Gross domestic product at current purchaser's values Emploi du produit intérieur brut aux prix courants d'acquisition Dobra (Millions) Dobra(Millions) Consommation finale des Government final consumption 293 051 433 906 619 913 561 090 819 873 874 206 1 104 289 1 301 665 ... administrations publiques Private final consumption 622 009 703 199 738 597 1 116 334 1 288 425 1 600 056 2 231 744 2 877 626 ... Consommation finale privée Gross fixed capital formation 257 775 357 851 410 375 472 832 1 132 820 1 366 350 1 812 586 2 195 910 ... Formation brute de capital fixe Increase in inventories ... ... ... ... ... ... ... ... ... Variation des stocks Exports of goods and services 272 176 347 268 363 729 406 855 507 848 564 868 724 689 855 962 ... Exportations de biens et services 276 Moins importations de biens et Less imports of goods and services 670 246 893 103 1 031 954 1 243 232 2 059 291 2 413 385 3 208 506 3 850 250 ... services GDP at purchasers' values 774 764 949 121 1 100 660 1 313 880 1 689 675 1 992 096 2 664 801 3 380 913 ... PIB aux prix d'acquisition Gross domestic product by kind of economic activity at constant Produit intérieur brut par branche d'activité economique aux prix constants prices Annual Growth Rates (%) Taux de croissance annuel (%) Agriculture 0.0 2.5 1.7 3.3 1.3 7.0 7.1 ... ... Agriculture Mining and quarrying -19.2 10.5 8.8 -12.7 35.2 2.0 -14.2 ... ... Industries extractives Manufacturing 4.5 3.4 2.7 3.6 5.4 2.9 4.5 ... ... Industries manufacturières Electricity, gas & water 17.0 10.0 6.2 10.5 11.8 1.7 8.5 ... ... Electricité, gaz et eau Construction -23.1 9.8 8.8 -13.5 31.6 -0.5 -16.1 ... ... Bâtiments et travaux publics Wholesale & retail trade, Commerce de gros et de 5.9 7.4 1.7 4.3 5.5 2.8 6.0 ... ... restaurants, hotels détail,restaurants et hôtels Banques, assurances, affaires Finance, insurance, real estate, etc. 2.5 4.9 2.4 1.1 6.6 2.0 3.3 ... ... immobilières Transport and communications 17.4 11.1 11.1 10.0 9.8 1.5 4.6 ... ... Transport(s) et communications Administrations publiques et Public administartion and defense 1.1 12.7 7.5 4.3 -0.3 8.7 4.9 ... ... défense Other services 3.4 4.3 -0.4 7.9 4.2 6.1 5.1 ... ... Autres services Moins Services d’intérmediation Less Imputed Service Charges 0.2 109.9 50.1 48.5 11.8 23.1 8.2 ... ... financière Gross domestic product at factor Produit intérieur brut aux couts des 2.5 4.9 2.4 1.1 6.6 2.0 3.3 ... cost / basic prices facteurs / prix de base Plus: Indirect Taxes / taxes on Plus taxes indirectes/impôts sur les 17.9 14.6 22.6 22.6 43.2 19.9 19.7 ... ... products, less subsidies produits, moins les subventions Gross domestic product at market Produit intérieur brut aux prix du 3.6 5.8 4.3 3.5 11.4 5.0 6.5 ... ... prices marché 2009: Provisional 2009: provisoire African Statistical Yearbook 2011 / Annuaire Statistique pour l'Afrique 2011
  • 278.
    Sao Tome andPrincipe Sao Tomé-et-Principe Expenditure on Gross domestic product at constant purchasers' Emplois du produit intérieur brut aux prix constants d'acquisition values Annual Growth Rates (%) Taux de croissance annuel (%) Consommation finale des Government final consumption -19.8 22.4 26.2 -19.5 23.3 -4.9 3.9 3.9 ... administrations publiques Private final consumption 8.7 -1.1 -4.2 28.0 1.2 10.1 10.0 8.5 ... Consommation finale privée Gross fixed capital formation -5.5 15.4 1.3 2.5 102.1 7.5 9.2 6.8 ... Formation brute de capital fixe Exports of goods and services 6.8 5.4 -7.0 -1.0 5.3 -0.8 5.6 4.1 ... Exportations de biens et services Moins importations de biens et Less imports of goods and services -6.6 10.1 2.1 7.2 39.8 4.5 9.4 5.8 ... services III INFLATION 2002 2003 2004 2005 2006 2007 2008 2009 2010 Annual Growth Rates (%) Taux de croissance annuel (%) All Item 9.0 9.9 15.2 17.2 24.6 27.6 24.8 16.1 12.3 Ensemble Food 12.0 8.9 17.3 19.9 26.9 38.3 28.9 20.6 ... Alimentation Health 9.1 15.8 6.6 0.5 4.4 3.5 17.6 9.5 ... Santé Energy -2.6 19.1 11.1 20.9 6.5 10.2 47.4 -6.2 ... Energie Transport 0.4 23.5 41.9 11.5 20.9 13.8 -6.8 2.1 ... Transport IV AGRICULTURAL PRODUCTION - PRODUCTION AGRICOLE 2002 2003 2004 2005 2006 2007 2008 2009 2010 Tons (Thousand) Tonnes (milliers) Maize (Tons) 3 3 3 3 3 3 3 ... ... Maïs (ton) Cassava (Tons) 6 6 6 6 6 7 7 ... ... Manioc (ton) Coconuts (Tons) 26 27 27 27 28 28 28 ... ... Coco (ton) Banana (Tons) 27 27 25 29 32 32 32 ... ... Banane (ton) Taro (Tons) 26 26 26 26 27 28 28 ... ... Tarau (ton) V MINING PRODUCTION - PRODUCTION MINIERE 277 2002 2003 2004 2005 2006 2007 2008 2009 2010 ... ... ... ... ... ... ... ... ... ... ... ... ... ... ... ... ... ... ... ... ... ... ... ... ... ... ... VI ENERGY - ENERGIE 2002 2003 2004 2005 2006 2007 2008 2009 2010 Electricity - total hydro production, Électricité - production hydraulique 25.4 26.6 31.1 37.2 38.8 39.2 37.2 42.2 ... kilowatt hours (millions) totale, kilowatt-heures (millions) Electricity - total thermal production, Électricité - production thermique 6.1 7.9 6.2 4.2 7.5 7.6 4.2 7.3 ... kilowatt hours (millions) totale, kilowatt-heures (millions) Electricity - total production, self- Electricité - Production totale privée ... ... ... ... ... ... ... ... ... producer (Million Kilowatt Hours) (million de kilowatt heures) Electricity - total production, public Electricité - Production totale 32 35 37 41 46 47 41 49 ... (Million Kilowatt Hours) publique (million de kilowatt heures) African Statistical Yearbook 2011 / Annuaire Statistique pour l'Afrique 2011
  • 279.
    Sao Tome andPrincipe Sao Tomé-et-Principe VII TOURISM AND INFRASTRUCTURE - TOURISME ET INFRASTUCTURE 2002 2003 2004 2005 2006 2007 2008 2009 2010 Arrivals - Tourists (thousands) 9 9.609 10.576 15.746 12.266 11.815 14.456 15.2 ... Arrivées - touristes (milliers) Rooms in hotels and similar Chambres d'hotels et établissements establishments (thousands) 0.495 0.492 0.492 0.413 ... ... ... ... ... assimilés (milliers) Paved Road (% of total) 89 84 82 78 75 75 76 75 ... Routes asphaltées (% du total) Total Network (Railways-km) 350 400 430 480 530 545 555 600 ... Réseau total voies ferrées-Km Main Telephone Lines (per 1,000 Lignes téléphoniques fixes (pour 40 50 50 50 50 50 50 50 ... inhabitants) 1000 habitants) Mobile Cellular Subscribers (per Abonnés aux téléphones mobiles 10 30 50 80 120 190 310 390 ... 1,000 inhabitants) (pour 1000 habitants) VII FINANCIAL AND MONETARY STATISTICS - FINANCES ET STATISTIQUES MONETAIRES 2002 2003 2004 2005 2006 2007 2008 2009 2010 VII-1 Monetary Statistics VII-1 Statistiques monétaires Dobra (Millions) Dobra(Millions) Money supply (M1) 176 729 274 992 267 816 343 521 453 076 614 035 837 601 867 120 989 162 Masse monétaire (M1) Quasi-money 15 192 20 231 30 413 89 988 116 776 151 165 209 703 266 164 326 566 Quasi-monnaie of which Demand Deposit ... ... ... ... ... ... ... ... ... dont Monnaie scripturale Net foreign assets 256 720 300 001 268 678 813 220 737 513 1 029 500 1 417 830 1 278 630 1 304 920 Avoirs extérieurs nets Domestic credit 31 669 114 734 210 051 56 902 353 080 459 993 333 622 809 573 1 366 310 Crédit intérieur of which claims on private sector 43 958 95 777 176 103 320 246 464 243 621 697 763 303 1 063 450 1 484 120 dont créances sur le secteur privé of which Claims on government dont créances nettes sur le - 12 288 18 957 33 948 - 263 344 - 123 394 - 178 056 - 449 995 - 280 124 - 201 691 sector, net gouvernement International reserves (millions of US Réserves internationales (millions de 17 25 20 27 34 39 ... ... ... $) $ EU) Average Exchange Rate (National Taux de change (moyen) (monnaie 9 088.33 9 347.58 9 902.32 10 558.00 12 448.60 13 536.80 14 695.20 16 208.50 18 498.60 Currency per us $) nationale par dollars) VII-2 Public Finance VII-2 Finances publiques Dobra (Millions) Dobra(Millions) Total Revenues and Grants 245 052 244 727 367 520 411 766 570 100 582 421 822 565 962 810 1 278 000 Recettes totales et dons Tax Revenue 94 952 114 166 147 327 180 012 266 561 319 979 411 406 472 960 578 000 Recettes fiscales Non Tax Revenue 18 449 26 224 40 327 27 356 56 949 53 561 39 666 55 906 91 000 Recettes non fiscales 278 Grants 131 651 104 337 179 865 204 398 246 591 208 881 371 493 433 944 609 000 Dons Total Expenditures and Net Lending 297 317 280 376 543 578 542 619 800 912 858 119 1 148 299 1 909 053 1 638 000 Dépenses totales et prêts nets Current expenditure 110 723 155 219 246 517 314 517 419 597 479 299 548 445 642 040 698 000 Dépenses courantes Of which Wages and Salaries 43 569 54 963 75 743 103 203 133 028 174 344 219 099 252 090 308 000 Dont rémunérations et salaires Capital expenditure 165 576 107 815 260 175 214 298 320 132 341 406 493 438 932 338 940 000 Dépenses d'équipement Net Lending 21 018 17 343 36 886 13 803 61 183 37 414 106 416 334 675 ... Prêts nets Fiscal Balance - 52 265 - 35 649 - 176 058 - 130 852 - 230 812 - 275 698 - 325 734 - 946 243 - 360 000 Solde global y compris les dons VII-3 Balance of Payments VII-3 Balance des paiements US $ (Millions) $ E.U(Millions) Trade balance - 22 - 25 - 30 - 35 - 51 - 60 - 82 - 70 - 87 Balance commerciale Services Balance - 9 - 10 - 10 - 10 - 20 - 18 - 14 - 13 - 22 Balance des services Net Income - 2 - 2 - 2 - 2 2 6 4 3 3 Revenus nets Current transfers, net total 17 23 25 35 33 17 25 31 46 Transferts courants Current account balance - 15 - 14 - 18 - 12 - 36 - 56 - 66 - 49 - 60 Solde du compte courant VII-4 External Debt and Financial Flows VII-4 Dette extérieure et flux financiers US $ (Millions) $ E.U (Millions) Total external debt 301 314 325 316 360 150 110 124 144 Dette extérieure totale Private 0 0 0 0 35 0 0 0 0 Privée Public 301 314 325 316 324 150 110 124 144 Publique Total external debt service 9 10 11 12 5 1 1 2 6 Service de la dette extérieure Net Foreign Direct Investment Investissements étranger direct (flux 4 3 4 16 38 35 33 36 ... Inflows nets entrants) Net Total Official Development Aide publique au développement 26 38 34 32 23 36 47 31 ... assistance (nette totale) African Statistical Yearbook 2011 / Annuaire Statistique pour l'Afrique 2011
  • 280.
    Sao Tome andPrincipe Sao Tomé-et-Principe 2002 2003 2004 2005 2006 2007 2008 2009 2010 Dobra (Millions) Dobra Exports, fob Exportations, fàb Exports - Total 4 623 218 6 210 607 3 204 804 3 112 016 3 410 093 5 875 297 10 135 544 7 383 834 ... Exportations - Total Main Products Principaux produits Cocoa 41 845 57 737 31 590 31 918 42 190 47 741 74 715 88 976 ... Cacao Coconut 321 380 829 1 120 441 310 377 1 407 ... Coco Coconut oil 307 210 280 1 259 120 266 209 200 ... Huile de coco Flowers and plants 481 1 139 10 929 14 519 8 701 1 603 306 468 ... Fleurs et plantes ... ... ... ... ... ... ... ... ... Main Destinations Principales destinations Netherlands 27 236.2 24 006.0 18 153.2 13 844.3 12 982.5 6 993.2 23 307.2 27 078.6 ... Pays-Bas Portugal 8 888.2 22 579.2 9 009.5 14 018.3 16 099.8 24 189.5 40 826.6 33 136.3 ... Portugal Belgium 5 919.2 9 306.3 3 323.0 3 889.4 6 859.2 9 252.5 6 545.7 19 024.7 ... Belgique Angola 966.0 1 016.7 631.0 1 442.2 729.6 658.6 791.4 1 125.4 ... Angola France 369.0 2 396.9 854.2 664.6 4 562.8 9 130.7 5 666.9 2 646.2 ... France 2002 2003 2004 2005 2006 2007 2008 2009 2010 Imports, cif Importations, cif Imports - Total 10 306 806 11 020 085 14 193 792 22 588 752 25 504 911 28 498 128 43 748 273 31 927 089 ... Importations - Total (millions) 279 Principaux produits Main Products Food products 55 207 81 937 72 515 106 427 147 992 155 137 198 623 249 024 ... Produits alimentaires Agricultural products 61 902 64 184 22 468 16 998 122 551 149 490 70 241 93 707 ... Produits agricoles Machinery and electrical appliances 36 677 49 106 37 847 35 678 97 063 159 154 227 939 198 498 ... Machines et appareils électriques Freight Vehicules 32 785 42 062 69 150 88 552 81 290 85 644 140 206 175 938 ... Vehicules de transport Fuel 34 364 41 267 3 364 3 078 179 190 220 340 1 644 438 ... ... Carburant Main Origin Principales provenances Portugal 169 654.9 241 517.0 249 193.0 299 021.0 572 445.0 742 611.1 1 027 939.3 945 502.8 ... Portugal Germany ... 39 382.8 64 113.2 107 078.0 3 707.4 2 607.2 377.7 847.2 ... Allemagne Belgium 42 002.5 43 722.2 36 598.8 32 329.3 38 730.1 21 600.5 28 269.9 31 671.0 ... Belgique Japan 19 697.9 24 129.3 24 968.9 37 408.8 6 123.0 2 805.9 13 396.5 73 236.7 ... Japon Gabon 8 477.7 8 025.4 4 579.9 3 049.3 5 614.6 10 576.6 49 556.2 50 316.3 ... Gabon African Statistical Yearbook 2011 / Annuaire Statistique pour l'Afrique 2011
  • 281.
    Senegal Sénégal AREA (KM 2) 196 722 SUPERFICIE (KM 2) CAPITAL CITY Dakar Dakar CAPITALE CURRENCY CFA Franc Franc CFA MONNAIE I SOCIAL AND DEMOGRAPHIC INDICATORS — INDICATEURS DEMOGRAPHIQUES ET SOCIAUX 2002 2003 2004 2005 2006 2007 2008 2009 2010 Population Population Population au milieu de l'année - Mid-year population - Total (Million) 10.0 10.3 10.6 10.9 11.2 11.5 11.8 12.2 12.5 Total (million) Population au milieu de l'année - Mid-year population - Urban (%) 40.8 45.7 46.0 46.2 46.4 46.6 46.8 47.0 ... Urbaine (%) Female (%) 50.8 50.8 50.8 50.7 50.7 50.7 50.7 50.6 50.6 Femme (%) Population by Age Group Population par groupe d'âge 0-14 4358 560 4455 160 4555 860 4661 340 4769 710 4879 780 4992 230 5105 876 ... 0-14 15-64 5296 570 5477 000 5657 070 5839 990 6030 250 6230 440 6440 510 6653 480 ... 15-64 65+ 391 920 387 390 396 030 405 790 414 000 419 110 420 860 426 505 ... 65+ Active Population (000) 4 526.7 4 622.6 4 770.7 4 928.9 5 086.8 5 251.4 5 276.0 5 434.3 ... Population active (000) Female (%) 32.8 41.7 41.9 42.0 42.1 42.5 42.7 42.9 ... Femme (%) Taux brut de natalité - Total (par Crude birth rate - Total (per 1000) 39.9 39.8 39.6 39.1 30.3 39.1 38.9 38.6 ... 1000) Taux brut de mortalité - Total (par Crude death rate - Total (per 1000) 12.6 12.4 12.3 12.1 11.9 11.7 11.5 11.3 ... 1000) Life expectancy at birth - Total Espérance de vie à la naissance - 55.8 56.2 56.4 56.7 57.0 57.3 57.5 57.8 ... (years) Total (années) Net reproduction rate - (per Taux net de reproduction - (par 2.1 2.1 2.1 2.0 2.0 2.0 2.0 2.0 ... woman) femme) Indice synthétique de fécondité - Total fertility rate - (p woman) y (per ) 5.3 5.3 5.2 5.1 5.1 5.0 5.0 4.9 ... (par femme) Education Enseignement Teaching staff at first level - Total Personnel enseignant - 1er degré - 28.84 29.2 31.7 34.7 37.8 46.0 46.8 47.7 ... (thousands) Total (milliers) Teaching staff at second level - Total Personnel enseignant - 2ème degré - ... ... ... ... ... ... ... ... ... 280 (thousands) Total (milliers) Teaching staff at third level - Total Personnel enseignant - 3ème degré - ... ... 1.1 1.1 ... ... ... ... ... (thousands) Total (milliers) First level student enrollment - Total Elèves inscrits - 1er degré - Total 1 197 1 287 1 383 1 444 1 488 1 572 1 618 1 695 ... (thousands) (milliers) First level student enrollment - Elèves inscrits - 1er degré - Femmes 564 612 667 702 733 780 812 863 ... Female (thousands) (milliers) Second level student enrollment - Elèves inscrits - 2ème degré - Total 289 311 360 401 443 499 558 688 ... Total (thousands) (milliers) Second level student enrollment - Elèves inscrits - 2ème degré - 115 126 150 170 190 215 244 316 ... Female (thousands) Femmes (milliers) Third level student enrollment - Total Elèves inscrits - 3ème degré - Total ... 31.2 37.2 42.4 62.5 78.3 91.4 94.2 ... (thousands) (milliers) Third level student enrollment - Elèves inscrits - 3ème degré - ... ... ... ... 30.5 31.3 31.0 34.8 ... Female (thousands) Femmes (milliers) Public expenditure on education (% Dépenses publiques consacrées à 16.0 16.5 17.7 19.3 17.5 23.0 24.0 26.0 ... of budget) l'enseignement (% du budget) Health Santé Hospital beds - Total (per 10 000 Nombre de lits d'hôpitaux - Total ... ... ... ... 13 14 15 14 ... population) (pour 10 000) Nurses - Total (per 10 000 Nombre d'infirmières - Total (pour ... ... 29 1 1 1 1 1 ... population) 10 000) Physicians - Total (per 10 000 Nombre de médecins - Total (pour ... ... 5 0 0 0 0 0 ... population) 10 000) Public expenditure on Health (% of Dépenses publiques consacrées à la 7 8 8 8 5 6 6 ... ... budget) santé (% du budget) African Statistical Yearbook 2011 / Annuaire Statistique pour l'Afrique 2011
  • 282.
    Senegal Sénégal II NATIONAL ACCOUNTS — COMPTES NATIONAUX 2002 2003 2004 2005 2006 2007 2008 2009 2010 Gross domestic product by kind of economic activity at current prices Produit intérieur brut par branche d'activité économique aux prix courants CFA Franc (Millions) Franc CFA (Millions) Agriculture 506 306 602 445 581 406 671 061 633 103 642 640 818 743 886 578 ... Agriculture Mining and quarrying 44 798 47 475 45 422 44 096 52 136 51 552 47 843 94 882 ... Industries extractives Manufacturing 562 085 559 839 595 079 601 133 609 682 675 203 736 502 748 633 ... Industries manufacturières Electricity, gas & water 80 157 91 008 95 512 102 599 115 124 136 315 146 618 134 084 ... Electricité, gaz et eau Construction 143 397 156 158 185 849 195 969 234 498 262 088 260 793 251 020 ... Bâtiments et travaux publics Wholesale & retail trade, Commerce de gros et de détail, 668 295 693 166 743 879 782 616 843 409 934 603 1 042 726 1 005 323 ... restaurants, hotels restaurants et hôtels Banques, assurances, affaires Finance, insurance, real estate, etc. 335 996 352 569 367 239 386 125 414 296 458 065 524 397 529 691 ... immobilières Transport and communications 278 318 330 050 393 968 452 735 525 684 591 577 663 305 660 899 ... Transport(s) et communications Administrations publiques et Public administration and defense 369 473 368 267 446 529 484 594 531 952 554 169 581 048 609 549 ... défense Other services 347 028 373 750 346 824 366 181 375 383 469 275 526 497 515 000 ... Autres services Moins Services d’intermédiation Less Imputed Service Charges - 75 075 - 74 108 - 86 703 - 94 672 - 103 281 - 109 903 - 132 872 - 134 467 ... financière Gross domestic product at factor Produit intérieur brut aux couts des 3 260 778 3 500 619 3 715 004 3 992 436 4 231 986 4 665 585 5 215 598 5 301 192 ... cost / basic prices facteurs / prix de base Plus: Indirect Taxes / taxes on Plus taxes indirectes/impôts sur les 456 861 486 180 527 834 600 659 661 563 742 751 734 557 722 016 ... products, less subsidies produits, moins les subventions Expenditure on Gross domestic product at current purchaser's values Emploi du produit intérieur brut aux prix courants d'acquisition CFA Franc (Millions) Franc CFA (Millions) Consommation finale des Government final consumption 493 198 518 293 571 046 610 645 668 120 767 098 806 982 853 134 ... administrations publiques Private final consumption 2 973 142 3 076 341 3 290 148 3 565 035 3 871 537 4 270 600 4 776 890 4 736 991 ... Consommation finale privée Gross fixed capital formation 922 704 857 446 944 073 1 071 365 1 279 734 1 414 078 1 610 512 1 426 463 ... Formation brute de capital fixe Increase in inventories - 284 161 17 619 - 26 558 53 633 - 70 876 167 970 332 392 204 742 ... Variation des stocks Exports of goods and services 1 061 344 1 061 300 1 151 450 1 240 821 1 254 040 1 376 220 1 566 250 1 395 180 ... Exportations de biens et services Moins importations de biens et 281 Less imports of goods and services 1 448 587 1 544 200 1 687 322 1 948 404 2 109 007 2 587 630 3 142 870 2 593 301 ... services GDP at purchasers' values 3 717 639 3 986 798 4 242 837 4 593 095 4 893 548 5 408 336 5 950 155 6 023 208 ... PIB aux prix d'acquisition Gross domestic product by kind of economic activity at constant Produit intérieur brut par branche d'activité economique aux prix constants prices Annual Growth Rates (%) Taux de croissance annuel (%) Agriculture -22.2 17.8 2.4 11.0 -8.4 -5.8 18.6 10.0 ... Agriculture Mining and quarrying 13.2 13.9 6.2 -17.6 -16.4 -6.2 -3.8 54.9 ... Industries extractives Manufacturing 3.4 2.2 3.6 1.6 -2.9 6.0 -2.4 6.5 ... Industries manufacturières Electricity, gas & water 7.7 11.8 2.3 5.9 4.5 8.5 2.5 -0.1 ... Electricité, gaz et eau Construction 12.0 4.0 18.0 9.8 13.1 9.4 -1.6 -4.4 ... Bâtiments et travaux publics Wholesale & retail trade, Commerce de gros et de 1.5 4.7 4.1 1.8 3.8 3.9 1.7 1.8 ... restaurants, hotels détail,restaurants et hôtels Banques, assurances, affaires Finance, insurance, real estate, etc. 3.9 5.6 5.3 4.6 3.4 3.8 5.3 1.3 ... immobilières Transport and communications 12.1 15.2 16.6 14.2 15.8 11.5 6.9 -0.3 ... Transport(s) et communications Administrations publiques et Public administartion and defense 0.5 1.1 12.8 5.9 6.0 2.2 -0.5 2.9 ... défense Other services 12.5 3.7 1.3 6.0 0.0 13.9 4.4 -1.7 ... Autres services Moins Services d’intérmediation Less Imputed Service Charges 1.7 -2.8 13.2 8.3 7.6 4.7 18.4 0.8 ... financière Gross domestic product at factor Produit intérieur brut aux couts des 0.2 7.2 6.2 5.7 2.3 4.9 3.8 3.1 ... cost / basic prices facteurs / prix de base Plus: Indirect Taxes / taxes on Plus taxes indirectes/impôts sur les 3.8 3.2 4.0 4.8 3.8 5.0 -0.6 -4.3 ... products, less subsidies produits, moins les subventions Gross domestic product at market Produit intérieur brut aux prix du 0.7 6.7 5.9 5.6 2.5 4.9 3.2 2.2 ... prices marché 2008: semi-final 2009: Provisional 2008: semi-définitif 2009: provisoire African Statistical Yearbook 2011 / Annuaire Statistique pour l'Afrique 2011
  • 283.
    Senegal Sénégal Expenditure on Gross domestic product at constant purchasers' Emplois du produit intérieur brut aux prix constants d'acquisition values Annual Growth Rates (%) Taux de croissance annuel (%) Consommation finale des Government final consumption 3.5 2.7 5.6 5.3 5.1 7.3 0.9 2.6 ... administrations publiques Private final consumption 4.3 5.3 4.3 5.1 4.7 4.9 3.4 3.2 ... Consommation finale privée Gross fixed capital formation 2.7 3.6 9.5 6.1 13.2 7.4 7.8 -7.4 ... Formation brute de capital fixe Exports of goods and services 3.6 6.6 6.8 2.0 -3.2 -0.1 1.3 2.9 ... Exportations de biens et services Moins importations de biens et Less imports of goods and services 3.5 11.4 0.5 11.1 1.2 14.3 -0.5 0.6 ... services III INFLATION 2002 2003 2004 2005 2006 2007 2008 2009 2010 Annual Growth Rates (%) Taux de croissance annuel (%) All Item 3.0 2.3 0.5 1.5 2.3 5.9 5.8 -1.0 4.0 Ensemble Food 4.9 4.1 0.8 3.6 1.7 7.3 9.6 -3.0 9.6 Alimentation Health 2.4 8.4 1.9 1.3 17.3 1.8 0.0 2.9 -0.1 Santé Energy 4.2 4.8 3.1 3.1 13.3 12.6 3.6 -3.7 4.3 Energie Transport 5.7 -2.2 1.4 4.3 8.9 2.4 9.4 -1.4 3.6 Transport IV AGRICULTURAL PRODUCTION - PRODUCTION AGRICOLE 2002 2003 2004 2005 2006 2007 2008 2009 2010 Tons (Thousand) Tonnes (milliers) Groundnuts (Tons) 260 733 440 709 602 621 703 373 460 481 331 195 731 210 1032 651 ... Arachide (Tonnes) Millet (Tons) 414 820 628 426 323 752 608 551 494 345 318 822 678 171 810 121 ... Mil (tonnes) Cassava (Tons) 106 960 181 721 401 448 281 487 120 841 308 312 920 866 265 533 ... Manioc (tonnes) Rice (Tons) 172 395 231 805 232 692 289 424 212 377 193 379 408 840 391 271 ... Riz (tonnes) Maize (Tons) 80 372 421 954 400 555 399 958 181 585 158 266 411 499 290 283 ... Maïs (tonnes) V MINING PRODUCTION - PRODUCTION MINIERE 282 2002 2003 2004 2005 2006 2007 2008 2009 2010 Phosphate, Tons (thousands) 1 549.1 1 499.6 1 576.0 1 451.0 584.0 691.3 644.8 948.6 976.2 Phosphate (Milliers de tonnes) Sea salt iodizes, Tons (thousands) 171.5 235.1 167.9 133.9 198.6 212.4 240.6 222.5 231.4 Sel marin iodé (Milliers de tonnes) Attapulgite, Tons (thousands) 138.4 157.1 160.4 126.6 139.6 138.3 166.9 180.9 204.3 Attapulgite (Milliers de tonnes) VI ENERGY - ENERGIE 2002 2003 2004 2005 2006 2007 2008 2009 2010 Electricity - total hydro production, Électricité - production hydraulique 194.0 337.0 293.0 267.0 234.0 181.0 229.0 238.1 ... kilowatt hours (millions) totale, kilowatt-heures (millions) Electricity - total thermal production, Électricité - production thermique 1 528.0 1 489.0 1 658.2 1 902.3 1 957.8 2 125.0 2 172.0 2 255.7 ... kilowatt hours (millions) totale, kilowatt-heures (millions) Electricity - total production, self- Electricité - Production totale privée 0 0 1 1 0 0 1 1 ... producer (Million Kilowatt Hours) (million de kilowatt heures) Electricity - total production, public Electricité - Production totale 1 722 1 826 1 951 2 169 2 192 2 306 2 401 2 494 ... (Million Kilowatt Hours) publique (million de kilowatt heures) African Statistical Yearbook 2011 / Annuaire Statistique pour l'Afrique 2011
  • 284.
    Senegal Sénégal VII TOURISM AND INFRASTRUCTURE - TOURISME ET INFRASTUCTURE 2002 2003 2004 2005 2006 2007 2008 2009 2010 Arrivals - Tourists (thousands) 426.825 353.539 363.49 386.565 405.826 386.793 402.82821 458.912 ... Arrivées - touristes (milliers) Rooms in hotels and similar Chambres d'hotels et établissements establishments (thousands) assimilés (milliers) 9.905 10.268 10.884 15.842 15.842 15.842 ... ... ... Paved Road (% of total) 15 15 16 16 16 16 16 ... ... Routes asphaltées (% du total) Total Network (Railways-km) 30 174 30 280 30 388 30 451 30 516 30 580 30 645 ... ... Réseau total voies ferrées-Km Main Telephone Lines (per 1,000 Lignes téléphoniques fixes (pour 22 22 24 26 27 26 23 ... ... inhabitants) 1000 habitants) Mobile Cellular Subscribers (per Abonnés aux téléphones mobiles 55 76 109 168 289 400 519 ... ... 1,000 inhabitants) (pour 1000 habitants) VII FINANCIAL AND MONETARY STATISTICS - FINANCES ET STATISTIQUES MONETAIRES 2002 2003 2004 2005 2006 2007 2008 2009 2010 VII-1 Monetary Statistics VII-1 Statistiques monétaires CFA Franc (Millions) Franc CFA (Millions) Money supply (M1) 563 945 832 156 887 940 962 730 1 098 680 1 266 570 1 252 720 1 366 890 1 504 140 Masse monétaire (M1) Quasi-money 406 383 444 081 544 410 586 569 643 993 703 531 753 459 867 492 964 844 Quasi-monnaie of which Demand Deposit ... ... ... ... ... ... ... ... ... dont Monnaie scripturale Net foreign assets 324 612 578 077 707 031 692 753 843 224 892 270 775 051 896 442 972 696 Avoirs extérieurs nets Domestic credit 792 241 848 795 879 733 1 001 980 1 116 940 1 323 440 1 467 720 1 606 810 1 762 470 Crédit intérieur of which claims on private sector 687 588 784 556 854 653 1 036 260 1 110 020 1 230 250 1 439 550 1 491 990 1 599 330 dont créances sur le secteur privé of which Claims on government dont créances nettes sur le 104 653 64 239 25 080 - 34 282 6 920 93 182 28 167 114 819 163 136 sector, net gouvernement International reserves (millions of US Réserves internationales (millions de 637 1 111 1 386 1 191 1 334 1 660 1 602 2 123 1 945 $) $ EU) Average Exchange Rate (National Taux de change (moyen) (monnaie 696.99 581.20 528.29 527.47 522.89 479.27 447.81 472.19 495.28 Currency per us $) nationale par dollars) VII-2 Public Finance VII-2 Finances publiques CFA Franc (Millions) Franc CFA (Millions) Total Revenues and Grants 726 700 797 753 864 800 955 800 1 036 040 1 231 339 1 291 750 1 322 400 1 392 000 Recettes totales et dons Tax Revenue 629 200 676 973 738 500 850 800 921 900 1 041 400 1 087 150 1 123 400 1 242 000 Recettes fiscales Non Tax Revenue 35 400 43 080 38 300 29 400 40 740 58 600 64 900 37 000 43 000 Recettes non fiscales Grants 62 100 77 700 88 000 75 600 73 400 131 339 139 700 162 000 107 000 Dons 283 Total Expenditures and Net Lending 754 100 868 000 976 500 1 100 600 1 327 993 1 435 608 1 578 520 1 591 700 1 704 000 Dépenses totales et prêts nets Current expenditure 478 200 529 500 553 900 629 000 825 953 864 940 978 720 956 700 989 000 Dépenses courantes Of which Wages and Salaries 199 400 203 700 217 600 254 900 286 150 328 600 347 500 370 000 397 000 Dont rémunérations et salaires Capital expenditure 275 900 338 500 410 300 454 700 474 940 565 268 594 700 633 000 713 000 Dépenses d'équipement Net Lending - 5 600 - 6 800 12 300 16 900 27 100 5 400 5 100 2 000 2 000 Prêts nets Fiscal Balance - 27 400 - 70 247 - 111 700 - 144 800 - 291 953 - 204 269 - 286 770 - 269 300 - 312 000 Solde global y compris les dons VII-3 Balance of Payments VII-3 Balance des paiements CFA Franc (Millions) Franc CFA (Millions) Trade balance - 374 553 - 469 926 - 521 047 - 691 306 - 836 466 -1 193 338 -1 234 304 -1 159 307 ... Balance commerciale Services Balance - 19 225 - 13 016 - 14 789 - 16 258 - 18 501 - 18 072 - 54 087 - 38 815 ... Balance des services Net Income - 90 595 - 79 132 - 69 044 - 47 230 - 33 171 - 35 388 - 21 416 - 24 544 ... Revenus nets Current transfers, net total 256 927 264 129 333 909 397 575 437 466 618 022 754 355 714 052 ... Transferts courants Current account balance - 227 446 - 297 945 - 270 971 - 357 219 - 450 672 - 628 776 - 555 452 - 508 613 ... Solde du compte courant VII-4 External Debt and Financial Flows VII-4 Dette extérieure et flux financiers US $ (Millions) $ E.U (Millions) Total external debt 2 294 900 2 024 700 1 864 600 1 944 100 864 370 968 472 1 171 650 1 283 900 ... Dette extérieure totale Private ... ... ... ... ... ... ... ... ... Privée Public 2 294 900 2 024 700 1 864 600 1 944 100 864 370 968 472 1 171 650 1 283 900 ... Publique Total external debt service 95 700 92 000 67 450 48 607 51 520 40 350 39 740 47 700 ... Service de la dette extérieure Net Foreign Direct Investment Investissements étranger direct (flux 65 303 70 700 86 400 96 019 183 607 187 544 151 900 145 800 ... Inflows nets entrants) Net Total Official Development Aide publique au développement 163 577 161 995 145 736 253 600 421 640 244 333 418 679 736 285 ... assistance (nette totale) African Statistical Yearbook 2011 / Annuaire Statistique pour l'Afrique 2011
  • 285.
    Senegal Sénégal 2002 2003 2004 2005 2006 2007 2008 2009 2010 CFA Franc (Millions) Franc CFA Exports, fob Exportations, fàb Exports - Total 743 357 730 549 797 447 832 440 833 471 802 211 987 862 837 793 ... Exportations - Total Main Products Principaux produits Phosphoric acid 119 150 80 286 94 602 97 961 40 327 46 959 106 905 69 815 98 481 Acide phosphoriques Gas oil ... 54 806 61 967 50 933 60 167 88 426 125 280 79 062 ... Gaz oil Jet fuel ... 24 696 26 859 42 641 100 863 27 983 150 040 102 643 ... Carburéacteur Frozen and fresh fish 6 738 466 42 389 43 747 39 002 38 740 33 772 40 131 ... Autres poissons frais/réfrigérés Huiles d'arachide brutes & ses Groundnut oil, crude 41 954 23 005 13 700 15 677 27 843 32 353 7 889 18 141 28 441 fractions Main Destinations Principales destinations Mali 58 211.5 56 923.5 83 070.8 117 274.1 137 132.0 159 965.8 213 119.0 171 465.0 249 171.0 Mali India 137 559.2 85 640.6 96 559.3 99 945.2 41 351.2 49 699.3 121 151.7 73 157.7 103 789.0 Inde France 84 096.6 72 813.8 66 080.6 69 401.8 60 936.5 70 878.3 56 739.4 51 666.0 48 667.0 France Italy 71 308.0 58 412.5 48 816.7 41 515.1 37 024.5 37 562.4 17 076.9 24 485.0 23 224.0 Italie Spain 36 089.7 50 419.7 44 520.7 46 249.9 38 980.5 37 081.5 21 627.5 20 728.0 28 909.0 Espagne 2002 2003 2004 2005 2006 2007 2008 2009 2010 Imports, cif Importations, cif 284 Imports - Total 1 257 167 1 354 827 1 488 007 1 723 837 1 890 992 2 264 100 2 842 500 2 314 046 ... Importations - Total (millions) Principaux produits Main Products Petroleum oils,crude 128 565 163 749 178 021 203 433 85 777 193 249 343 253 186 706 224 363 Huiles brutes de petrole Broken rice 119 841 117 710 114 970 132 428 121 289 168 322 199 466 163 792 130 844 Brisures de riz Gas oil ... 32 359 30 527 45 285 131 997 130 025 55 682 59 711 ... Gaz oil Autres médicaments pour la vente Medicaments for retail sale, nes 38 635 37 736 44 600 44 285 48 224 53 426 54 090 55 687 ... au détail Wheat & meslin, nes 32 320 30 658 41 378 35 818 41 145 61 889 70 444 52 600 ... Autres blés & méteil Main Origin Principales provenances France 353 202.6 343 283.1 373 157.8 387 225.8 448 864.3 498 941.7 455 502.7 425 500.0 441 412.0 France Nigeria 118 620.5 166 917.4 178 785.5 193 069.6 62 808.2 196 644.6 345 545.8 197 430.6 230 842.0 Nigeria Thailand 97 861.8 92 454.5 91 477.4 72 539.7 85 372.2 113 400.7 153 052.7 116 902.7 73 863.0 Thaïlande China, Rep. 32 361.9 37 671.9 51 660.1 64 548.2 80 218.7 128 247.2 165 260.6 191 989.0 195 142.0 Chine, Rép. Pop. Spain 57 594.5 65 915.5 62 421.5 62 643.6 72 099.5 68 289.9 73 839.1 92 255.0 85 074.0 Espagne African Statistical Yearbook 2011 / Annuaire Statistique pour l'Afrique 2011
  • 286.
    Seychelles Seychelles AREA (KM 2) 455 SUPERFICIE (KM 2) CAPITAL CITY Victoria Victoria CAPITALE CURRENCY Seychelles Rupee Rupee MONNAIE I SOCIAL AND DEMOGRAPHIC INDICATORS — INDICATEURS DEMOGRAPHIQUES ET SOCIAUX 2002 2003 2004 2005 2006 2007 2008 2009 2010 Population Population Population au milieu de l'année - Mid-year population - Total (Million) 0.1 0.1 0.1 0.1 0.1 0.1 0.1 0.1 0.1 Total (million) Population au milieu de l'année - Mid-year population - Urban (%) ... ... 53.0 53.0 54.0 54.0 55.0 54.8 ... Urbaine (%) Female (%) 49.6 49.6 49.7 49.7 49.7 49.7 49.7 49.7 ... Femme (%) Population by Age Group Population par groupe d'âge 0-14 ... ... 20 747 20 451 19 919 19 752 19 806 ... ... 0-14 15-64 ... ... 55 193 55 790 58 134 60 348 60 649 ... ... 15-64 65+ ... ... 6 534 6 611 6 979 6 856 6 843 ... ... 65+ Active Population (000) 37.0 37.0 38.0 38.0 38.0 38.0 39.0 39.0 ... Population active (000) Female (%) 45.9 48.6 47.4 47.4 47.4 47.4 46.2 48.7 ... Femme (%) Taux brut de natalité - Total (par Crude birth rate - Total (per 1000) 18.0 18.0 17.0 19.0 17.0 18.0 ... ... ... 1000) Taux brut de mortalité - Total (par Crude death rate - Total (per 1000) 8.0 8.0 7.0 8.0 8.0 7.0 ... ... ... 1000) Life expectancy at birth - Total Espérance de vie à la naissance - 72.0 71.0 73.0 72.0 72.0 73.0 ... ... ... (years) Total (années) Net reproduction rate - (per Taux net de reproduction - (par ... ... ... ... ... ... ... ... ... woman) femme) Indice synthétique de fécondité - Total fertility rate - (p woman) y (per ) ... 2.0 2.0 2.0 2.0 2.0 ... ... ... (par femme) Education Enseignement Teaching staff at first level - Total Personnel enseignant - 1er degré - 0.69 0.7 0.7 0.7 ... 0.7 0.7 0.6 ... (thousands) Total (milliers) Teaching staff at second level - Total Personnel enseignant - 2ème degré - 0.54 0.6 0.6 0.6 ... 0.6 0.5 0.6 ... 285 (thousands) Total (milliers) Teaching staff at third level - Total Personnel enseignant - 3ème degré - ... ... ... ... ... ... ... ... ... (thousands) Total (milliers) First level student enrollment - Total Elèves inscrits - 1er degré - Total 10 9 9 9 ... 9 9 9 ... (thousands) (milliers) First level student enrollment - Elèves inscrits - 1er degré - Femmes 5 5 4 4 ... 4 4 4 ... Female (thousands) (milliers) Second level student enrollment - Elèves inscrits - 2ème degré - Total 8 8 7 8 ... 8 8 7 ... Total (thousands) (milliers) Second level student enrollment - Elèves inscrits - 2ème degré - 4 4 4 4 ... 4 4 4 ... Female (thousands) Femmes (milliers) Third level student enrollment - Total Elèves inscrits - 3ème degré - Total ... ... ... ... ... ... ... ... ... (thousands) (milliers) Third level student enrollment - Elèves inscrits - 3ème degré - ... ... ... ... ... ... ... ... ... Female (thousands) Femmes (milliers) Public expenditure on education (% Dépenses publiques consacrées à ... ... ... ... 12.6 ... ... ... ... of budget) l'enseignement (% du budget) Health Santé Hospital beds - Total (per 10 000 Nombre de lits d'hôpitaux - Total 527 499 490 ... 570 478 ... ... ... population) (pour 10 000) Nurses - Total (per 10 000 Nombre d'infirmières - Total (pour 456 502 497 456 481 475 ... ... ... population) 10 000) Physicians - Total (per 10 000 Nombre de médecins - Total (pour 165 146 126 133 105 124 ... ... ... population) 10 000) Public expenditure on Health (% of Dépenses publiques consacrées à la 7 10 11 10 9 ... ... ... ... budget) santé (% du budget) African Statistical Yearbook 2011 / Annuaire Statistique pour l'Afrique 2011
  • 287.
    Seychelles Seychelles II NATIONAL ACCOUNTS — COMPTES NATIONAUX 2002 2003 2004 2005 2006 2007 2008 2009 2010 Gross domestic product by kind of economic activity at current prices Produit intérieur brut par branche d'activité économique aux prix courants Seychelles Rupee (Millions) Rupee (Millions) Agriculture 110 101 156 160 162 185 219 250 ... Agriculture Mining and quarrying ... ... ... ... ... ... ... ... ... Industries extractives Manufacturing 698 623 355 444 510 658 750 849 ... Industries manufacturières Electricity, gas & water 101 99 99 76 104 90 93 144 ... Electricité, gaz et eau Construction 384 343 230 311 305 361 486 569 ... Bâtiments et travaux publics Wholesale & retail trade, Commerce de gros et de détail, 870 830 726 775 914 1 523 2 263 2 955 ... restaurants, hotels restaurants et hôtels Banques, assurances, affaires Finance, insurance, real estate, etc. 417 413 797 845 1 010 1 187 1 511 2 139 ... immobilières Transport and communications 575 602 540 692 812 906 1 055 1 213 ... Transport(s) et communications Administrations publiques et Public administration and defense 370 387 539 540 646 736 799 863 ... défense Other services 397 412 408 443 441 492 542 549 ... Autres services Moins Services d’intermédiation Less Imputed Service Charges - 192 - 206 - 163 - 175 - 202 - 281 - 321 - 478 ... financière Gross domestic product at factor Produit intérieur brut aux couts des 3 731 3 602 3 688 4 111 4 701 5 857 7 398 9 053 ... cost / basic prices facteurs / prix de base Plus: Indirect Taxes / taxes on Plus taxes indirectes/impôts sur les 305 394 1 066 994 899 966 1 311 1 673 ... products, less subsidies produits, moins les subventions Expenditure on Gross domestic product at current purchaser's values Emploi du produit intérieur brut aux prix courants d'acquisition Seychelles Rupee (Millions) Rupee (Millions) Consommation finale des Government final consumption 896 1 045 1 950 2 068 2 189 2 858 1 176 1 429 1 058 administrations publiques Private final consumption 1 910 1 960 2 125 2 278 2 653 3 151 7 958 9 115 8 365 Consommation finale privée Gross fixed capital formation 1 740 703 872 1 668 1 500 1 984 3 493 3 140 5 092 Formation brute de capital fixe Increase in inventories - 272 117 ... ... ... ... ... ... ... Variation des stocks Exports of goods and services 3 014 3 330 3 452 3 958 4 733 5 851 9 390 11 089 10 255 Exportations de biens et services 286 Moins importations de biens et Less imports of goods and services 3 252 3 158 3 644 4 867 5 475 7 021 13 308 14 046 14 018 services GDP at purchasers' values 4 036 3 997 4 754 5 105 5 600 6 824 8 709 10 726 10 752 PIB aux prix d'acquisition Gross domestic product by kind of economic activity at constant Produit intérieur brut par branche d'activité economique aux prix constants prices Annual Growth Rates (%) Taux de croissance annuel (%) Agriculture 1.2 -5.4 -4.7 5.6 -4.8 0.5 4.8 -17.7 ... Agriculture Mining and quarrying ... ... ... ... ... ... ... ... ... Industries extractives Manufacturing 1.2 -4.1 -8.0 11.6 3.2 3.1 -12.3 -11.1 ... Industries manufacturières Electricity, gas & water 1.2 10.4 5.6 4.0 5.0 6.5 0.4 3.1 ... Electricité, gaz et eau Construction 1.2 -3.2 -17.2 32.7 15.8 10.0 11.4 -4.9 ... Bâtiments et travaux publics Wholesale & retail trade, Commerce de gros et de 4.5 -4.3 -8.2 2.7 13.3 20.5 -10.6 3.3 ... restaurants, hotels détail,restaurants et hôtels Banques, assurances, affaires Finance, insurance, real estate, etc. 1.2 -10.1 1.6 5.9 13.7 12.1 1.8 14.2 ... immobilières Transport and communications 1.2 -9.1 -7.9 7.1 7.6 6.0 10.2 5.0 ... Transport(s) et communications Administrations publiques et Public administartion and defense 1.2 0.6 -7.5 0.8 14.8 5.0 1.7 -8.8 ... défense Other services -3.9 -10.5 -15.9 5.8 3.5 1.8 -5.7 -0.5 ... Autres services Moins Services d’intérmediation Less Imputed Service Charges 1.2 -19.8 -3.2 2.9 15.3 15.0 -10.6 17.6 ... financière Gross domestic product at factor Produit intérieur brut aux couts des 1.2 -5.4 -7.3 6.8 9.6 9.0 -0.3 0.9 ... cost / basic prices facteurs / prix de base Plus: Indirect Taxes / taxes on Plus taxes indirectes/impôts sur les 1.2 -9.5 29.4 6.5 8.9 12.6 -5.9 -0.6 ... products, less subsidies produits, moins les subventions Gross domestic product at market Produit intérieur brut aux prix du 1.2 -5.9 -2.8 6.7 9.5 9.6 -1.3 0.7 ... prices marché Break in the serie from 2004 Rupture de la série à partir 2004 African Statistical Yearbook 2011 / Annuaire Statistique pour l'Afrique 2011
  • 288.
    Seychelles Seychelles Expenditure on Gross domestic product at constant purchasers' Emplois du produit intérieur brut aux prix constants d'acquisition values Annual Growth Rates (%) Taux de croissance annuel (%) Consommation finale des Government final consumption -3.2 12.1 11.8 0.4 -14.3 11.3 -45.2 21.4 5.8 administrations publiques Private final consumption -0.1 -16.3 -8.0 14.6 38.1 -0.7 2.7 13.9 -61.8 Consommation finale privée Gross fixed capital formation -34.0 -59.6 24.0 91.4 6.6 32.3 76.1 -10.1 62.2 Formation brute de capital fixe Exports of goods and services 0.8 10.5 3.7 14.7 41.8 23.6 60.5 18.1 -7.5 Exportations de biens et services Moins importations de biens et Less imports of goods and services -14.9 -2.9 15.4 33.5 33.4 23.6 60.5 18.1 -7.5 services III INFLATION 2002 2003 2004 2005 2006 2007 2008 2009 2010 Annual Growth Rates (%) Taux de croissance annuel (%) All Item 0.2 3.6 4.1 0.6 -1.9 5.3 37.0 31.7 -2.4 Ensemble Food ... 2.2 1.9 0.3 1.6 8.5 30.9 41.6 -5.8 Alimentation Health ... 4.1 4.7 1.9 4.0 10.9 15.6 13.6 0.4 Santé Energy ... 2.1 1.3 0.7 -0.7 0.4 58.6 11.9 3.2 Energie Transport ... 5.4 3.0 1.0 1.1 9.4 44.0 32.8 7.2 Transport IV AGRICULTURAL PRODUCTION - PRODUCTION AGRICOLE 2002 2003 2004 2005 2006 2007 2008 2009 2010 Tons (Thousand) Tonnes (milliers) Coconuts, Tons (thousands) 3 3 3 3 3 2 1 ... ... Noix de coco, tonnes (milliers) Banana, Tons (thousands) 2 2 2 2 2 2 2 ... ... Banane, tonnes (milliers) Tea, Tons (thousands) 0 0 0 0 0 0 0 ... ... Thé, tonnes (milliers) Tomato, Tons (thousands) 0 0 0 0 0 0 0 ... ... Tomates, tonnes (milliers) Pineapple, Tons (thousands) 0 0 0 0 0 0 0 ... ... Ananas, tonnes (milliers) V MINING PRODUCTION - PRODUCTION MINIERE 287 2002 2003 2004 2005 2006 2007 2008 2009 2010 ... ... ... ... ... ... ... ... ... ... ... ... ... ... ... ... ... ... ... ... ... ... ... ... ... ... ... VI ENERGY - ENERGIE 2002 2003 2004 2005 2006 2007 2008 2009 2010 Electricity - total hydro production, Électricité - production hydraulique ... ... ... ... ... ... ... ... ... kilowatt hours (millions) totale, kilowatt-heures (millions) Electricity - total thermal production, Électricité - production thermique 218.8 223.8 226.0 231.0 252.0 270.6 ... ... ... kilowatt hours (millions) totale, kilowatt-heures (millions) Electricity - total production, self- Electricité - Production totale privée ... ... ... ... ... ... ... ... ... producer (Million Kilowatt Hours) (million de kilowatt heures) Electricity - total production, public Electricité - Production totale 219 224 226 231 252 271 ... ... ... (Million Kilowatt Hours) publique (million de kilowatt heures) African Statistical Yearbook 2011 / Annuaire Statistique pour l'Afrique 2011
  • 289.
    Seychelles Seychelles VII TOURISM AND INFRASTRUCTURE - TOURISME ET INFRASTUCTURE 2002 2003 2004 2005 2006 2007 2008 2009 2010 Arrivals - Tourists (thousands) 132 122 121 129 141 161 159 ... ... Arrivées - touristes (milliers) Rooms in hotels and similar Chambres d'hotels et établissements establishments (thousands) 2 2 2 ... ... ... ... ... ... assimilés (milliers) Paved Road (% of total) ... 96 ... ... ... ... ... ... ... Routes asphaltées (% du total) Total Network (Railways-km) ... ... ... ... ... ... ... ... ... Réseau total voies ferrées-Km Main Telephone Lines (per 1,000 Lignes téléphoniques fixes (pour 260 260 260 260 250 270 270 260 ... inhabitants) 1000 habitants) Mobile Cellular Subscribers (per Abonnés aux téléphones mobiles 550 600 660 710 850 930 1 120 1 100 ... 1,000 inhabitants) (pour 1000 habitants) VII FINANCIAL AND MONETARY STATISTICS - FINANCES ET STATISTIQUES MONETAIRES 2002 2003 2004 2005 2006 2007 2008 2009 2010 VII-1 Monetary Statistics VII-1 Statistiques monétaires Seychelles Rupee (Millions) Rupee (Millions) Money supply (M1) 2 243 2 522 2 226 2 466 2 653 3 267 4 725 4 784 5 355 Masse monétaire (M1) Quasi-money 1 764 1 699 2 586 2 426 2 387 1 372 1 211 1 617 1 921 Quasi-monnaie of which Demand Deposit ... ... ... ... ... ... ... ... ... dont Monnaie scripturale Net foreign assets - 724 - 520 - 416 - 277 530 421 2 094 2 751 3 489 Avoirs extérieurs nets Domestic credit 4 937 5 172 5 101 5 191 4 799 5 282 6 037 4 966 5 832 Crédit intérieur of which claims on private sector 777 997 1 168 1 257 1 277 1 717 2 550 2 315 2 861 dont créances sur le secteur privé of which Claims on government dont créances nettes sur le 4 154 4 074 3 748 3 636 3 228 3 178 2 931 2 235 2 630 sector, net gouvernement International reserves (millions of US Réserves internationales (millions de 70 67 35 56 113 41 64 191 236 $) $ EU) Average Exchange Rate (National Taux de change (moyen) (monnaie 5.48 5.40 5.50 5.50 5.52 6.70 9.46 13.61 12.07 Currency per us $) nationale par dollars) VII-2 Public Finance VII-2 Finances publiques Seychelles Rupee (Millions) Rupee (Millions) Total Revenues and Grants 1 478 1 868 1 891 2 168 2 476 2 213 3 190 4 165 4 179 Recettes totales et dons Tax Revenue 1 049 1 292 1 382 1 567 1 371 1 636 2 457 3 318 3 527 Recettes fiscales Non Tax Revenue 424 564 504 550 1 033 560 412 474 482 Recettes non fiscales 288 Grants 5 11 5 50 73 17 321 373 170 Dons Total Expenditures and Net Lending 2 121 1 597 1 789 1 816 2 302 2 810 3 483 3 622 3 878 Dépenses totales et prêts nets Current expenditure 1 721 1 511 1 612 1 560 1 900 2 497 2 504 3 329 3 315 Dépenses courantes Of which Wages and Salaries 675 685 704 663 760 700 688 766 694 Dont rémunérations et salaires Capital expenditure 358 86 177 254 404 376 183 608 948 Dépenses d'équipement Net Lending 43 1 0 2 - 2 - 63 796 - 315 - 385 Prêts nets Fiscal Balance - 643 270 102 352 174 - 597 - 293 543 301 Solde global y compris les dons VII-3 Balance of Payments VII-3 Balance des paiements US $ (Millions) $ E.U(Millions) Trade balance - 143 - 89 - 155 - 299 - 290 - 426 - 507 - 321 - 336 Balance commerciale Services Balance 98 121 120 134 156 168 95 93 68 Balance des services Net Income - 68 - 43 - 34 - 40 - 44 - 68 - 94 - 101 - 85 Revenus nets Current transfers, net total 14 13 18 31 44 30 57 41 10 Transferts courants Current account balance - 99 2 - 50 - 174 - 134 - 296 - 449 - 288 - 342 Solde du compte courant VII-4 External Debt and Financial Flows VII-4 Dette extérieure et flux financiers US $ (Millions) $ E.U (Millions) Total external debt 557 484 460 486 521 710 759 729 492 Dette extérieure totale Private 280 238 183 162 295 454 467 496 264 Privée Public 277 246 277 324 226 256 292 233 229 Publique Total external debt service 100 56 144 45 119 94 67 116 72 Service de la dette extérieure Net Foreign Direct Investment Investissements étranger direct (flux 48 58 38 86 146 239 252 243 ... Inflows nets entrants) Net Total Official Development Aide publique au développement 8 10 10 15 14 9 13 23 ... assistance (nette totale) African Statistical Yearbook 2011 / Annuaire Statistique pour l'Afrique 2011
  • 290.
    Seychelles Seychelles 2002 2003 2004 2005 2006 2007 2008 2009 2010 US $ (Millions) Rupee Exports, fob Exportations, fàb Exports - Total 237 286 301 351 420 395 502 ... ... Exportations - Total Main Products Principaux produits Canned tuna 154 189 168 176 187 184 ... ... ... Thon en conserve Crustaceans 2 8 8 6 8 2 ... ... ... Crustacés Frozen and fresh fish 3 5 2 3 3 2 ... ... ... Poissons frais et congelés Shark Fins (Dried) ... 5 2 2 1 1 ... ... ... Requin Fins (Séché) Cinnamon bark 0 0 0 0 0 0 ... ... ... Écorce de cannelle Main Destinations Principales destinations United Kingdom 96.4 88.0 107.9 104.8 97.1 86.5 92.4 100.6 ... Royaume-Uni France 67.8 74.3 71.7 51.0 62.9 69.0 78.4 71.8 ... France Spain 22.3 19.9 50.8 93.6 31.7 19.3 15.6 19.4 ... Espagne Italy 28.6 47.3 30.5 34.5 45.6 21.1 32.7 38.4 ... Italie Japan 22.0 17.6 34.6 45.2 33.3 30.9 33.2 28.8 ... Japon 2002 2003 2004 2005 2006 2007 2008 2009 2010 Imports, cif Importations, cif Imports - Total 415 414 552 764 842 1 048 1 379 940 ... Importations - Total (millions) 289 Principaux produits Main Products Petroleum oils&oils obtained from Huiles de pétrole, bitumineux, bituminous minerals,o/than crude 5 20 17 180 161 136 100 13 ... distilles, sauf brut etc Tankers ... 0 ... ... ... 58 63 16 ... Tankers Skipjack or stripe-bellid bonito,frozen Listaos ou bonites à ventre rayé, 22 30 31 34 42 46 62 37 ... congelés ex headg n ° 03.04, foies ex headg No 03.04,livers&roes et laitances Tunas, yellowfin, frozen excluding Thons, albacore, congelés à 13 24 26 16 18 35 56 29 ... l'exclusion du n ° 03.04, foies et heading No 03.04, livers and roes laitances Floating docks and vessels which Docks flottants et les navires qui 0 ... ... ... 0 0 37 1 ... perform special functions effectuent des fonctions spéciales Main Origin Principales provenances Spain 33.3 53.0 67.2 96.7 61.2 70.0 96.8 68.1 ... Espagne France 41.9 59.3 50.9 46.6 57.7 77.8 122.9 56.3 ... France Singapore 24.1 26.6 35.2 48.1 54.4 52.9 152.1 45.6 ... Singapour South Africa 33.7 38.6 34.5 93.3 70.9 57.7 57.4 58.4 ... Afrique du Sud Saudi Arabia ... 9.7 ... 144.0 105.2 66.2 ... ... ... Arabie Saoudite African Statistical Yearbook 2011 / Annuaire Statistique pour l'Afrique 2011
  • 291.
    Sierra Leone Sierra Leone AREA (KM 2) 71 740 SUPERFICIE (KM 2) CAPITAL CITY Freetown Freetown CAPITALE CURRENCY Leone Leone MONNAIE I SOCIAL AND DEMOGRAPHIC INDICATORS — INDICATEURS DEMOGRAPHIQUES ET SOCIAUX 2002 2003 2004 2005 2006 2007 2008 2009 2010 Population Population Population au milieu de l'année - Mid-year population - Total (Million) 4.5 4.7 5.0 5.1 5.2 5.3 5.5 5.6 5.7 Total (million) Population au milieu de l'année - Mid-year population - Urban (%) ... ... 37.0 37.0 38.0 38.0 38.0 38.0 ... Urbaine (%) Female (%) 51.5 51.5 51.5 51.4 51.4 51.4 51.3 51.3 51.3 Femme (%) Population by Age Group Population par groupe d'âge 0-14 1916 115 2004 992 2095 649 2181 951 2261 673 2335 764 2405 126 2471 840 ... 0-14 15-64 2529 550 2631 818 2733 260 2826 604 2909 240 2983 206 3051 635 3119 685 ... 15-64 65+ 94 656 95 718 97 013 98 422 99 887 101 430 103 091 104 946 ... 65+ Active Population (000) 1 733.0 1 801.0 1 870.0 1 934.0 1 991.0 2 046.0 2 096.0 2 146.0 ... Population active (000) Female (%) 50.7 50.8 51.0 51.1 51.3 50.9 51.0 51.1 ... Femme (%) Taux brut de natalité - Total (par Crude birth rate - Total (per 1000) 42.1 41.8 48.2 41.3 41.0 40.7 31.5 39.9 ... 1000) Taux brut de mortalité - Total (par Crude death rate - Total (per 1000) 19.4 18.5 17.7 17.1 16.6 16.1 15.8 15.4 ... 1000) Life expectancy at birth - Total Espérance de vie à la naissance - 44.0 44.9 48.4 46.4 46.9 47.3 47.6 47.9 ... (years) Total (années) Net reproduction rate - (per Taux net de reproduction - (par ... ... ... 2.0 ... ... ... ... ... woman) femme) Indice synthétique de fécondité - Total fertility rate - (p woman) y (per ) 5.3 5.3 6.1 5.3 5.3 5.2 5.1 5.2 ... (par femme) Education Enseignement Teaching staff at first level - Total Personnel enseignant - 1er degré - ... ... ... ... ... ... ... ... ... (thousands) Total (milliers) Teaching staff at second level - Total Personnel enseignant - 2ème degré - 290 ... ... ... ... ... ... ... ... ... (thousands) Total (milliers) Teaching staff at third level - Total Personnel enseignant - 3ème degré - ... ... ... ... ... ... ... ... ... (thousands) Total (milliers) First level student enrollment - Total Elèves inscrits - 1er degré - Total ... ... ... ... ... ... ... ... ... (thousands) (milliers) First level student enrollment - Elèves inscrits - 1er degré - Femmes ... ... ... ... ... ... ... ... ... Female (thousands) (milliers) Second level student enrollment - Elèves inscrits - 2ème degré - Total ... ... ... ... ... ... ... ... ... Total (thousands) (milliers) Second level student enrollment - Elèves inscrits - 2ème degré - ... ... ... ... ... ... ... ... ... Female (thousands) Femmes (milliers) Third level student enrollment - Total Elèves inscrits - 3ème degré - Total ... ... ... ... ... ... ... ... ... (thousands) (milliers) Third level student enrollment - Elèves inscrits - 3ème degré - ... ... ... ... ... ... ... ... ... Female (thousands) Femmes (milliers) Public expenditure on education (% Dépenses publiques consacrées à ... ... ... ... ... ... ... ... ... of budget) l'enseignement (% du budget) Health Santé Hospital beds - Total (per 10 000 Nombre de lits d'hôpitaux - Total ... ... 34 2 2 2 2 2 2 population) (pour 10 000) Nurses - Total (per 10 000 Nombre d'infirmières - Total (pour ... 1 1 0 0 1 1 1 1 population) 10 000) Physicians - Total (per 10 000 Nombre de médecins - Total (pour ... 0 0 0 0 0 0 0 0 population) 10 000) Public expenditure on Health (% of Dépenses publiques consacrées à la 8 8 8 8 8 ... ... ... ... budget) santé (% du budget) African Statistical Yearbook 2011 / Annuaire Statistique pour l'Afrique 2011
  • 292.
    Sierra Leone Sierra Leone II NATIONAL ACCOUNTS — COMPTES NATIONAUX 2002 2003 2004 2005 2006 2007 2008 2009 2010 Gross domestic product by kind of economic activity at current prices Produit intérieur brut par branche d'activité économique aux prix courants Leone (Millions) Leone(Millions) Agriculture 1 121 145 1 414 479 1 737 176 2 135 323 2 488 576 3 240 402 3 721 762 4 306 282 ... Agriculture Mining and quarrying 122 079 220 501 254 128 227 392 190 144 233 442 171 161 132 382 ... Industries extractives Manufacturing 76 994 79 224 85 206 95 624 107 908 114 586 128 082 122 316 ... Industries manufacturières Electricity, gas & water 17 177 23 804 19 046 14 829 15 949 15 999 16 917 19 948 ... Electricité, gaz et eau Construction 55 228 62 770 72 057 81 134 88 431 92 674 95 936 85 364 ... Bâtiments et travaux publics Wholesale & retail trade, Commerce de gros et de détail, 397 813 451 411 416 434 415 763 465 723 545 639 583 990 584 236 ... restaurants, hotels restaurants et hôtels Banques, assurances, affaires Finance, insurance, real estate, etc. 166 465 191 111 230 363 287 649 279 193 291 643 317 536 348 199 ... immobilières Transport and communications 159 141 217 898 261 670 299 202 345 198 349 866 424 827 475 009 ... Transport(s) et communications Administrations publiques et Public administration and defense 79 467 123 161 142 147 169 458 223 474 224 005 215 951 274 554 ... défense Other services 429 687 417 353 429 750 432 562 460 751 492 259 609 696 728 319 ... Autres services Moins Services d’intermédiation Less Imputed Service Charges - 24 057 - 33 125 - 22 124 - 65 009 - 71 068 - 78 157 - 105 210 - 126 328 ... financière Gross domestic product at factor Produit intérieur brut aux couts des 2 601 140 3 168 590 3 625 852 4 093 927 4 594 280 5 522 357 6 180 649 6 950 282 ... cost / basic prices facteurs / prix de base Plus: Indirect Taxes / taxes on Plus taxes indirectes/impôts sur les 150 394 180 183 205 527 213 642 280 799 302 727 357 365 420 503 ... products, less subsidies produits, moins les subventions Expenditure on Gross domestic product at current purchaser's values Emploi du produit intérieur brut aux prix courants d'acquisition Leone (Millions) Leone(Millions) Consommation finale des Government final consumption 265 072 335 156 446 189 691 070 761 710 756 086 941 478 1 103 894 ... administrations publiques Private final consumption 3 867 639 3 909 616 4 374 878 4 392 514 4 502 740 4 545 625 4 890 660 5 891 009 ... Consommation finale privée Gross fixed capital formation 190 589 230 182 263 749 355 994 360 225 355 296 428 359 504 900 ... Formation brute de capital fixe Increase in inventories - 681 042 - 1 656 - 235 718 - 211 639 258 805 1 418 448 1 537 383 942 083 ... Variation des stocks Exports of goods and services 298 782 483 337 665 034 870 592 918 614 1 009 612 1 082 595 1 059 017 ... Exportations de biens et services 291 Moins importations de biens et Less imports of goods and services 1 189 506 1 607 863 1 682 752 1 790 961 1 927 015 2 259 984 2 342 461 2 130 118 ... services GDP at purchasers' values 2 751 534 3 348 773 3 831 380 4 307 570 4 875 079 5 825 084 6 538 014 7 370 785 ... PIB aux prix d'acquisition Gross domestic product by kind of economic activity at constant Produit intérieur brut par branche d'activité economique aux prix constants prices Annual Growth Rates (%) Taux de croissance annuel (%) Agriculture 30.3 9.5 15.3 13.3 5.0 4.2 4.2 3.8 ... Agriculture Mining and quarrying 60.6 54.4 19.3 -4.8 -5.1 20.8 -32.5 -26.4 ... Industries extractives Manufacturing 14.0 -5.1 -1.2 4.4 12.7 2.1 1.2 -1.4 ... Industries manufacturières Electricity, gas & water 8.6 6.0 -23.7 -29.2 -3.1 -5.6 114.9 -6.0 ... Electricité, gaz et eau Construction 26.8 14.6 12.6 22.3 2.0 4.0 2.4 -2.6 ... Bâtiments et travaux publics Wholesale & retail trade, Commerce de gros et de 22.2 2.2 -12.6 1.3 14.1 16.0 3.7 4.3 ... restaurants, hotels détail,restaurants et hôtels Banques, assurances, affaires Finance, insurance, real estate, etc. 9.7 17.9 8.8 8.2 5.1 -7.5 8.5 -1.0 ... immobilières Transport and communications 13.3 44.3 -11.4 20.0 7.0 18.5 25.9 6.5 ... Transport(s) et communications Administrations publiques et Public administartion and defense -11.2 44.1 0.9 6.5 20.4 -10.2 -16.0 23.4 ... défense Other services 5.5 -6.9 10.4 1.2 5.7 2.4 14.3 7.6 ... Autres services Moins Services d’intérmediation Less Imputed Service Charges 32.3 46.4 -42.7 178.8 26.5 0.5 39.6 15.8 ... financière Gross domestic product at factor Produit intérieur brut aux couts des 20.9 11.1 7.7 7.9 6.0 6.0 4.0 3.2 ... cost / basic prices facteurs / prix de base Plus: Indirect Taxes / taxes on Plus taxes indirectes/impôts sur les -24.7 4.4 60.3 0.7 34.9 13.2 9.9 23.3 ... products, less subsidies produits, moins les subventions Gross domestic product at market Produit intérieur brut aux prix du 18.2 10.9 9.6 7.5 7.4 6.4 4.4 4.5 ... prices marché African Statistical Yearbook 2011 / Annuaire Statistique pour l'Afrique 2011
  • 293.
    Sierra Leone Sierra Leone Expenditure on Gross domestic product at constant purchasers' Emplois du produit intérieur brut aux prix constants d'acquisition values Annual Growth Rates (%) Taux de croissance annuel (%) Consommation finale des Government final consumption 23.3 15.2 27.5 48.1 4.6 -11.6 15.8 8.7 ... administrations publiques Private final consumption 4.5 -7.9 7.2 -4.0 -5.5 -7.5 0.1 11.7 ... Consommation finale privée Gross fixed capital formation 32.8 10.0 9.8 29.1 29.6 -35.0 12.1 9.3 ... Formation brute de capital fixe Exports of goods and services 40.7 47.4 31.8 25.2 0.1 -2.1 -0.3 -9.3 ... Exportations de biens et services Moins importations de biens et Less imports of goods and services 13.4 23.1 0.3 1.8 2.1 4.4 -3.6 -15.7 ... services III INFLATION 2002 2003 2004 2005 2006 2007 2008 2009 2010 Annual Growth Rates (%) Taux de croissance annuel (%) All Item -3.2 7.6 14.2 12.0 9.7 11.6 14.6 6.4 16.5 Ensemble Food ... ... ... 9.3 7.8 13.6 23.4 6.2 8.6 Alimentation Health ... ... ... 12.6 9.2 16.6 4.7 9.0 35.4 Santé Energy ... ... ... 18.8 14.0 9.6 17.7 7.8 16.9 Energie Transport ... ... ... 15.0 15.2 7.0 11.9 -2.1 18.6 Transport IV AGRICULTURAL PRODUCTION - PRODUCTION AGRICOLE 2002 2003 2004 2005 2006 2007 2008 2009 2010 Tons (Thousand) Tonnes (milliers) Cocoa, metric tons (thousands) 1 178 2 733 6 188 6 635 13 940 13 722 17 892 18 807 21 349 Cacao, tonnes (milliers) Coffe, metric tons (thousands) 113 118 1 532 1 475 2 483 1 958 1 958 2 078 2 138 Café, tonnes (milliers) Oilpalm Fruit, metric tons 235 245 250 263 276 289 269 279 274 Huile de palme, tonnes (milliers) (thousands) Rice, Tons (thousands) 422 445 542 759 1 062 1 433 1 451 2 042 2 346 Riz, tonnes (milliers) Cassava, tons (thousands) 896 1 091 1 758 2 287 2 973 3 865 3 865 4 265 4 465 Manioc, tonnes (milliers) V MINING PRODUCTION - PRODUCTION MINIERE 292 2002 2003 2004 2005 2006 2007 2008 2009 2010 Diamond, carats (thousands) 351.7 506.8 691.8 668.7 582.3 604.7 330.9 400.4 525.5 Diamants, carats (milliers) Bauxite, metric tons (thousands) ... ... ... ... 1 071.1 1 169.0 954.4 742.8 905.1 Bauxite, tonnes métriques (milliers) Rutile, metric tons (thousands) ... ... ... ... 73 600.0 82 805.0 78 908.0 63 864.0 73 174.1 Rutile, tonnes métriques (milliers) VI ENERGY - ENERGIE 2002 2003 2004 2005 2006 2007 2008 2009 2010 Electricity - total hydro production, Électricité - production hydraulique 141.9 129.6 106.7 73.5 33.0 42.7 140.0 ... ... kilowatt hours (millions) totale, kilowatt-heures (millions) Electricity - total thermal production, Électricité - production thermique 140.7 127.6 102.9 64.8 37.0 42.0 ... ... ... kilowatt hours (millions) totale, kilowatt-heures (millions) Electricity - total production, self- Electricité - Production totale privée 31 30 30 27 27 27 ... ... ... producer (Million Kilowatt Hours) (million de kilowatt heures) Electricity - total production, public Electricité - Production totale 126 114 90 57 14 33 ... ... ... (Million Kilowatt Hours) publique (million de kilowatt heures) African Statistical Yearbook 2011 / Annuaire Statistique pour l'Afrique 2011
  • 294.
    Sierra Leone Sierra Leone VII TOURISM AND INFRASTRUCTURE - TOURISME ET INFRASTUCTURE 2002 2003 2004 2005 2006 2007 2008 2009 2010 Arrivals - Tourists (thousands) 28.463 37.201 43.56 40.023 33.704 32.223 35.67 36.775 38.5 Arrivées - touristes (milliers) Rooms in hotels and similar Chambres d'hotels et établissements establishments (thousands) 0.993 1.718 2.331 2.519 2.642 2.814 3.002 2.997 2.997 assimilés (milliers) Paved Road (% of total) 8 ... ... ... ... ... ... ... ... Routes asphaltées (% du total) Total Network (Railways-km) 0 0 0 0 0 0 0 0 0 Réseau total voies ferrées-Km Main Telephone Lines (per 1,000 Lignes téléphoniques fixes (pour 5 5 5 6 6 6 6 ... ... inhabitants) 1000 habitants) Mobile Cellular Subscribers (per Abonnés aux téléphones mobiles 15 24 23 22 21 143 181 ... ... 1,000 inhabitants) (pour 1000 habitants) VII FINANCIAL AND MONETARY STATISTICS - FINANCES ET STATISTIQUES MONETAIRES 2002 2003 2004 2005 2006 2007 2008 2009 2010 VII-1 Monetary Statistics VII-1 Statistiques monétaires Leone (Millions) Leone(Millions) Money supply (M1) 247 473 292 983 344 471 424 173 489 298 549 581 666 668 807 479 1 048 060 Masse monétaire (M1) Quasi-money 129 360 166 181 207 057 300 005 390 210 529 121 654 564 877 499 1 188 480 Quasi-monnaie of which Demand Deposit ... ... ... ... ... ... ... ... ... dont Monnaie scripturale Net foreign assets - 235 193 - 313 543 - 205 436 - 11 910 554 281 775 453 724 847 907 850 965 878 Avoirs extérieurs nets Domestic credit 795 999 880 836 875 977 875 433 978 977 37 656 428 627 689 067 1 398 040 Crédit intérieur of which claims on private sector 56 719 93 317 135 486 159 647 189 181 263 750 413 439 600 982 789 983 dont créances sur le secteur privé of which Claims on government dont créances nettes sur le 721 482 769 128 721 227 689 650 765 301 - 246 700 - 31 674 20 993 526 827 sector, net gouvernement International reserves (millions of US Réserves internationales (millions de 85 67 125 171 184 217 220 405 ... $) $ EU) Average Exchange Rate (National Taux de change (moyen) (monnaie 2 099.03 2 347.94 2 701.30 2 889.59 2 961.91 2 985.19 2 981.51 3 385.65 ... Currency per us $) nationale par dollars) VII-2 Public Finance VII-2 Finances publiques Leone (Millions) Leone(Millions) Total Revenues and Grants 378 282 467 000 616 342 810 199 842 195 776 156 1 073 981 1 250 547 1 360 200 Recettes totales et dons Tax Revenue 223 470 267 960 319 269 392 769 416 742 454 537 567 644 632 405 852 600 Recettes fiscales Non Tax Revenue 15 218 19 697 37 697 65 560 78 903 82 327 125 056 117 805 156 770 Recettes non fiscales Grants 139 594 179 343 259 376 351 870 346 550 239 292 381 281 500 337 350 830 Dons 293 Total Expenditures and Net Lending 562 268 597 997 688 092 828 303 915 457 835 454 1 240 907 1 452 247 1 686 335 Dépenses totales et prêts nets Current expenditure 474 828 485 367 555 046 620 728 699 201 658 765 909 558 999 969 1 137 548 Dépenses courantes Of which Wages and Salaries 142 769 160 091 178 751 229 440 271 531 296 509 356 210 401 536 472 439 Dont rémunérations et salaires Capital expenditure 85 766 112 313 134 523 203 993 214 557 173 764 333 274 452 278 548 787 Dépenses d'équipement Net Lending 1 674 317 - 1 477 3 582 1 699 2 925 - 1 925 ... ... Prêts nets Fiscal Balance - 183 986 - 130 997 - 71 750 - 18 104 - 73 262 - 59 298 - 166 926 - 201 700 - 326 135 Solde global y compris les dons VII-3 Balance of Payments VII-3 Balance des paiements Leone (Millions) Leone(Millions) Trade balance - 409 525 - 469 367 - 324 807 - 514 449 - 264 522 - 318 135 - 589 392 - 817 778 ... Balance commerciale Services Balance - 89 055 - 65 101 - 83 396 - 38 190 - 128 415 - 157 220 - 190 893 - 214 042 ... Balance des services Net Income - 6 001 - 35 254 - 181 069 - 147 113 - 117 470 - 311 282 - 222 954 - 132 107 ... Revenus nets Current transfers, net total 350 870 375 267 321 766 396 525 228 969 308 607 331 074 500 007 ... Transferts courants Current account balance - 153 711 - 194 455 - 267 506 - 303 227 - 281 438 - 478 029 - 672 166 - 663 920 ... Solde du compte courant VII-4 External Debt and Financial Flows VII-4 Dette extérieure et flux financiers US $ (Millions) $ E.U (Millions) Total external debt 1 573 1 679 1 882 1 781 1 583 555 647 744 ... Dette extérieure totale Private 123 135 153 271 256 262 273 271 ... Privée Public 1 450 1 544 1 729 1 510 1 327 293 374 473 ... Publique Total external debt service 39 24 38 40 33 21 13 4 ... Service de la dette extérieure Net Foreign Direct Investment Investissements étranger direct (flux 10 9 61 83 59 97 53 33 ... Inflows nets entrants) Net Total Official Development Aide publique au développement 383 337 376 340 338 545 367 437 ... assistance (nette totale) African Statistical Yearbook 2011 / Annuaire Statistique pour l'Afrique 2011
  • 295.
    Sierra Leone Sierra Leone 2002 2003 2004 2005 2006 2007 2008 2009 2010 Leone (Millions) Leone Exports, fob Exportations, fàb Exports - Total 125 605 260 129 416 200 530 618 775 658 862 346 815 532 915 269 ... Exportations - Total Main Products Principaux produits Diamond 87 390 180 007 341 352 409 526 362 181 423 943 293 651 267 509 ... Diamant Rutile ... ... ... ... 84 654 113 846 109 127 121 704 ... Rutile Coffee ... 97 146 2 511 3 230 5 539 4 419 42 727 ... Café Cocoa 577 5 852 14 451 15 077 34 408 33 926 44 807 66 385 ... Cacao Bauxite ... ... ... ... 69 952 97 597 83 647 64 258 ... Bauxite Main Destinations Principales destinations Belgium 94 548.2 220 642.6 339 724.9 410 853.0 354 620.5 436 257.7 291 015.4 ... ... Belgique France 78 283.4 101 756.6 67 302.4 40 049.6 59 754.0 101 826.2 96 328.2 ... ... France United States 8 590.1 15 776.9 29 899.6 28 672.2 129 994.1 174 698.0 168 149.9 ... ... Etats-Unis Germany 80 330.7 47 637.9 64 509.7 82 775.1 70 164.7 94 728.3 42 150.4 ... ... Allemagne India 3 245.3 18 817.3 8 269.8 9 767.6 5 970.9 10 952.3 149 813.9 ... ... Inde 2002 2003 2004 2005 2006 2007 2008 2009 2010 Imports, cif Importations, cif 294 Imports - Total 535 130 729 496 741 008 1 045 067 1 040 180 1 180 481 1 404 925 1 733 047 ... Importations - Total (millions) Principaux produits Main Products Fuels, lubricants, etc. 108 649 182 304 255 943 333 907 435 639 503 093 597 095 427 422 2 297 156 Carburants, lubrifiants, etc. Food and live animals 148 303 174 361 154 058 153 533 166 293 202 741 345 636 353 744 1 221 947 Alimentaire et animaux vivants Machines, transport equipments 105 340 132 087 138 268 207 698 204 517 224 160 225 184 323 038 1 184 597 Machines, équipements de transport Manufactured goods 75 549 96 713 86 376 117 473 143 990 154 872 169 474 224 850 810 659 Biens manifacturés Produits chimiques, produits Chemicals, related products nes 38 506 45 161 47 476 65 591 71 100 92 545 73 035 113 426 415 697 connexes nda Main Origin Principales provenances Germany 238 538.2 290 067.8 178 050.6 297 402.1 36 348.6 53 783.9 42 616.6 ... ... Allemagne U.K. 100 922.9 124 011.8 118 952.8 137 253.7 101 133.0 107 705.4 147 263.2 ... ... Royaume Uni Cote d'Ivoire 57 996.9 92 112.1 114 831.4 177 654.8 140 820.1 123 869.0 152 358.8 ... ... Côte d'Ivoire United States 53 443.6 66 250.7 109 223.4 109 249.6 116 243.5 165 403.2 176 288.8 ... ... Etats-Unis China 30 248.4 38 949.1 76 331.0 88 873.2 115 451.1 174 865.4 233 933.1 ... ... Chine African Statistical Yearbook 2011 / Annuaire Statistique pour l'Afrique 2011
  • 296.
    Somalia Somalie AREA (KM 2) 637 660 SUPERFICIE (KM 2) CAPITAL CITY Mogadishu Mogadiscio CAPITALE CURRENCY Somali Shilling Shilling Somalien MONNAIE I SOCIAL AND DEMOGRAPHIC INDICATORS — INDICATEURS DEMOGRAPHIQUES ET SOCIAUX 2002 2003 2004 2005 2006 2007 2008 2009 2010 Population Population Population au milieu de l'année - Mid-year population - Total (Million) 7.8 8.0 8.2 8.4 8.5 8.7 8.9 9.1 9.4 Total (million) Population au milieu de l'année - Mid-year population - Urban (%) 34.0 34.4 34.8 35.2 35.6 36.0 36.5 37.0 37.4 Urbaine (%) Female (%) 58.4 59.7 60.7 61.4 61.6 61.6 61.3 61.0 60.9 Femme (%) Population by Age Group Population par groupe d'âge 0-14 3457 187 3547 803 3637 735 3728 934 3820 574 3911 656 4003 922 4099 738 4200 677 0-14 15-64 4112 153 4205 871 4299 603 4393 762 4487 369 4580 958 4678 371 4784 833 4904 036 15-64 65+ 238 041 244 390 250 460 256 112 261 236 265 948 270 605 275 725 281 698 65+ Active Population (000) 3 075.0 3 153.0 3 228.0 3 305.0 3 381.0 3 462.0 3 542.0 3 631.0 ... Population active (000) Female (%) 38.5 38.6 38.7 38.8 38.9 38.9 39.0 39.1 ... Femme (%) Taux brut de natalité - Total (par Crude birth rate - Total (per 1000) 45.7 45.6 45.3 45.1 44.8 44.5 44.1 43.7 ... 1000) Taux brut de mortalité - Total (par Crude death rate - Total (per 1000) 16.4 16.2 16.1 16.0 16.0 15.9 15.7 15.5 ... 1000) Life expectancy at birth - Total Espérance de vie à la naissance - 49.1 49.3 49.5 49.5 49.6 49.7 49.9 50.1 ... (years) Total (années) Net reproduction rate - (per Taux net de reproduction - (par ... ... ... 2.1 ... ... ... ... ... woman) femme) Indice synthétique de fécondité - Total fertility rate - (per woman) 6.5 6.5 6.5 6.5 6.4 6.4 6.4 6.4 ... (p (par femme) ) Education Enseignement Teaching staff at first level - Total Personnel enseignant - 1er degré - ... ... ... ... ... 12.9 ... ... ... (thousands) Total (milliers) Teaching staff at second level - Personnel enseignant - 2ème degré 295 ... ... ... ... ... 4.5 ... ... ... Total (thousands) - Total (milliers) Teaching staff at third level - Total Personnel enseignant - 3ème degré ... ... ... ... ... ... ... ... ... (thousands) - Total (milliers) First level student enrollment - Elèves inscrits - 1er degré - Total ... ... ... ... ... 457 ... ... ... Total (thousands) (milliers) First level student enrollment - Elèves inscrits - 1er degré - ... ... ... ... ... 162 ... ... ... Female (thousands) Femmes (milliers) Second level student enrollment - Elèves inscrits - 2ème degré - Total ... ... ... ... ... 87 ... ... ... Total (thousands) (milliers) Second level student enrollment - Elèves inscrits - 2ème degré - ... ... ... ... ... 27 ... ... ... Female (thousands) Femmes (milliers) Third level student enrollment - Elèves inscrits - 3ème degré - Total ... ... ... ... ... ... ... ... ... Total (thousands) (milliers) Third level student enrollment - Elèves inscrits - 3ème degré - ... ... ... ... ... ... ... ... ... Female (thousands) Femmes (milliers) Public expenditure on education (% Dépenses publiques consacrées à ... ... ... ... ... ... ... ... ... of budget) l'enseignement (% du budget) Health Santé Hospital beds - Total (per 10 000 Nombre de lits d'hôpitaux - Total ... ... ... ... ... ... ... ... ... population) (pour 10 000) Nurses - Total (per 10 000 Nombre d'infirmières - Total (pour ... ... ... ... ... ... ... ... ... population) 10 000) Physicians - Total (per 10 000 Nombre de médecins - Total (pour ... ... ... ... ... ... ... ... ... population) 10 000) Public expenditure on Health (% of Dépenses publiques consacrées à ... ... ... ... ... ... ... ... ... budget) la santé (% du budget) African Statistical Yearbook 2011 / Annuaire Statistique pour l'Afrique 2011
  • 297.
    Somalia Somalie II NATIONAL ACCOUNTS — COMPTES NATIONAUX 2002 2003 2004 2005 2006 2007 2008 2009 2010 Gross domestic product by kind of economic activity at current prices Produit intérieur brut par branche d'activité économique aux prix courants Somali Shilling (Millions) Shilling Somalien(Millions) Agriculture 13 006 007 14 306 662 15 745 383 18 638 987 17 784 767 18 944 523 19 795 047 20 801 577 ... Agriculture Mining and quarrying 145 153 158 680 176 813 208 020 199 714 212 303 221 682 233 220 ... Industries extractives Manufacturing 536 317 586 899 650 788 768 598 735 080 782 412 817 326 859 255 ... Industries manufacturières Electricity, gas & water ... ... ... ... ... ... ... ... ... Electricité, gaz et eau Construction 909 250 996 149 1 097 202 1 303 052 1 239 314 1 321 553 1 381 385 1 450 755 ... Bâtiments et travaux publics Wholesale & retail trade, 2 298 595 2 521 534 2 777 446 3 294 130 3 137 188 3 343 879 3 494 747 3 671 153 ... Commerce de gros et de détail, restaurants, hotels restaurants et hôtels Banques, assurances, affaires Finance, insurance, real estate, etc. ... ... ... ... ... ... ... ... ... immobilières Transport and communications 2 090 407 2 213 964 2 418 795 2 995 774 2 732 083 2 954 969 3 103 344 3 233 784 ... Transport(s) et communications Administrations publiques et Public administration and defense 2 658 579 2 996 230 3 278 370 3 810 026 3 702 993 3 920 555 4 088 170 4 310 671 ... défense Other services ... ... ... ... ... ... ... ... ... Autres services Moins Services d’intermédiation Less Imputed Service Charges ... ... ... ... ... ... ... ... ... financière Gross domestic product at factor Produit intérieur brut aux couts des 21 644 308 23 780 119 26 144 796 31 018 588 29 531 140 31 480 193 32 901 701 34 560 414 ... cost / basic prices facteurs / prix de base Plus: Indirect Taxes / taxes on Plus taxes indirectes/impôts sur les 2 770 021 3 075 461 3 396 544 4 296 241 4 147 850 4 289 905 4 553 899 4 782 372 ... products, less subsidies produits, moins les subventions Expenditure on Gross domestic product at current purchaser's values Emploi du produit intérieur brut aux prix courants d'acquisition Somali Shilling (Millions) Shilling Somalien(Millions) Consommation finale des Government final consumption 2 096 254 2 414 300 2 665 280 3 059 344 2 919 146 3 142 143 3 260 496 3 430 270 ... administrations publiques Private final consumption 17 654 292 19 850 637 21 846 596 25 560 510 24 377 836 26 078 132 27 176 126 28 568 546 ... Consommation finale privée Gross fixed capital f G fi d it l formation ti 4 979 850 4 951 139 5 425 726 7 159 020 6 824 811 7 023 202 7 512 416 7 862 713 ... Formation b t d capital fi F ti brute de it l fixe Increase in inventories 18 230 ... ... 22 946 21 816 15 471 21 600 21 730 ... Variation des stocks 296 Exports of goods and services 79 165 70 195 76 852 111 107 105 774 105 979 115 483 120 476 ... Exportations de biens et services Moins importations de biens et Less imports of goods and services 413 462 430 691 473 114 598 098 570 393 594 829 630 522 660 949 ... services GDP at purchasers' values 24 414 329 26 855 580 29 541 340 35 314 829 33 678 990 35 770 098 37 455 600 39 342 786 ... PIB aux prix d'acquisition Gross domestic product by kind of economic activity at constant Produit intérieur brut par branche d'activité economique aux prix constants prices Annual Growth Rates (%) Taux de croissance annuel (%) Agriculture 0.9 1.0 2.4 2.1 3.9 1.9 2.6 2.9 ... Agriculture Mining and quarrying 12.2 13.0 5.9 7.1 -1.0 3.6 3.1 1.9 ... Industries extractives Manufacturing 10.7 10.6 5.1 6.1 -0.1 3.3 3.0 2.1 ... Industries manufacturières Electricity, gas & water ... ... ... ... ... ... ... ... ... Electricité, gaz et eau Construction 5.8 7.3 4.0 4.3 1.7 2.7 2.8 2.4 ... Bâtiments et travaux publics Wholesale & retail trade, Commerce de gros et de 5.2 7.3 4.0 4.2 1.8 2.6 2.8 2.5 ... restaurants, hotels détail,restaurants et hôtels Banques, assurances, affaires Finance, insurance, real estate, etc. ... ... ... ... ... ... ... ... ... immobilières Transport and communications 8.3 3.3 3.0 4.0 2.0 2.6 2.8 2.5 ... Transport(s) et communications Administrations publiques et Public administartion and defense 7.6 5.8 3.7 3.8 2.2 2.5 2.7 2.5 ... défense Other services ... ... ... ... ... ... ... ... ... Autres services Moins Services d’intérmediation Less Imputed Service Charges ... ... ... ... ... ... ... ... ... financière Gross domestic product at factor Produit intérieur brut aux couts des 3.2 3.0 3.0 2.9 3.1 2.2 2.6 2.7 ... cost / basic prices facteurs / prix de base Plus: Indirect Taxes / taxes on Plus taxes indirectes/impôts sur les 5.7 7.6 3.4 3.9 -2.3 5.6 2.3 1.9 ... products, less subsidies produits, moins les subventions Gross domestic product at market Produit intérieur brut aux prix du 3.5 3.5 3.0 3.0 2.4 2.6 2.6 2.6 ... prices marché African Statistical Yearbook 2011 / Annuaire Statistique pour l'Afrique 2011
  • 298.
    Somalia Somalie Expenditure on Gross domestic product at constant purchasers' Emplois du produit intérieur brut aux prix constants d'acquisition values Annual Growth Rates (%) Taux de croissance annuel (%) Consommation finale des Government final consumption 2.5 0.8 0.8 0.9 4.5 1.9 2.4 3.0 ... administrations publiques Private final consumption 6.1 4.9 4.0 4.1 1.0 3.2 2.7 2.4 ... Consommation finale privée Gross fixed capital formation -3.7 0.1 0.4 -0.5 6.0 1.4 2.2 3.3 ... Formation brute de capital fixe Exports of goods and services 0.0 6.1 2.1 1.5 3.9 2.1 4.5 6.6 ... Exportations de biens et services Moins importations de biens et Less imports of goods and services 1.0 -1.5 -0.9 -0.3 -5.1 9.3 2.9 5.3 ... services III INFLATION 2002 2003 2004 2005 2006 2007 2008 2009 2010 Annual Growth Rates (%) Taux de croissance annuel (%) All Item ... ... ... ... ... ... ... ... ... Ensemble Food ... ... ... ... ... ... ... ... ... Alimentation Health ... ... ... ... ... ... ... ... ... Santé Energy ... ... ... ... ... ... ... ... ... Energie Transport ... ... ... ... ... ... ... ... ... Transport IV AGRICULTURAL PRODUCTION - PRODUCTION AGRICOLE 2002 2003 2004 2005 2006 2007 2008 2009 2010 Tons (Thousand) Tonnes (milliers) Maize, Tons (thousands) 288 269 202 200 97 99 99 ... ... Maïs, tonnes (milliers) Sorghum, Tons (thousands) 141 121 145 140 145 80 80 ... ... Sorgho, tonnes (milliers) Cassava, Tons (thousands) 80 80 85 85 82 82 82 ... ... Manioc, tonnes (milliers) Banana, Tons (thousands) 37 37 37 38 38 38 38 ... ... Banane, tonnes (milliers) Graines de sésame tonnes sésame, Sesame seed, Tons (thousands) 28 30 30 30 30 30 30 ... ... (milliers) V MINING PRODUCTION - PRODUCTION MINIERE 297 2002 2003 2004 2005 2006 2007 2008 2009 2010 Salt and pure sodium chloride, Sel et chlorure de sodium pur, 1 000.0 1 000.0 1 000.0 1 000.0 1 000.0 1 000.0 ... ... ... metric tons (thousands) tonnes métriques (milliers) ... ... ... ... ... ... ... ... ... ... ... ... ... ... ... ... ... ... VI ENERGY - ENERGIE 2002 2003 2004 2005 2006 2007 2008 2009 2010 Electricity - total hydro production, Électricité - production hydraulique ... 10.0 11.0 11.0 12.0 15.0 ... ... ... kilowatt hours (millions) totale, kilowatt-heures (millions) Electricity - total thermal Électricité - production thermique 274.0 280.0 280.0 290.0 295.0 311.0 ... ... ... production, kilowatt hours (millions) totale, kilowatt-heures (millions) Electricity - total production, self- Electricité - Production totale privée ... ... ... ... ... ... ... ... ... producer (Million Kilowatt Hours) (million de kilowatt heures) Electricité - Production totale Electricity - total production, public 274 290 291 301 307 326 ... ... ... publique (million de kilowatt (Million Kilowatt Hours) heures) African Statistical Yearbook 2011 / Annuaire Statistique pour l'Afrique 2011
  • 299.
    Somalia Somalie VII TOURISM AND INFRASTRUCTURE - TOURISME ET INFRASTUCTURE 2002 2003 2004 2005 2006 2007 2008 2009 2010 Arrivals - Tourists (thousands) ... ... ... ... ... ... ... ... ... Arrivées - touristes (milliers) Rooms in hotels and similar Chambres d'hotels et établissements establishments (thousands) assimilés (milliers) ... ... ... ... ... ... ... ... ... Paved Road (% of total) ... ... ... ... ... ... ... ... ... Routes asphaltées (% du total) Total Network (Railways-km) ... ... ... ... ... ... ... ... ... Réseau total voies ferrées-Km Main Telephone Lines (per 1,000 Lignes téléphoniques fixes (pour 4 10 10 10 10 10 10 10 ... inhabitants) 1000 habitants) Mobile Cellular Subscribers (per Abonnés aux téléphones mobiles 13 30 60 60 60 70 70 70 ... 1,000 inhabitants) (pour 1000 habitants) VII FINANCIAL AND MONETARY STATISTICS - FINANCES ET STATISTIQUES MONETAIRES 2002 2003 2004 2005 2006 2007 2008 2009 2010 VII-1 Monetary Statistics VII-1 Statistiques monétaires Somali Shilling (Millions) Shilling Somalien(Millions) Money supply (M1) 247 478 292 950 344 524 424 173 489 298 549 581 580 274 ... ... Masse monétaire (M1) Quasi-money 129 360 166 383 207 057 300 005 390 210 529 121 560 192 ... ... Quasi-monnaie of which Demand Deposit ... ... ... ... ... ... ... ... ... dont Monnaie scripturale Net foreign assets - 183 182 - 247 119 - 127 895 61 250 632 374 907 585 843 366 ... ... Avoirs extérieurs nets Domestic credit 795 931 880 963 875 770 875 433 453 986 485 064 614 593 ... ... Crédit intérieur of which claims on private sector 56 719 93 317 135 486 159 647 189 181 263 750 324 403 ... ... dont créances sur le secteur privé of which Claims on government dont créances nettes sur le ... ... ... ... ... ... ... ... ... sector, net gouvernement International reserves (millions of US Réserves internationales (millions 85 67 125 171 184 217 211 ... ... $) de $ EU) Average Exchange Rate (National Taux de change (moyen) (monnaie ... ... ... ... ... ... ... ... ... Currency per us $) nationale par dollars) VII-2 Public Finance VII-2 Finances publiques Somali Shilling (Millions) Shilling Somalien(Millions) Total Revenues and Grants ... ... ... ... ... ... ... ... ... Recettes totales et dons Tax Revenue ... ... ... ... ... ... ... ... ... Recettes fiscales Non Tax Revenue ... ... ... ... ... ... ... ... ... Recettes non fiscales 298 Grants ... ... ... ... ... ... ... ... ... Dons Total Expenditures and Net Lending ... ... ... ... ... ... ... ... ... Dépenses totales et prêts nets Current expenditure ... ... ... ... ... ... ... ... ... Dépenses courantes Of which Wages and Salaries ... ... ... ... ... ... ... ... ... Dont rémunérations et salaires Capital expenditure ... ... ... ... ... ... ... ... ... Dépenses d'équipement Net Lending ... ... ... ... ... ... ... ... ... Prêts nets Fiscal Balance ... ... ... ... ... ... ... ... ... Solde global y compris les dons VII-3 Balance of Payments VII-3 Balance des paiements Somali Shilling (Millions) Shilling Somalien(Millions) Trade balance ... ... ... ... ... ... ... ... ... Balance commerciale Services Balance ... ... ... ... ... ... ... ... ... Balance des services Net Income ... ... ... ... ... ... ... ... ... Revenus nets Current transfers, net total ... ... ... ... ... ... ... ... ... Transferts courants Current account balance ... ... ... ... ... ... ... ... ... Solde du compte courant VII-4 External Debt and Financial Flows VII-4 Dette extérieure et flux financiers US $ (Millions) $ E.U (Millions) Total external debt ... ... ... ... ... ... ... ... ... Dette extérieure totale Private ... ... ... ... ... ... ... ... ... Privée Public ... ... ... ... ... ... ... ... ... Publique Total external debt service ... ... ... ... ... ... ... ... ... Service de la dette extérieure Net Foreign Direct Investment Investissements étranger direct 0 - 1 - 5 24 96 141 87 108 ... Inflows (flux nets entrants) Net Total Official Development Aide publique au développement 147 174 199 237 391 384 758 662 ... assistance (nette totale) African Statistical Yearbook 2011 / Annuaire Statistique pour l'Afrique 2011
  • 300.
    Somalia Somalie 2002 2003 2004 2005 2006 2007 2008 2009 2010 US $ (Millions) Shilling Somalien Exports, fob Exportations, fàb Exports - Total ... ... ... ... ... ... ... ... ... Exportations - Total Main Products Principaux produits Goats, live 10 0 27 39 33 44 28 48 ... Chèvres vivantes Waste & scrap of Gold ... ... ... 0 ... 1 27 ... ... Déchets et débris d'or Bovine, live except pure-bred 5 4 4 48 20 16 16 37 ... Bovins vivants excepté laitiers breeding Wood charcoal 7 8 8 15 21 20 27 16 ... Charbon de bois Sheep, live 2 2 4 28 8 6 11 42 ... Moutons vivants Main Destinations Principales destinations Yemen 0.0 0.0 18.8 23.0 24.3 36.4 42.6 41.8 ... Yémen United Arab Emirates 73.7 81.9 85.8 87.2 193.0 41.3 62.7 80.6 ... Émirats arabes unis Oman 10.1 42.3 7.8 7.9 7.3 7.8 13.8 63.4 ... Oman India 17.0 43.9 45.2 36.2 57.9 108.6 99.3 18.6 ... Inde Nigeria 11.1 4.8 0.0 0.0 2.9 48.1 7.0 0.1 ... Nigéria 2002 2003 2004 2005 2006 2007 2008 2009 2010 Imports, cif Importations, cif 299 Imports - Total 391 422 544 616 815 920 1 180 1 021 ... Importations - Total (millions) Principaux produits Main Products Sucre raffiné, sous forme solide, Refined sugar, in solid form, nes 46 52 52 52 71 53 59 74 ... nsa Vegetables, fresh or chilled nes 0 0 0 0 0 0 49 124 ... Légumes, frais ou réfrigérés, nda Foliage,branch,etc w/o Feuillages, branches, etc w / fleurs flowers/buds&grass for bouquet/orn 1 1 1 1 26 29 62 1 ... o / bourgeons et d'herbe pour le purp exc fr bouquet / Orn purp HT fr Wheat or meslin flour 9 0 19 27 16 29 50 31 ... Blé nda et méteil Vegetable products nes 10 29 0 0 10 69 46 49 ... Produits végétaux, NDA Main Origin Principales provenances United Arab Emirates 174.1 132.7 243.8 216.9 226.2 300.0 193.9 255.6 ... Émirats arabes unis Kenya 44.3 53.8 40.4 65.8 105.6 123.8 186.7 145.1 ... Kenya India 17.0 43.9 45.2 36.2 57.9 108.6 99.3 18.6 ... Inde Ethiopia 9.6 28.9 18.0 58.8 59.8 73.4 76.9 134.7 ... Ethiopie Brazil 27.7 21.6 44.3 44.9 61.5 18.6 9.1 58.3 ... Brésil African Statistical Yearbook 2011 / Annuaire Statistique pour l'Afrique 2011
  • 301.
    South Africa Afrique du Sud AREA (KM 2) 1 221 040 SUPERFICIE (KM 2) CAPITAL CITY Pretoria Pretoria CAPITALE CURRENCY Rand Rand MONNAIE I SOCIAL AND DEMOGRAPHIC INDICATORS — INDICATEURS DEMOGRAPHIQUES ET SOCIAUX 2002 2003 2004 2005 2006 2007 2008 2009 2010 Population Population Population au milieu de l'année - Mid-year population - Total (Million) 46.2 46.8 47.5 48.1 48.6 49.2 49.7 50.1 50.5 Total (million) Population au milieu de l'année - Mid-year population - Urban (%) 57.8 58.3 58.8 59.3 59.8 60.2 60.7 61.2 61.7 Urbaine (%) Female (%) 58.7 58.3 57.9 57.6 57.3 57.1 56.9 56.6 56.3 Femme (%) Population by Age Group Population par groupe d'âge 0-14 15139 231 15171 497 15201 436 15227 027 15247 752 15264 519 15278 283 15290 439 15301 683 0-14 15-64 29300 370 29858 418 30393 341 30897 260 31371 219 31815 227 32219 340 32571 139 32863 264 15-64 65+ 1757 881 1818 607 1882 299 1949 153 2019 547 2093 416 2170 005 2248 242 2327 461 65+ Active Population (000) 16 449.5 16 874.9 17 217.8 17 586.7 17 974.8 18 372.3 19 023.5 19 152.5 19 418.9 Population active (000) Female (%) 44.0 44.3 44.1 44.0 43.8 43.6 43.7 43.7 43.6 Femme (%) Taux brut de natalité - Total (par Crude birth rate - Total (per 1000) 24.0 24.0 24.0 23.0 23.0 22.0 22.0 22.0 22.0 1000) Taux brut de mortalité - Total (par Crude death rate - Total (per 1000) 13.0 14.0 14.0 15.0 15.0 15.0 15.0 15.0 15.0 1000) Life expectancy at birth - Total Espérance de vie à la naissance - 54.0 53.0 52.0 52.0 52.0 51.0 52.0 52.0 52.0 (years) Total (années) Net reproduction rate - (per Taux net de reproduction - (par ... ... ... 1.0 ... ... ... ... ... woman) femme) Indice synthétique de fécondité - Total fertility rate - (p woman) y (per ) 3.0 3.0 3.0 3.0 3.0 3.0 3.0 3.0 3.0 (par femme) Education Enseignement Teaching staff at first level - Total Personnel enseignant - 1er degré - 220.60 221.0 220.3 247.0 233.9 236.0 ... ... ... (thousands) Total (milliers) Teaching staff at second level - Total Personnel enseignant - 2ème degré - 300 146.64 149.0 149.4 141.6 158.4 164.7 ... ... ... (thousands) Total (milliers) Teaching staff at third level - Total Personnel enseignant - 3ème degré - ... ... ... ... ... ... ... ... ... (thousands) Total (milliers) First level student enrollment - Total Elèves inscrits - 1er degré - Total 7 466 7 470 7 444 7 314 7 257 7 312 ... ... ... (thousands) (milliers) First level student enrollment - Elèves inscrits - 1er degré - Femmes 3 652 3 648 3 628 3 565 3 535 3 572 ... ... ... Female (thousands) (milliers) Second level student enrollment - Elèves inscrits - 2ème degré - Total 4 354 4 447 4 593 4 658 4 772 4 780 ... ... ... Total (thousands) (milliers) Second level student enrollment - Elèves inscrits - 2ème degré - 2 250 2 289 2 367 2 392 2 446 2 437 ... ... ... Female (thousands) Femmes (milliers) Third level student enrollment - Total Elèves inscrits - 3ème degré - Total ... ... ... ... ... ... ... ... ... (thousands) (milliers) Third level student enrollment - Elèves inscrits - 3ème degré - ... ... ... ... ... ... ... ... ... Female (thousands) Femmes (milliers) Public expenditure on education (% Dépenses publiques consacrées à 18.5 18.5 18.1 17.9 17.6 17.4 ... ... ... of budget) l'enseignement (% du budget) Health Santé Hospital beds - Total (per 10 000 Nombre de lits d'hôpitaux - Total 371 377 28 28 408 329 ... ... ... population) (pour 10 000) Nurses - Total (per 10 000 Nombre d'infirmières - Total (pour 371 377 388 399 408 329 ... ... ... population) 10 000) Physicians - Total (per 10 000 Nombre de médecins - Total (pour ... ... 73 ... 86 75 ... ... ... population) 10 000) Public expenditure on Health (% of Dépenses publiques consacrées à la 12 9 9 9 9 ... ... ... ... budget) santé (% du budget) African Statistical Yearbook 2011 / Annuaire Statistique pour l'Afrique 2011
  • 302.
    South Africa Afrique du Sud II NATIONAL ACCOUNTS — COMPTES NATIONAUX 2002 2003 2004 2005 2006 2007 2008 2009 2010 Gross domestic product by kind of economic activity at current prices Produit intérieur brut par branche d'activité économique aux prix courants Rand (Millions) Rand(Millions) Agriculture 44 232 39 644 39 490 37 402 45 351 53 838 63 384 63 888 59 543 Agriculture Mining and quarrying 92 730 85 770 91 198 105 992 132 301 156 970 201 381 198 180 230 402 Industries extractives Manufacturing 204 219 223 917 243 967 259 101 274 502 304 437 340 623 330 310 352 176 Industries manufacturières Electricity, gas & water 26 489 29 553 30 176 33 010 36 946 41 783 45 803 60 280 66 812 Electricité, gaz et eau Construction 24 120 26 747 32 039 38 558 46 158 56 908 72 894 87 116 91 973 Bâtiments et travaux publics Wholesale & retail trade, Commerce de gros et de détail, 143 192 158 786 176 445 195 012 215 831 238 910 271 237 294 260 335 562 restaurants, hotels restaurants et hôtels Banques, assurances, affaires Finance, insurance, real estate, etc. 207 711 231 176 261 285 295 504 339 311 405 520 442 121 467 126 511 332 immobilières Transport and communications 100 983 112 637 124 786 139 472 153 775 164 467 188 231 199 065 220 039 Transport(s) et communications Administrations publiques et Public administration and defense 157 547 174 106 190 563 208 561 230 116 259 783 299 373 340 837 386 352 défense Other services 64 475 72 814 80 651 88 455 98 028 109 445 119 220 135 537 152 747 Autres services Moins Services d’intermédiation Less Imputed Service Charges ... ... ... ... ... ... ... ... ... financière Gross domestic product at factor Produit intérieur brut aux couts des 1 065 697 1 155 150 1 270 600 1 401 066 1 572 320 1 792 057 2 044 267 2 176 599 2 406 938 cost / basic prices facteurs / prix de base Plus: Indirect Taxes / taxes on Plus taxes indirectes/impôts sur les 105 389 117 387 144 673 170 015 195 103 224 109 229 872 219 370 255 819 products, less subsidies produits, moins les subventions Expenditure on Gross domestic product at current purchaser's values Emploi du produit intérieur brut aux prix courants d'acquisition Rand (Millions) Rand(Millions) Consommation finale des Government final consumption 219 705 244 485 274 034 305 733 347 928 380 214 428 852 505 469 553 277 administrations publiques Private final consumption 724 228 790 389 890 952 990 772 1 116 316 1 264 726 1 398 236 1 456 089 1 624 969 Consommation finale privée Gross fixed capital formation 172 151 196 999 226 180 263 754 324 083 406 257 524 678 531 957 520 451 Formation brute de capital fixe Increase in inventories 10 078 10 914 28 336 18 212 22 352 20 127 - 8 534 - 76 430 - 18 991 Variation des stocks Exports of goods and services 385 560 354 785 373 950 430 169 530 333 634 626 809 644 657 192 714 083 Exportations de biens et services Moins importations de biens et 301 Less imports of goods and services 340 636 325 035 378 179 437 559 573 589 689 784 878 737 678 308 731 032 services GDP at purchasers' values 1 171 086 1 272 537 1 415 273 1 571 081 1 767 423 2 016 166 2 274 139 2 395 969 2 662 757 PIB aux prix d'acquisition Gross domestic product by kind of economic activity at constant Produit intérieur brut par branche d'activité economique aux prix constants prices Annual Growth Rates (%) Taux de croissance annuel (%) Agriculture 6.5 0.7 0.9 2.8 -5.5 2.7 16.1 -3.0 0.9 Agriculture Mining and quarrying 1.0 3.4 1.5 1.0 -0.6 0.0 -5.6 -4.2 5.8 Industries extractives Manufacturing 2.8 -1.5 4.9 6.2 6.4 5.2 2.6 -10.4 5.0 Industries manufacturières Electricity, gas & water 3.5 3.0 6.8 5.3 3.4 3.4 -3.1 -1.6 2.0 Electricité, gaz et eau Construction 5.8 7.7 9.1 11.9 10.4 15.0 9.5 7.4 1.5 Bâtiments et travaux publics Wholesale & retail trade, Commerce de gros et de 2.3 2.7 5.4 7.0 6.0 5.3 0.8 -2.5 2.2 restaurants, hotels détail,restaurants et hôtels Banques, assurances, affaires Finance, insurance, real estate, etc. 6.3 4.8 7.1 5.7 9.6 7.9 7.3 0.9 1.9 immobilières Transport and communications 9.0 6.3 4.9 5.3 5.1 6.6 3.4 0.6 2.9 Transport(s) et communications Administrations publiques et Public administartion and defense 0.7 2.8 1.9 4.3 3.1 3.8 4.7 4.1 3.0 défense Other services 2.5 5.6 1.7 3.8 5.2 5.6 3.9 -0.3 0.6 Autres services Moins Services d’intérmediation Less Imputed Service Charges ... ... ... ... ... ... ... ... ... financière Gross domestic product at factor Produit intérieur brut aux couts des 3.7 3.0 4.5 5.3 5.5 5.6 3.7 -1.5 2.8 cost / basic prices facteurs / prix de base Plus: Indirect Taxes / taxes on Plus taxes indirectes/impôts sur les 3.7 2.7 5.0 5.0 6.2 5.5 2.3 -2.9 3.0 products, less subsidies produits, moins les subventions Gross domestic product at market Produit intérieur brut aux prix du 3.7 2.9 4.6 5.3 5.6 5.6 3.6 -1.7 2.8 prices marché 2008: semi-final 2009: Provisional 2010:Estimated 2008: semi-définitif 2009: provisoire 2010:Estimée African Statistical Yearbook 2011 / Annuaire Statistique pour l'Afrique 2011
  • 303.
    South Africa Afrique du Sud Expenditure on Gross domestic product at constant purchasers' Emplois du produit intérieur brut aux prix constants d'acquisition values Annual Growth Rates (%) Taux de croissance annuel (%) Consommation finale des Government final consumption 3.2 6.0 6.0 4.6 4.9 4.1 4.7 4.8 4.2 administrations publiques Private final consumption 4.3 3.2 5.9 6.3 8.5 5.3 2.8 -1.6 4.0 Consommation finale privée Gross fixed capital formation 3.7 10.2 12.9 11.0 12.1 14.0 14.1 -2.2 -3.8 Formation brute de capital fixe Exports of goods and services 1.0 0.1 2.8 8.6 7.5 6.6 1.8 -19.5 3.7 Exportations de biens et services Moins importations de biens et Less imports of goods and services 5.3 8.1 15.5 10.9 18.3 9.0 1.5 -17.4 8.6 services III INFLATION 2002 2003 2004 2005 2006 2007 2008 2009 2010 Annual Growth Rates (%) Taux de croissance annuel (%) All Item 9.1 5.8 1.4 3.4 4.6 7.2 11.5 7.1 3.7 Ensemble Food ... ... ... ... ... ... ... ... 3.1 Alimentation Health ... ... ... ... ... ... ... ... 7.4 Santé Energy ... ... ... ... ... ... ... ... 6.3 Energie Transport ... ... ... ... ... ... ... ... 2.5 Transport IV AGRICULTURAL PRODUCTION - PRODUCTION AGRICOLE 2002 2003 2004 2005 2006 2007 2008 2009 2010 Tons (Thousand) Tonnes (milliers) Maize, Tons (thousands) 10 076 9 705 9 710 11 716 6 935 7 125 12 700 12 050 ... Maïs, tonnes (milliers) Wheat, Tons (thousands) 2 438 1 547 1 687 1 905 2 105 1 905 2 130 1 958 ... Blé, tonnes (milliers) Potato, Tons (thousands) 1 647 1 496 1 800 1 768 1 863 1 972 2 099 1 819 ... Pomm de terre, tonnes (milliers) Grapes, Tons (thousands) 1 522 1 664 1 762 1 683 1 757 1 813 1 792 ... ... Raisins, tonnes (milliers) Orange, Tons (thousands) 1 307 1 410 1 198 1 246 1 334 1 410 1 525 1 445 ... Oranges, tonnes (milliers) V MINING PRODUCTION - PRODUCTION MINIERE 302 2002 2003 2004 2005 2006 2007 2008 2009 2010 Hard Coal, metric tons (thousands) ######### ######### ######### ######### ######### 247666 000.0 ... ... ... Houille, tonnes métriques (milliers) Iron ores and concentrates, metric ######### ######### ######### ######### ######### 42100 888.0 ... ... ... Minerais de fer et concentrés, tons (thousands) tonnes métriques (milliers) Copper ores and concentrates, Minerais de cuivre et concentrés, 129 590.0 120 920.0 87 000.0 85 000.0 89 700.0 97 000.0 ... ... ... metric tons (thousands) tonnes métriques (milliers) VI ENERGY - ENERGIE 2002 2003 2004 2005 2006 2007 2008 2009 2010 Electricity - total hydro production, Électricité - production hydraulique 4 394.0 3 682.0 4 625.0 4 199.0 5 581.0 3 908.0 ... ... ... kilowatt hours (millions) totale, kilowatt-heures (millions) Electricity - total thermal production, Électricité - production thermique 201 274.0 217 831.0 226 564.0 229 375.0 236 384.0 248 201.0 ... ... ... kilowatt hours (millions) totale, kilowatt-heures (millions) Electricity - total production, self- Electricité - Production totale privée 8 310 11 551 11 454 11 736 10 204 10 541 ... ... ... producer (Million Kilowatt Hours) (million de kilowatt heures) Electricity - total production, public Electricité - Production totale 209 402 222 678 233 153 233 184 243 594 252 938 ... ... ... (Million Kilowatt Hours) publique (million de kilowatt heures) African Statistical Yearbook 2011 / Annuaire Statistique pour l'Afrique 2011
  • 304.
    South Africa Afrique du Sud VII TOURISM AND INFRASTRUCTURE - TOURISME ET INFRASTUCTURE 2002 2003 2004 2005 2006 2007 2008 2009 2010 Arrivals - Tourists (thousands) 6430 6505 6678 7369 8396 9091 9592 ... ... Arrivées - touristes (milliers) Rooms in hotels and similar Chambres d'hotels et établissements establishments (thousands) 52 52 52 55 ... ... ... ... ... assimilés (milliers) Paved Road (% of total) ... ... ... ... ... ... ... ... ... Routes asphaltées (% du total) Total Network (Railways-km) 22 657 20 041 20 247 20 247 20 247 24 487 ... ... ... Réseau total voies ferrées-Km Main Telephone Lines (per 1,000 Lignes téléphoniques fixes (pour 100 100 100 100 100 90 90 90 ... inhabitants) 1000 habitants) Mobile Cellular Subscribers (per Abonnés aux téléphones mobiles 300 360 440 710 820 860 910 930 ... 1,000 inhabitants) (pour 1000 habitants) VII FINANCIAL AND MONETARY STATISTICS - FINANCES ET STATISTIQUES MONETAIRES 2002 2003 2004 2005 2006 2007 2008 2009 2010 VII-1 Monetary Statistics VII-1 Statistiques monétaires Rand (Millions) Rand(Millions) Money supply (M1) 197 019 218 943 245 327 294 039 339 387 402 116 420 746 423 065 473 442 Masse monétaire (M1) Quasi-money 428 461 499 342 536 280 643 089 796 297 962 436 1 150 860 1 154 300 1 217 420 Quasi-monnaie of which Demand Deposit ... ... ... ... ... ... ... ... ... dont Monnaie scripturale Net foreign assets 83 744 124 666 139 752 193 315 271 460 302 579 387 441 333 510 337 781 Avoirs extérieurs nets Domestic credit 834 398 947 212 1 042 900 1 183 240 1 433 680 1 735 550 2 000 010 2 108 470 2 238 120 Crédit intérieur of which claims on private sector 682 075 805 719 922 983 1 080 330 1 354 290 1 651 660 1 816 800 1 870 690 1 933 350 dont créances sur le secteur privé of which Claims on government dont créances nettes sur le 97 767 68 062 59 300 9 230 - 38 623 - 49 506 - 50 957 55 124 51 901 sector, net gouvernement International reserves (millions of US Réserves internationales (millions de 5 904 6 496 13 141 18 579 23 057 29 589 30 584 35 237 38 175 $) $ EU) Average Exchange Rate (National Taux de change (moyen) (monnaie 10.54 7.56 6.46 6.36 6.77 7.05 8.26 8.47 7.32 Currency per us $) nationale par dollars) VII-2 Public Finance VII-2 Finances publiques Rand (Millions) Rand(Millions) Total Revenues and Grants 248 263 278 508 299 431 347 854 411 748 481 198 560 774 608 783 579 686 Recettes totales et dons Tax Revenue 244 090 273 680 292 720 341 651 403 051 470 355 549 102 595 973 570 565 Recettes fiscales Non Tax Revenue 4 172 4 828 6 711 6 203 8 697 10 843 11 672 12 810 9 121 Recettes non fiscales Grants 0 0 0 0 0 0 0 0 0 Dons 303 Total Expenditures and Net Lending 262 851 299 631 328 720 366 985 416 684 470 193 541 498 635 807 747 197 Dépenses totales et prêts nets Current expenditure 141 779 157 693 164 994 179 722 199 905 222 986 255 253 307 482 380 810 Dépenses courantes Of which Wages and Salaries 97 362 109 941 119 888 129 728 140 202 154 687 177 012 211 322 240 610 Dont rémunérations et salaires Capital expenditure 16 731 13 047 14 867 16 421 20 549 22 970 26 143 41 171 59 700 Dépenses d'équipement Net Lending - 9 962 - 19 623 - 20 259 - 18 046 - 18 916 - 23 688 - 26 650 - 8 445 - 17 000 Prêts nets Fiscal Balance - 14 588 - 21 123 - 29 289 - 19 131 - 4 936 11 005 19 275 - 27 024 - 167 511 Solde global y compris les dons VII-3 Balance of Payments VII-3 Balance des paiements US $ (Millions) $ E.U(Millions) Trade balance 4 767 3 527 - 191 - 315 - 4 323 - 5 753 - 4 304 268 2 797 Balance commerciale Services Balance - 505 406 - 464 - 847 - 2 065 - 2 644 - 4 059 - 2 760 - 3 998 Balance des services Net Income - 2 789 - 4 610 - 4 311 - 4 942 - 5 135 - 9 768 - 8 942 - 6 316 - 7 581 Revenus nets Current transfers, net total - 554 - 989 - 1 683 - 2 466 - 2 329 - 2 353 - 2 289 - 2 647 - 2 784 Transferts courants Current account balance 918 - 1 665 - 6 649 - 8 569 - 13 852 - 20 517 - 19 594 - 11 455 - 11 566 Solde du compte courant VII-4 External Debt and Financial Flows VII-4 Dette extérieure et flux financiers US $ (Millions) $ E.U (Millions) Total external debt 34 002 39 309 45 014 46 157 57 058 75 275 71 811 79 031 90 037 Dette extérieure totale Private 28 983 34 279 39 974 41 106 51 996 70 203 66 728 73 937 82 933 Privée Public 5 019 5 030 5 040 5 051 5 062 5 072 5 083 5 094 7 104 Publique Total external debt service 17 573 17 176 21 788 23 242 25 530 26 579 38 210 36 321 35 028 Service de la dette extérieure Net Foreign Direct Investment Investissements étranger direct (flux 1 569 734 798 6 647 - 527 5 695 9 006 5 696 ... Inflows nets entrants) Net Total Official Development Aide publique au développement 511 656 629 690 715 807 1 125 1 075 ... assistance (nette totale) African Statistical Yearbook 2011 / Annuaire Statistique pour l'Afrique 2011
  • 305.
    South Africa Afrique du Sud 2002 2003 2004 2005 2006 2007 2008 2009 2010 US $ (Millions) Rand Exports, fob Exportations, fàb Exports - Total 31 616 38 525 48 071 56 352 66 113 75 765 85 253 65 666 ... Exportations - Total Main Products Principaux produits Platinum unwrought or in powder Platine sous forme brute ou en 2 095 3 092 4 299 4 604 5 748 6 378 8 986 6 357 ... form poudre Diamonds non-industrial unworked Diamants non-industriels bruts ou 2 147 2 742 2 868 2 993 3 591 5 150 5 317 3 006 ... or simply sawn, cleaved or bruted simplement sciés, clivés ou débrutés Gold in unwrought forms non- Or sous forme brute à usage non 2 517 1 978 2 778 3 679 3 545 4 968 4 762 4 399 ... monetary monétaire Ferro-chromium containing by Ferro-chrome contenant en poids 664 1 027 1 674 1 779 1 742 2 505 4 273 2 219 ... weight more than 4% of carbon plus de 4% de carbone Bituminous coal, whether or not Houille butimuneuse, qu'ils soient ou 1 202 1 348 1 984 2 075 2 134 3 150 4 087 2 800 ... pulverised but not agglomerated non pulvérisés mais non agglomérés Main Destinations Principales destinations United States 4 171.6 4 799.8 6 152.9 6 062.4 7 734.8 9 282.1 10 132.7 5 967.5 ... États-Unis United Kingdom 4 067.1 4 879.5 5 568.0 6 139.3 6 727.1 8 317.0 8 906.8 5 411.9 ... Royaume-Uni Japan 2 892.4 3 593.9 4 608.9 5 537.6 6 628.4 7 730.5 8 983.4 4 987.8 ... Japon Germany 2 968.1 3 202.5 3 994.6 4 345.3 5 283.9 6 018.6 7 658.8 5 209.8 ... Allemagne China 1 268.8 1 840.0 2 960.2 3 443.1 4 085.4 6 618.1 9 235.0 8 693.3 ... Chine 2002 2003 2004 2005 2006 2007 2008 2009 2010 Imports, cif Importations, cif 304 Imports - Total 28 545 37 354 51 885 59 653 74 781 94 132 99 561 73 781 ... Importations - Total (millions) Principaux produits Main Products Petroleum oils and oils obtained from Huiles de pétrole, les huiles de 557 2 495 261 3 087 4 551 1 747 3 136 2 301 ... bituminous minerals, crude minéraux bitumineux, brut Petroleum oils&oils obtained from Huiles de pétrole, bitumineux, bituminous minerals,o/than crude 265 422 926 2 060 5 442 4 894 5 641 3 184 ... distilles, sauf brut etc Gold in unwrought forms non- Or sous forme brute à usage non 47 49 387 605 1 230 1 002 2 539 803 ... monetary monétaire Gold, semi-manufactured forms, non- Or, sous formes mi-ouvrées à uasge 60 30 42 1 107 1 247 1 613 2 035 440 ... monetary non monétaire Medicaments nes, in dosage 705 892 1 101 1 478 2 112 3 077 2 690 1 987 ... Médicaments nda, en dosage Main Origin Principales provenances Germany 4 105.0 5 712.1 7 541.0 8 292.7 9 255.8 9 765.0 10 331.9 7 922.8 ... Allemagne China 1 310.6 2 029.4 2 951.9 3 826.0 5 767.7 7 444.9 8 617.6 7 365.6 ... Chine United States 2 524.6 2 820.8 3 172.0 3 881.7 4 461.7 5 517.2 6 494.7 4 460.6 ... États-Unis United Kingdom 2 414.1 2 906.8 3 451.4 3 786.5 4 026.5 4 325.0 4 680.0 3 343.9 ... Royaume-Uni Japan 1 553.8 2 031.6 2 907.6 3 273.6 4 057.2 4 610.5 4 627.7 2 606.7 ... Japon African Statistical Yearbook 2011 / Annuaire Statistique pour l'Afrique 2011
  • 306.
    Sudan Soudan AREA (KM 2) 2 505 813 SUPERFICIE (KM 2) CAPITAL CITY Khartoum Khartoum CAPITALE CURRENCY Sudanese Pound Pound Sudanais MONNAIE I SOCIAL AND DEMOGRAPHIC INDICATORS — INDICATEURS DEMOGRAPHIQUES ET SOCIAUX 2002 2003 2004 2005 2006 2007 2008 2009 2010 Population Population Population au milieu de l'année - Mid-year population - Total (Million) 32.8 33.6 34.5 35.4 36.3 37.2 39.2 40.3 ... Total (million) Population au milieu de l'année - Mid-year population - Urban (%) 34.8 35.5 36.2 36.8 37.6 38.3 29.5 29.5 ... Urbaine (%) Female (%) 49.9 49.6 49.6 49.6 49.6 49.6 48.7 48.0 ... Femme (%) Population by Age Group Population par groupe d'âge 0-14 13894 000 14145 619 14415 662 14690 000 14972 000 15230 751 16683 728 17164 000 ... 0-14 15-64 17597 000 18176 381 17016 338 19270 000 19845 000 20455 383 20454 306 21043 000 ... 15-64 65+ 1278 000 1326 000 3080 000 1437 000 1480 000 1552 866 2016 456 2075 000 ... 65+ Active Population (000) 11 174.2 11 474.0 11 768.6 12 070.4 12 377.3 12 698.5 13 351.7 13 736.0 ... Population active (000) Female (%) 28.8 29.1 29.3 29.7 30.3 30.5 30.7 31.0 ... Femme (%) Taux brut de natalité - Total (par Crude birth rate - Total (per 1000) 37.8 37.8 37.8 37.8 37.8 37.8 43.5 43.5 ... 1000) Taux brut de mortalité - Total (par Crude death rate - Total (per 1000) 11.5 11.5 10.3 10.3 10.3 10.3 10.3 10.3 ... 1000) Life expectancy at birth - Total Espérance de vie à la naissance - 54.0 54.0 54.0 54.0 54.0 54.0 54.0 54.0 ... (years) Total (années) Net reproduction rate - (per Taux net de reproduction - (par ... ... ... 1.7 ... ... ... ... ... woman) femme) Indice synthétique de fécondité - Total fertility rate - (per woman) 5.9 5.9 5.9 5.9 5.9 5.9 5.8 5.8 ... (p (par femme) ) Education Enseignement Teaching staff at first level - Total Personnel enseignant - 1er degré - 132.04 136.4 141.3 143.3 146.0 155.0 161.0 ... ... (thousands) Total (milliers) Teaching staff at second level - Personnel enseignant - 2ème degré 19.78 23.0 32.9 34.2 39.0 42.1 43.0 ... ... Total (thousands) - Total (milliers) 305 Teaching staff at third level - Total Personnel enseignant - 3ème degré 8.2 5.8 7.4 8.0 8.5 11.0 ... ... ... (thousands) - Total (milliers) First level student enrollment - Elèves inscrits - 1er degré - Total 3 759 3 967 4 300 4 624 4 786 5 253 5 800 ... ... Total (thousands) (milliers) First level student enrollment - Elèves inscrits - 1er degré - 1 718 1 810 1 967 2 163 2 176 2 424 2 675 2 205 ... Female (thousands) Femmes (milliers) Second level student enrollment - Elèves inscrits - 2ème degré - Total 487 546 637 639 636 680 720 1 837 ... Total (thousands) (milliers) Second level student enrollment - Elèves inscrits - 2ème degré - 240 261 305 283 303 312 367 845 ... Female (thousands) Femmes (milliers) Third level student enrollment - Elèves inscrits - 3ème degré - Total ... ... ... ... ... ... ... ... ... Total (thousands) (milliers) Third level student enrollment - Elèves inscrits - 3ème degré - ... ... ... ... ... ... ... ... ... Female (thousands) Femmes (milliers) Public expenditure on education (% Dépenses publiques consacrées à 3.8 3.0 1.9 1.4 1.0 1.7 1.3 ... ... of budget) l'enseignement (% du budget) Health Santé Hospital beds - Total (per 10 000 Nombre de lits d'hôpitaux - Total 73 71 72 74 73 74 73 72 ... population) (pour 10 000) Nurses - Total (per 10 000 Nombre d'infirmières - Total (pour 50 51 49 60 51 49 50 44 ... population) 10 000) Physicians - Total (per 10 000 Nombre de médecins - Total (pour 18 18 20 23 29 30 28 35 ... population) 10 000) Public expenditure on Health (% of Dépenses publiques consacrées à 10 9 10 12 10 18 12 14 ... budget) la santé (% du budget) African Statistical Yearbook 2011 / Annuaire Statistique pour l'Afrique 2011
  • 307.
    Sudan Soudan II NATIONAL ACCOUNTS — COMPTES NATIONAUX 2002 2003 2004 2005 2006 2007 2008 2009 2010 Gross domestic product by kind of economic activity at current prices Produit intérieur brut par branche d'activité économique aux prix courants Sudanese Pound (Millions) Pound Sudanais(Millions) Agriculture 1 787 823 2 127 410 2 321 830 2 827 390 3 099 310 3 298 550 3 748 060 4 496 960 ... Agriculture Mining and quarrying 319 050 380 818 473 570 644 280 905 530 1 782 430 2 006 430 2 240 900 ... Industries extractives Manufacturing 386 317 426 522 550 580 635 020 697 410 878 190 972 630 1 150 820 ... Industries manufacturières Electricity, gas & water 47 362 29 871 97 890 124 080 210 840 198 140 224 240 251 300 ... Electricité, gaz et eau Construction 186 914 210 921 257 860 376 540 417 770 465 050 523 930 617 120 ... Bâtiments et travaux publics Wholesale & retail trade, 692 094 852 616 1 062 700 1 248 730 1 412 940 1 672 780 1 837 620 2 110 760 ... Commerce de gros et de détail, restaurants, hotels restaurants et hôtels Banques, assurances, affaires Finance, insurance, real estate, etc. 396 874 421 227 513 340 635 500 733 260 780 890 896 110 1 039 910 ... immobilières Transport and communications 400 965 554 418 823 320 1 235 860 1 308 511 1 378 120 1 504 550 1 707 620 ... Transport(s) et communications Administrations publiques et Public administration and defense 243 329 266 167 384 560 426 910 529 740 594 370 668 060 748 160 ... défense Other services 143 682 150 902 160 850 172 060 195 900 225 460 250 280 272 930 ... Autres services Moins Services d’intermédiation Less Imputed Service Charges - 29 342 - 37 970 - 54 670 - 88 400 - 102 610 - 109 480 - 112 550 - 124 440 ... financière Gross domestic product at factor Produit intérieur brut aux couts des 4 575 067 5 382 903 6 591 830 8 237 970 9 408 601 11 164 500 12 519 360 14 512 040 ... cost / basic prices facteurs / prix de base Plus: Indirect Taxes / taxes on Plus taxes indirectes/impôts sur les 200 544 190 476 280 309 332 743 463 280 237 255 255 330 630 740 ... products, less subsidies produits, moins les subventions Expenditure on Gross domestic product at current purchaser's values Emploi du produit intérieur brut aux prix courants d'acquisition Sudanese Pound (Millions) Pound Sudanais(Millions) Consommation finale des Government final consumption 291 560 333 405 586 230 791 694 960 646 963 515 1 081 078 1 312 980 ... administrations publiques Private final consumption 3 746 670 4 546 645 5 319 025 6 999 525 7 918 033 8 578 047 9 207 296 10 734 900 ... Consommation finale privée Gross fixed capital f G fi d it l formation ti 925 843 741 446 1 122 467 1 428 410 1 642 672 1 617 034 1 864 470 1 946 240 ... Formation b t d capital fi F ti brute de it l fixe Increase in inventories 116 797 246 568 184 496 247 225 436 680 737 339 585 191 691 850 ... Variation des stocks Exports of goods and services 536 999 670 319 986 895 1 202 844 1 271 839 1 866 478 2 540 113 3 163 520 ... Exportations de biens et services 306 Moins importations de biens et Less imports of goods and services 842 258 965 004 1 326 974 2 098 985 2 357 990 2 360 658 2 503 458 2 706 710 ... services GDP at purchasers' values 4 775 611 5 573 378 6 872 139 8 570 713 9 871 881 11 401 755 12 774 690 15 142 780 ... PIB aux prix d'acquisition Gross domestic product by kind of economic activity at constant Produit intérieur brut par branche d'activité economique aux prix constants prices Annual Growth Rates (%) Taux de croissance annuel (%) Agriculture -1.0 4.0 -2.1 5.8 6.5 4.8 7.7 8.6 ... Agriculture Mining and quarrying 12.9 14.8 15.9 9.7 6.4 50.3 10.2 10.5 ... Industries extractives Manufacturing 6.8 4.3 8.4 6.5 8.7 8.5 8.6 8.6 ... Industries manufacturières Electricity, gas & water 10.2 -14.0 16.3 9.9 8.4 6.4 8.0 15.8 ... Electricité, gaz et eau Construction 5.2 7.0 25.5 8.9 9.8 8.9 8.3 8.5 ... Bâtiments et travaux publics Wholesale & retail trade, Commerce de gros et de 2.7 2.7 2.7 4.5 5.6 5.8 6.8 6.8 ... restaurants, hotels détail,restaurants et hôtels Banques, assurances, affaires Finance, insurance, real estate, etc. -0.9 14.5 1.4 8.5 8.9 6.5 7.9 7.9 ... immobilières Transport and communications 0.8 25.6 10.5 7.0 8.6 10.0 8.0 7.6 ... Transport(s) et communications Administrations publiques et Public administartion and defense 36.6 3.8 5.5 13.5 23.0 4.5 5.8 5.9 ... défense Other services 5.3 5.9 6.3 57.3 5.3 3.6 4.3 4.3 ... Autres services Moins Services d’intérmediation Less Imputed Service Charges 36.8 29.4 3.6 3.2 3.6 2.5 2.9 2.8 ... financière Gross domestic product at factor Produit intérieur brut aux couts des 5.4 6.6 4.1 8.6 9.8 9.2 7.7 8.2 ... cost / basic prices facteurs / prix de base Plus: Indirect Taxes / taxes on Plus taxes indirectes/impôts sur les 16.3 2.1 22.0 -29.2 0.3 -19.8 9.0 -59.0 ... products, less subsidies produits, moins les subventions Gross domestic product at market Produit intérieur brut aux prix du 6.0 6.3 5.1 6.1 9.4 8.1 7.8 6.1 ... prices marché 2009: Provisional 2009: provisoire African Statistical Yearbook 2011 / Annuaire Statistique pour l'Afrique 2011
  • 308.
    Sudan Soudan Expenditure on Gross domestic product at constant purchasers' Emplois du produit intérieur brut aux prix constants d'acquisition values Annual Growth Rates (%) Taux de croissance annuel (%) Consommation finale des Government final consumption 14.6 14.8 3.3 -16.5 26.1 5.8 5.8 ... ... administrations publiques Private final consumption 0.7 -4.6 4.6 21.0 5.2 3.1 3.1 ... ... Consommation finale privée Gross fixed capital formation 63.2 31.2 25.3 19.6 9.4 -6.3 -0.3 ... ... Formation brute de capital fixe Exports of goods and services 15.5 1.9 12.0 13.6 -1.6 52.3 21.2 ... ... Exportations de biens et services Moins importations de biens et Less imports of goods and services 50.3 13.7 31.1 66.5 6.5 -8.0 -8.9 ... ... services III INFLATION 2002 2003 2004 2005 2006 2007 2008 2009 2010 Annual Growth Rates (%) Taux de croissance annuel (%) All Item 8.3 7.7 8.5 8.5 7.2 8.1 14.3 11.2 13.0 Ensemble Food 29.0 10.3 8.8 10.3 2.1 5.4 10.4 25.4 15.6 Alimentation Health 8.9 6.7 1.2 -7.2 39.5 17.4 1.2 13.2 5.1 Santé Energy 17.0 3.8 10.5 13.6 14.7 4.9 5.8 5.0 9.9 Energie Transport 17.5 3.7 13.7 5.2 26.0 32.1 1.0 -6.9 2.4 Transport IV AGRICULTURAL PRODUCTION - PRODUCTION AGRICOLE 2002 2003 2004 2005 2006 2007 2008 2009 2010 Tons (Thousand) Tonnes (milliers) Sorghum, metric tons (thousands) 7 201 2 825 4 690 2 678 4 356 5 011 3 869 4 197 ... Sorgho, tonnes métriques (milliers) Groundnuts, metric tons 990 555 790 520 555 523 716 942 ... Arachides, tonnes métriques (thousands) (milliers) Sesame seeds, metric tons 269 122 400 277 400 242 350 318 ... Graines de sesame, tonnes (thousands) métriques (milliers) Wheat, metric tons (thousands) 247 331 398 364 401 680 587 980 ... Blé, tonnes métriques (milliers) Cotton, metric tons (thousands) 243 254 238 312 255 244 107 169 ... Coton, tonnes métriques (milliers) V MINING PRODUCTION - PRODUCTION MINIERE 307 2002 2003 2004 2005 2006 2007 2008 2009 2010 Gold, Kilograms (thousands) 5 238.7 5 106.0 4 271.0 4 271.0 3 246.0 2 701.0 2 255.0 1 833.0 ... Or, Kilogrammes (milliers) Gypsum (Ton) 4 540.0 13 304.0 7 301.0 16 800.0 7 000.0 7 974.0 12 705.0 30 000.0 ... Gypse (tonnes) Chromate (Ton) 15 000.0 15 000.0 11 000.0 30 600.0 17 200.0 28 909.0 27 094.0 14 087.0 ... Chromate (tonnes) VI ENERGY - ENERGIE 2002 2003 2004 2005 2006 2007 2008 2009 2010 Electricity - total hydro production, Électricité - production hydraulique 1 794.2 2 180.1 2 624.2 2 886.9 3 165.0 3 564.9 4 041.7 3 141.4 ... kilowatt hours (millions) totale, kilowatt-heures (millions) Electricity - total thermal Électricité - production thermique 1 287.2 1 163.2 1 106.8 1 239.0 1 368.2 1 456.6 1 464.7 3 230.6 ... production, kilowatt hours (millions) totale, kilowatt-heures (millions) Electricity - total production, self- Electricité - Production totale privée ... ... ... ... ... ... ... ... ... producer (Million Kilowatt Hours) (million de kilowatt heures) Electricité - Production totale Electricity - total production, public 3 094 3 354 3 749 4 124 4 521 5 021 5 506 6 372 ... publique (million de kilowatt (Million Kilowatt Hours) heures) African Statistical Yearbook 2011 / Annuaire Statistique pour l'Afrique 2011
  • 309.
    Sudan Soudan VII TOURISM AND INFRASTRUCTURE - TOURISME ET INFRASTUCTURE 2002 2003 2004 2005 2006 2007 2008 2009 2010 Arrivals - Tourists (thousands) 51.5 52.291 60.566 245.6 294.6 336 440 420.238 ... Arrivées - touristes (milliers) Rooms in hotels and similar Chambres d'hotels et établissements establishments (thousands) assimilés (milliers) ... ... 3.564 2.304 2.842 3.466 ... 4.55 ... Paved Road (% of total) 36 32 33 33 36 32 32 32 ... Routes asphaltées (% du total) Total Network (Railways-km) 11 608 10 654 12 486 11 586 11 586 12 814 12 909 12 909 ... Réseau total voies ferrées-Km Main Telephone Lines (per 1,000 Lignes téléphoniques fixes (pour 21 10 10 19 18 10 9 9 ... inhabitants) 1000 habitants) Mobile Cellular Subscribers (per Abonnés aux téléphones mobiles 8 16 30 51 130 167 286 ... ... 1,000 inhabitants) (pour 1000 habitants) VII FINANCIAL AND MONETARY STATISTICS - FINANCES ET STATISTIQUES MONETAIRES 2002 2003 2004 2005 2006 2007 2008 2009 2010 VII-1 Monetary Statistics VII-1 Statistiques monétaires Sudanese Pound (Millions) Pound Sudanais(Millions) Money supply (M1) 3 523 4 585 6 044 8 130 11 311 12 417 14 819 17 661 ... Masse monétaire (M1) Quasi-money 2 108 2 631 3 349 5 340 6 492 7 271 8 049 10 624 ... Quasi-monnaie of which Demand Deposit ... ... ... ... ... ... ... ... ... dont Monnaie scripturale Net foreign assets - 4 084 - 3 302 - 1 067 1 397 137 - 349 - 45 - 2 634 ... Avoirs extérieurs nets Domestic credit 4 056 5 122 5 842 8 748 16 262 17 252 19 051 25 127 ... Crédit intérieur of which claims on private sector 1 784 2 796 4 212 6 697 10 859 11 760 12 711 15 513 ... dont créances sur le secteur privé of which Claims on government dont créances nettes sur le 2 067 2 002 1 324 1 550 4 284 3 958 3 661 6 630 ... sector, net gouvernement International reserves (millions of US Réserves internationales (millions 249 529 1 338 1 869 1 660 1 378 1 399 1 094 ... $) de $ EU) Average Exchange Rate (National Taux de change (moyen) (monnaie 2.63 2.61 2.58 2.44 2.17 2.02 2.09 2.30 ... Currency per us $) nationale par dollars) VII-2 Public Finance VII-2 Finances publiques Sudanese Pound (Millions) Pound Sudanais(Millions) Total Revenues and Grants 50 362 71 503 102 910 121 844 150 750 182 695 247 172 200 457 ... Recettes totales et dons Tax Revenue 21 372 26 294 42 031 50 076 58 810 66 872 77 695 86 558 ... Recettes fiscales Non Tax Revenue 25 845 45 205 60 363 71 768 91 940 114 495 169 038 105 926 ... Recettes non fiscales 308 Grants ... ... ... ... 36 100 1 327 439 7 973 ... Dons Total Expenditures and Net Lending 34 412 50 392 463 326 68 015 78 980 166 006 220 027 184 425 ... Dépenses totales et prêts nets Current expenditure 34 412 50 392 463 326 68 015 78 980 166 006 207 565 184 425 ... Dépenses courantes Of which Wages and Salaries 16 494 19 111 27 331 30 158 36 920 44 310 53 474 65 547 ... Dont rémunérations et salaires Capital expenditure 108 900 112 800 227 000 232 900 322 800 452 500 12 463 372 079 ... Dépenses d'équipement Net Lending - 146 900 10 000 5 700 - 9 600 26 700 - 700 0 0 ... Prêts nets Fiscal Balance 15 950 21 111 - 360 416 53 829 71 770 16 689 27 145 16 032 ... Solde global y compris les dons VII-3 Balance of Payments VII-3 Balance des paiements Sudanese Pound (Millions) Pound Sudanais(Millions) Trade balance - 203 720 6 070 191 570 -1 121 710 -1 448 150 1 156 840 3 441 140 - 693 620 ... Balance commerciale Services Balance - 643 150 - 793 810 -1 020 410 -1 746 530 -2 583 820 -2 554 119 -2 388 790 -2 092 650 ... Balance des services Net Income - 3 910 - 4 590 - 420 - 210 - 620 -2 435 270 -3 013 050 -1 511 050 ... Revenus nets Current transfers, net total 147 960 9 930 28 490 234 490 223 420 173 500 385 050 1 480 440 ... Transferts courants Current account balance - 702 820 - 782 400 - 800 770 -2 633 960 -3 809 170 -3 659 049 -1 575 650 -2 816 880 ... Solde du compte courant VII-4 External Debt and Financial Flows VII-4 Dette extérieure et flux financiers US $ (Millions) $ E.U (Millions) Total external debt 22 224 24 672 25 106 27 007 28 447 31 873 33 741 35 464 37 488 Dette extérieure totale Private 4 003 4 376 4 541 4 351 4 475 4 858 5 602 5 652 4 300 Privée Public 18 221 20 296 20 565 22 656 23 972 27 015 28 139 29 812 33 188 Publique Total external debt service 142 250 310 282 307 174 330 301 663 Service de la dette extérieure Net Foreign Direct Investment Investissements étranger direct 713 1 349 1 511 2 305 3 541 2 436 2 601 3 034 ... Inflows (flux nets entrants) Net Total Official Development Aide publique au développement 343 613 992 1 823 2 044 2 112 2 384 2 289 ... assistance (nette totale) African Statistical Yearbook 2011 / Annuaire Statistique pour l'Afrique 2011
  • 310.
    Sudan Soudan 2002 2003 2004 2005 2006 2007 2008 2009 2010 Sudanese Pound (Millions) Pound Sudanais Exports, fob Exportations, fàb Exports - Total 1 949 2 542 3 778 4 824 5 657 8 879 11 671 7 834 ... Exportations - Total Main Products Principaux produits Benzene 207 185 285 466 774 653 321 402 ... Benzene Sesame 165 194 346 240 311 187 297 333 ... Sésame Gum Arabic 67 78 132 249 109 105 127 77 ... Gomme arabique Cotton 189 278 226 252 154 166 124 100 ... Coton Gold 125 130 120 159 165 120 254 199 ... Or Main Destinations Principales destinations China 3 512.6 4 217.7 5 964.0 8 083.4 9 364.3 14 668.0 20 274.6 13 805.8 ... Chine Japan 127.9 559.9 845.2 905.6 647.2 1 524.7 1 464.5 497.4 ... Japon Saudi Arabia 344.7 325.6 442.6 368.3 296.9 197.7 224.5 460.6 ... Arabie Saoudite United Arab Emirates 103.1 172.5 149.1 186.0 454.9 453.3 457.5 1 111.5 ... Émirats Arabes Unis United Kingdom 173.8 163.0 125.0 75.6 43.6 59.3 15.9 56.7 ... Royaume-Uni 2002 2003 2004 2005 2006 2007 2008 2009 2010 Imports, cif Importations, cif Imports - Total ... ... ... ... ... ... ... ... ... Importations - Total (millions) 309 Principaux produits Main Products Machinery and Equipment 1 635 568 2 791 4 803 6 102 6 441 6 397 6 069 ... Machines et équipements Manufactured Goods 1 462 1 901 2 574 3 965 3 563 3 914 4 051 5 796 ... Produits manufacturés Wheat and wheat flour 583 524 664 934 742 733 1 496 1 619 ... Blé et la farine de blé Petroleum products 348 388 262 784 899 587 1 487 757 ... Produits pétroliers Textile 370 336 452 16 458 17 529 17 689 627 795 ... Textile Main Origin Principales provenances Saudi Arabia 749.7 1 038.8 1 135.8 1 295.9 1 712.2 1 319.5 9 032.7 1 313.5 ... Arabie Saoudite United Arab Emirates 434.8 544.3 742.0 1 050.3 1 063.7 968.3 1 825.5 1 225.5 ... Émirats Arabes Unis China 658.7 814.6 1 440.7 315.1 3 598.2 4 910.6 4 713.9 4 481.9 ... Chine United Kingdom 344.9 400.8 512.6 847.6 900.4 505.1 2 477.8 465.2 ... Royaume-Uni Japan 341.0 374.4 620.6 1 300.4 1 532.9 741.4 1 572.8 1 044.3 ... Japon African Statistical Yearbook 2011 / Annuaire Statistique pour l'Afrique 2011
  • 311.
    Swaziland Swaziland AREA (KM 2) 17 364 SUPERFICIE (KM 2) CAPITAL CITY Mbabane Mbabane CAPITALE CURRENCY Lilangeni Lilangeni MONNAIE I SOCIAL AND DEMOGRAPHIC INDICATORS — INDICATEURS DEMOGRAPHIQUES ET SOCIAUX 2002 2003 2004 2005 2006 2007 2008 2009 2010 Population Population Population au milieu de l'année - Mid-year population - Total (Million) 1.1 1.1 1.1 1.1 1.1 1.0 1.0 1.0 1.0 Total (million) Population au milieu de l'année - Mid-year population - Urban (%) 22.0 22.0 22.0 22.0 22.0 22.0 28.5 28.5 29.0 Urbaine (%) Female (%) 52.3 52.2 52.1 52.0 51.9 51.7 51.6 51.4 51.5 Femme (%) Population by Age Group Population par groupe d'âge 0-14 434 900 441 600 448 800 456 300 464 000 471 800 479 600 488 500 492 897 0-14 15-64 590 400 608 400 624 200 637 800 649 100 658 100 665 100 669 900 675 929 15-64 65+ 30 700 31 200 31 700 32 300 33 000 33 700 34 500 35 300 35 617 65+ Active Population (000) 434.0 438.0 442.0 446.0 452.0 335.1 468.0 476.0 477.0 Population active (000) Female (%) 50.0 50.0 50.0 50.0 50.0 49.8 49.8 49.8 50.1 Femme (%) Taux brut de natalité - Total (par Crude birth rate - Total (per 1000) 32.0 31.6 31.2 30.9 30.5 30.3 29.9 29.6 29.2 1000) Taux brut de mortalité - Total (par Crude death rate - Total (per 1000) 14.8 15.4 15.8 16.0 16.0 18.0 15.6 15.4 15.1 1000) Life expectancy at birth - Total Espérance de vie à la naissance - 47.3 46.1 45.3 45.0 45.0 43.3 45.8 46.4 47.5 (years) Total (années) Net reproduction rate - (per Taux net de reproduction - (par ... ... ... 1.1 ... ... ... ... ... woman) femme) Indice synthétique de fécondité - Total fertility rate - (p woman) y (per ) 4.0 4.0 3.9 3.8 3.7 4.0 3.5 3.5 3.5 (par femme) Education Enseignement Teaching staff at first level - Total Personnel enseignant - 1er degré - 6.70 6.7 6.8 6.7 6.9 7.2 7.4 7.7 8.3 (thousands) Total (milliers) Teaching staff at second level - Total Personnel enseignant - 2ème degré - 310 3.80 4.1 3.8 4.2 4.0 4.4 4.5 4.7 4.9 (thousands) Total (milliers) Teaching staff at third level - Total Personnel enseignant - 3ème degré - ... ... ... ... ... ... ... ... ... (thousands) Total (milliers) First level student enrollment - Total Elèves inscrits - 1er degré - Total 209 209 218 222 230 233 230 230 239 (thousands) (milliers) First level student enrollment - Elèves inscrits - 1er degré - Femmes 102 101 105 107 110 111 111 112 113 Female (thousands) (milliers) Second level student enrollment - Elèves inscrits - 2ème degré - Total 62 62 67 71 77 83 81 85 88 Total (thousands) (milliers) Second level student enrollment - Elèves inscrits - 2ème degré - 31 31 33 36 39 39 39 42 43 Female (thousands) Femmes (milliers) Third level student enrollment - Total Elèves inscrits - 3ème degré - Total 5.2 5.4 6.6 5.9 5.7 ... ... ... ... (thousands) (milliers) Third level student enrollment - Elèves inscrits - 3ème degré - 2.8 2.9 3.5 3.1 2.8 ... ... ... ... Female (thousands) Femmes (milliers) Public expenditure on education (% Dépenses publiques consacrées à ... ... 26.9 24.6 24.4 24.5 19.4 22.1 24.0 of budget) l'enseignement (% du budget) Health Santé Hospital beds - Total (per 10 000 Nombre de lits d'hôpitaux - Total ... ... 613 ... ... ... ... ... ... population) (pour 10 000) Nurses - Total (per 10 000 Nombre d'infirmières - Total (pour ... ... ... ... ... ... 15 15 ... population) 10 000) Physicians - Total (per 10 000 Nombre de médecins - Total (pour ... ... 2 ... ... ... 1 1 ... population) 10 000) Public expenditure on Health (% of Dépenses publiques consacrées à la 11 9 12 13 11 10 7 10 11 budget) santé (% du budget) African Statistical Yearbook 2011 / Annuaire Statistique pour l'Afrique 2011
  • 312.
    Swaziland Swaziland II NATIONAL ACCOUNTS — COMPTES NATIONAUX 2002 2003 2004 2005 2006 2007 2008 2009 2010 Gross domestic product by kind of economic activity at current prices Produit intérieur brut par branche d'activité économique aux prix courants Lilangeni (Millions) Lilangeni(Millions) Agriculture 1 098 1 074 1 084 1 139 1 152 1 277 1 460 1 588 ... Agriculture Mining and quarrying 47 50 57 44 57 54 52 57 ... Industries extractives Manufacturing 4 177 4 578 4 820 5 042 6 078 6 686 7 816 8 519 ... Industries manufacturières Electricity, gas & water 101 108 125 132 139 149 175 188 ... Electricité, gaz et eau Construction 445 436 538 568 588 568 551 535 ... Bâtiments et travaux publics Wholesale & retail trade, Commerce de gros et de détail, 1 331 1 417 1 396 1 487 1 678 1 774 2 007 2 107 ... restaurants, hotels restaurants et hôtels Banques, assurances, affaires Finance, insurance, real estate, etc. 996 1 079 1 187 1 302 1 403 1 558 1 850 0 ... immobilières Transport and communications 649 732 787 861 972 1 199 1 363 2 642 ... Transport(s) et communications Administrations publiques et Public administration and defense 1 783 2 003 2 222 2 434 2 712 2 859 3 358 4 604 ... défense Other services 195 215 226 242 251 272 306 345 ... Autres services Moins Services d’intermédiation Less Imputed Service Charges - 193 - 212 - 258 - 300 - 332 - 372 - 432 - 431 ... financière Gross domestic product at factor Produit intérieur brut aux couts des 10 630 11 479 12 184 12 952 14 698 16 024 18 506 20 154 ... cost / basic prices facteurs / prix de base Plus: Indirect Taxes / taxes on Plus taxes indirectes/impôts sur les 2 274 2 546 3 453 3 481 5 264 5 491 6 441 6 634 ... products, less subsidies produits, moins les subventions Expenditure on Gross domestic product at current purchaser's values Emploi du produit intérieur brut aux prix courants d'acquisition Lilangeni (Millions) Lilangeni(Millions) Consommation finale des Government final consumption 2 066 2 084 2 364 2 501 2 771 3 041 3 338 3 663 ... administrations publiques Private final consumption 9 034 9 484 11 282 12 138 15 111 16 107 22 242 23 622 ... Consommation finale privée Gross fixed capital formation 2 491 2 590 2 388 2 471 2 558 2 644 2 756 2 757 ... Formation brute de capital fixe Increase in inventories ... ... ... ... ... ... ... ... ... Variation des stocks Exports of goods and services 12 351 14 158 13 280 14 308 15 294 16 281 14 741 14 875 ... Exportations de biens et services 311 Moins importations de biens et Less imports of goods and services 13 037 14 292 13 677 14 985 15 772 16 558 18 129 18 129 ... services GDP at purchasers' values 12 904 14 025 15 636 16 433 19 962 21 515 24 947 26 788 ... PIB aux prix d'acquisition Gross domestic product by kind of economic activity at constant Produit intérieur brut par branche d'activité economique aux prix constants prices Annual Growth Rates (%) Taux de croissance annuel (%) Agriculture 5.3 4.9 -2.9 5.4 -2.4 2.6 -0.1 -0.9 ... Agriculture Mining and quarrying 11.2 -20.1 9.0 -21.5 15.8 -39.1 -16.0 -30.0 ... Industries extractives Manufacturing 2.1 1.8 1.0 0.9 1.5 2.6 1.6 -3.1 ... Industries manufacturières Electricity, gas & water 14.2 2.3 -2.5 3.8 5.1 4.8 2.4 5.7 ... Electricité, gaz et eau Construction -10.7 -9.9 17.3 5.6 3.5 -3.4 -3.0 -2.6 ... Bâtiments et travaux publics Wholesale & retail trade, Commerce de gros et de -6.2 -0.5 8.8 8.2 10.6 9.6 4.4 -13.9 ... restaurants, hotels détail,restaurants et hôtels Banques, assurances, affaires Finance, insurance, real estate, etc. 6.1 3.7 1.9 2.9 3.2 3.6 4.3 30.4 ... immobilières Transport and communications 14.8 11.5 7.6 13.3 5.6 3.0 7.2 5.6 ... Transport(s) et communications Administrations publiques et Public administartion and defense 1.2 2.8 3.3 -4.3 5.8 4.4 1.8 3.7 ... défense Other services 2.0 2.0 2.0 2.3 2.4 3.7 3.0 3.5 ... Autres services Moins Services d’intérmediation Less Imputed Service Charges 11.8 6.9 3.4 4.3 4.3 3.5 3.0 7.5 ... financière Gross domestic product at factor Produit intérieur brut aux couts des 2.0 2.3 2.9 2.6 3.4 3.5 2.4 1.2 ... cost / basic prices facteurs / prix de base Plus: Indirect Taxes / taxes on Plus taxes indirectes/impôts sur les 0.9 1.8 3.1 1.8 2.8 3.4 2.1 1.3 ... products, less subsidies produits, moins les subventions Gross domestic product at market Produit intérieur brut aux prix du 1.8 2.2 2.9 2.5 3.3 3.5 2.4 1.2 ... prices marché African Statistical Yearbook 2011 / Annuaire Statistique pour l'Afrique 2011
  • 313.
    Swaziland Swaziland Expenditure on Gross domestic product at constant purchasers' Emplois du produit intérieur brut aux prix constants d'acquisition values Annual Growth Rates (%) Taux de croissance annuel (%) Consommation finale des Government final consumption -4.9 -3.3 4.8 2.8 -5.8 5.7 32.0 3.4 ... administrations publiques Private final consumption -4.5 -2.1 9.9 5.1 5.9 2.2 9.6 6.2 ... Consommation finale privée Gross fixed capital formation -7.4 -0.4 -14.8 0.6 -12.0 -0.4 18.9 -5.7 ... Formation brute de capital fixe Exports of goods and services 14.4 9.8 -13.3 4.7 -9.1 2.5 -6.3 -5.3 ... Exportations de biens et services Moins importations de biens et Less imports of goods and services 4.8 5.0 -11.5 6.5 -10.5 1.1 8.8 -0.3 ... services III INFLATION 2002 2003 2004 2005 2006 2007 2008 2009 2010 Annual Growth Rates (%) Taux de croissance annuel (%) All Item 11.7 7.4 3.4 4.8 5.3 8.1 12.6 7.6 4.5 Ensemble Food 21.8 12.6 6.9 9.1 14.7 17.6 18.9 10.2 0.4 Alimentation Health 6.7 3.6 2.9 0.1 0.1 3.7 2.9 5.3 2.1 Santé Energy 2.2 7.7 3.1 3.9 2.0 12.4 38.7 0.5 9.7 Energie Transport 10.8 4.6 0.4 5.4 6.8 8.8 28.4 1.8 5.0 Transport IV AGRICULTURAL PRODUCTION - PRODUCTION AGRICOLE 2002 2003 2004 2005 2006 2007 2008 2009 2010 Tons (Thousand) Tonnes (milliers) Sugar cane, metric tons 500 670 583 014 628 191 597 563 652 735 623 357 631 236 626 984 605 665 Canne à sucre, tonnes métriques Maize, metric tons 67 639 62 534 77 540 77 500 67 000 83 090 62 090 70 690 ... Maïs, tonnes métriques Citrus, metric tons 100 072 89 854 74 618 67 032 70 506 85 263 79 664 77 282 ... Agrumes, tonnes métriques Cotton, metric tons 6 000 3 959 1 221 3 168 984 720 394 1 566 ... Coton, tonnes métriques ... ... ... ... ... ... ... ... ... V MINING PRODUCTION - PRODUCTION MINIERE 312 2002 2003 2004 2005 2006 2007 2008 2009 2010 Coal, metric tons (thousands) 553 422.0 448 664.0 488 314.0 221 701.0 310 570.0 241 283.0 174 807.0 129 647.0 ... Houilles, tonnes métriques (milliers) Quarry stone, metric tons 283 175.0 224 129.0 230 062.0 566 772.0 534 688.0 207 535.0 240 997.0 202 319.0 ... Pierres taillées, tonnes métriques (thousands) (milliers) ... ... ... ... ... ... ... ... ... VI ENERGY - ENERGIE 2002 2003 2004 2005 2006 2007 2008 2009 2010 Electricity - total hydro production, Électricité - production hydraulique ... ... ... ... ... ... ... ... ... kilowatt hours (millions) totale, kilowatt-heures (millions) Electricity - total thermal production, Électricité - production thermique 203.6 123.0 103.5 159.5 125.8 134.2 149.0 153.0 ... kilowatt hours (millions) totale, kilowatt-heures (millions) Electricity - total production, self- Electricité - Production totale privée ... ... ... ... ... ... ... ... ... producer (Million Kilowatt Hours) (million de kilowatt heures) Electricity - total production, public Electricité - Production totale 204 123 104 160 126 134 149 153 ... (Million Kilowatt Hours) publique (million de kilowatt heures) African Statistical Yearbook 2011 / Annuaire Statistique pour l'Afrique 2011
  • 314.
    Swaziland Swaziland VII TOURISM AND INFRASTRUCTURE - TOURISME ET INFRASTUCTURE 2002 2003 2004 2005 2006 2007 2008 2009 2010 Arrivals - Tourists (thousands) 332.343 354.499 353.492 351.041 369.809 384.782 416.4 455.8 ... Arrivées - touristes (milliers) Rooms in hotels and similar Chambres d'hotels et établissements establishments (thousands) 420.754 478.788 477.363 454.157 456.253 582.602 591.5 656.2 573.149 assimilés (milliers) Paved Road (% of total) 20 20 29 33 38 38 38 38 38 Routes asphaltées (% du total) Total Network (Railways-km) 302 302 302 302 297 297 297 297 297 Réseau total voies ferrées-Km Main Telephone Lines (per 1,000 Lignes téléphoniques fixes (pour 34 37 38 38 37 40 41 42 ... inhabitants) 1000 habitants) Mobile Cellular Subscribers (per Abonnés aux téléphones mobiles 59 80 101 189 244 352 453 553 ... 1,000 inhabitants) (pour 1000 habitants) VII FINANCIAL AND MONETARY STATISTICS - FINANCES ET STATISTIQUES MONETAIRES 2002 2003 2004 2005 2006 2007 2008 2009 2010 VII-1 Monetary Statistics VII-1 Statistiques monétaires Lilangeni (Millions) Lilangeni(Millions) Money supply (M1) 806 1 034 1 081 1 295 1 358 1 667 1 972 2 337 2 539 Masse monétaire (M1) Quasi-money 1 777 1 921 2 082 2 175 2 982 3 605 4 111 5 376 5 784 Quasi-monnaie of which Demand Deposit ... ... ... ... ... ... ... ... ... dont Monnaie scripturale Net foreign assets 1 340 1 123 1 358 1 897 3 296 5 760 8 065 7 811 5 744 Avoirs extérieurs nets Domestic credit 1 928 2 334 2 811 2 833 2 681 1 390 454 2 273 4 668 Crédit intérieur of which claims on private sector 1 546 2 119 2 745 3 469 4 250 5 184 5 527 6 250 6 215 dont créances sur le secteur privé of which Claims on government dont créances nettes sur le 145 - 5 - 197 - 787 - 1 677 - 3 884 - 5 296 - 4 238 - 2 232 sector, net gouvernement International reserves (millions of US Réserves internationales (millions de 276 278 324 244 373 774 752 959 756 $) $ EU) Average Exchange Rate (National Taux de change (moyen) (monnaie 10.54 7.56 6.46 6.36 6.77 7.05 8.26 8.47 7.32 Currency per us $) nationale par dollars) VII-2 Public Finance VII-2 Finances publiques Lilangeni (Millions) Lilangeni(Millions) Total Revenues and Grants 3 627 3 952 4 894 5 681 8 192 9 085 9 426 10 139 ... Recettes totales et dons Tax Revenue 3 295 3 740 4 704 5 367 7 855 8 880 9 063 9 809 ... Recettes fiscales Non Tax Revenue 205 80 74 141 172 121 217 208 ... Recettes non fiscales Grants 127 132 116 172 166 83 145 122 ... Dons 313 Total Expenditures and Net Lending 3 517 4 400 5 534 6 014 6 118 7 615 9 547 10 001 ... Dépenses totales et prêts nets Current expenditure 2 650 3 488 4 247 4 475 4 681 5 728 7 209 7 502 ... Dépenses courantes Of which Wages and Salaries 1 163 1 659 1 947 2 401 2 589 3 177 3 924 4 025 ... Dont rémunérations et salaires Capital expenditure 867 806 1 275 1 410 1 437 1 887 2 338 2 499 ... Dépenses d'équipement Net Lending 0 106 12 129 0 0 0 0 ... Prêts nets Fiscal Balance 110 - 448 - 640 - 333 2 074 1 470 - 121 139 ... Solde global y compris les dons VII-3 Balance of Payments VII-3 Balance des paiements Lilangeni (Millions) Lilangeni(Millions) Trade balance 1 346 958 587 - 1 641 - 1 706 - 705 - 82 - 1 107 ... Balance commerciale Services Balance - 1 305 - 1 090 - 827 - 765 - 610 - 1 858 - 3 520 - 3 070 ... Balance des services Net Income 48 - 317 17 1 134 95 290 - 43 - 1 040 ... Revenus nets Current transfers, net total 659 1 136 683 620 890 1 290 1 732 1 620 ... Transferts courants Current account balance 748 687 461 - 653 - 1 332 - 984 - 1 912 - 3 597 ... Solde du compte courant VII-4 External Debt and Financial Flows VII-4 Dette extérieure et flux financiers US $ (Millions) $ E.U (Millions) Total external debt 415 451 520 409 394 470 427 542 ... Dette extérieure totale Private 95 106 70 63 64 68 51 53 ... Privée Public 320 345 450 345 330 403 377 489 ... Publique Total external debt service 29 43 47 38 41 42 43 63 ... Service de la dette extérieure Net Foreign Direct Investment Investissements étranger direct (flux 92 - 61 71 - 46 121 37 106 66 ... Inflows nets entrants) Net Total Official Development Aide publique au développement 22 40 25 47 35 51 70 58 ... assistance (nette totale) African Statistical Yearbook 2011 / Annuaire Statistique pour l'Afrique 2011
  • 315.
    Swaziland Swaziland 2002 2003 2004 2005 2006 2007 2008 2009 2010 Lilangeni (Millions) Lilangeni Exports, fob Exportations, fàb Exports - Total 10 848 12 609 11 667 10 407 11 260 12 293 12 959 13 270 ... Exportations - Total Main Products Principaux produits Mélanges de substances Mixtures of odoriferous substances 5 231 4 281 3 539 2 755 2 390 2 689 2 719 ... ... odoriférantes et mélanges, yc. solut and mixtures, incl. alcoholic solut alcoolisées Raw sugar cane 542 789 862 820 1 666 1 354 1 530 ... ... Canne à sucre, brut Unbleached coniferous chemical Écrus de bois de conifères de pâte 708 831 682 372 592 343 ... ... ... wood pulp, soda or sulphate chimique, soudé ou au sulfate T-shirts et maillots de corps avec T-shirts, singlets and other vests of 327 743 248 207 ... ... ... ... ... d'autres matières textiles, en textile materials, knitted bonneterie Produits, préparations et produits Products, preparations and residual ... ... ... 629 1 237 1 779 1 891 ... ... résiduaires des industries chimiques products of the chemical or allied ou des industries connexes Main Destinations Principales destinations South Africa 6 968.1 8 111.3 6 391.3 5 693.5 5 225.3 6 527.9 8 301.3 ... ... Afrique du Sud Mozambique 527.7 393.2 383.7 187.2 418.8 451.3 369.4 ... ... Mozambique U.S.A 919.9 1 457.5 1 045.6 699.6 1 004.0 385.2 254.5 ... ... Etats-Unis Kenya 329.2 ... 299.1 165.3 400.9 292.0 116.6 ... ... Kenya Australia 259.5 215.3 246.5 178.3 236.8 263.3 ... ... ... Australie 2002 2003 2004 2005 2006 2007 2008 2009 2010 Imports, cif Importations, cif 314 Imports - Total 11 238 12 377 11 574 7 962 9 906 10 082 10 624 ... ... Importations - Total (millions) Principaux produits Main Products Petrol 312 275 354 468 433 486 633 ... ... Pétrole Distillate Fuels 334 270 301 440 458 478 607 ... ... Combustibles distillés Motor cars and other motor vehicles Voitures, camionnettes et autres 225 310 182 186 160 174 134 ... ... véhicules automobiles pour le principally designed for the transport transport Dyed fabrics, knitted or crocheted, Tissus teints, en bonneterie, de 189 279 181 ... ... 147 ... ... ... of synthetic fibres fibres synthétiques Mélanges de substances Mixtures of odoriferous substances 761 792 1 802 872 178 ... ... ... ... odoriférantes et mélanges, yc. solut and mixtures, incl. alcoholic solut alcoolisées Main Origin Principales provenances South Africa 9 638.7 9 704.0 10 469.9 9 571.3 7 219.0 8 166.2 8 324.9 ... ... Afrique du Sud Hong Kong 274.8 174.8 126.5 93.5 75.0 ... ... ... ... Hong Kong Taiwan 505.3 399.6 299.3 260.0 299.5 196.4 169.6 ... ... Taiwan Japan 58.9 ... ... 44.4 95.6 66.7 48.3 ... ... Japon China 130.1 155.5 100.3 207.1 233.8 249.3 87.8 ... ... Chine African Statistical Yearbook 2011 / Annuaire Statistique pour l'Afrique 2011
  • 316.
    Tanzania Tanzanie AREA (KM 2) 945 090 SUPERFICIE (KM 2) CAPITAL CITY Dar es Salaam Dar es Salaam CAPITALE CURRENCY Tanzanian Shilling Shilling Tanzanien MONNAIE I SOCIAL AND DEMOGRAPHIC INDICATORS — INDICATEURS DEMOGRAPHIQUES ET SOCIAUX 2002 2003 2004 2005 2006 2007 2008 2009 2010 Population Population Population au milieu de l'année - Mid-year population - Total (Million) 36.0 36.9 37.9 39.0 40.1 41.3 42.5 43.7 ... Total (million) Population au milieu de l'année - Mid-year population - Urban (%) ... ... 24.0 24.0 25.0 25.0 25.0 25.9 ... Urbaine (%) Female (%) 50.3 50.3 50.3 50.2 50.2 50.2 50.2 50.1 ... Femme (%) Population by Age Group Population par groupe d'âge 0-14 16047 084 16468 495 16915 701 17390 286 17892 293 18420 761 18974 457 19551 402 ... 0-14 15-64 18852 583 19364 829 19893 641 20439 808 21005 350 21592 212 22200 874 22831 403 ... 15-64 65+ 1057 907 1096 325 1136 132 1177 265 1219 598 1263 234 1308 595 1356 247 ... 65+ Active Population (000) 17 728.0 18 194.0 18 683.0 19 199.0 19 749.0 20 362.0 20 985.0 21 644.0 ... Population active (000) Female (%) 49.9 49.9 49.9 49.9 49.9 49.7 49.7 49.7 ... Femme (%) Taux brut de natalité - Total (par Crude birth rate - Total (per 1000) 41.8 41.9 41.9 41.9 41.8 41.7 41.5 40.0 ... 1000) Taux brut de mortalité - Total (par Crude death rate - Total (per 1000) 13.5 13.1 12.8 12.4 12.0 11.7 11.4 14.0 ... 1000) Life expectancy at birth - Total Espérance de vie à la naissance - 51.7 52.3 53.0 53.7 54.3 55.0 55.7 56.3 58.1 (years) Total (années) Net reproduction rate - (per Taux net de reproduction - (par ... ... ... 2.1 ... ... ... ... ... woman) femme) Indice synthétique de fécondité - Total fertility rate - (per woman) 5.7 5.7 5.6 5.6 5.6 5.6 5.6 5.2 ... (par femme) Education Enseignement Teaching staff at first level - Total Personnel enseignant - 1er degré - ... ... ... ... ... ... ... ... ... (thousands) Total (milliers) Teaching staff at second level - Personnel enseignant - 2ème degré - ... ... ... ... ... ... ... ... ... Total (thousands) Total (milliers) Teaching staff at third level - Total Personnel enseignant - 3ème degré - 315 ... ... ... ... ... ... ... ... ... (thousands) Total (milliers) First level student enrollment - Total Elèves inscrits - 1er degré - Total ... ... ... ... ... ... ... ... ... (thousands) (milliers) First level student enrollment - Elèves inscrits - 1er degré - Femmes 2 929 3 197 3 457 3 685 3 908 4 102 4 244 ... ... Female (thousands) (milliers) Second level student enrollment - Elèves inscrits - 2ème degré - Total ... ... ... 524 676 1 021 1 222 1 466 ... Total (thousands) (milliers) Second level student enrollment - Elèves inscrits - 2ème degré - ... ... ... ... ... ... ... ... ... Female (thousands) Femmes (milliers) Third level student enrollment - Elèves inscrits - 3ème degré - Total 26.5 31.0 42.9 51.1 ... 55.1 ... ... ... Total (thousands) (milliers) Third level student enrollment - Elèves inscrits - 3ème degré - 6.2 9.5 12.5 16.5 ... 17.8 ... ... ... Female (thousands) Femmes (milliers) Public expenditure on education (% Dépenses publiques consacrées à ... ... ... ... ... ... ... ... ... of budget) l'enseignement (% du budget) Health Santé Hospital beds - Total (per 10 000 Nombre de lits d'hôpitaux - Total 2 4 4 4 4 4 4 4 ... population) (pour 10 000) Nurses - Total (per 10 000 Nombre d'infirmières - Total (pour ... ... ... ... ... ... ... ... ... population) 10 000) Physicians - Total (per 10 000 Nombre de médecins - Total (pour 2 4 4 4 5 5 ... ... ... population) 10 000) Public expenditure on Health (% of Dépenses publiques consacrées à la 9 13 14 15 14 ... ... ... ... budget) santé (% du budget) African Statistical Yearbook 2011 / Annuaire Statistique pour l'Afrique 2011
  • 317.
    Tanzania Tanzanie II NATIONAL ACCOUNTS — COMPTES NATIONAUX 2002 2003 2004 2005 2006 2007 2008 2009 2010 Gross domestic product by kind of economic activity at current prices Produit intérieur brut par branche d'activité économique aux prix courants Tanzanian Shilling (Millions) Shilling Tanzanien(Millions) Agriculture 3 161 372 3 667 339 4 323 469 4 636 136 4 950 010 5 690 446 6 671 068 7 344 928 ... Agriculture Mining and quarrying 220 000 288 200 357 368 457 431 576 363 742 932 839 513 941 094 ... Industries extractives Manufacturing 866 228 1 002 827 1 129 558 1 269 145 1 395 282 1 625 504 1 935 975 2 434 754 ... Industries manufacturières Electricity, gas & water 258 306 281 006 306 451 340 530 352 724 420 880 514 526 584 031 ... Electricité, gaz et eau Construction 707 025 966 452 1 105 886 1 249 651 1 399 609 1 641 741 1 904 420 2 233 885 ... Bâtiments et travaux publics Wholesale & retail trade, Commerce de gros et de détail, 1 567 469 1 741 410 1 913 082 2 147 243 2 504 005 2 976 228 3 524 919 3 976 910 ... restaurants, hotels restaurants et hôtels Banques, assurances, affaires Finance, insurance, real estate, etc. 1 187 804 1 340 018 1 499 478 1 785 370 2 023 305 2 327 107 2 782 255 3 010 262 ... immobilières Transport and communications 657 206 739 600 844 597 983 507 1 144 071 1 373 976 1 648 958 2 005 866 ... Transport(s) et communications Administrations publiques et Public administration and defense 754 654 866 917 1 076 215 1 278 881 1 440 913 1 652 556 2 026 815 2 282 763 ... défense Other services 450 269 486 968 537 075 591 596 661 604 746 757 863 640 1 024 272 ... Autres services Moins Services d’intermédiation Less Imputed Service Charges - 90 400 - 105 382 - 120 588 - 141 723 - 169 661 - 208 281 - 260 029 - 328 478 ... financière Gross domestic product at factor Produit intérieur brut aux couts des 9 739 933 11 275 355 12 972 591 14 597 767 16 278 225 18 989 844 22 452 059 25 510 287 ... cost / basic prices facteurs / prix de base Plus: Indirect Taxes / taxes on Plus taxes indirectes/impôts sur les 704 574 831 707 999 001 1 367 527 1 663 043 1 958 559 2 329 620 2 702 359 ... products, less subsidies produits, moins les subventions Expenditure on Gross domestic product at current purchaser's values Emploi du produit intérieur brut aux prix courants d'acquisition Tanzanian Shilling (Millions) Shilling Tanzanien(Millions) Consommation finale des Government final consumption 1 372 744 1 858 769 2 361 721 2 804 521 3 144 881 4 038 989 4 321 718 4 926 759 ... administrations publiques Private final consumption 7 512 354 8 442 113 9 352 717 10 581 908 12 195 212 14 231 135 16 460 068 18 476 811 ... Consommation finale privée Gross fixed capital formation 1 750 816 2 277 151 3 095 522 3 936 683 4 883 490 6 119 013 7 274 314 8 020 970 ... Formation brute de capital fixe Increase in inventories 44 596 43 387 57 845 64 405 74 292 90 728 106 943 152 252 ... Variation des stocks Exports of goods and services 1 836 223 2 247 385 2 745 596 3 324 425 4 047 990 5 078 248 6 230 729 6 553 198 ... Exportations de biens et services Moins importations de biens et 316 Less imports of goods and services 2 072 225 2 761 744 3 641 808 4 746 646 6 404 597 8 609 710 9 612 093 9 917 343 ... services GDP at purchasers' values 10 444 507 12 107 062 13 971 592 15 965 294 17 941 268 20 948 403 24 781 679 28 212 646 ... PIB aux prix d'acquisition Gross domestic product by kind of economic activity at constant prices Produit intérieur brut par branche d'activité economique aux prix constants Annual Growth Rates (%) Taux de croissance annuel (%) Agriculture 5.0 3.2 5.9 4.4 3.9 4.0 4.6 3.2 ... Agriculture Mining and quarrying 16.9 17.1 16.0 16.1 15.6 10.7 2.5 1.2 ... Industries extractives Manufacturing 7.5 9.0 9.4 9.6 8.5 8.7 9.9 8.0 ... Industries manufacturières Electricity, gas & water 5.6 6.7 7.1 8.5 -0.5 10.1 5.6 7.9 ... Electricité, gaz et eau Construction 11.9 13.8 13.0 10.1 9.5 9.7 10.5 7.5 ... Bâtiments et travaux publics Wholesale & retail trade, Commerce de gros et de 8.0 8.6 5.4 6.5 8.7 9.0 9.2 7.1 ... restaurants, hotels détail,restaurants et hôtels Banques, assurances, affaires Finance, insurance, real estate, etc. 7.5 7.1 7.0 8.0 7.9 7.5 7.8 7.1 ... immobilières Transport and communications 6.8 7.1 10.5 9.4 8.6 10.1 10.8 11.0 ... Transport(s) et communications Administrations publiques et Public administartion and defense 9.2 9.6 13.6 11.4 6.5 6.7 7.0 4.4 ... défense Other services 6.5 4.5 5.0 5.1 6.0 6.2 7.0 6.3 ... Autres services Moins Services d’intérmediation Less Imputed Service Charges 8.7 11.7 10.1 11.8 14.9 15.3 11.0 8.7 ... financière Gross domestic product at factor Produit intérieur brut aux couts des 7.2 6.9 7.8 7.4 6.7 7.2 7.4 6.0 ... cost / basic prices facteurs / prix de base Plus: Indirect Taxes / taxes on Plus taxes indirectes/impôts sur les 7.2 6.9 7.8 7.4 6.8 6.9 7.8 5.8 ... products, less subsidies produits, moins les subventions Gross domestic product at market Produit intérieur brut aux prix du 7.2 6.9 7.8 7.4 6.7 7.1 7.4 6.0 ... prices marché 2009: Provisional 2009: provisoire African Statistical Yearbook 2011 / Annuaire Statistique pour l'Afrique 2011
  • 318.
    Tanzania Tanzanie Expenditure on Gross domestic product at constant purchasers' values Emplois du produit intérieur brut aux prix constants d'acquisition Annual Growth Rates (%) Taux de croissance annuel (%) Consommation finale des Government final consumption 18.4 29.0 14.6 11.9 8.2 9.5 13.2 5.1 ... administrations publiques Private final consumption 5.7 2.7 6.2 11.2 8.1 6.0 4.9 3.4 ... Consommation finale privée Gross fixed capital formation 7.9 14.0 10.4 18.7 16.0 14.5 7.8 10.0 ... Formation brute de capital fixe Exports of goods and services 7.7 19.5 8.3 13.5 -3.3 16.8 19.6 5.1 ... Exportations de biens et services Moins importations de biens et Less imports of goods and services 9.1 21.5 9.6 34.2 10.3 16.3 12.3 2.6 ... services III INFLATION 2002 2003 2004 2005 2006 2007 2008 2009 2010 Annual Growth Rates (%) Taux de croissance annuel (%) All Item 5.3 5.3 4.7 5.0 7.3 7.0 10.3 12.1 8.9 Ensemble Food 8.2 6.6 8.3 4.7 7.0 7.0 12.7 17.5 -28.4 Alimentation Health 2.1 1.7 -8.5 2.3 11.2 2.9 5.0 6.8 -1.7 Santé Energy 6.4 4.1 7.1 12.7 8.5 6.1 10.7 -1.7 0.2 Energie Transport -2.5 3.7 0.8 7.9 9.1 7.0 6.9 0.0 -3.0 Transport IV AGRICULTURAL PRODUCTION - PRODUCTION AGRICOLE 2002 2003 2004 2005 2006 2007 2008 2009 2010 Tons (Thousand) Tonnes (milliers) Maize, Tons (thousands) 2 705 2 322 3 157 3 219 3 423 3 302 3 556 3 326 ... Maïs, tonnes (milliers) Sorghum, Tons (thousands) 834 488 757 714 712 971 861 709 ... Sorgho, tonnes (milliers) Paddy, Tons (thousands) 985 1 096 1 059 1 168 1 239 1 342 1 346 1 334 ... Riz, tonnes (milliers) Wheat, Tons (thousands) 77 74 67 102 110 83 92 95 ... Blé, tonnes (milliers) Cassava, Tons (thousands) 5 176 3 962 4 441 5 539 6 158 5 199 5 392 5 916 ... Manioc, tonnes (milliers) V MINING PRODUCTION - PRODUCTION MINIERE 317 2002 2003 2004 2005 2006 2007 2008 2009 2010 Hard coal, metric tons (thousands) 79 210.0 54 610.0 65 041.0 74 800.0 17 940.0 27 198.0 15 242.0 ... ... Houilles, tonnes métriques (milliers) Gold ores and concentrates, 43 320.0 48 018.0 48 176.0 52 236.0 39 750.0 40 193.0 36 434.0 39 112.0 ... Minerais d'or et leurs concentrés, kilograms (thousands) kilogrammes (milliers) Silver ores and concentrates, Minerais d'argent et leurs 6 990.0 7 986.0 13 216.0 12 891.0 14 906.0 12 381.0 10 388.0 8 231.0 ... kilograms (thousands) concentrés, kilogrammes (milliers) VI ENERGY - ENERGIE 2002 2003 2004 2005 2006 2007 2008 2009 2010 Electricity - total hydro production, Électricité - production hydraulique 2 719.0 2 548.0 2 356.0 1 778.0 1 436.0 2 511.0 ... ... ... kilowatt hours (millions) totale, kilowatt-heures (millions) Electricity - total thermal production, Électricité - production thermique 135.0 110.0 537.0 1 257.0 1 340.0 1 664.0 ... ... ... kilowatt hours (millions) totale, kilowatt-heures (millions) Electricity - total production, self- Electricité - Production totale privée 105 73 86 99 106 113 ... ... ... producer (Million Kilowatt Hours) (million de kilowatt heures) Electricity - total production, public Electricité - Production totale 2 749 2 585 2 807 2 936 2 670 4 062 ... ... ... (Million Kilowatt Hours) publique (million de kilowatt heures) African Statistical Yearbook 2011 / Annuaire Statistique pour l'Afrique 2011
  • 319.
    Tanzania Tanzanie VII TOURISM AND INFRASTRUCTURE - TOURISME ET INFRASTUCTURE 2002 2003 2004 2005 2006 2007 2008 2009 2010 Arrivals - Tourists (thousands) 575 576 582 613 644 719 765 714 ... Arrivées - touristes (milliers) Rooms in hotels and similar Chambres d'hotels et établissements establishments (thousands) 25 31 31 31 32 32 32 32 ... assimilés (milliers) Paved Road (% of total) ... 9 ... ... ... ... ... ... ... Routes asphaltées (% du total) Total Network (Railways-km) 4 582 4 582 4 582 4 582 4 460 4 460 4 460 4 460 4 460 Réseau total voies ferrées-Km Main Telephone Lines (per 1,000 Lignes téléphoniques fixes (pour 4 4 4 4 4 4 3 ... ... inhabitants) 1000 habitants) Mobile Cellular Subscribers (per Abonnés aux téléphones mobiles 6 13 19 30 56 83 130 175 ... 1,000 inhabitants) (pour 1000 habitants) VII FINANCIAL AND MONETARY STATISTICS - FINANCES ET STATISTIQUES MONETAIRES 2002 2003 2004 2005 2006 2007 2008 2009 2010 VII-1 Monetary Statistics VII-1 Statistiques monétaires Tanzanian Shilling (Millions) Shilling Tanzanien(Millions) Money supply (M1) 1 311 852 1 525 606 1 864 654 2 469 469 2 918 840 3 580 780 4 289 750 4 855 670 6 297 080 Masse monétaire (M1) Quasi-money 1 043 720 1 253 230 1 289 130 1 781 260 2 245 620 2 642 800 3 169 030 3 924 470 4 715 500 Quasi-monnaie of which Demand Deposit ... ... ... ... ... ... ... ... ... dont Monnaie scripturale Net foreign assets 1 620 140 2 272 050 2 497 430 2 666 310 3 613 810 3 674 850 4 076 150 4 930 810 6 086 250 Avoirs extérieurs nets Domestic credit 925 289 883 987 1 040 600 1 846 350 2 027 510 2 831 370 4 221 200 5 120 250 6 798 550 Crédit intérieur of which claims on private sector 713 854 978 615 1 291 080 1 625 440 2 285 720 3 119 090 3 984 320 4 326 350 5 235 710 dont créances sur le secteur privé of which Claims on government dont créances nettes sur le 200 763 - 108 545 - 272 124 192 072 - 282 629 - 319 844 - 334 967 128 358 806 665 sector, net gouvernement International reserves (millions of US Réserves internationales (millions de 1 529 2 038 2 296 2 049 2 259 2 886 2 863 3 470 3 905 $) $ EU) Average Exchange Rate (National Taux de change (moyen) (monnaie 966.58 1 038.42 1 089.33 1 128.93 1 251.90 1 245.04 1 196.31 1 320.31 1 409.27 Currency per us $) nationale par dollars) VII-2 Public Finance VII-2 Finances publiques Tanzanian Shilling (Millions) Shilling Tanzanien(Millions) Total Revenues and Grants 1 426 424 1 839 819 1 954 192 2 766 685 3 168 266 3 710 569 5 207 776 5 550 358 7 325 015 Recettes totales et dons Tax Revenue 938 478 1 105 746 1 342 798 1 615 248 1 946 433 2 529 439 3 359 250 4 043 674 4 840 877 Recettes fiscales Non Tax Revenue 104 467 111 771 116 505 158 462 178 411 209 583 275 331 249 401 393 192 Recettes non fiscales Grants 383 479 622 302 494 889 992 975 1 043 422 971 547 1 573 195 1 257 283 2 090 946 Dons 318 Total Expenditures and Net Lending 1 466 138 1 989 547 2 516 941 3 164 216 3 972 608 4 474 680 5 208 996 6 811 827 8 862 431 Dépenses totales et prêts nets Current expenditure 1 001 138 1 388 870 1 671 580 1 949 770 2 443 001 2 921 907 3 133 191 4 438 790 5 629 000 Dépenses courantes Of which Wages and Salaries 341 982 397 770 462 963 550 554 656 789 976 094 1 134 709 1 608 591 1 766 000 Dont rémunérations et salaires Capital expenditure 344 611 500 897 736 828 1 230 862 1 310 745 1 337 211 1 810 972 2 130 368 2 825 431 Dépenses d'équipement Net Lending 0 0 0 - 159 701 0 0 0 0 0 Prêts nets Fiscal Balance - 39 714 - 149 728 - 562 749 - 397 531 - 804 342 - 764 111 - 1 220 -1 261 469 -1 537 416 Solde global y compris les dons VII-3 Balance of Payments VII-3 Balance des paiements Tanzanian Shilling (Millions) Shilling Tanzanien(Millions) Trade balance - 543 658 - 950 405 -1 226 618 -2 006 064 -2 944 790 -3 696 857 -4 157 425 -3 845 289 ... Balance commerciale Services Balance 293 677 212 027 125 983 184 110 466 960 549 952 262 031 447 819 ... Balance des services Net Income - 123 387 - 123 885 - 131 857 - 83 052 - 75 680 - 89 727 - 110 706 - 94 116 ... Revenus nets Current transfers, net total 371 902 438 514 642 174 615 817 667 160 848 242 966 364 726 789 ... Transferts courants Current account balance - 1 466 - 423 749 - 590 318 -1 289 190 -1 886 351 -2 388 389 -3 039 736 -2 764 797 ... Solde du compte courant VII-4 External Debt and Financial Flows VII-4 Dette extérieure et flux financiers US $ (Millions) $ E.U (Millions) Total external debt 5 478 6 119 6 225 6 358 6 520 6 673 6 834 7 007 7 171 Dette extérieure totale Private 920 707 547 583 4 555 3 877 3 039 0 ... Privée Public 4 558 5 412 5 678 5 775 1 965 2 796 3 795 7 007 ... Publique Total external debt service 223 187 213 199 138 4 668 68 100 ... Service de la dette extérieure Net Foreign Direct Investment Investissements étranger direct 388 308 331 494 597 647 679 645 ... Inflows (flux nets entrants) Net Total Official Development Aide publique au développement 1 269 1 724 1 767 1 498 1 814 2 820 2 331 2 934 ... assistance (nette totale) African Statistical Yearbook 2011 / Annuaire Statistique pour l'Afrique 2011
  • 320.
    Tanzania Tanzanie 2002 2003 2004 2005 2006 2007 2008 2009 2010 US $ (Millions) Shilling Tanzanien Exports, fob Exportations, fàb Exports - Total 1 087 1 403 1 749 2 120 2 608 3 134 3 748 ... ... Exportations - Total Main Products Principaux produits Coffee 341 51 53 89 93 143 124 149 ... Café Cotton 35 42 54 77 57 50 96 115 ... Coton Sisal 56 9 11 14 14 23 32 57 ... Sisal Tea 29 26 32 30 41 49 50 88 ... Thé Tobacco 47 47 66 149 127 138 210 117 ... Tabac Main Destinations Principales destinations Switzerland 84.8 13.0 32.4 163.2 494.0 627.6 743.7 896.8 ... Suisse China 6.6 3.9 76.8 110.8 208.2 344.3 319.3 523.9 ... Chine India 105.4 75.2 110.5 88.8 79.2 114.9 203.7 242.6 ... Inde Kenya 54.4 81.2 91.3 89.9 126.7 162.2 295.0 237.1 ... Kenya South Africa 40.1 38.8 124.0 328.2 343.5 289.2 272.9 236.5 ... Afrique du Sud 2002 2003 2004 2005 2006 2007 2008 2009 2010 Imports, cif Importations, cif Imports - Total ... ... ... ... ... ... ... ... ... Importations - Total (millions) 319 Principaux produits Main Products Petroleum oils&oils obtained from Huiles de pétrole, bitumineux, bituminous minerals,o/than crude 74 102 130 267 315 356 693 ... ... distilles, sauf brut etc Huile de palme et ses fractions, Palm oil and its fractions refined but 56 72 76 57 93 153 122 ... ... raffinées, mais non chimiquement not chemically modified modifiées Medicaments nes, in dosage 24 43 52 71 64 151 100 ... ... Médicaments nda, en dosage Parts of electrical apparatus for line Parties d'appareils électriques pour 4 8 3 8 9 59 99 ... ... la téléphonie en ligne ou télégraphie telephone or line telegraphy par fil Wheat nes and meslin 3 1 43 62 89 110 75 ... ... Blé nda et méteil Main Origin Principales provenances India 121.4 174.2 235.4 213.8 302.0 635.0 1 023.6 999.5 ... Inde China 192.3 120.8 186.8 250.1 386.2 518.6 853.8 895.0 ... Chine South Africa 112.9 318.6 366.7 451.5 716.8 820.6 980.9 888.0 ... Afrique du Sud United Arab Emirates 107.0 152.5 201.2 231.0 641.0 1 063.3 1 157.7 816.8 ... Emirats arabes unis Japan 0.0 176.5 196.8 234.8 324.6 360.6 435.3 546.0 ... Japon African Statistical Yearbook 2011 / Annuaire Statistique pour l'Afrique 2011
  • 321.
    Togo Togo AREA (KM 2) 56 790 SUPERFICIE (KM 2) CAPITAL CITY Lome Lomé CAPITALE CURRENCY CFA Franc Franc CFA MONNAIE I SOCIAL AND DEMOGRAPHIC INDICATORS — INDICATEURS DEMOGRAPHIQUES ET SOCIAUX 2002 2003 2004 2005 2006 2007 2008 2009 2010 Population Population Population au milieu de l'année - Mid-year population - Total (Million) 5.6 5.7 5.8 6.0 6.1 6.3 6.5 6.6 ... Total (million) Population au milieu de l'année - Mid-year population - Urban (%) ... ... 39.0 40.0 41.0 41.0 42.0 42.7 ... Urbaine (%) Female (%) 51.0 51.0 51.0 50.5 50.5 50.5 50.5 50.5 ... Femme (%) Population by Age Group Population par groupe d'âge 0-14 2160 030 2211 650 2265 050 2319 340 2252 214 2306 230 2361 512 2418 000 ... 0-14 15-64 2480 394 2539 670 2600 990 2663 332 2849 958 2918 310 2988 264 3060 000 ... 15-64 65+ 213 576 218 680 223 960 229 328 234 828 240 460 246 224 252 000 ... 65+ Active Population (000) 2 158.0 2 220.0 2 283.0 2 349.0 4 205.6 2 485.0 2 559.0 2 635.0 ... Population active (000) Female (%) 38.4 38.4 38.4 38.4 38.4 38.2 38.2 38.2 ... Femme (%) Taux brut de natalité - Total (par Crude birth rate - Total (per 1000) 37.0 37.0 37.0 37.0 37.0 37.0 37.0 37.0 37.0 1000) Taux brut de mortalité - Total (par Crude death rate - Total (per 1000) 13.0 13.0 13.0 13.0 13.0 13.0 13.0 13.0 13.0 1000) Life expectancy at birth - Total Espérance de vie à la naissance - ... 54.3 55.0 54.2 61.8 62.2 62.6 62.9 ... (years) Total (années) Net reproduction rate - (per Taux net de reproduction - (par ... ... ... 2.0 ... ... ... ... ... woman) femme) Indice synthétique de fécondité - Total fertility rate - (p woman) y (per ) 4.9 4.8 4.7 4.6 4.5 4.4 4.3 4.2 ... (par femme) Education Enseignement Teaching staff at first level - Total Personnel enseignant - 1er degré - 27.77 27.5 25.2 29.7 28.0 26.1 25.5 ... ... (thousands) Total (milliers) Teaching staff at second level - Total Personnel enseignant - 2ème degré - 320 6.82 7.0 7.4 9.3 7.6 6.6 7.6 ... ... (thousands) Total (milliers) Teaching staff at third level - Total Personnel enseignant - 3ème degré - 1.7 2.0 2.1 2.3 1.7 2.8 2.8 ... ... (thousands) Total (milliers) First level student enrollment - Total Elèves inscrits - 1er degré - Total 978 975 985 997 1 052 1 022 1 055 ... ... (thousands) (milliers) First level student enrollment - Elèves inscrits - 1er degré - Femmes 439 441 449 458 487 474 ... ... ... Female (thousands) (milliers) Second level student enrollment - Elèves inscrits - 2ème degré - Total 262 285 304 377 402 377 320 ... ... Total (thousands) (milliers) Second level student enrollment - Elèves inscrits - 2ème degré - 90 100 108 130 141 127 119 ... ... Female (thousands) Femmes (milliers) Third level student enrollment - Total Elèves inscrits - 3ème degré - Total 47.3 49.5 51.7 64.7 72.8 81.0 88.7 ... ... (thousands) (milliers) Third level student enrollment - Elèves inscrits - 3ème degré - 10.2 10.9 11.8 15.9 18.1 20.3 22.7 ... ... Female (thousands) Femmes (milliers) Public expenditure on education (% Dépenses publiques consacrées à 27.1 28.2 28.7 18.7 16.6 17.2 15.8 ... ... of budget) l'enseignement (% du budget) Health Santé Hospital beds - Total (per 10 000 Nombre de lits d'hôpitaux - Total 11 9 9 8 10 ... ... ... ... population) (pour 10 000) Nurses - Total (per 10 000 Nombre d'infirmières - Total (pour ... ... 35 ... ... ... ... ... ... population) 10 000) Physicians - Total (per 10 000 Nombre de médecins - Total (pour 0 1 1 1 1 ... ... ... ... population) 10 000) Public expenditure on Health (% of Dépenses publiques consacrées à la ... ... ... ... ... ... ... ... ... budget) santé (% du budget) African Statistical Yearbook 2011 / Annuaire Statistique pour l'Afrique 2011
  • 322.
    Togo Togo II NATIONAL ACCOUNTS — COMPTES NATIONAUX 2002 2003 2004 2005 2006 2007 2008 2009 2010 Gross domestic product by kind of economic activity at current prices Produit intérieur brut par branche d'activité économique aux prix courants CFA Franc (Millions) Franc CFA (Millions) Agriculture 392 442 348 096 370 669 437 038 421 603 436 667 578 603 636 102 665 306 Agriculture Mining and quarrying 32 399 35 340 29 875 33 042 32 522 31 818 59 114 48 187 41 015 Industries extractives Manufacturing 93 370 88 409 83 905 95 309 106 649 111 084 120 089 118 087 124 716 Industries manufacturières Electricity, gas & water 38 874 33 172 35 655 36 093 35 669 38 272 38 861 38 937 44 291 Electricité, gaz et eau Construction 22 939 22 173 26 032 27 336 37 362 44 855 39 382 33 508 41 130 Bâtiments et travaux publics Wholesale & retail trade, Commerce de gros et de détail, 120 744 112 848 126 845 124 197 131 263 135 688 131 060 116 017 131 339 restaurants, hotels restaurants et hôtels Banques, assurances, affaires Finance, insurance, real estate, etc. 98 252 92 216 98 702 103 794 109 270 114 022 128 519 127 996 142 973 immobilières Transport and communications 51 392 55 659 57 892 56 850 69 094 71 267 73 285 78 618 87 723 Transport(s) et communications Administrations publiques et Public administration and defense 98 387 97 295 96 567 92 924 96 222 94 668 103 204 138 908 124 991 défense Other services 23 287 24 035 24 840 25 839 26 708 27 660 28 653 29 704 30 813 Autres services Moins Services d’intermédiation Less Imputed Service Charges - 18 047 - 17 052 - 18 000 - 19 685 - 20 629 - 21 643 - 25 482 - 26 718 - 28 125 financière Gross domestic product at factor Produit intérieur brut aux couts des 954 038 892 191 932 981 1 012 739 1 045 734 1 084 358 1 275 289 1 339 345 1 406 173 cost / basic prices facteurs / prix de base Plus: Indirect Taxes / taxes on Plus taxes indirectes/impôts sur les 72 210 80 452 90 230 100 333 114 378 128 467 143 240 150 714 155 500 products, less subsidies produits, moins les subventions Expenditure on Gross domestic product at current purchaser's values Emploi du produit intérieur brut aux prix courants d'acquisition CFA Franc (Millions) Franc CFA (Millions) Consommation finale des Government final consumption 122 627 126 974 135 575 150 352 157 941 148 789 190 304 211 432 194 192 administrations publiques Private final consumption 878 300 850 897 910 522 1 098 179 1 086 463 1 109 618 1 215 199 1 231 014 1 392 597 Consommation finale privée Gross fixed capital formation 158 024 166 628 169 182 183 067 194 845 174 195 203 294 248 678 264 895 Formation brute de capital fixe Increase in inventories 13 298 - 17 111 - 11 584 5 259 6 464 2 894 47 379 30 092 12 169 Variation des stocks Exports of goods and services 358 431 402 485 396 709 441 602 507 415 451 979 508 641 529 428 551 908 Exportations de biens et services Moins importations de biens et 321 Less imports of goods and services 504 431 557 230 577 193 765 387 793 016 674 650 746 288 760 585 854 088 services GDP at purchasers' values 1 026 248 972 643 1 023 211 1 113 072 1 160 112 1 212 824 1 418 529 1 490 059 1 561 673 PIB aux prix d'acquisition Gross domestic product by kind of economic activity at constant Produit intérieur brut par branche d'activité economique aux prix constants prices Annual Growth Rates (%) Taux de croissance annuel (%) Agriculture 7.2 2.3 -1.4 -2.1 4.9 3.3 3.7 8.2 3.3 Agriculture Mining and quarrying 17.0 63.2 -22.5 -2.5 2.9 -25.6 -12.0 -0.2 11.0 Industries extractives Manufacturing 6.8 -8.9 0.3 7.1 9.1 2.2 8.1 -7.1 0.5 Industries manufacturières Electricity, gas & water 10.6 -22.4 13.5 11.0 -9.3 -11.0 10.4 12.3 3.7 Electricité, gaz et eau Construction -4.8 1.3 17.7 4.7 27.4 -1.0 17.1 12.2 2.6 Bâtiments et travaux publics Wholesale & retail trade, Commerce de gros et de -23.9 20.8 12.8 3.8 -22.3 -0.2 -8.6 -4.6 12.4 restaurants, hotels détail,restaurants et hôtels Banques, assurances, affaires Finance, insurance, real estate, etc. -46.7 -14.7 31.9 11.8 96.7 1.8 -2.2 -1.6 9.8 immobilières Transport and communications 2.7 12.1 14.2 2.3 -3.6 16.8 11.3 4.4 2.3 Transport(s) et communications Administrations publiques et Public administartion and defense 1.1 -2.3 3.2 -4.0 1.7 -2.7 -4.1 1.6 7.7 défense Other services 0.0 2.2 3.3 3.2 5.1 2.7 2.4 3.0 2.8 Autres services Moins Services d’intérmediation Less Imputed Service Charges -47.5 -19.0 27.4 18.3 331.8 6.4 -16.9 -13.2 105.9 financière Gross domestic product at factor Produit intérieur brut aux couts des -1.9 4.0 2.8 1.0 2.5 0.7 3.0 4.0 2.1 cost / basic prices facteurs / prix de base Plus: Indirect Taxes / taxes on Plus taxes indirectes/impôts sur les 7.3 15.2 0.1 3.6 18.4 14.6 -2.7 -2.9 15.7 products, less subsidies produits, moins les subventions Gross domestic product at market Produit intérieur brut aux prix du -1.3 4.8 2.5 1.2 3.9 2.1 2.4 3.2 3.4 prices marché 2008: semi-final 2009: Provisional 2010:Estimated 2008: semi-définitif 2009: provisoire 2010:Estimée African Statistical Yearbook 2011 / Annuaire Statistique pour l'Afrique 2011
  • 323.
    Togo Togo Expenditure on Gross domestic product at constant purchasers' Emplois du produit intérieur brut aux prix constants d'acquisition values Annual Growth Rates (%) Taux de croissance annuel (%) Consommation finale des Government final consumption -9.0 2.2 9.2 9.9 4.9 -7.0 17.3 -7.0 2.0 administrations publiques Private final consumption 6.3 3.2 1.8 9.6 8.2 5.3 -15.8 7.6 7.1 Consommation finale privée Gross fixed capital formation 6.5 8.0 -0.9 7.8 10.7 -12.3 12.2 24.5 7.2 Formation brute de capital fixe Exports of goods and services 7.8 28.5 -4.6 5.6 20.1 -18.2 16.0 0.2 11.7 Exportations de biens et services Moins importations de biens et Less imports of goods and services 18.5 8.4 -0.6 24.3 19.7 -9.8 -12.1 10.6 14.2 services III INFLATION 2002 2003 2004 2005 2006 2007 2008 2009 2010 Annual Growth Rates (%) Taux de croissance annuel (%) All Item 3.1 -0.9 0.4 6.8 2.2 0.9 8.7 2.9 5.3 Ensemble Food 3.8 -4.8 -1.2 10.9 -1.1 2.8 19.8 2.9 -2.5 Alimentation Health 12.1 -0.1 -0.3 -1.0 -2.7 -0.6 2.4 1.2 0.5 Santé Energy ... ... ... ... 7.2 2.0 2.4 3.1 1.8 Energie Transport 1.6 -1.3 1.1 23.6 12.2 -0.4 6.1 4.6 7.9 Transport IV AGRICULTURAL PRODUCTION - PRODUCTION AGRICOLE 2002 2003 2004 2005 2006 2007 2008 2009 2010 Tons (Thousand) Tonnes (milliers) Millet and Sorghum, Tons 221 210 205 248 267 267 268 ... ... Mil et Sorgho, tonnes (milliers) (thousands) Maize, Tons (thousands) 510 538 524 510 538 566 568 ... ... Maïs, tonnes (milliers) Rice, Tons (thousands) 69 62 69 73 76 80 81 ... ... Rice, tonnes (milliers) Beans, Tons (thousands) 45 44 49 67 53 63 64 ... ... Haricot, tonnes (milliers) Yams, Tons (thousands) 575 615 585 585 621 618 624 ... ... Ignames, tonnes (milliers) V MINING PRODUCTION - PRODUCTION MINIERE 322 2002 2003 2004 2005 2006 2007 2008 2009 2010 Limestone, Tons 1375 085.2 2111 988.0 2124 028.1 2253 388.8 2300 653.6 1823 538.7 ... ... ... Calcaire, tonnes Sand & gravel, cubic meter 274 693.8 457 442.1 521 131.0 560 875.0 652 357.5 593 587.5 ... ... ... Sable et gravier (m3) Gold (Kilograms) 1 657.6 8 668.6 7 466.8 6 178.8 5 903.9 ... ... ... ... Or (Kilogrammes) VI ENERGY - ENERGIE 2002 2003 2004 2005 2006 2007 2008 2009 2010 Electricity - total hydro production, Électricité - production hydraulique 38.6 41.5 44.1 50.2 69.6 39.8 ... ... ... kilowatt hours (millions) totale, kilowatt-heures (millions) Electricity - total thermal production, Électricité - production thermique 66.0 54.0 105.0 115.0 130.0 104.0 ... ... ... kilowatt hours (millions) totale, kilowatt-heures (millions) Electricity - total production, self- Electricité - Production totale privée 1 2 4 5 11 18 ... ... ... producer (Million Kilowatt Hours) (million de kilowatt heures) Electricity - total production, public Electricité - Production totale 151 174 182 184 210 178 ... ... ... (Million Kilowatt Hours) publique (million de kilowatt heures) African Statistical Yearbook 2011 / Annuaire Statistique pour l'Afrique 2011
  • 324.
    Togo Togo VII TOURISM AND INFRASTRUCTURE - TOURISME ET INFRASTUCTURE 2002 2003 2004 2005 2006 2007 2008 2009 2010 Arrivals - Tourists (thousands) 58 61 83 81 94 86 74 ... ... Arrivées - touristes (milliers) Rooms in hotels and similar Chambres d'hotels et établissements establishments (thousands) 4.365 4.48 4.728 4.944 5.201 5.404 ... ... ... assimilés (milliers) Paved Road (% of total) ... ... ... ... ... ... ... ... ... Routes asphaltées (% du total) Total Network (Railways-km) ... ... ... ... ... ... ... ... ... Réseau total voies ferrées-Km Main Telephone Lines (per 1,000 Lignes téléphoniques fixes (pour 52 61 65 63 81 101 118 ... ... inhabitants) 1000 habitants) Mobile Cellular Subscribers (per Abonnés aux téléphones mobiles 131 211 280 380 607 861 1 240 1 640 2 060 1,000 inhabitants) (pour 1000 habitants) VII FINANCIAL AND MONETARY STATISTICS - FINANCES ET STATISTIQUES MONETAIRES 2002 2003 2004 2005 2006 2007 2008 2009 2010 VII-1 Monetary Statistics VII-1 Statistiques monétaires CFA Franc (Millions) Franc CFA (Millions) Money supply (M1) 148 407 154 749 192 933 186 745 248 399 278 430 335 857 372 912 398 103 Masse monétaire (M1) Quasi-money 86 146 105 259 114 130 127 217 136 543 171 051 195 541 243 774 292 546 Quasi-monnaie of which Demand Deposit ... ... ... ... ... ... ... ... ... dont Monnaie scripturale Net foreign assets 80 985 74 142 146 399 136 151 213 108 206 687 239 400 246 367 252 993 Avoirs extérieurs nets Domestic credit 163 982 183 858 181 414 200 213 200 461 263 208 321 875 407 248 461 387 Crédit intérieur of which claims on private sector 127 938 167 019 174 228 195 361 195 329 255 065 243 263 295 010 354 552 dont créances sur le secteur privé of which Claims on government dont créances nettes sur le 35 745 16 840 7 186 4 852 5 133 8 143 78 612 112 238 106 835 sector, net gouvernement International reserves (millions of US Réserves internationales (millions de 205 205 360 195 375 438 582 703 694 $) $ EU) Average Exchange Rate (National Taux de change (moyen) (monnaie 696.99 581.20 528.29 527.47 522.89 479.27 447.81 472.19 495.28 Currency per us $) nationale par dollars) VII-2 Public Finance VII-2 Finances publiques CFA Franc (Millions) Franc CFA (Millions) Total Revenues and Grants 130 020 170 780 179 560 187 970 211 890 224 910 249 936 243 701 351 343 Recettes totales et dons Tax Revenue 126 530 165 260 171 720 174 860 195 900 204 520 167 458 174 335 246 673 Recettes fiscales Non Tax Revenue 29 880 31 274 36 894 36 839 38 549 43 792 53 217 52 366 47 745 Recettes non fiscales Grants 3 490 5 520 7 850 13 110 15 990 20 390 29 261 17 000 56 925 Dons 323 Total Expenditures and Net Lending 134 540 146 400 165 840 219 820 245 860 221 110 253 250 295 150 342 102 Dépenses totales et prêts nets Current expenditure 116 070 128 800 145 030 175 040 193 390 201 050 203 123 220 950 224 250 Dépenses courantes Of which Wages and Salaries 51 600 51 720 51 630 49 240 59 400 64 290 70 411 78 000 82 626 Dont rémunérations et salaires Capital expenditure 14 383 10 252 15 832 36 584 47 313 24 069 49 867 74 200 43 278 Dépenses d'équipement Net Lending - 2 - 1 10 10 40 - 4 040 261 ... 0 Prêts nets Fiscal Balance - 4 531 24 373 9 711 - 31 851 - 32 309 3 799 - 3 314 - 51 449 9 241 Solde global y compris les dons VII-3 Balance of Payments VII-3 Balance des paiements CFA Franc (Millions) Franc CFA (Millions) Trade balance - 105 528 - 91 145 - 133 284 - 270 153 - 242 887 - 189 388 - 203 529 - 186 356 - 232 306 Balance commerciale Services Balance - 40 486 - 63 600 - 47 200 - 53 632 - 42 790 - 33 290 - 34 118 - 44 801 - 69 874 Balance des services Net Income - 15 053 - 13 564 - 17 700 - 18 207 - 19 763 - 14 492 - 6 750 - 6 444 - 7 494 Revenus nets Current transfers, net total 63 550 74 198 89 500 99 031 127 400 133 715 145 018 141 108 149 999 Transferts courants Current account balance - 97 517 - 94 111 - 108 684 - 242 961 - 177 964 - 103 448 - 99 379 - 96 493 - 159 675 Solde du compte courant VII-4 External Debt and Financial Flows VII-4 Dette extérieure et flux financiers US $ (Millions) $ E.U (Millions) Total external debt 1 480 1 702 1 804 1 626 1 880 2 123 1 787 1 740 425 Dette extérieure totale Private 0 0 0 0 0 0 0 0 0 Privée Public 1 480 1 702 1 804 1 626 1 880 2 123 1 787 1 740 425 Publique Total external debt service 1 3 2 3 3 5 40 54 53 Service de la dette extérieure Net Foreign Direct Investment Investissements étranger direct (flux 53 34 59 77 77 49 24 50 ... Inflows nets entrants) Net Total Official Development Aide publique au développement 51 50 64 82 79 121 330 499 ... assistance (nette totale) African Statistical Yearbook 2011 / Annuaire Statistique pour l'Afrique 2011
  • 325.
    Togo Togo 2002 2003 2004 2005 2006 2007 2008 2009 2010 CFA Franc (Millions) Franc CFA Exports, fob Exportations, fàb Exports - Total 295 686 347 389 317 509 348 323 394 406 324 415 381 919 418 209 433 572 Exportations - Total Main Products Principaux produits Cocoa 4 929 6 142 13 043 10 729 7 901 4 501 7 536 16 021 22 747 Cacao Coffee 2 200 1 001 1 697 2 330 1 620 5 387 6 335 6 672 7 332 Café Cotton 27 619 40 414 31 451 15 836 15 639 12 000 13 303 7 795 11 356 Coton Phosphates 28 716 20 315 25 382 18 427 16 566 15 030 48 900 42 527 26 774 Phosphates Cement 37 450 42 596 35 546 21 164 33 200 32 410 26 680 22 009 22 009 Ciment Main Destinations Principales destinations Benin 22 957.0 23 019.0 25 065.0 21 991.0 20 769.0 14 607.0 ... ... ... Bénin Burkina Faso 22 558.0 40 142.0 26 844.0 35 008.0 23 746.0 13 068.0 ... ... ... Burkina Faso Mali 2 294.0 18 722.0 22 975.0 14 010.0 14 780.0 9 551.0 ... ... ... Mali Ghana 37 268.0 36 980.0 34 223.0 40 488.0 37 649.0 7 847.0 ... ... ... Ghana Netherlands 3 424.0 31 353.0 8 129.0 2 067.0 1 114.0 649.0 ... ... ... Pays-Bas 2002 2003 2004 2005 2006 2007 2008 2009 2010 Imports, cif Importations, cif 324 Imports - Total 401 214 438 534 450 793 618 476 637 293 513 803 585 448 604 565 665 878 Importations - Total (millions) Principaux produits Main Products Food 67 000 49 307 49 192 51 706 49 527 53 813 71 788 63 402 66 280 Produits alimentaires Other Consumer goods 66 800 58 543 67 485 67 147 84 535 86 683 95 351 108 549 113 477 Autres biens de consommation Intermidiary goods 86 700 109 328 132 607 65 130 86 092 93 026 106 328 91 332 100 957 Biens intermédiaires Equipment 73 100 66 871 62 814 76 220 77 555 80 695 103 084 137 317 164 543 Biens d'équipement Petroleum products 134 800 98 104 68 846 254 772 237 245 97 310 92 391 58 515 75 171 Produits pétroliers Main Origin Principales provenances Germany 14 172.0 14 941.0 9 649.0 9 154.0 10 788.0 7 464.0 ... ... ... Allemagne Netherlands 9 027.0 39 669.0 9 847.0 12 385.0 12 983.0 41 774.0 ... ... ... Pays-Bas Italy 10 131.0 14 592.0 10 971.0 14 022.0 14 313.0 8 359.0 ... ... ... Italie France 57 186.0 68 977.0 57 329.0 55 311.0 79 694.0 72 223.0 ... ... ... France Cote d'Ivoire 17 648.0 19 154.0 17 809.0 20 327.0 10 891.0 9 845.0 ... ... ... Côte d'Ivoire African Statistical Yearbook 2011 / Annuaire Statistique pour l'Afrique 2011
  • 326.
    Tunisia Tunisie AREA (KM 2) 163 610 SUPERFICIE (KM 2) CAPITAL CITY Tunis Tunis CAPITALE CURRENCY Tunisian Dinar Dinar Tunisien MONNAIE I SOCIAL AND DEMOGRAPHIC INDICATORS — INDICATEURS DEMOGRAPHIQUES ET SOCIAUX 2002 2003 2004 2005 2006 2007 2008 2009 2010 Population Population Population au milieu de l'année - Mid-year population - Total (Million) 9.6 9.7 9.8 9.9 10.0 10.1 10.2 10.3 10.4 Total (million) Population au milieu de l'année - Mid-year population - Urban (%) 64.2 64.6 65.0 65.3 65.7 66.1 66.5 66.9 67.3 Urbaine (%) Female (%) 55.2 54.9 54.6 54.3 54.2 54.1 54.0 54.0 54.0 Femme (%) Population by Age Group Population par groupe d'âge 0-14 2716 834 2651 635 2589 647 2533 966 2485 645 2444 657 2411 610 2386 794 2370 214 0-14 15-64 6284 890 6418 636 6552 163 6685 102 6817 492 6948 391 7075 269 7194 855 7304 781 15-64 65+ 621 555 635 706 648 527 659 352 668 134 675 522 682 368 689 857 698 962 65+ Active Population (000) 3 309.5 3 373.3 3 437.2 3 502.8 3 583.1 3 658.0 3 734.4 3 786.0 3 850.0 Population active (000) Female (%) 25.2 25.5 25.8 26.1 26.3 26.4 26.5 27.0 27.0 Femme (%) Taux brut de natalité - Total (par Crude birth rate - Total (per 1000) 16.0 16.0 16.0 16.0 16.0 16.0 16.0 16.0 16.0 1000) Taux brut de mortalité - Total (par Crude death rate - Total (per 1000) 6.0 6.0 6.0 6.0 6.0 6.0 6.0 6.0 6.0 1000) Life expectancy at birth - Total Espérance de vie à la naissance - 73.0 73.0 73.0 73.0 74.0 74.0 74.0 74.0 74.0 (years) Total (années) Net reproduction rate - (per Taux net de reproduction - (par ... ... ... 1.0 ... ... ... ... 1.0 woman) femme) Indice synthétique de fécondité - Total fertility rate - (p woman) y (per ) 2.0 2.0 2.0 2.0 2.0 2.0 2.0 2.0 2.0 (par femme) Education Enseignement Teaching staff at first level - Total Personnel enseignant - 1er degré - 60.56 59.3 59.6 59.3 59.3 58.9 60.0 ... ... (thousands) Total (milliers) Teaching staff at second level - Total Personnel enseignant - 2ème degré - 58.28 ... 68.8 71.9 73.9 78.5 83.0 ... ... 325 (thousands) Total (milliers) Teaching staff at third level - Total Personnel enseignant - 3ème degré - 11.4 12.9 14.7 16.7 16.9 18.1 18.6 ... ... (thousands) Total (milliers) First level student enrollment - Total Elèves inscrits - 1er degré - Total 1 326 1 277 1 228 1 184 1 134 1 069 1 036 ... ... (thousands) (milliers) First level student enrollment - Elèves inscrits - 1er degré - Femmes 631 609 586 565 542 510 496 ... ... Female (thousands) (milliers) Second level student enrollment - Elèves inscrits - 2ème degré - Total 1 169 1 149 1 210 1 239 1 247 1 268 1 259 ... ... Total (thousands) (milliers) Second level student enrollment - Elèves inscrits - 2ème degré - 583 584 ... 633 636 ... 637 ... ... Female (thousands) Femmes (milliers) Third level student enrollment - Total Elèves inscrits - 3ème degré - Total 226.1 263.4 291.8 311.6 325.3 326.2 350.8 ... ... (thousands) (milliers) Third level student enrollment - Elèves inscrits - 3ème degré - 121.8 144.7 164.9 178.3 187.1 192.6 206.4 ... ... Female (thousands) Femmes (milliers) Public expenditure on education (% Dépenses publiques consacrées à 16.0 18.0 17.0 17.0 18.0 18.0 21.0 ... ... of budget) l'enseignement (% du budget) Health Santé Hospital beds - Total (per 10 000 Nombre de lits d'hôpitaux - Total 171 170 176 176 178 176 182 ... ... population) (pour 10 000) Nurses - Total (per 10 000 Nombre d'infirmières - Total (pour 294 305 298 295 304 310 308 ... ... population) 10 000) Physicians - Total (per 10 000 Nombre de médecins - Total (pour 82 83 89 94 95 103 112 ... ... population) 10 000) Public expenditure on Health (% of Dépenses publiques consacrées à la 9 8 8 8 7 7 6 ... ... budget) santé (% du budget) African Statistical Yearbook 2011 / Annuaire Statistique pour l'Afrique 2011
  • 327.
    Tunisia Tunisie II NATIONAL ACCOUNTS — COMPTES NATIONAUX 2002 2003 2004 2005 2006 2007 2008 2009 2010 Gross domestic product by kind of economic activity at current prices Produit intérieur brut par branche d'activité économique aux prix courants Tunisian Dinar (Millions) Dinar Tunisien(Millions) Agriculture 2 730 3 287 3 846 3 839 4 246 4 309 4 336 4 886 4 710 Agriculture Mining and quarrying 1 344 1 355 1 561 2 265 2 809 3 657 5 226 4 602 5 065 Industries extractives Manufacturing 5 370 5 578 6 064 6 363 6 910 7 977 9 120 8 990 10 061 Industries manufacturières Electricity, gas & water 483 487 576 555 593 611 713 757 814 Electricité, gaz et eau Construction 1 548 1 623 1 734 1 885 2 079 2 170 2 268 2 554 2 868 Bâtiments et travaux publics Wholesale & retail trade, Commerce de gros et de détail, 4 377 4 771 5 167 5 578 6 090 6 428 6 787 7 407 7 979 restaurants, hotels restaurants et hôtels Banques, assurances, affaires Finance, insurance, real estate, etc. 5 203 5 656 6 020 6 455 7 373 8 001 8 556 9 228 10 036 immobilières Transport and communications 3 524 3 781 4 396 4 991 5 410 5 949 6 800 7 284 7 772 Transport(s) et communications Administrations publiques et Public administration and defense 5 027 5 410 5 909 6 370 6 854 7 449 8 045 8 756 9 500 défense Other services 154 170 181 192 206 215 229 247 266 Autres services Moins Services d’intermédiation Less Imputed Service Charges - 483 - 457 - 520 - 581 - 750 - 885 - 925 - 869 - 880 financière Gross domestic product at factor Produit intérieur brut aux couts des 29 276 31 660 34 934 37 912 41 821 45 881 51 155 53 841 58 190 cost / basic prices facteurs / prix de base Plus: Indirect Taxes / taxes on Plus taxes indirectes/impôts sur les 3 625 3 713 3 905 3 958 3 935 3 977 4 064 4 935 5 463 products, less subsidies produits, moins les subventions Expenditure on Gross domestic product at current purchaser's values Emploi du produit intérieur brut aux prix courants d'acquisition Tunisian Dinar (Millions) Dinar Tunisien(Millions) Consommation finale des Government final consumption 5 668 6 085 6 572 7 084 7 645 8 298 8 917 9 715 ... administrations publiques Private final consumption 20 641 22 249 24 199 25 870 28 243 30 699 33 999 36 370 ... Consommation finale privée Gross fixed capital formation 8 148 8 101 8 595 8 981 10 333 11 490 13 010 14 310 ... Formation brute de capital fixe Increase in inventories - 313 150 456 98 396 319 972 104 ... Variation des stocks Exports of goods and services 13 419 13 967 16 389 18 814 21 061 25 470 30 761 26 428 ... Exportations de biens et services 326 Moins importations de biens et Less imports of goods and services 14 660 15 177 17 371 18 976 21 923 26 419 32 440 28 152 ... services GDP at purchasers' values 32 901 35 373 38 839 41 870 45 756 49 857 55 219 58 775 63 653 PIB aux prix d'acquisition Gross domestic product by kind of economic activity at constant Produit intérieur brut par branche d'activité economique aux prix constants prices Annual Growth Rates (%) Taux de croissance annuel (%) Agriculture -10.0 18.0 13.5 -7.8 7.9 0.8 -0.9 8.8 -8.5 Agriculture Mining and quarrying 4.4 -4.5 3.0 5.4 -8.3 20.6 -3.6 3.3 0.1 Industries extractives Manufacturing 1.1 1.1 2.5 0.6 4.3 8.8 5.6 -2.1 8.6 Industries manufacturières Electricity, gas & water 0.9 4.6 7.1 2.8 -0.1 -4.3 4.6 3.6 3.5 Electricité, gaz et eau Construction 4.2 0.5 5.1 6.6 6.5 4.0 4.3 3.9 4.8 Bâtiments et travaux publics Wholesale & retail trade, Commerce de gros et de 0.9 5.7 5.4 4.9 5.7 3.6 4.3 1.6 3.4 restaurants, hotels détail,restaurants et hôtels Banques, assurances, affaires Finance, insurance, real estate, etc. 27.2 22.6 14.9 4.3 10.3 8.3 4.5 1.8 5.0 immobilières Transport and communications -9.6 -6.0 -1.4 13.6 8.0 8.0 9.4 5.5 7.1 Transport(s) et communications Administrations publiques et Public administartion and defense 3.3 5.9 5.5 5.8 6.2 5.5 4.8 5.2 3.4 défense Other services 1.0 3.5 0.6 1.0 1.2 1.9 4.7 5.0 4.2 Autres services Moins Services d’intérmediation Less Imputed Service Charges -15.6 -5.6 3.3 7.1 8.2 6.6 3.6 3.3 3.5 financière Gross domestic product at factor Produit intérieur brut aux couts des 2.0 5.8 6.2 3.8 5.9 6.7 4.4 3.0 3.8 cost / basic prices facteurs / prix de base Plus: Indirect Taxes / taxes on Plus taxes indirectes/impôts sur les -1.1 2.1 3.4 5.6 3.2 2.3 5.3 4.2 3.1 products, less subsidies produits, moins les subventions Gross domestic product at market Produit intérieur brut aux prix du 1.7 5.5 6.0 4.0 5.7 6.3 4.5 3.1 3.7 prices marché 2008: semi-final 2009: Provisional 2010:Estimated 2008: semi-définitif 2009: provisoire 2010:Estimée African Statistical Yearbook 2011 / Annuaire Statistique pour l'Afrique 2011
  • 328.
    Tunisia Tunisie Expenditure on Gross domestic product at constant purchasers' Emplois du produit intérieur brut aux prix constants d'acquisition values Annual Growth Rates (%) Taux de croissance annuel (%) Consommation finale des Government final consumption 6.3 7.4 4.3 2.8 7.0 5.5 5.1 5.2 ... administrations publiques Private final consumption 3.6 4.6 4.9 4.8 4.5 5.6 4.4 3.7 ... Consommation finale privée Gross fixed capital formation -1.7 -1.8 1.0 2.7 9.5 6.3 5.3 3.5 ... Formation brute de capital fixe Exports of goods and services -3.5 0.0 5.5 4.5 4.3 11.8 2.8 -6.9 ... Exportations de biens et services Moins importations de biens et Less imports of goods and services -3.0 0.3 2.7 0.0 7.6 9.6 5.4 -8.2 ... services III INFLATION 2002 2003 2004 2005 2006 2007 2008 2009 2010 Annual Growth Rates (%) Taux de croissance annuel (%) All Item 2.7 2.7 3.6 2.0 4.5 3.2 5.0 3.5 4.4 Ensemble Food 4.0 3.4 5.0 0.1 5.4 2.8 6.2 4.3 5.8 Alimentation Health 1.6 2.7 4.0 4.1 3.4 2.6 4.6 4.0 3.6 Santé Energy 1.5 2.7 3.8 5.3 9.4 3.2 10.0 2.3 4.3 Energie Transport 2.4 4.5 3.4 4.8 6.4 4.9 5.2 2.3 2.6 Transport IV AGRICULTURAL PRODUCTION - PRODUCTION AGRICOLE 2002 2003 2004 2005 2006 2007 2008 2009 2010 Tons (Thousand) Tonnes (milliers) Cereals, Tons (thousands) 513 2 904 2 347 2 097 1 610 1 988 1 188 2 534 ... Céréales, tonnes (milliers) Olive oil, Tons (thousands) 150 360 1 400 650 1 050 900 1 000 800 ... Olives à huile, tonnes (milliers) Dates, Tons (thousands) 115 111 122 113 131 124 145 140 ... Dattes, tonnes (milliers) Citrus, Tons (thousands) 240 224 209 243 262 247 300 300 ... Agrumes, tonnes (milliers) Milk, Tons (thousands) 945 891 864 920 979 1 006 1 010 1 048 ... Lait, tonnes (milliers) V MINING PRODUCTION - PRODUCTION MINIERE 327 2002 2003 2004 2005 2006 2007 2008 2009 2010 Phosphates de chaux, tonnes Phosphates, Tons (thousands) 7 461.0 7 890.0 8 051.0 8 220.4 7 800.8 8 001.8 7 691.7 ... ... (milliers) Lead ore, Tons (thousands) 8.2 8.2 8.5 13.6 ... ... ... ... ... Minerai de plomb, tonnes (milliers) Iron ore, Tons (thousands) 202.0 160.0 256.0 206.4 214.3 180.4 108.3 ... ... Minerai de fer, tonnes (milliers) VI ENERGY - ENERGIE 2002 2003 2004 2005 2006 2007 2008 2009 2010 Electricity - total hydro production, Électricité - production hydraulique 64.0 166.0 153.0 145.0 92.0 49.0 38.0 ... ... kilowatt hours (millions) totale, kilowatt-heures (millions) Electricity - total thermal production, Électricité - production thermique 4 292.0 4 659.0 4 626.0 5 344.0 5 174.0 5 926.0 6 410.0 ... ... kilowatt hours (millions) totale, kilowatt-heures (millions) Electricity - total production, self- Electricité - Production totale privée 941 929 946 939 914 878 828 ... ... producer (Million Kilowatt Hours) (million de kilowatt heures) Electricity - total production, public Electricité - Production totale 10 340 10 901 11 508 12 067 12 496 13 090 10 250 ... ... (Million Kilowatt Hours) publique (million de kilowatt heures) African Statistical Yearbook 2011 / Annuaire Statistique pour l'Afrique 2011
  • 329.
    Tunisia Tunisie VII TOURISM AND INFRASTRUCTURE - TOURISME ET INFRASTUCTURE 2002 2003 2004 2005 2006 2007 2008 2009 2010 Arrivals - Tourists (thousands) 5063.538 5114.303 5997.929 6378.435 6549.549 6761.906 7048.999 ... ... Arrivées - touristes (milliers) Rooms in hotels and similar Chambres d'hotels et établissements establishments (thousands) 777 790 800 816 825 734 ... ... ... assimilés (milliers) Paved Road (% of total) ... ... 66 ... 74 ... 75 ... ... Routes asphaltées (% du total) Total Network (Railways-km) 1 909 1 909 1 909 1 909 19 273 2 218 19 371 ... ... Réseau total voies ferrées-Km Main Telephone Lines (per 1,000 Lignes téléphoniques fixes (pour 117 118 121 125 125 124 119 118 ... inhabitants) 1000 habitants) Mobile Cellular Subscribers (per Abonnés aux téléphones mobiles 59 191 374 564 720 764 829 930 ... 1,000 inhabitants) (pour 1000 habitants) VII FINANCIAL AND MONETARY STATISTICS - FINANCES ET STATISTIQUES MONETAIRES 2002 2003 2004 2005 2006 2007 2008 2009 2010 VII-1 Monetary Statistics VII-1 Statistiques monétaires Tunisian Dinar (Millions) Dinar Tunisien(Millions) Money supply (M1) 6 892 7 265 8 036 9 140 10 339 11 579 12 991 14 874 16 465 Masse monétaire (M1) Quasi-money 10 149 10 868 12 151 13 275 14 674 16 539 19 278 21 427 23 984 Quasi-monnaie of which Demand Deposit ... ... ... ... ... ... ... ... ... dont Monnaie scripturale Net foreign assets 1 905 2 256 3 130 4 076 6 837 6 698 8 216 9 785 9 311 Avoirs extérieurs nets Domestic credit 20 001 21 079 23 478 25 467 28 028 30 778 34 825 38 413 44 650 Crédit intérieur of which claims on private sector 18 332 19 517 21 493 23 275 25 071 27 525 31 670 34 805 41 490 dont créances sur le secteur privé of which Claims on government dont créances nettes sur le 1 670 1 562 1 985 2 192 2 958 3 253 3 156 3 608 3 160 sector, net gouvernement International reserves (millions of US Réserves internationales (millions de 2 290 2 945 3 936 4 437 6 773 7 851 8 849 11 057 9 459 $) $ EU) Average Exchange Rate (National Taux de change (moyen) (monnaie 1.42 1.29 1.25 1.30 1.33 1.28 1.23 1.35 1.43 Currency per us $) nationale par dollars) VII-2 Public Finance VII-2 Finances publiques Tunisian Dinar (Millions) Dinar Tunisien(Millions) Total Revenues and Grants 7 670 7 821 8 717 9 280 9 756 10 902 13 357 13 576 15 139 Recettes totales et dons Tax Revenue 6 429 6 631 7 252 7 904 8 470 9 508 11 332 11 686 ... Recettes fiscales Non Tax Revenue 1 123 1 113 1 396 1 306 1 238 1 358 1 834 1 707 ... Recettes non fiscales 328 Grants 118 77 68 70 48 36 192 183 ... Dons Total Expenditures and Net Lending 8 431 8 836 9 517 10 254 10 968 12 197 13 724 15 165 16 842 Dépenses totales et prêts nets Current expenditure 4 186 4 489 4 805 5 164 5 645 6 087 6 613 7 279 ... Dépenses courantes Of which Wages and Salaries 3 684 3 968 4 253 4 591 4 901 5 297 5 732 6 269 ... Dont rémunérations et salaires Capital expenditure 2 404 2 596 2 616 2 637 2 539 2 677 3 181 3 866 ... Dépenses d'équipement Net Lending 102 191 66 111 112 355 47 654 ... Prêts nets Fiscal Balance - 761 - 1 015 - 800 - 973 - 1 212 - 1 295 - 366 - 1 589 - 1 702 Solde global y compris les dons VII-3 Balance of Payments VII-3 Balance des paiements Tunisian Dinar (Millions) Dinar Tunisien(Millions) Trade balance - 3 019 - 2 924 - 3 028 - 2 547 - 3 345 - 3 685 - 4 941 - 4 788 - 7 124 Balance commerciale Services Balance 1 750 1 707 2 048 2 374 2 450 2 699 3 257 3 649 4 122 Balance des services Net Income 105 182 151 - 377 - 123 - 420 - 675 - 751 - 422 Revenus nets Current transfers, net total 104 95 143 162 194 231 250 424 366 Transferts courants Current account balance - 1 060 - 941 - 686 - 388 - 824 - 1 175 - 2 109 - 1 465 - 3 058 Solde du compte courant VII-4 External Debt and Financial Flows VII-4 Dette extérieure et flux financiers US $ (Millions) $ E.U (Millions) Total external debt 15 143 17 789 19 526 18 078 18 532 20 145 20 589 21 444 20 296 Dette extérieure totale Private 6 049 7 363 8 360 7 933 7 946 8 816 9 446 9 207 8 655 Privée Public 9 095 10 426 11 166 10 145 10 586 11 329 11 142 12 237 11 640 Publique Total external debt service 6 896 7 452 8 667 8 784 9 185 9 038 10 095 10 979 11 722 Service de la dette extérieure Net Foreign Direct Investment Investissements étranger direct (flux 821 584 639 783 3 308 1 616 2 758 1 688 ... Inflows nets entrants) Net Total Official Development Aide publique au développement 221 300 352 362 431 321 332 474 ... assistance (nette totale) African Statistical Yearbook 2011 / Annuaire Statistique pour l'Afrique 2011
  • 330.
    Tunisia Tunisie 2002 2003 2004 2005 2006 2007 2008 2009 2010 Tunisian Dinar (Millions) Dinar Tunisien Exports, fob Exportations, fàb Exports - Total 9 749 10 343 12 055 13 794 15 558 19 410 23 637 194 692 ... Exportations - Total Main Products Principaux produits Hosiery and Confection 3 789 3 875 4 058 4 005 3 972 4 523 4 564 4 172 ... Bonneterie et Confection Crude oil 715 640 936 1 416 1 564 2 632 3 219 2 093 ... Pétrole brut Threads and cables Electric 461 507 661 763 773 1 003 1 254 1 354 ... Fils et Câbles électriques D.A.P (Diammonium phosphate) 267 297 350 329 389 509 1 074 502 ... D.A.P (Diammoniaque phosphaté) Phosphoric acid 214 158 226 283 317 344 887 418 ... Acide phosphorique Main Destinations Principales destinations France 3 025.0 3 365.5 4 041.9 4 525.1 5 020.7 6 239.2 6 735.3 5 770.5 ... France Italy 2 081.1 2 281.4 3 105.7 3 308.2 3 437.0 4 519.2 4 883.9 4 095.1 ... Italie Germany 1 109.8 1 105.6 1 110.1 1 156.5 1 220.3 1 596.7 1 637.1 1 711.8 ... Allemagne Libya 464.9 453.8 499.9 622.6 825.8 892.7 1 065.2 1 121.2 ... Libye United Kingdom 241.6 337.3 370.9 394.0 452.4 835.5 1 099.4 925.5 ... Royaume-Uni 2002 2003 2004 2005 2006 2007 2008 2009 2010 Imports, cif Importations, cif Imports - Total 13 511 14 039 15 960 17 292 20 004 24 437 30 241 25 878 ... Importations - Total (millions) 329 Principaux produits Main Products Refined Products 812 999 1 131 1 571 1 932 1 936 3 084 1 691 ... Produits raffinés Fabrics 1 712 1 736 1 760 1 757 1 735 2 120 2 121 1 901 ... Tissus Iron & Steel 273 424 665 583 746 1 048 1 407 749 ... Fer & acier Material structure and plastic 565 584 693 816 926 1 132 1 264 1 197 ... Matière et ouvrage en plastique Crude Petroleum 305 344 395 561 710 746 1 149 676 ... Pétrole brut Main Origin Principales provenances France 3 454.7 3 658.1 3 983.4 4 023.0 4 525.9 5 226.9 5 585.7 5 169.2 ... France Italy 2 632.5 2 804.7 3 137.1 3 708.9 3 857.8 4 764.1 5 213.4 4 209.1 ... Italie Germany 1 205.5 1 264.4 1 346.1 1 418.0 1 573.7 1 635.1 2 109.1 2 250.9 ... Allemagne Russia 263.8 287.5 486.1 487.1 755.5 1 042.0 2 279.5 961.6 ... Russie Libya 408.1 460.4 526.9 661.9 965.9 826.7 1 319.2 754.4 ... Libye African Statistical Yearbook 2011 / Annuaire Statistique pour l'Afrique 2011
  • 331.
    Uganda Ouganda AREA (KM 2) 241 038 SUPERFICIE (KM 2) CAPITAL CITY Kampala Kampala CAPITALE CURRENCY Uganda Shilling Shilling Ugandais MONNAIE I SOCIAL AND DEMOGRAPHIC INDICATORS — INDICATEURS DEMOGRAPHIQUES ET SOCIAUX 2002 2003 2004 2005 2006 2007 2008 2009 2010 Population Population Population au milieu de l'année - Mid-year population - Total (Million) 26.0 26.9 27.8 28.7 29.7 30.6 31.7 32.7 31.7 Total (million) Population au milieu de l'année - Mid-year population - Urban (%) ... ... 12.0 13.0 13.0 13.0 13.0 13.1 ... Urbaine (%) Female (%) 50.1 50.0 50.0 50.0 50.0 50.0 49.9 49.9 ... Femme (%) Population by Age Group Population par groupe d'âge 0-14 12879 152 13296 063 13722 605 14157 693 14600 664 15051 839 15512 179 15983 083 ... 0-14 15-64 12445 147 12871 693 13321 099 13791 362 14282 896 14797 036 15333 713 15892 829 ... 15-64 65+ 711 032 722 647 735 205 750 200 768 172 788 668 810 973 833 952 ... 65+ Active Population (000) 11 288.0 11 667.0 12 065.0 12 480.0 12 913.0 13 393.0 13 875.0 14 376.0 ... Population active (000) Female (%) 47.8 47.8 47.8 47.7 47.7 47.8 47.8 47.8 ... Femme (%) Taux brut de natalité - Total (par Crude birth rate - Total (per 1000) 47.5 47.3 47.2 47.0 46.7 46.5 46.2 45.8 ... 1000) Taux brut de mortalité - Total (par Crude death rate - Total (per 1000) 15.5 15.0 14.5 14.0 13.6 13.1 12.7 12.3 ... 1000) Life expectancy at birth - Total Espérance de vie à la naissance - 47.7 48.5 49.4 50.3 51.1 51.9 52.7 53.5 ... (years) Total (années) Net reproduction rate - (per Taux net de reproduction - (par ... ... ... 2.5 ... ... ... ... ... woman) femme) Indice synthétique de fécondité - Total fertility rate - (p woman) y (per ) 6.7 6.7 6.6 6.6 6.5 6.4 6.3 6.3 ... (par femme) Education Enseignement Teaching staff at first level - Total Personnel enseignant - 1er degré - ... ... ... ... ... ... ... ... ... (thousands) Total (milliers) Teaching staff at second level - Total Personnel enseignant - 2ème degré - 330 ... ... ... ... ... ... ... ... ... (thousands) Total (milliers) Teaching staff at third level - Total Personnel enseignant - 3ème degré - ... ... ... ... ... ... ... ... ... (thousands) Total (milliers) First level student enrollment - Total Elèves inscrits - 1er degré - Total ... ... ... ... ... ... ... ... ... (thousands) (milliers) First level student enrollment - Elèves inscrits - 1er degré - Femmes ... ... ... ... ... ... ... ... ... Female (thousands) (milliers) Second level student enrollment - Elèves inscrits - 2ème degré - Total ... ... ... ... ... ... ... ... ... Total (thousands) (milliers) Second level student enrollment - Elèves inscrits - 2ème degré - ... ... ... ... ... ... ... ... ... Female (thousands) Femmes (milliers) Third level student enrollment - Total Elèves inscrits - 3ème degré - Total ... ... ... ... ... ... ... ... ... (thousands) (milliers) Third level student enrollment - Elèves inscrits - 3ème degré - ... ... ... ... ... ... ... ... ... Female (thousands) Femmes (milliers) Public expenditure on education (% Dépenses publiques consacrées à ... ... ... ... ... ... ... ... ... of budget) l'enseignement (% du budget) Health Santé Hospital beds - Total (per 10 000 Nombre de lits d'hôpitaux - Total ... ... ... ... ... ... ... ... ... population) (pour 10 000) Nurses - Total (per 10 000 Nombre d'infirmières - Total (pour ... ... ... ... ... ... ... ... ... population) 10 000) Physicians - Total (per 10 000 Nombre de médecins - Total (pour ... ... ... ... ... ... ... ... ... population) 10 000) Public expenditure on Health (% of Dépenses publiques consacrées à la ... ... ... ... ... ... ... ... ... budget) santé (% du budget) African Statistical Yearbook 2011 / Annuaire Statistique pour l'Afrique 2011
  • 332.
    Uganda Ouganda II NATIONAL ACCOUNTS — COMPTES NATIONAUX 2002 2003 2004 2005 2006 2007 2008 2009 2010 Gross domestic product by kind of economic activity at current prices Produit intérieur brut par branche d'activité économique aux prix courants Uganda Shilling (Millions) Shilling Ugandais(Millions) Agriculture 2 685 3 322 3 520 4 284 4 553 4 827 6 083 7 774 ... Agriculture Mining and quarrying 37 37 42 49 55 67 81 80 ... Industries extractives Manufacturing 865 959 1 066 1 226 1 394 1 616 2 041 2 581 ... Industries manufacturières Electricity, gas & water 439 479 527 662 783 1 062 1 172 1 363 ... Electricité, gaz et eau Construction 1 349 1 551 1 816 2 156 2 256 2 840 3 458 3 895 ... Bâtiments et travaux publics Wholesale & retail trade, Commerce de gros et de détail, 2 051 2 347 2 552 2 991 3 556 4 240 5 289 6 829 ... restaurants, hotels restaurants et hôtels Banques, assurances, affaires Finance, insurance, real estate, etc. 1 400 1 611 1 802 1 990 2 259 2 687 3 139 3 643 ... immobilières Transport and communications 580 688 788 916 1 218 1 474 1 772 2 129 ... Transport(s) et communications Administrations publiques et Public administration and defense 512 567 596 658 720 747 845 940 ... défense Other services 1 269 1 439 1 606 1 851 2 146 2 288 2 484 2 785 ... Autres services Moins Services d’intermédiation Less Imputed Service Charges - 148 - 228 - 253 - 274 - 330 - 408 - 512 - 651 ... financière Gross domestic product at factor Produit intérieur brut aux couts des 11 039 12 771 14 063 16 507 18 611 21 440 25 852 31 368 ... cost / basic prices facteurs / prix de base Plus: Indirect Taxes / taxes on Plus taxes indirectes/impôts sur les 951 1 072 1 209 1 371 1 555 1 911 2 326 2 799 ... products, less subsidies produits, moins les subventions Expenditure on Gross domestic product at current purchaser's values Emploi du produit intérieur brut aux prix courants d'acquisition Uganda Shilling (Millions) Shilling Ugandais(Millions) Consommation finale des Government final consumption 1 872 2 051 2 216 2 441 2 692 2 609 2 814 3 567 ... administrations publiques Private final consumption 9 388 10 649 11 394 13 387 16 142 17 970 22 901 28 466 ... Consommation finale privée Gross fixed capital formation 2 319 2 804 3 300 3 813 4 126 5 304 5 672 7 322 ... Formation brute de capital fixe Increase in inventories 36 62 18 42 53 62 77 93 ... Variation des stocks Exports of goods and services 1 267 1 648 2 046 2 717 3 003 4 405 5 625 6 760 ... Exportations de biens et services Moins importations de biens et 331 Less imports of goods and services 2 893 3 371 3 702 4 521 5 851 7 000 8 912 12 040 ... services GDP at purchasers' values 11 990 13 843 15 271 17 878 20 166 23 351 28 178 34 167 ... PIB aux prix d'acquisition Gross domestic product by kind of economic activity at constant Produit intérieur brut par branche d'activité economique aux prix constants prices Annual Growth Rates (%) Taux de croissance annuel (%) Agriculture 3.0 2.2 1.1 2.5 -1.8 1.7 2.3 2.4 ... Agriculture Mining and quarrying 13.0 -5.5 9.9 21.4 18.2 5.0 10.4 -8.8 ... Industries extractives Manufacturing 3.5 6.2 4.4 9.5 3.5 7.6 7.2 10.1 ... Industries manufacturières Electricity, gas & water 6.1 3.7 5.0 2.4 -3.7 5.3 4.0 8.9 ... Electricité, gaz et eau Construction 14.8 9.5 12.5 24.6 10.0 8.8 21.6 -4.4 ... Bâtiments et travaux publics Wholesale & retail trade, Commerce de gros et de 5.8 6.6 4.8 10.8 9.5 12.0 13.3 3.9 ... restaurants, hotels détail,restaurants et hôtels Banques, assurances, affaires Finance, insurance, real estate, etc. 9.6 3.7 6.9 8.4 8.7 4.2 8.4 10.7 ... immobilières Transport and communications 10.0 11.0 11.6 7.0 21.7 12.6 22.7 10.2 ... Transport(s) et communications Administrations publiques et Public administartion and defense 11.7 5.6 1.0 4.7 3.0 3.7 8.8 4.7 ... défense Other services 11.1 8.6 7.6 8.6 10.3 3.3 1.4 4.5 ... Autres services Moins Services d’intérmediation Less Imputed Service Charges 67.8 -25.6 0.4 28.0 33.8 -17.5 22.9 -53.1 ... financière Gross domestic product at factor Produit intérieur brut aux couts des 7.0 6.2 5.7 9.2 6.4 6.9 10.2 4.8 ... cost / basic prices facteurs / prix de base Plus: Indirect Taxes / taxes on Plus taxes indirectes/impôts sur les 8.1 6.0 6.7 19.5 13.4 19.1 12.6 9.2 ... products, less subsidies produits, moins les subventions Gross domestic product at market Produit intérieur brut aux prix du 7.1 6.2 5.8 10.0 7.0 8.1 10.4 5.3 ... prices marché Break in the serie from 2004 Rupture de la série à partir 2004 African Statistical Yearbook 2011 / Annuaire Statistique pour l'Afrique 2011
  • 333.
    Uganda Ouganda Expenditure on Gross domestic product at constant purchasers' Emplois du produit intérieur brut aux prix constants d'acquisition values Annual Growth Rates (%) Taux de croissance annuel (%) Consommation finale des Government final consumption 7.4 4.5 3.7 4.5 3.7 -1.5 -0.5 5.3 ... administrations publiques Private final consumption 6.6 1.4 3.4 8.1 12.3 3.3 8.8 5.3 ... Consommation finale privée Gross fixed capital formation 9.6 10.7 13.8 20.2 11.0 15.4 6.7 5.3 ... Formation brute de capital fixe Exports of goods and services 8.1 9.5 20.9 21.5 -6.3 54.4 45.8 5.3 ... Exportations de biens et services Moins importations de biens et Less imports of goods and services 8.2 -4.4 9.6 16.8 17.2 17.3 19.4 5.3 ... services III INFLATION 2002 2003 2004 2005 2006 2007 2008 2009 2010 Annual Growth Rates (%) Taux de croissance annuel (%) All Item -0.3 8.7 3.7 8.6 7.2 6.1 12.0 13.0 4.0 Ensemble Food 3.2 -0.2 -3.1 -6.8 5.7 2.5 19.0 25.2 -5.6 Alimentation Health -0.1 4.3 3.0 3.8 3.5 4.6 7.7 12.9 0.3 Santé Energy 2.9 5.3 3.8 7.4 8.7 16.6 10.3 6.7 -3.8 Energie Transport -0.1 4.3 3.0 3.8 3.5 4.6 7.7 2.4 -8.9 Transport IV AGRICULTURAL PRODUCTION - PRODUCTION AGRICOLE 2002 2003 2004 2005 2006 2007 2008 2009 2010 Tons (Thousand) Tonnes (milliers) Plantains, Tons (thousands) 9 888 9 700 9 686 9 045 9 054 9 231 9 371 9 512 ... Plantains, tonnes (milliers) Cassava, Tons (thousands) 5 373 5 450 5 500 5 576 4 926 4 456 5 072 5 179 ... Manioc, tonnes (milliers) Sweet potato, Tons (thousands) 2 592 2 610 2 650 2 604 2 628 2 602 2 707 2 766 ... Patates douces, tonnes (milliers) Maze, Tons (thousands) 1 217 1 300 1 080 1 170 1 258 1 262 1 266 1 272 ... Maïs, tonnes (milliers) Millet, Tons (thousands) 590 640 659 672 687 732 783 841 ... Millet, tonnes (milliers) V MINING PRODUCTION - PRODUCTION MINIERE 332 2002 2003 2004 2005 2006 2007 2008 2009 2010 Gold ores and concentrates Minerais d'or et concentrés 2.6 ... ... 46.0 21.9 25.4 1.9 0.0 ... (Kilograms) (Kilogrammes) Salt and pure sodium chloride, 5 000.0 5 000.0 5 000.0 5 000.0 5 000.0 5 000.0 ... ... ... Sel et chlorure de sodium pur, metric tons (thousands) tonnes métriques (milliers) Abrasives, natural, metric tons Abrasifs naturels, tonnes métriques 12 388.0 65 587.0 134 644.0 140 000.0 ... ... ... ... ... (thousands) (milliers) VI ENERGY - ENERGIE 2002 2003 2004 2005 2006 2007 2008 2009 2010 Electricity - total hydro production, Électricité - production hydraulique 1 741.0 1 796.0 1 940.0 1 813.0 1 239.0 1 412.0 ... ... ... kilowatt hours (millions) totale, kilowatt-heures (millions) Electricity - total thermal production, Électricité - production thermique 6.2 6.2 2.2 67.4 376.0 540.0 ... ... ... kilowatt hours (millions) totale, kilowatt-heures (millions) Electricity - total production, self- Electricité - Production totale privée 45 45 47 47 47 47 ... ... ... producer (Million Kilowatt Hours) (million de kilowatt heures) Electricity - total production, public Electricité - Production totale 1 702 1 757 1 895 1 833 1 568 1 905 ... ... ... (Million Kilowatt Hours) publique (million de kilowatt heures) African Statistical Yearbook 2011 / Annuaire Statistique pour l'Afrique 2011
  • 334.
    Uganda Ouganda VII TOURISM AND INFRASTRUCTURE - TOURISME ET INFRASTUCTURE 2002 2003 2004 2005 2006 2007 2008 2009 2010 Arrivals - Tourists (thousands) 254 305 512 468 539 642 844 806 ... Arrivées - touristes (milliers) Rooms in hotels and similar Chambres d'hotels et établissements establishments (thousands) 19 ... ... ... ... ... ... ... ... assimilés (milliers) Paved Road (% of total) ... 23 ... ... ... ... ... ... ... Routes asphaltées (% du total) Total Network (Railways-km) 259 ... 259 ... ... ... ... ... ... Réseau total voies ferrées-Km Main Telephone Lines (per 1,000 Lignes téléphoniques fixes (pour 2 2 3 3 4 5 5 ... ... inhabitants) 1000 habitants) Mobile Cellular Subscribers (per Abonnés aux téléphones mobiles 15 29 42 46 68 137 270 ... ... 1,000 inhabitants) (pour 1000 habitants) VII FINANCIAL AND MONETARY STATISTICS - FINANCES ET STATISTIQUES MONETAIRES 2002 2003 2004 2005 2006 2007 2008 2009 2010 VII-1 Monetary Statistics VII-1 Statistiques monétaires Uganda Shilling (Millions) Shilling Ugandais(Millions) Money supply (M1) 1 416 841 1 717 592 1 851 288 2 113 523 2 522 511 3 086 580 3 780 280 4 401 000 5 911 750 Masse monétaire (M1) Quasi-money 646 425 719 061 797 156 989 878 1 108 680 1 337 260 2 005 600 2 396 740 3 442 960 Quasi-monnaie of which Demand Deposit ... ... ... ... ... ... ... ... ... dont Monnaie scripturale Net foreign assets 1 472 240 2 218 340 2 510 270 2 679 430 3 784 990 4 942 420 5 014 410 5 216 110 6 299 060 Avoirs extérieurs nets Domestic credit 1 402 940 1 222 180 1 219 900 1 359 650 1 168 560 1 010 950 2 880 380 3 483 720 5 870 800 Crédit intérieur of which claims on private sector 861 494 1 045 260 1 221 870 1 382 870 1 840 770 2 167 710 3 405 400 3 995 280 5 459 690 dont créances sur le secteur privé of which Claims on government dont créances nettes sur le 497 497 130 089 - 55 240 - 85 277 - 761 236 -1 262 660 - 642 478 - 635 426 343 575 sector, net gouvernement International reserves (millions of US Réserves internationales (millions de 934 1 080 1 308 1 344 1 811 2 560 2 301 2 994 2 960 $) $ EU) Average Exchange Rate (National Taux de change (moyen) (monnaie 1 797.55 1 963.72 1 810.30 1 780.67 1 831.45 1 723.49 1 720.44 2 030.49 2 177.56 Currency per us $) nationale par dollars) VII-2 Public Finance VII-2 Finances publiques Uganda Shilling (Millions) Shilling Ugandais(Millions) Total Revenues and Grants 2 027 978 2 231 781 2 814 600 3 101 600 3 325 716 3 915 918 3 993 470 4 641 699 5 166 416 Recettes totales et dons Tax Revenue 1 151 220 1 394 360 1 642 100 1 887 700 2 324 574 2 706 224 3 224 264 3 758 250 4 199 818 Recettes fiscales Non Tax Revenue 153 558 120 212 27 200 32 200 103 627 121 903 30 724 34 640 42 000 Recettes non fiscales Grants 723 200 717 209 1 145 300 1 181 700 897 515 1 087 791 738 482 848 809 924 598 Dons 333 Total Expenditures and Net Lending 2 447 750 2 770 000 3 182 800 3 222 600 3 609 200 4 210 000 3 906 120 4 620 110 5 785 628 Dépenses totales et prêts nets Current expenditure 1 226 700 1 403 900 1 656 100 1 683 300 1 992 070 2 070 260 2 242 900 2 576 330 2 869 538 Dépenses courantes Of which Wages and Salaries 541 500 612 300 682 900 774 200 866 500 986 500 1 106 100 1 183 600 1 307 000 Dont rémunérations et salaires Capital expenditure 1 019 000 1 141 900 1 188 800 1 232 000 1 314 400 1 516 100 1 436 700 1 657 100 2 491 100 Dépenses d'équipement Net Lending 4 850 - 12 700 9 200 - 7 600 - 29 270 101 100 - 162 890 - 56 690 - 31 110 Prêts nets Fiscal Balance - 419 772 - 538 219 - 368 200 - 121 000 - 283 484 - 294 082 87 350 21 589 - 619 212 Solde global y compris les dons VII-3 Balance of Payments VII-3 Balance des paiements US $ (Millions) $ E.U(Millions) Trade balance - 534 - 620 - 599 - 698 - 928 - 995 - 913 - 1 250 - 1 718 Balance commerciale Services Balance - 298 - 278 - 60 - 106 - 175 - 271 - 474 - 437 - 735 Balance des services Net Income - 134 - 137 - 215 - 272 - 249 - 229 - 254 - 268 - 359 Revenus nets Current transfers, net total 684 770 993 1 136 1 037 1 178 1 274 1 328 1 104 Transferts courants Current account balance - 283 - 265 119 60 - 315 - 316 - 367 - 628 - 1 707 Solde du compte courant VII-4 External Debt and Financial Flows VII-4 Dette extérieure et flux financiers US $ (Millions) $ E.U (Millions) Total external debt 3 799 4 211 4 465 4 422 4 464 1 468 1 881 2 420 2 839 Dette extérieure totale Private 4 0 0 4 5 6 115 115 101 Privée Public 3 796 4 211 4 465 4 418 4 459 1 462 1 766 2 305 2 738 Publique Total external debt service 159 165 183 187 262 3 509 78 68 102 Service de la dette extérieure Net Foreign Direct Investment Investissements étranger direct (flux 185 202 295 380 644 733 787 799 ... Inflows nets entrants) Net Total Official Development Aide publique au développement 725 997 1 216 1 192 1 554 1 737 1 641 1 786 ... assistance (nette totale) African Statistical Yearbook 2011 / Annuaire Statistique pour l'Afrique 2011
  • 335.
    Uganda Ouganda 2002 2003 2004 2005 2006 2007 2008 2009 2010 US $ (Millions) Shilling Ugandais Exports, fob Exportations, fàb Exports - Total 481 526 759 1 016 1 188 1 686 2 703 3 093 ... Exportations - Total Main Products Principaux produits Coffee, not roasted, not 132 154 163 187 178 227 362 357 ... Café, non torréfié, non décaféiné decaffeinated Filet de poisson ou de viande, Fish fillets and other fish meat, 49 46 91 138 128 115 103 89 ... hachée ou non, fraîches ou minced or not, fresh or chilled réfrigérées Tobacco, unmanufactured, stemmed 40 41 52 55 31 69 75 78 ... Tabac, artisanal, filtre, ou emballe or stripped Portland cement nes 1 2 3 9 15 35 49 30 ... Ciment Portland NDA Cut flowers and flower buds for Cut flowers and flower buds for 15 20 26 29 27 30 38 36 ... bouquets, etc., fresh bouquets, etc., fresh Main Destinations Principales destinations Belgium 61.1 44.0 68.0 84.6 75.4 91.8 133.5 99.9 ... Belgique Netherlands 49.1 60.5 75.2 78.4 63.4 86.4 80.9 86.9 ... Pays-Bas Rwanda 8.0 14.2 23.4 39.8 61.5 98.3 148.5 143.0 ... Rwanda France 13.8 18.2 40.4 78.3 80.4 86.7 85.9 47.2 ... France Germany 28.4 34.3 33.0 44.1 60.4 75.7 101.0 96.7 ... Allemagne 2002 2003 2004 2005 2006 2007 2008 2009 2010 Imports, cif Importations, cif 334 Imports - Total ... ... ... ... ... ... ... ... ... Importations - Total (millions) Principaux produits Main Products Medicaments nes, in dosage 22 50 43 65 114 87 122 131 ... Médicaments nda, en dosage Portland cement nes 11 18 19 31 39 52 85 87 ... Ciment Portland NDA Petroleum oils&oils obtained from Huiles de pétrole, bitumineux, bituminous minerals,o/than crude 193 215 265 261 46 54 66 54 ... distilles, sauf brut etc Transmission apparatus,for Appareils de transmission, pour les radioteleph incorporatg reception 9 11 33 43 80 95 52 74 ... appareils de réception radioteleph apparatus incorporatg Electrical apparatus for line Appareils électriques pour la 2 4 4 7 3 22 41 16 ... telephony/telegraphy nes téléphonie ou la télégraphie NDA Main Origin Principales provenances Kenya 301.7 401.1 470.4 566.2 387.0 498.9 614.7 598.3 ... Kenya China 28.1 51.4 76.4 79.4 137.8 202.9 230.1 231.2 ... Chine India 62.1 83.8 77.3 84.8 109.8 133.8 183.5 226.9 ... Inde South Africa 57.2 62.3 87.2 87.6 103.2 152.9 165.8 147.5 ... Afrique du Sud Japan 30.1 35.8 63.0 60.6 81.9 125.2 186.7 127.7 ... Japon African Statistical Yearbook 2011 / Annuaire Statistique pour l'Afrique 2011
  • 336.
    Zambia Zambie AREA (KM 2) 752 618 SUPERFICIE (KM 2) CAPITAL CITY Lusaka Lusaka CAPITALE CURRENCY Zambian Kwacha Kwacha MONNAIE I SOCIAL AND DEMOGRAPHIC INDICATORS — INDICATEURS DEMOGRAPHIQUES ET SOCIAUX 2002 2003 2004 2005 2006 2007 2008 2009 2010 Population Population Population au milieu de l'année - Mid-year population - Total (Million) 11.0 11.2 11.5 11.7 12.0 12.3 12.6 12.9 13.3 Total (million) Population au milieu de l'année - Mid-year population - Urban (%) 34.8 34.9 34.9 35.0 35.1 35.2 35.3 35.5 35.7 Urbaine (%) Female (%) 62.0 61.8 61.6 61.4 61.2 61.1 60.9 60.8 60.7 Femme (%) Population by Age Group Population par groupe d'âge 0-14 4997 969 5130 431 5265 370 5403 821 5545 979 5690 804 5836 609 5981 108 6122 581 0-14 15-64 5655 353 5760 074 5868 684 5986 296 6114 810 6253 798 6403 214 6562 233 6730 359 15-64 65+ 318 923 328 455 338 224 348 315 358 692 369 340 380 396 392 027 404 329 65+ Active Population (000) 4 179.5 4 248.0 4 320.1 4 400.2 4 487.6 4 583.8 4 688.5 4 815.7 4 942.3 Population active (000) Female (%) 44.6 44.4 44.3 44.1 44.0 43.8 43.7 43.3 43.2 Femme (%) Taux brut de natalité - Total (par Crude birth rate - Total (per 1000) 45.0 45.0 44.0 44.0 43.0 43.0 42.0 42.0 43.0 1000) Taux brut de mortalité - Total (par Crude death rate - Total (per 1000) 14.0 13.0 13.0 13.0 13.0 13.0 13.0 13.0 17.0 1000) Life expectancy at birth - Total Espérance de vie à la naissance - 52.0 52.0 52.0 53.0 52.0 51.0 51.0 51.0 45.0 (years) Total (années) Net reproduction rate - (per Taux net de reproduction - (par ... ... ... 2.0 ... ... ... ... 2.0 woman) femme) Indice synthétique de fécondité - Total fertility rate - (p woman) y (per ) 6.0 6.0 6.0 6.0 6.0 6.0 6.0 6.0 6.0 (par femme) Education Enseignement Teaching staff at first level - Total Personnel enseignant - 1er degré - 31.49 ... 36.1 39.1 40.7 44.0 48.1 61.8 ... (thousands) Total (milliers) Teaching staff at second level - Total Personnel enseignant - 2ème degré - 18.72 ... ... 19.5 ... 26.8 29.1 15.4 ... 335 (thousands) Total (milliers) Teaching staff at third level - Total Personnel enseignant - 3ème degré - ... 0.6 0.8 0.6 0.8 1.7 1.7 ... ... (thousands) Total (milliers) First level student enrollment - Total Elèves inscrits - 1er degré - Total 1 732 ... 2 251 2 573 2 679 2 790 2 909 2 841 ... (thousands) (milliers) First level student enrollment - Elèves inscrits - 1er degré - Femmes 832 ... 1 096 1 252 1 322 1 369 1 433 1 407 ... Female (thousands) (milliers) Second level student enrollment - Elèves inscrits - 2ème degré - Total 351 ... 364 443 ... 556 677 708 ... Total (thousands) (milliers) Second level student enrollment - Elèves inscrits - 2ème degré - 159 ... 160 198 ... 265 311 322 ... Female (thousands) Femmes (milliers) Third level student enrollment - Total Elèves inscrits - 3ème degré - Total ... ... ... ... ... ... ... ... ... (thousands) (milliers) Third level student enrollment - Elèves inscrits - 3ème degré - ... ... ... ... ... ... ... ... ... Female (thousands) Femmes (milliers) Public expenditure on education (% Dépenses publiques consacrées à ... ... 14.8 ... ... ... ... ... ... of budget) l'enseignement (% du budget) Health Santé Hospital beds - Total (per 10 000 Nombre de lits d'hôpitaux - Total ... 22 22 ... ... 19 ... 30 ... population) (pour 10 000) Nurses - Total (per 10 000 Nombre d'infirmières - Total (pour ... ... 169 ... ... 515 ... 700 ... population) 10 000) Physicians - Total (per 10 000 Nombre de médecins - Total (pour ... ... 11 ... ... 572 ... 11 ... population) 10 000) Public expenditure on Health (% of Dépenses publiques consacrées à la 14 13 14 15 16 ... ... ... ... budget) santé (% du budget) African Statistical Yearbook 2011 / Annuaire Statistique pour l'Afrique 2011
  • 337.
    Zambia Zambie II NATIONAL ACCOUNTS — COMPTES NATIONAUX 2002 2003 2004 2005 2006 2007 2008 2009 2010 Gross domestic product by kind of economic activity at current prices Produit intérieur brut par branche d'activité économique aux prix courants Zambian Kwacha(Billions) Kwacha(Milliards) Agriculture 3 247 4 245 5 568 6 724 7 800 9 140 10 864 13 470 ... Agriculture Mining and quarrying 575 565 810 1 031 1 613 2 037 2 228 805 ... Industries extractives Manufacturing 1 694 2 241 2 828 3 430 4 016 4 487 5 125 6 011 ... Industries manufacturières Electricity, gas & water 488 595 695 923 1 166 1 345 1 512 1 805 ... Electricité, gaz et eau Construction 1 068 1 590 2 322 3 216 4 704 6 693 8 811 12 468 ... Bâtiments et travaux publics Wholesale & retail trade, Commerce de gros et de détail, 3 411 4 402 5 515 6 763 7 645 8 750 10 128 11 554 ... restaurants, hotels restaurants et hôtels Banques, assurances, affaires Finance, insurance, real estate, etc. 2 534 3 189 3 975 4 751 5 543 6 325 7 648 9 264 ... immobilières Transport and communications 1 056 1 058 1 252 1 396 1 629 1 984 2 249 2 313 ... Transport(s) et communications Administrations publiques et Public administration and defense 647 752 797 1 002 983 1 258 1 446 1 483 ... défense Other services 832 1 077 1 326 1 805 2 479 3 066 4 019 5 159 ... Autres services Moins Services d’intermédiation Less Imputed Service Charges - 858 - 1 062 - 1 312 - 1 593 - 1 866 - 2 096 - 2 592 - 3 205 ... financière Gross domestic product at factor Produit intérieur brut aux couts des 14 694 18 651 23 774 29 447 35 712 42 989 51 438 61 127 ... cost / basic prices facteurs / prix de base Plus: Indirect Taxes / taxes on Plus taxes indirectes/impôts sur les 1 631 1 900 2 219 2 594 2 849 3 205 3 640 3 200 ... products, less subsidies produits, moins les subventions Expenditure on Gross domestic product at current purchaser's values Emploi du produit intérieur brut aux prix courants d'acquisition Zambian Kwacha(Billions) Kwacha(Milliards) Consommation finale des Government final consumption 2 109 2 981 4 866 6 563 7 857 9 080 12 123 13 797 ... administrations publiques Private final consumption 11 344 13 750 16 791 20 127 22 432 26 169 32 518 33 167 ... Consommation finale privée Gross fixed capital formation 3 517 5 055 7 369 8 830 9 450 9 529 10 780 14 626 ... Formation brute de capital fixe Increase in inventories 219 270 360 369 505 623 767 899 ... Variation des stocks Exports of goods and services 3 850 4 190 6 996 7 610 14 787 18 900 19 377 22 670 ... Exportations de biens et services 336 Moins importations de biens et Less imports of goods and services 4 715 5 696 10 389 11 457 16 470 18 105 20 488 20 832 ... services GDP at purchasers' values 16 324 20 551 25 993 32 042 38 561 46 195 55 079 64 326 ... PIB aux prix d'acquisition Gross domestic product by kind of economic activity at constant Produit intérieur brut par branche d'activité economique aux prix constants prices Annual Growth Rates (%) Taux de croissance annuel (%) Agriculture -1.7 5.1 4.2 -0.6 2.2 0.4 2.6 7.1 ... Agriculture Mining and quarrying 16.4 3.4 13.9 7.9 7.3 3.6 2.5 15.7 ... Industries extractives Manufacturing 5.7 7.6 4.7 2.9 5.8 3.0 1.8 2.5 ... Industries manufacturières Electricity, gas & water -5.2 0.4 -1.7 5.5 10.5 1.0 -1.2 8.6 ... Electricité, gaz et eau Construction 17.4 21.6 20.5 21.2 14.4 20.0 8.7 15.6 ... Bâtiments et travaux publics Wholesale & retail trade, Commerce de gros et de 5.0 6.2 5.1 3.5 3.7 3.4 2.9 0.4 ... restaurants, hotels détail,restaurants et hôtels Banques, assurances, affaires Finance, insurance, real estate, etc. 1.9 4.8 6.4 11.0 22.0 19.2 15.8 3.1 ... immobilières Transport and communications 4.0 3.7 3.8 3.2 3.6 3.6 5.6 4.0 ... Transport(s) et communications Administrations publiques et Public administartion and defense -1.0 0.2 0.3 6.2 -8.7 14.7 2.2 -10.3 ... défense Other services 4.7 3.1 0.9 17.0 26.3 10.9 18.6 17.6 ... Autres services Moins Services d’intérmediation Less Imputed Service Charges 2.6 2.5 2.5 2.5 2.6 2.5 2.5 2.6 ... financière Gross domestic product at factor Produit intérieur brut aux couts des 4.6 6.0 6.2 5.9 7.0 6.7 5.6 6.3 ... cost / basic prices facteurs / prix de base Plus: Indirect Taxes / taxes on Plus taxes indirectes/impôts sur les -6.7 -2.7 -2.7 -0.1 -3.0 -0.3 5.7 6.3 ... products, less subsidies produits, moins les subventions Gross domestic product at market Produit intérieur brut aux prix du 3.3 5.1 5.4 5.3 6.2 6.2 5.7 6.3 ... prices marché 2008: semi-final 2009: Provisional 2008: semi-définitif 2009: provisoire African Statistical Yearbook 2011 / Annuaire Statistique pour l'Afrique 2011
  • 338.
    Zambia Zambie Expenditure on Gross domestic product at constant purchasers' Emplois du produit intérieur brut aux prix constants d'acquisition values Annual Growth Rates (%) Taux de croissance annuel (%) Consommation finale des Government final consumption 2.3 19.3 39.0 14.0 9.8 4.4 18.7 -3.4 ... administrations publiques Private final consumption 15.1 4.6 -19.2 2.3 8.7 20.5 2.0 2.3 ... Consommation finale privée Gross fixed capital formation 18.0 19.0 9.9 2.4 8.4 16.2 12.1 -3.1 ... Formation brute de capital fixe Exports of goods and services -22.3 -16.3 38.9 5.4 7.2 -30.5 -3.9 30.6 ... Exportations de biens et services Moins importations de biens et Less imports of goods and services 1.8 1.7 14.2 3.1 8.5 6.9 2.7 5.4 ... services III INFLATION 2002 2003 2004 2005 2006 2007 2008 2009 2010 Annual Growth Rates (%) Taux de croissance annuel (%) All Item 26.7 17.2 17.5 15.9 8.2 8.9 16.6 9.9 7.1 Ensemble Food 35.5 13.5 16.3 17.5 -0.2 5.9 20.5 8.0 1.2 Alimentation Health 15.6 19.1 13.5 10.5 25.1 9.1 9.9 15.9 0.1 Santé Energy 17.0 21.6 17.3 26.5 13.0 11.2 15.2 11.4 ... Energie Transport 13.3 10.4 21.0 -3.5 15.2 13.6 15.9 -3.4 1.0 Transport IV AGRICULTURAL PRODUCTION - PRODUCTION AGRICOLE 2002 2003 2004 2005 2006 2007 2008 2009 2010 Tons (Thousand) Tonnes (milliers) Maize, Tons (thousands) 840 1 207 1 214 866 1 424 1 366 1 446 1 889 ... Maïs, tonnes (milliers) Wheat, Tons (thousands) 75 84 100 137 94 116 113 195 ... Blé, tonnes (milliers) Cotton lint, Tons (thousands) 66 65 144 155 118 55 89 87 ... Fibres de coton, tonnes (milliers) Groundnuts in shell, Tons Arachides en coques, tonnes 76 83 70 74 84 55 85 121 ... (thousands) (milliers) Soya beans, Tons (thousands) 35 42 55 90 58 55 57 119 ... Graines de soja, tonnes (milliers) V MINING PRODUCTION - PRODUCTION MINIERE 337 2002 2003 2004 2005 2006 2007 2008 2009 2010 Minerai de cuivre et leurs Copper ores, Tons (thousands) 337 742.7 353 594.0 422 180.7 465 002.0 515 618.1 550 731.2 575 036.7 336 980.3 ... concentrés, tonnes métriques Cobalt, Tons (thousands) 3 984.4 6 493.0 6 081.6 5 530.8 4 647.8 4 413.5 4 053.4 1 714.4 ... Cobalt, tonnes métriques (milliers) ... ... ... ... ... ... ... ... ... VI ENERGY - ENERGIE 2002 2003 2004 2005 2006 2007 2008 2009 2010 Electricity - total hydro production, Électricité - production hydraulique 50.0 51.0 52.0 55.0 56.0 57.0 57.0 57.0 ... kilowatt hours (millions) totale, kilowatt-heures (millions) Electricity - total thermal production, Électricité - production thermique 8 102.0 8 257.0 8 460.0 8 883.0 9 329.0 9 796.0 9 534.0 4 978.2 ... kilowatt hours (millions) totale, kilowatt-heures (millions) Electricity - total production, self- Electricité - Production totale privée 199 209 219 232 243 255 ... ... ... producer (Million Kilowatt Hours) (million de kilowatt heures) Electricity - total production, public Electricité - Production totale 7 953 8 099 8 293 8 706 9 142 9 598 ... ... ... (Million Kilowatt Hours) publique (million de kilowatt heures) African Statistical Yearbook 2011 / Annuaire Statistique pour l'Afrique 2011
  • 339.
    Zambia Zambie VII TOURISM AND INFRASTRUCTURE - TOURISME ET INFRASTUCTURE 2002 2003 2004 2005 2006 2007 2008 2009 2010 Arrivals - Tourists (thousands) 565 413 515 669 757 897 812 ... ... Arrivées - touristes (milliers) Rooms in hotels and similar Chambres d'hotels et établissements establishments (thousands) 5 5 5 ... ... ... ... ... ... assimilés (milliers) Paved Road (% of total) 11 11 11 11 11 11 11 11 ... Routes asphaltées (% du total) Total Network (Railways-km) 59 596 59 596 59 596 59 596 59 596 59 596 59 596 59 596 ... Réseau total voies ferrées-Km Main Telephone Lines (per 1,000 Lignes téléphoniques fixes (pour 8 10 8 8 8 8 8 7 ... inhabitants) 1000 habitants) Mobile Cellular Subscribers (per Abonnés aux téléphones mobiles 13 19 37 83 144 225 270 323 ... 1,000 inhabitants) (pour 1000 habitants) VII FINANCIAL AND MONETARY STATISTICS - FINANCES ET STATISTIQUES MONETAIRES 2002 2003 2004 2005 2006 2007 2008 2009 2010 VII-1 Monetary Statistics VII-1 Statistiques monétaires Zambian Kwacha(Millions) Kwacha(Millions) Money supply (M1) 2 454 705 2 976 488 3 900 974 3 823 712 5 773 490 7 118 170 8 490 480 9 096 740 11 946 510 Masse monétaire (M1) Quasi-money 929 793 1 253 360 1 680 540 1 934 110 2 528 380 3 281 290 4 324 630 4 700 170 5 650 700 Quasi-monnaie of which Demand Deposit ... ... ... ... ... ... ... ... ... dont Monnaie scripturale Net foreign assets -3 001 020 -3 016 480 -2 108 760 - 352 672 3 498 340 4 552 020 4 984 690 4 913 220 6 855 600 Avoirs extérieurs nets Domestic credit 7 636 760 7 863 210 9 119 700 7 227 810 6 422 960 7 572 070 10 337 800 11 976 000 14 314 900 Crédit intérieur of which claims on private sector 1 028 270 1 392 270 2 094 850 2 466 400 3 755 150 5 460 280 8 209 280 7 741 450 8 910 070 dont créances sur le secteur privé of which Claims on government dont créances nettes sur le 6 506 960 6 338 350 6 849 470 4 514 350 2 402 020 1 677 860 1 886 130 3 963 130 5 213 240 sector, net gouvernement International reserves (millions of US Réserves internationales (millions de 535 248 337 560 720 1 090 1 096 1 892 2 094 $) $ EU) Average Exchange Rate (National Taux de change (moyen) (monnaie 4 398.59 4 733.27 4 778.88 4 463.50 3 603.07 4 002.52 3 745.66 5 046.11 4 797.14 Currency per us $) nationale par dollars) VII-2 Public Finance VII-2 Finances publiques Zambian Kwacha(Millions) Kwacha(Millions) Total Revenues and Grants 4 247 200 5 114 000 6 177 000 7 467 010 16 825 010 10 626 510 12 290 010 13 105 000 14 229 415 Recettes totales et dons Tax Revenue 2 837 000 3 558 000 4 550 000 5 512 010 6 317 010 8 184 010 9 654 010 9 661 000 ... Recettes fiscales Non Tax Revenue 60 200 132 000 194 000 130 000 301 000 338 500 567 000 654 000 ... Recettes non fiscales 338 Grants 1 350 000 1 424 000 1 433 000 1 825 000 10 207 000 2 104 000 2 069 000 2 790 000 ... Dons Total Expenditures and Net Lending 5 172 000 6 337 000 6 910 000 8 325 000 9 781 000 10 736 000 13 524 000 14 479 000 16 903 573 Dépenses totales et prêts nets Current expenditure 2 089 500 2 842 000 3 297 000 4 590 310 5 784 112 7 236 000 9 066 000 9 538 000 ... Dépenses courantes Of which Wages and Salaries 1 301 200 1 728 000 2 012 000 2 455 000 2 833 000 3 531 000 4 465 000 5 317 000 ... Dont rémunérations et salaires Capital expenditure 1 924 600 2 335 000 2 265 000 2 267 000 1 601 000 1 842 000 1 966 000 2 808 000 ... Dépenses d'équipement Net Lending 86 000 6 000 4 000 - 24 000 483 000 - 474 000 427 000 300 000 ... Prêts nets Fiscal Balance - 924 800 -1 223 000 - 733 000 - 857 990 7 044 010 - 109 490 -1 233 990 -1 374 000 -2 674 158 Solde global y compris les dons VII-3 Balance of Payments VII-3 Balance des paiements US $(Millions) $ E.U(Millions) Trade balance - 214 - 306 - 27 86 1 307 899 405 906 2 472 Balance commerciale Services Balance - 245 - 238 - 216 - 198 - 358 - 640 - 615 - 465 - 1 350 Balance des services Net Income - 148 - 145 - 350 - 604 - 1 168 - 1 545 - 1 399 - 1 361 - 1 933 Revenus nets Current transfers, net total 104 67 29 107 173 530 560 516 545 Transferts courants Current account balance - 504 - 621 - 565 - 609 - 46 - 755 - 1 049 - 403 - 266 Solde du compte courant VII-4 External Debt and Financial Flows VII-4 Dette extérieure et flux financiers US $(Millions) $ E.U(Millions) Total external debt 6 892 6 690 6 225 4 131 533 1 102 1 259 1 578 1 755 Dette extérieure totale Private 7 7 0 0 0 0 0 0 0 Privée Public 6 885 6 683 6 225 4 131 533 1 102 1 259 1 578 1 755 Publique Total external debt service 123 192 373 166 66 69 97 87 83 Service de la dette extérieure Net Foreign Direct Investment Investissements étranger direct (flux 303 347 364 357 616 1 324 939 959 ... Inflows nets entrants) Net Total Official Development Aide publique au développement 811 775 1 130 1 172 1 449 1 008 1 116 1 269 ... assistance (nette totale) African Statistical Yearbook 2011 / Annuaire Statistique pour l'Afrique 2011
  • 340.
    Zambia Zambie 2002 2003 2004 2005 2006 2007 2008 2009 2010 Zambian Kwacha(Millions) Kwacha Exports, fob Exportations, fàb Exports - Total 4 246 5 041 8 720 9 856 14 018 17 805 18 268 20 686 ... Exportations - Total Main Products Principaux produits Cathodes and sections of cathodes Cathodes et sections de cathodes de 2 004 1 866 2 381 3 418 5 268 8 382 7 657 7 667 ... of refined copper cuivre raffiné Plates, sheets and strip, of refined Plaques, feuilles et bandes de cuivre 0 0 43 398 3 227 3 284 3 543 2 315 ... copper, uncoi raffiné, uncoi Minerais de cuivre et leurs Copper ores and concentrates 16 57 173 407 1 807 1 108 2 580 1 340 ... concentrés Other: articles of cobalt, nes 229 232 1 236 746 514 987 1 066 308 ... Autre: articles de cobalt, nda Wire of refined copper, maximum Fil en cuivre raffiné, la plus grande 69 92 209 278 531 595 492 461 ... cross-sectional dimension >6mm dimension transversale> 6mm Main Destinations Principales destinations Switzerland 247.8 365.9 1 228.1 3 322.4 5 462.8 7 876.8 9 274.5 8 824.1 ... Suisse South Africa 1 005.6 1 030.5 1 858.6 881.2 1 652.9 2 250.3 1 942.8 1 792.5 ... Afrique du Sud United Kingdom 1 676.7 1 217.6 1 327.6 340.0 365.0 224.2 428.7 391.8 ... Royaume-Uni China 16.9 79.8 166.4 852.1 983.8 755.1 1 057.8 2 021.8 ... Chine Congo, DR 204.9 288.1 551.6 485.1 535.5 1 128.4 1 052.7 1 394.7 ... Congo, RD 2002 2003 2004 2005 2006 2007 2008 2009 2010 Imports, cif Importations, cif Imports - Total 5 825 7 250 9 078 10 609 10 447 15 896 18 765 21 823 ... Importations - Total (millions) 339 Principaux produits Main Products Petroleum oils and oils obtained from Huiles de pétrole, les huiles de 2 196 642 454 833 916 1 747 2 040 ... bituminous minerals, crude minéraux bitumineux, brut Minerais de cuivre et leurs Copper ores and concentrates 10 15 43 69 107 552 1 581 1 155 ... concentrés Gas oils. 111 120 160 314 385 536 676 108 ... Gas-oils Diesel non dual purpose vehicles for Diesel but non double pour les 105 109 150 208 198 166 238 161 ... either person véhicules soit à la personne Urea 55 67 144 112 108 161 146 311 ... Urée Main Origin Principales provenances South Africa 3 446.2 3 698.9 4 794.3 5 170.8 5 146.5 7 010.9 7 841.3 6 841.5 ... Afrique du Sud United Kingdom 400.8 440.4 1 524.1 1 441.4 416.3 598.6 573.3 624.8 ... Royaume-Uni Congo, DR 15.5 78.7 100.3 160.5 204.3 658.7 1 986.1 2 010.1 ... Congo, DR Zimbabwe 424.5 977.6 594.9 497.8 633.1 453.8 381.4 258.4 ... Zimbabwe United Arab Emirates 80.3 320.8 698.8 423.2 1 148.6 1 003.9 448.3 478.1 ... Émirats Arabes Unis African Statistical Yearbook 2011 / Annuaire Statistique pour l'Afrique 2011
  • 341.
    Zimbabwe Zimbabwe AREA (KM 2) 390 760 SUPERFICIE (KM 2) CAPITAL CITY Harare Harare CAPITALE CURRENCY Zimbabwe Dollar Dollar Zimbabween MONNAIE I SOCIAL AND DEMOGRAPHIC INDICATORS — INDICATEURS DEMOGRAPHIQUES ET SOCIAUX 2002 2003 2004 2005 2006 2007 2008 2009 2010 Population Population Population au milieu de l'année - Mid-year population - Total (Million) 11.6 12.5 13.0 13.1 13.2 13.3 13.4 13.8 ... Total (million) Population au milieu de l'année - Mid-year population - Urban (%) 34.6 ... 35.0 36.0 36.0 37.0 29.0 37.8 ... Urbaine (%) Female (%) 51.3 51.3 51.4 51.5 51.6 51.6 51.9 51.7 ... Femme (%) Population by Age Group Population par groupe d'âge 0-14 4722 013 5183 737 5149 380 5114 015 5078 348 5043 916 5014 762 4995 760 ... 0-14 15-64 6445 950 6872 744 6880 515 6889 493 6899 538 6913 359 6945 524 7014 225 ... 15-64 65+ 463 694 453 711 462 400 471 576 481 467 491 945 502 595 512 799 ... 65+ Active Population (000) 5 234.0 5 248.0 5 258.0 5 271.0 5 292.0 5 320.0 5 373.0 5 449.0 ... Population active (000) Female (%) 46.0 45.6 45.5 45.4 45.2 44.7 44.6 44.4 ... Femme (%) Taux brut de natalité - Total (par Crude birth rate - Total (per 1000) 30.2 30.2 30.1 30.1 30.0 30.0 25.3 29.8 ... 1000) Taux brut de mortalité - Total (par Crude death rate - Total (per 1000) 17.2 18.5 18.4 18.0 17.4 16.7 18.9 15.3 ... 1000) Life expectancy at birth - Total Espérance de vie à la naissance - 41.5 39.0 41.3 41.7 42.4 43.4 43.3 45.7 ... (years) Total (années) Net reproduction rate - (per Taux net de reproduction - (par ... ... ... 1.1 ... ... ... ... ... woman) femme) Indice synthétique de fécondité - Total fertility rate - (per woman) 3.7 4.8 3.7 3.8 3.6 3.5 3.3 3.7 ... (par femme) Education Enseignement Teaching staff at first level - Total Personnel enseignant - 1er degré - 64.31 64.8 65.5 65.6 65.1 ... ... ... ... (thousands) Total (milliers) Teaching staff at second level - Personnel enseignant - 2ème degré - 32.91 33.0 34.8 35.3 35.0 ... ... ... ... 340 Total (thousands) Total (milliers) Teaching staff at third level - Total Personnel enseignant - 3ème degré - ... ... ... ... ... ... ... ... ... (thousands) Total (milliers) First level student enrollment - Total Elèves inscrits - 1er degré - Total 2 480 2 463 2 465 2 462 2 446 ... ... ... ... (thousands) (milliers) First level student enrollment - Elèves inscrits - 1er degré - Femmes 1 173 1 180 1 186 1 199 1 193 ... ... ... ... Female (thousands) (milliers) Second level student enrollment - Elèves inscrits - 2ème degré - Total 819 810 802 802 775 ... ... ... ... Total (thousands) (milliers) Second level student enrollment - Elèves inscrits - 2ème degré - 389 360 ... ... 400 ... ... ... ... Female (thousands) Femmes (milliers) Third level student enrollment - Elèves inscrits - 3ème degré - Total 60.2 55.7 ... ... ... ... ... ... ... Total (thousands) (milliers) Third level student enrollment - Elèves inscrits - 3ème degré - 24.6 21.6 ... ... ... ... ... ... ... Female (thousands) Femmes (milliers) Public expenditure on education (% Dépenses publiques consacrées à 18.0 19.0 21.0 12.0 19.0 ... ... ... ... of budget) l'enseignement (% du budget) Health Santé Hospital beds - Total (per 10 000 Nombre de lits d'hôpitaux - Total ... ... ... ... ... ... ... ... ... population) (pour 10 000) Nurses - Total (per 10 000 Nombre d'infirmières - Total (pour 8 ... 7 ... ... ... ... ... ... population) 10 000) Physicians - Total (per 10 000 Nombre de médecins - Total (pour 2 ... 2 ... ... ... ... ... ... population) 10 000) Public expenditure on Health (% of Dépenses publiques consacrées à la 9 9 11 5 9 ... ... ... ... budget) santé (% du budget) African Statistical Yearbook 2011 / Annuaire Statistique pour l'Afrique 2011
  • 342.
    Zimbabwe Zimbabwe II NATIONAL ACCOUNTS — COMPTES NATIONAUX 2002 2003 2004 2005 2006 2007 2008 2009 2010 Gross domestic product by kind of economic activity at current prices Produit intérieur brut par branche d'activité économique aux prix courants Zimbabwe Dollar(Billions) Dollar Zimbabween(Milliards) Agriculture 1 1 4 23 156 3 335 351 722 873 909 ... Agriculture Mining and quarrying 0 0 5 35 239 3 547 99 667 704 288 ... Industries extractives Manufacturing 1 2 8 47 283 1 249 103 044 119 856 ... Industries manufacturières Electricity, gas & water 0 0 2 7 27 1 777 113 993 074 286 ... Electricité, gaz et eau Construction 0 0 1 1 15 485 13 622 993 34 ... Bâtiments et travaux publics Wholesale & retail trade, Commerce de gros et de détail, 1 2 13 47 169 1 711 384 243 165 639 ... restaurants, hotels restaurants et hôtels Banques, assurances, affaires Finance, insurance, real estate, etc. 0 2 4 13 42 308 2 405 787 344 ... immobilières Transport and communications 1 2 6 8 21 761 154 988 919 886 ... Transport(s) et communications Administrations publiques et Public administration and defense 0 0 1 2 7 260 22 172 296 231 ... défense Other services 0 1 4 12 37 2 220 207 053 386 600 ... Autres services Moins Services d’intermédiation Less Imputed Service Charges 0 0 0 - 1 - 1 - 9 - 991 961 - 22 ... financière Gross domestic product at factor Produit intérieur brut aux couts des 3 10 46 195 996 15 645 1451 922 357 5 050 ... cost / basic prices facteurs / prix de base Plus: Indirect Taxes / taxes on Plus taxes indirectes/impôts sur les 0 1 3 10 34 123 441 787 ... products, less subsidies produits, moins les subventions Expenditure on Gross domestic product at current purchaser's values Emploi du produit intérieur brut aux prix courants d'acquisition Zimbabwe Dollar(Billions) Dollar Zimbabween(Milliards) Consommation finale des Government final consumption 0 1 5 9 18 733 8 256 310 833 ... administrations publiques Private final consumption 3 9 43 191 999 14 144 1410 943 484 5 903 ... Consommation finale privée Gross fixed capital formation 0 1 4 14 98 455 12 778 596 684 ... Formation brute de capital fixe Increase in inventories 0 0 0 0 - 17 710 19 944 688 - 575 ... Variation des stocks Exports of goods and services 0 0 9 48 364 182 193 1 651 ... Exportations de biens et services Less imports of goods and services 0 0 13 58 432 456 472 3 333 ... Moins importations de biens et 341 services GDP at purchasers' values 4 11 49 205 1 030 15 768 1451 922 798 5 837 ... PIB aux prix d'acquisition Gross domestic product by kind of economic activity at constant Produit intérieur brut par branche d'activité economique aux prix constants prices Annual Growth Rates (%) Taux de croissance annuel (%) Agriculture ... -14.5 -9.1 -5.4 -4.0 -7.0 -35.8 ... ... Agriculture Mining and quarrying ... -30.9 22.9 1.3 -6.0 -3.0 -29.5 ... ... Industries extractives Manufacturing ... -13.4 -10.2 3.8 -2.8 -5.0 -12.3 ... ... Industries manufacturières Electricity, gas & water ... 1.5 8.2 -7.1 -4.2 -0.8 -8.7 ... ... Electricité, gaz et eau Construction ... -10.4 -1.8 -2.4 -4.5 -3.0 -3.3 ... ... Bâtiments et travaux publics Wholesale & retail trade, Commerce de gros et de ... -30.8 -20.0 -20.0 -2.0 2.5 8.7 ... ... restaurants, hotels détail,restaurants et hôtels Banques, assurances, affaires Finance, insurance, real estate, etc. ... 2.8 -2.4 -20.2 -6.9 -3.6 -27.1 ... ... immobilières Transport and communications ... -8.2 -1.3 1.0 -1.0 -2.0 11.4 ... ... Transport(s) et communications Administrations publiques et Public administartion and defense ... 1.9 5.9 5.9 -2.0 -4.0 0.0 ... ... défense Other services ... -1.8 -1.9 -1.6 -3.2 -4.0 -1.6 ... ... Autres services Moins Services d’intérmediation Less Imputed Service Charges ... -52.0 -34.7 -34.2 -4.4 -2.0 -23.7 ... ... financière Gross domestic product at factor Produit intérieur brut aux couts des -8.2 -4.2 -5.2 -3.6 -3.7 -11.3 ... ... cost / basic prices facteurs / prix de base Plus: Indirect Taxes / taxes on Plus taxes indirectes/impôts sur les ... 0.2 1.0 5.9 -3.8 0.0 0.0 ... ... products, less subsidies produits, moins les subventions Gross domestic product at market Produit intérieur brut aux prix du ... -7.4 -3.6 -4.0 -3.6 -3.3 -9.9 ... ... prices marché 2009 is in US$ 2009: Evaluée en dollars Américain African Statistical Yearbook 2011 / Annuaire Statistique pour l'Afrique 2011
  • 343.
    Zimbabwe Zimbabwe Expenditure on Gross domestic product at constant purchasers' Emplois du produit intérieur brut aux prix constants d'acquisition values Annual Growth Rates (%) Taux de croissance annuel (%) Consommation finale des Government final consumption ... -13.6 -3.3 2.2 2.2 2.2 -1.7 15.1 ... administrations publiques Private final consumption ... 17.4 -3.0 -15.2 -4.7 -4.9 -9.6 19.8 ... Consommation finale privée Gross fixed capital formation ... 19.5 -9.6 -54.1 -29.4 -6.1 -3.4 119.0 ... Formation brute de capital fixe Exports of goods and services ... -344.9 42.7 -3.3 1.3 -7.1 -2.6 -9.2 ... Exportations de biens et services Moins importations de biens et Less imports of goods and services ... ... ... ... ... ... ... ... ... services III INFLATION 2002 2003 2004 2005 2006 2007 2008 2009 2010 Annual Growth Rates (%) Taux de croissance annuel (%) All Item 233.2 1084.4 4879.7 16486.4 184101.1 12562581.0 ... 6.5 3.1 Ensemble Food 235.1 1143.5 5369.0 ... 197259.1 14745627.0 ... ... ... Alimentation Health 214.1 774.7 4224.0 18150.7 595497.0 33011038.0 ... ... ... Santé Energy ... ... ... ... ... ... ... ... ... Energie Transport 184.0 818.0 5127.1 ... 225313.0 24890041.0 ... ... ... Transport IV AGRICULTURAL PRODUCTION - PRODUCTION AGRICOLE 2002 2003 2004 2005 2006 2007 2008 2009 2010 Tons (Thousand) Tonnes (milliers) Maize, Tons (thousands) 605 1 059 1 686 915 1 485 1 162 ... ... 1 192 Maïs, tonnes (milliers) Cotton lint, Tons (thousands) 194 159 364 196 208 224 ... ... 115 Fibres de coton, tonnes (milliers) Tobacco, Tons (thousands) 114 94 78 83 45 79 ... ... ... Tabac, tonnes (milliers) Soya beans, Tons (thousands) 84 41 86 57 70 112 ... ... ... Graines de soja, tonnes (milliers) , Groundnuts in shells, Tons Arachides en coques, tonnes q , 56 87 64 58 83 125 ... ... ... (thousands) (milliers) V MINING PRODUCTION - PRODUCTION MINIERE 342 2002 2003 2004 2005 2006 2007 2008 2009 2010 Hard coal, metric tons (thousands) 3 938.0 3 029.0 3 797.7 2 890.7 2 107.1 2 107.0 ... ... ... Houilles, tonnes métriques (milliers) Asbetos, metric tons (thousands) 168.0 143.0 90.0 ... ... ... ... ... ... Asbestos, tonnes métriques (milliers) Minerais de fer, tonnes métriques Iron ores, mereic tons (thousands) 272.0 411.0 228.7 224.2 104.5 104.0 ... ... ... (milliers) VI ENERGY - ENERGIE 2002 2003 2004 2005 2006 2007 2008 2009 2010 Electricity - total hydro production, Électricité - production hydraulique 4 576.8 3 387.5 3 907.0 3 701.7 4 224.0 3 967.0 ... ... ... kilowatt hours (millions) totale, kilowatt-heures (millions) Electricity - total thermal production, Électricité - production thermique 3 821.2 5 358.3 5 520.4 5 454.1 5 552.0 5 213.0 ... ... ... kilowatt hours (millions) totale, kilowatt-heures (millions) Electricity - total production, self- Electricité - Production totale privée 189 53 292 216 0 0 ... ... ... producer (Million Kilowatt Hours) (million de kilowatt heures) Electricity - total production, public Electricité - Production totale 8 398 8 746 9 427 9 156 9 776 9 180 ... ... ... (Million Kilowatt Hours) publique (million de kilowatt heures) African Statistical Yearbook 2011 / Annuaire Statistique pour l'Afrique 2011
  • 344.
    Zimbabwe Zimbabwe VII TOURISM AND INFRASTRUCTURE - TOURISME ET INFRASTUCTURE 2002 2003 2004 2005 2006 2007 2008 2009 2010 Arrivals - Tourists (thousands) 346 1118 1124 1031 1865 677 345 558 ... Arrivées - touristes (milliers) Rooms in hotels and similar Chambres d'hotels et établissements establishments (thousands) 6 6 6 6 ... ... ... ... 8 assimilés (milliers) Paved Road (% of total) 19 ... ... ... ... ... ... ... ... Routes asphaltées (% du total) Total Network (Railways-km) ... ... ... ... ... ... ... ... ... Réseau total voies ferrées-Km Main Telephone Lines (per 1,000 Lignes téléphoniques fixes (pour 26 28 33 49 64 92 ... ... ... inhabitants) 1000 habitants) Mobile Cellular Subscribers (per Abonnés aux téléphones mobiles 22 23 24 25 25 26 ... ... ... 1,000 inhabitants) (pour 1000 habitants) VII FINANCIAL AND MONETARY STATISTICS - FINANCES ET STATISTIQUES MONETAIRES 2002 2003 2004 2005 2006 2007 2008 2009 2010 VII-1 Monetary Statistics VII-1 Statistiques monétaires Zimbabwe Dollar(Billions) Dollar Zimbabween(Milliards) Money supply (M1) 357 2 087 6 857 44 746 636 799 425 445 000 ... ... ... Masse monétaire (M1) Quasi-money 172 717 2 377 13 678 270 556 123 289 000 ... ... ... Quasi-monnaie of which Demand Deposit ... ... ... ... ... ... ... ... ... dont Monnaie scripturale Net foreign assets - 13 - 179 - 1 624 - 9 860 - 35 620 2 210 590 ... ... ... Avoirs extérieurs nets Domestic credit 504 3 050 11 142 65 793 621 042 747 345 000 ... ... ... Crédit intérieur of which claims on private sector 296 2 124 5 017 19 237 383 832 613 593 000 ... ... ... dont créances sur le secteur privé of which Claims on government dont créances nettes sur le 143 622 5 502 44 634 204 702 105 078 000 ... ... ... sector, net gouvernement International reserves (millions of US Réserves internationales (millions de 83 ... ... ... ... ... ... ... ... $) $ EU) Average Exchange Rate (National Taux de change (moyen) (monnaie 0.06 0.70 5.07 22.36 164.36 9 675.78 ... ... ... Currency per us $) nationale par dollars) VII-2 Public Finance VII-2 Finances publiques Zimbabwe Dollar(Billions) Dollar Zimbabween(Milliards) Total Revenues and Grants 1 113 384 1 551 086 2 110 591 941 572 520 435 201 596 133 000 972 975 2 014 754 Recettes totales et dons Tax Revenue 1 039 231 1 489 195 2 024 105 908 504 503 652 192 788 128 000 880 688 1 873 983 Recettes fiscales Non Tax Revenue 71 596 55 039 80 489 33 069 16 783 8 808 5 000 51 000 140 771 Recettes non fiscales Grants 2 557 6 852 5 997 0 0 0 0 41 288 0 Dons 343 Total Expenditures and Net Lending 1 283 241 1 566 586 2 547 581 1 437 504 695 852 384 203 225 123 980 487 1 815 554 Dépenses totales et prêts nets Current expenditure 789 012 1 038 325 1 307 921 755 398 279 226 118 594 51 729 603 911 1 036 800 Dépenses courantes Of which Wages and Salaries 452 586 593 072 953 661 564 726 211 112 89 314 43 970 409 261 794 000 Dont rémunérations et salaires Capital expenditure 92 051 120 973 318 148 115 130 121 109 69 564 14 291 45 204 252 671 Dépenses d'équipement Net Lending 19 725 60 318 36 451 19 499 2 351 9 253 3 000 1 098 3 166 Prêts nets Fiscal Balance - 169 857 - 15 501 - 436 990 - 495 932 - 175 417 - 182 607 - 92 123 - 7 511 199 200 Solde global y compris les dons VII-3 Balance of Payments VII-3 Balance des paiements US $(Millions) $ E.U(Millions) Trade balance - 34 - 123 - 325 - 411 - 475 - 294 - 972 - 1 622 - 1 654 Balance commerciale Services Balance - 204 - 216 - 108 - 175 - 121 - 143 - 207 - 32 - 59 Balance des services Net Income - 246 - 191 - 208 - 197 - 209 - 245 - 224 - 200 - 192 Revenus nets Current transfers, net total 228 169 204 163 439 440 625 926 636 Transferts courants Current account balance - 256 - 361 - 437 - 620 - 365 - 243 - 779 - 928 - 1 268 Solde du compte courant VII-4 External Debt and Financial Flows VII-4 Dette extérieure et flux financiers US $(Millions) $ E.U(Millions) Total external debt 4 232 4 511 4 566 4 388 4 898 5 283 5 793 6 853 7 453 Dette extérieure totale Private 1 780 2 220 2 467 2 661 3 279 3 773 4 445 5 683 6 487 Privée Public 2 451 2 291 2 099 1 727 1 619 1 510 1 349 1 171 966 Publique Total external debt service 495 424 353 348 352 343 414 319 335 Service de la dette extérieure Net Foreign Direct Investment Investissements étranger direct 26 4 9 103 40 69 52 60 ... Inflows (flux nets entrants) Net Total Official Development Aide publique au développement 199 187 187 373 278 479 612 737 ... assistance (nette totale) African Statistical Yearbook 2011 / Annuaire Statistique pour l'Afrique 2011
  • 345.
    Zimbabwe Zimbabwe 2002 2003 2004 2005 2006 2007 2008 2009 2010 US $(Millions) Dollar Zimbabween Exports, fob Exportations, fàb Exports - Total 2 108 1 794 1 662 1 671 1 588 1 721 ... ... ... Exportations - Total Main Products Principaux produits Ferro-chromium containing by Ferro-chrome contenant en poids 103 116 166 201 188 203 47 31 195 weight more than 4% of carbon plus de 4% de carbone Tobacco, unmanufactured, stemmed 550 485 363 256 212 266 100 242 420 Tabac, artisanal, filtre, ou emballe or stripped Nickel mattes ... 0 ... ... 169 211 149 252 441 Mattes de nickel Minerais de nickel et leurs Nickel ores and concentrates 54 132 181 221 172 224 234 ... ... concentrés Nickel unwrought, not alloyed 77 137 158 227 339 537 33 15 14 Nickel brut, sans alliage Main Destinations Principales destinations South Africa 202.3 347.8 430.1 488.3 686.2 854.2 759.3 188.0 ... Afrique du Sud China 159.6 167.1 141.2 157.9 139.1 142.8 148.2 140.8 ... Chine Japan 125.4 140.9 124.0 134.4 131.1 225.6 118.2 45.1 ... Japon Zambia 97.1 202.7 124.5 110.1 175.7 111.7 107.1 56.9 ... Zambie Germany 142.2 146.4 119.5 109.2 143.2 139.0 92.3 44.2 ... Allemagne 2002 2003 2004 2005 2006 2007 2008 2009 2010 Imports, cif Importations, cif 344 Imports - Total ... ... ... ... ... ... ... ... ... Importations - Total (millions) Principaux produits Main Products Maize, nes 49 64 38 135 74 127 337 54 ... Maïs, nda Petroleum oils&oils obtained from Huiles de pétrole, bitumineux, bituminous minerals,o/than crude 37 100 203 165 189 186 306 196 ... distilles, sauf brut etc Nickel mattes 0 0 ... ... 0 270 164 95 ... Mattes de nickel Diesel powered trucks with a GVW Diesel chariots de manutention d'un 26 25 17 25 40 56 71 51 ... not exceeding five tonnes PTAC n'excédant pas cinq tonnes Electrical energy 39 24 19 39 66 68 53 53 ... Énergie électrique Main Origin Principales provenances South Africa 692.4 858.6 929.1 1 161.5 1 065.2 1 194.8 1 689.0 1 608.0 ... Afrique du Sud Botswana 73.6 94.7 130.1 184.1 253.5 370.3 219.4 154.3 ... Botswana China 32.2 30.3 113.1 125.4 136.3 203.3 133.1 156.3 ... Chine Swaziland 0.3 117.9 0.1 0.6 369.0 0.0 0.0 0.0 ... Swaziland United States 49.3 41.7 47.3 44.7 47.6 105.2 92.9 85.5 ... États-Unis African Statistical Yearbook 2011 / Annuaire Statistique pour l'Afrique 2011
  • 346.
    Better Statistics forBetter Development Outcomes De meilleures statistiques pour un développement plus performant ELOPME ELOPME D EV NT INE DE DÉVE D EV NT N I CA LO N F FR CA F UN UN PP I A R AF E E D D BANQU ME NT NT NT FO ME ME ND PE PE P AF LO OP S R IC R ICA EL AIN DE DÉVE IN DE DÉV African Development Bank Group African Union Economic Commission for Africa Groupe de la Banque africaine de développement Union Africaine Comission Economique pour l’Afrique Temporary Relocation Agency (TRA) P.O. Box 3243 P.O. Box 3001 Agence Temporaire de Relocalisation (ATR) Roosvelt Street Addis Ababa 13 Avenue du Ghana (Old Airport Area) Ethiopia BP 323, 1002 Tunis Belvédère W21K19 Addis Ababa Tel: +251 11 551 7200 Tunis, Tunisia / Tunisie Ethiopia Fax: +251 11 551 0365 Tel : (216) 71 103 325 Tel: (251) 11 551 77 00 Email: ecainfo@uneca.org Fax : (216) 71 103 743 Fax:(251) 11 551 78 44 www.uneca.org Email : Statistics@afdb.org www.au.int www.afdb.org