Télécharger en tant que PDF, PPTX
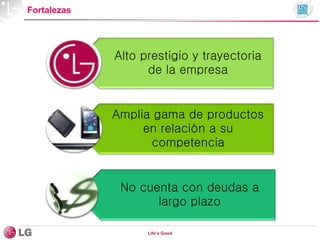

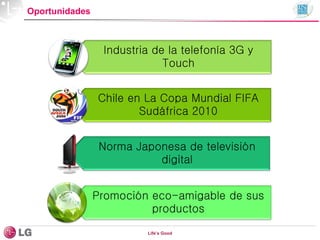

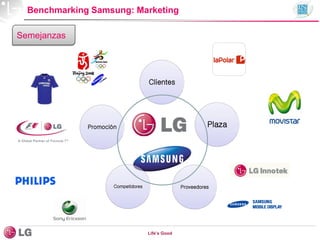


Le document analyse la performance de l'entreprise 'Life's Good', mettant en avant ses forces telles qu'une large gamme de produits et l'absence de dettes à long terme, tout en soulignant des faiblesses comme une promotion limitée au marché chilien. Il examine également les opportunités et les menaces du marché, incluant une forte dépendance aux fournisseurs étrangers et une concurrence accrue. Des comparaisons de benchmarking avec d'autres entreprises comme Samsung et Sony sont présentées pour illustrer les aspects marketing et de vente.


