
Recommandé
Contenu connexe
Plus de vanessawhitehawk
Plus de vanessawhitehawk (20)
Chapter 02
- 10. Table 2-2, p.39
- 11. Table 2-3, p.40
- 12. Table 2-4, p.42
- 13. Fig. 2-11b, p.43
- 14. Fig. 2-12, p.44
- 15. Fig. 2-13, p.44
- 16. Fig. 2-14, p.45
- 17. Fig. 2-14a, p.45
- 18. Fig. 2-14b, p.45
- 19. Fig. 2-15, p.46
- 20. Fig. 2-17, p.46
- 21. Fig. 2-18, p.47
Notes de l'éditeur
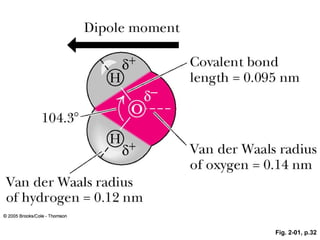
- ACTIVE FIGURE 2.1 The structure of water. Two lobes of negative charge formed by the lone-pair electrons of the oxygen atom lie above and below the plane of the diagram. This electron density contributes substantially to the large dipole moment and polarizability of the water molecule. The dipole moment of water corresponds to the OXH bonds having 33% ionic character. Note that the HXOXH angle is 104.3°, not 109°, the angular value found in molecules with tetrahedral symmetry, such as CH4. Many of the important properties of water derive from this angular value, such as the decreased density of its crystalline state, ice. (The dipole moment in this figure points in the direction from negative to positive, the convention used by physicists and physical chemists; organic chemists draw it pointing in the opposite direction.) Test yourself on the concepts in this figure at http://chemistry.brookscole.com/ggb3
- ANIMATED FIGURE 2.2 The structure of normal ice. The hydrogen bonds in ice form a three-dimensional network. The smallest number of H2O molecules in any closed circuit of H-bonded molecules is six, so this structure bears the name hexagonal ice. Covalent bonds are represented as solid lines, whereas hydrogen bonds are shown as dashed lines. The directional preference of H bonds leads to a rather open lattice structure for crystalline water and, consequently, a low density for the solid state. The distance between neighboring oxygen atoms linked by a hydrogen bond is 0.274 nm. Since the covalent HXO bond is 0.095 nm, the H-O hydrogen bond length in ice is 0.18 nm. See this figure animated at http://chemistry.brookscole.com/ggb3
- ANIMATED FIGURE 2.4 Hydration shells surrounding ions in solution. Water molecules orient so that the electrical charge on the ion is sequestered by the water dipole. For positive ions (cations), the partially negative oxygen atom of H2O is toward the ion in solution. Negatively charged ions (anions) attract the partially positive hydrogen atoms of water in creating their hydration shells. See this figure animated at http://chemistry.brookscole. com/ggb3
- ANIMATED FIGURE 2.5 Formation of a clathrate structure by water molecules surrounding a hydrophobic solute. See this figure animated at http://chemistry.brookscole. com/ggb3
- FIGURE 2.6 An amphiphilic molecule: sodium palmitate. Amphiphilic molecules are frequently symbolized by a ball and zigzag line structure, where the ball represents the hydrophilic polar head and the zigzag represents the nonpolar hydrophobic hydrocarbon tail.
- ACTIVE FIGURE 2.7 Micelle formation by amphiphilic molecules in aqueous solution. Negatively charged carboxylate head groups orient to the micelle surface and interact with the polar H2O molecules via H bonding. The nonpolar hydrocarbon tails cluster in the interior of the spherical micelle, driven by hydrophobic exclusion from the solvent and the formation of favorable van der Waals interactions. Because of their negatively charged surfaces, neighboring micelles repel one another and thereby maintain a relative stability in solution. Test yourself on the concepts in this figure at http://chemistry.brookscole.com/ggb3
- ACTIVE FIGURE 2.9 The ionization of water. Test yourself on the concepts in this figure at http://chemistry.brookscole. com/ggb3
- ANIMATED FIGURE 2.10 The hydration of H3O+. Solid lines denote covalent bonds; dashed lines represent the H bonds formed between the hydronium ion and its waters of hydration. See this figure animated at http://chemistry. brookscole.com/ggb3
- ANIMATED FIGURE 2.11 The titration curve for acetic acid. Note that the titration curve is relatively flat at pH values near the pKa. In other words, the pH changes relatively little OH_ is added in this region of the titration curve. See this figure animated at http://chemistry. brookscole.com/ggb3
- ANIMATED FIGURE 2.12 The titration curves of several weak electrolytes: acetic acid, imidazole, and ammonium. Note that the shape of these different curves is identical. Only their position along the pH scale is displaced, in accordance with their respective affinities for H_ ions, as reflected in their differing pKa values. See this figure animated at http:// chemistry.brookscole.com/ggb3
- ANIMATED FIGURE 2.13 The titration curve for phosphoric acid. The chemical formulas show the prevailing ionic species present at various pH values. Phosphoric acid (H3PO4) has three titratable hydrogens, and therefore three midpoints are seen: at pH 2.15 (pK1), pH 7.20 (pK2), and pH 12.4 (pK3). See this figure animated at http://chemistry.brookscole.com/ggb3
- ACTIVE FIGURE 2.14 A buffer system consists of a weak acid, HA, and its conjugate base, A_. The pH varies only slightly in the region of the titration curve where [HA] _ [A_]. The unshaded box denotes this area of greatest buffering capacity. Buffer action: When HA and A_ are both available in sufficient concentration, the solution can absorb input of either H_ or OH_, and pH is maintained essentially constant. Test yourself on the concepts in this figure at http://chemistry. brookscole.com/ggb3
- ACTIVE FIGURE 2.14 A buffer system consists of a weak acid, HA, and its conjugate base, A_. The pH varies only slightly in the region of the titration curve where [HA] _ [A_]. The unshaded box denotes this area of greatest buffering capacity. Buffer action: When HA and A_ are both available in sufficient concentration, the solution can absorb input of either H_ or OH_, and pH is maintained essentially constant. Test yourself on the concepts in this figure at http://chemistry. brookscole.com/ggb3
- ACTIVE FIGURE 2.14 A buffer system consists of a weak acid, HA, and its conjugate base, A_. The pH varies only slightly in the region of the titration curve where [HA] _ [A_]. The unshaded box denotes this area of greatest buffering capacity. Buffer action: When HA and A_ are both available in sufficient concentration, the solution can absorb input of either H_ or OH_, and pH is maintained essentially constant. Test yourself on the concepts in this figure at http://chemistry. brookscole.com/ggb3
- FIGURE 2.15 pH versus enzymatic activity. The activity of enzymes is very sensitive to pH. The pH optimum of an enzyme is one of its most important characteristics. Pepsin is a protein-digesting enzyme active in the gastric fluid. Trypsin is also a proteolytic enzyme, but it acts in the more alkaline milieu of the small intestine. Lysozyme digests the cell walls of bacteria; it is found in tears.
- FIGURE 2.17 The pKa values and pH range of some “Good” buffers.
- FIGURE 2.18 The structure of HEPES, 4-(2- hydroxy)-1-piperazine ethane sulfonic acid, in its fully protonated form. The pKa of the sulfonic acid group is about 3; the pKa of the piperazine- N+H is 7.55 at 20°C.