IA on effect of different transition metal (homogenous catalyst) on the decomposition of H2O2 measured using a pressure sensor.
•
0 j'aime•246 vues

IA on effect of different transition metal (homogenous catalyst) on the decomposition of H2O2 measured using a pressure sensor.

Recommandé
Contenu connexe
Tendances
Tendances (20)
Similaire à IA on effect of different transition metal (homogenous catalyst) on the decomposition of H2O2 measured using a pressure sensor.
Similaire à IA on effect of different transition metal (homogenous catalyst) on the decomposition of H2O2 measured using a pressure sensor. (20)
Plus de Lawrence kok
Plus de Lawrence kok (20)
Dernier
Dernier (20)
IA on effect of different transition metal (homogenous catalyst) on the decomposition of H2O2 measured using a pressure sensor.
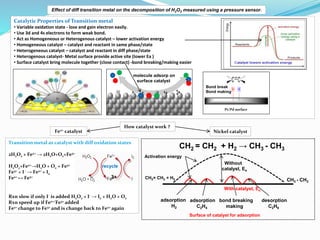
- 1. Pt/Pd surface Catalytic Properties of Transition metal • Variable oxidation state - lose and gain electron easily. • Use 3d and 4s electrons to form weak bond. • Act as Homogeneous or Heterogenous catalyst – lower activation energy • Homogeneous catalyst – catalyst and reactant in same phase/state • Heterogeneous catalyst – catalyst and reactant in diff phase/state • Heterogenous catalyst- Metal surface provide active site (lower Ea ) • Surface catalyst bring molecule together (close contact) -bond breaking/making easier Transition metal as catalyst with diff oxidation states 2H2O2 + Fe2+ → 2H2O+O2+Fe3+ H2O2+Fe2+→H2O + O2 + Fe3+ Fe3+ + I - → Fe2+ + I2 Fe2+ ↔ Fe3+ Rxn slow if only I- is added H2O2 + I- → I2 + H2O + O2 Rxn speed up if Fe2+/Fe3+ added Fe2+ change to Fe3+ and is change back to Fe2+ again recycle molecule adsorp on surface catalyst Pt/Pd surface Bond break Bond making 3+ CH2 = CH2 + H2 → CH3 - CH3 Nickel catalyst Without catalyst, Ea CH2= CH2 + H2 CH3 - CH3 Surface of catalyst for adsorption With catalyst, Ea adsorption H2 adsorption C2H4 bond breaking making desorption C2H6 Fe2+ catalyst How catalyst work ? Activation energy Effect of diff transition metal on the decomposition of H2O2 measured using a pressure sensor.
- 2. Across period Cr - 4s13d5 • half filled more stable Cu - 4s13d10 • fully filled more stable Ca 4s2 K 4s1 Transition metal have partially fill 3d orbital • 3d and 4s electron can be lost easily • electron fill from 4s first then 3d • electron lost from 4s first then 3d • 3d and 4s energy level close together (similar in energy) Filling electron- 4s level lower, fill first Losing electron- 4s higher, lose first 3d 4s Effect of diff transition metal on the decomposition of H2O2 measured using a pressure sensor.
- 3. Pressure change due to O2 gas Effect of diff transition metal on the decomposition of H2O2 measured using a pressure sensor. Different transition metal were used V5+, Cr3+, Co2+, Ni2+, Mn2+, Pb2+, Cu2+, Fe2+, Fe3+ Same amount were used – 0.00005mol 5% H2O2 used. Pressure sensor to measure O2 released. Reaction mechanism Procedure: 0.00005mol of each catalyst was added to H2O2 Ex: 1g of FeSO4 added to 100ml water – conc is – 0.0359M To transfer 0.00005mol to H2O2, the vol needed will be 1.4ml 1.4ml FeSO4 was added to 1ml 5% H2O2 in a boiling tube Pressure sensor attached. Rxn monitor by increase in pressure 1. Comparing homogenous solution (diff transition metal) against solid MnO2 2. Which transition metal works best (same amt of catalyst added, 0.0005mol) 3. Measure Ea value for diff transition metal and compared to MnO2 which is 50kJmol-1 4. Will Ea higher/lower for heterogenous catalyst (MnO2) compared to homogenous catalyst like CuSO4, FeSO4, FeCI3 Research Questions Hydrogen peroxide decomposition – O2 production 2H2O2→ 2H2O + O2
- 4. Only 4 transition metal works compared to MnO2 Slope/gradient taken over 50s Transition metal Rate kPas-1 V5+ No rxn Cr3+ No rxn Co2+ No rxn Ni2+ No rxn Mn2+ No rxn Pb2+ No rxn Cu2+ 0.009316 Fe2+ 0.03559 Fe3+ 0.1086 MnO2 0.4422 Diff homogenous solution compared to solid MnO2 catalyst. Rate measured as pressure change over time. Effect of diff transition metal on the decomposition of H2O2 measured using a pressure sensor. 0 0.05 0.1 0.15 0.2 0.25 0.3 0.35 0.4 0.45 0.5 Cu2+ Fe2+ Fe3+ MnO2 Rate of reaction Rate of reaction vs diff transition metal Homogenous catalyst vs MnO2. Fe3+ works best as and will be chosen for Ea study
- 5. Method 1 Method 2 Time Time Volume Pressure • Rate = Δ vol O2 over time • Volume recorded • Rate = Δ pressure O2 over time • Pressure recorded Procedure 2H2O2 → O2 + 2H2O Rxn: H2O2 with diff (catalyst) measured using TWO diff methods • 2H2O2 → O2 + 2H2O (H2O2 limiting, KI excess) • Pipette 1ml 1.0M KI to 20ml of 1.5% H2O2 • Vol O2 released recorded at 1 min interval • Repeated using 3% H2O2 conc Time/m Vol O2 (H2O2 1.5%) Vol O2 (H2O2 3.0%) 0 0.0 0.0 1 8.5 14.0 2 15.0 26.5 3 21.0 34.0 4 26.0 39.0 Volume O2 Time 3 % 1.5 % Effect of diff transition metal on the decomposition of H2O2 measured using a pressure sensor.
- 6. • 2H2O2 → O2 + 2H2O (H2O2 limiting, KI excess) • Pipette 1ml 1.0M KI to 20ml of 1.5% H2O2 • Pressure O2 released recorded at 1 min interval • Repeat using 3% H2O2 conc Techniques Used to measure Rate of Rxn Method 1 Method 2 Time Time Volume Pressure • Rate = Δ vol O2 over time • Volume recorded • Rate = Δ pressure O2 over time • Pressure recorded Procedure 2H2O2 → O2 + 2H2O Time 3 % 1.5 % Time/m Pressure O2 (H2O2 1.5%) Pressure O2 (H2O2 3%) 0 101.3 101.3 1 102.4 103.4 2 103.5 105.6 3 110.3 115.2 4 113.5 118.2 Pressure O2 Rxn: H2O2 with diff (catalyst) measured using TWO diff methods