This presentation consists of three topics that are:
1. conductance of electrolytic solution
2. Specific Conductance, Molar Conductance & Equivalent Conductance
3. Kohlrausch's Law
This presentation consists of three topics that are:
1. conductance of electrolytic solution
2. Specific Conductance, Molar Conductance & Equivalent Conductance
3. Kohlrausch's Law
Valence shell electron pair repulsion (VSEPR) theory is a model used in chemistry to predict the geometry of individual molecules from the number of electron pairs surrounding their central atoms. It is also named the Gillespie-Nyholm theory after its two main developers, Ronald Gillespie and Ronald Nyholm
CONDUCTIVITY-TYPES-VARIATION WITH DILUTION-KOHLRAUSCH LAW - TRANSFERENCE NUMBER -DETERMINATION - IONIC MOBILITY - APPLICATION OF CONDUCTANCE MEASUREMENTS - CONDUCTOMENTRIC TITRATION
Certainly! The **basic principle of coulometry** involves passing a known electrical charge through a solution containing the analyte. Coulometry can be used to determine the amount of a substance in a solution, the purity of a compound, or the kinetics of an electrochemical reaction¹[3] ²[4]. It is a valuable technique in analytical electrochemistry for precision measurements of charge and is named after Charles-Augustin de Coulomb³[2]. One useful application of coulometry is determining the number of electrons involved in a redox reaction, which can be achieved through controlled-potential coulometric analysis using a known amount of a pure compound.
Ch 03 MATLAB Applications in Chemical Engineering_陳奇中教授教學投影片Chyi-Tsong Chen
The slides of Chapter 3 of the book entitled "MATLAB Applications in Chemical Engineering": Interpolation, Differentiation, and Integration. Author: Prof. Chyi-Tsong Chen (陳奇中教授); Center for General Education, National Quemoy University; Kinmen, Taiwan; E-mail: chyitsongchen@gmail.com.
Ebook purchase: https://play.google.com/store/books/details/MATLAB_Applications_in_Chemical_Engineering?id=kpxwEAAAQBAJ&hl=en_US&gl=US
IA on effect of temperature of NaOH on the rate of hydrogen production, and f...Lawrence kok
IA on effect of temperature of NaOH on the rate of hydrogen production, and finding Ea for reaction between aluminium and sodium hydroxide measured using a pressure sensor.
Valence shell electron pair repulsion (VSEPR) theory is a model used in chemistry to predict the geometry of individual molecules from the number of electron pairs surrounding their central atoms. It is also named the Gillespie-Nyholm theory after its two main developers, Ronald Gillespie and Ronald Nyholm
CONDUCTIVITY-TYPES-VARIATION WITH DILUTION-KOHLRAUSCH LAW - TRANSFERENCE NUMBER -DETERMINATION - IONIC MOBILITY - APPLICATION OF CONDUCTANCE MEASUREMENTS - CONDUCTOMENTRIC TITRATION
Certainly! The **basic principle of coulometry** involves passing a known electrical charge through a solution containing the analyte. Coulometry can be used to determine the amount of a substance in a solution, the purity of a compound, or the kinetics of an electrochemical reaction¹[3] ²[4]. It is a valuable technique in analytical electrochemistry for precision measurements of charge and is named after Charles-Augustin de Coulomb³[2]. One useful application of coulometry is determining the number of electrons involved in a redox reaction, which can be achieved through controlled-potential coulometric analysis using a known amount of a pure compound.
Ch 03 MATLAB Applications in Chemical Engineering_陳奇中教授教學投影片Chyi-Tsong Chen
The slides of Chapter 3 of the book entitled "MATLAB Applications in Chemical Engineering": Interpolation, Differentiation, and Integration. Author: Prof. Chyi-Tsong Chen (陳奇中教授); Center for General Education, National Quemoy University; Kinmen, Taiwan; E-mail: chyitsongchen@gmail.com.
Ebook purchase: https://play.google.com/store/books/details/MATLAB_Applications_in_Chemical_Engineering?id=kpxwEAAAQBAJ&hl=en_US&gl=US
Similaire à IA on effectiveness of different types of catalysts MnO2 vs Fe(NO3)3 on the rate of decomposition of H2O2 measured using a pressure sensor.
IA on effect of temperature of NaOH on the rate of hydrogen production, and f...Lawrence kok
IA on effect of temperature of NaOH on the rate of hydrogen production, and finding Ea for reaction between aluminium and sodium hydroxide measured using a pressure sensor.
IA on effect of inhibitor concentration copper on enzyme catalase (yeast extr...Lawrence kok
IA on effect of inhibitor concentration copper on enzyme catalase (yeast extract) on the rate of decomposition of H2O2 measured using a pressure sensor.
Master Thesis Total Oxidation Over Cu Based Catalystsalbotamor
The evolution in the oxidation state of Cu and Ce in a benchmark catalyst is studied
under different conditions: temperature programmed reduction with propane and hydrogen,
and isothermal reduction with propane and hydrogen.
Analytical methods used involve operando X-ray absorption spectroscopy (XAS) in
transmission mode at the Cu K edge and Ce LIII edge, as well as online mass spectrometry
(MS) at the outlet of the reactor.
Similaire à IA on effectiveness of different types of catalysts MnO2 vs Fe(NO3)3 on the rate of decomposition of H2O2 measured using a pressure sensor. (20)
2024.06.01 Introducing a competency framework for languag learning materials ...Sandy Millin
http://sandymillin.wordpress.com/iateflwebinar2024
Published classroom materials form the basis of syllabuses, drive teacher professional development, and have a potentially huge influence on learners, teachers and education systems. All teachers also create their own materials, whether a few sentences on a blackboard, a highly-structured fully-realised online course, or anything in between. Despite this, the knowledge and skills needed to create effective language learning materials are rarely part of teacher training, and are mostly learnt by trial and error.
Knowledge and skills frameworks, generally called competency frameworks, for ELT teachers, trainers and managers have existed for a few years now. However, until I created one for my MA dissertation, there wasn’t one drawing together what we need to know and do to be able to effectively produce language learning materials.
This webinar will introduce you to my framework, highlighting the key competencies I identified from my research. It will also show how anybody involved in language teaching (any language, not just English!), teacher training, managing schools or developing language learning materials can benefit from using the framework.
Honest Reviews of Tim Han LMA Course Program.pptxtimhan337
Personal development courses are widely available today, with each one promising life-changing outcomes. Tim Han’s Life Mastery Achievers (LMA) Course has drawn a lot of interest. In addition to offering my frank assessment of Success Insider’s LMA Course, this piece examines the course’s effects via a variety of Tim Han LMA course reviews and Success Insider comments.
Read| The latest issue of The Challenger is here! We are thrilled to announce that our school paper has qualified for the NATIONAL SCHOOLS PRESS CONFERENCE (NSPC) 2024. Thank you for your unwavering support and trust. Dive into the stories that made us stand out!
Unit 8 - Information and Communication Technology (Paper I).pdfThiyagu K
This slides describes the basic concepts of ICT, basics of Email, Emerging Technology and Digital Initiatives in Education. This presentations aligns with the UGC Paper I syllabus.
How to Make a Field invisible in Odoo 17Celine George
It is possible to hide or invisible some fields in odoo. Commonly using “invisible” attribute in the field definition to invisible the fields. This slide will show how to make a field invisible in odoo 17.
A Strategic Approach: GenAI in EducationPeter Windle
Artificial Intelligence (AI) technologies such as Generative AI, Image Generators and Large Language Models have had a dramatic impact on teaching, learning and assessment over the past 18 months. The most immediate threat AI posed was to Academic Integrity with Higher Education Institutes (HEIs) focusing their efforts on combating the use of GenAI in assessment. Guidelines were developed for staff and students, policies put in place too. Innovative educators have forged paths in the use of Generative AI for teaching, learning and assessments leading to pockets of transformation springing up across HEIs, often with little or no top-down guidance, support or direction.
This Gasta posits a strategic approach to integrating AI into HEIs to prepare staff, students and the curriculum for an evolving world and workplace. We will highlight the advantages of working with these technologies beyond the realm of teaching, learning and assessment by considering prompt engineering skills, industry impact, curriculum changes, and the need for staff upskilling. In contrast, not engaging strategically with Generative AI poses risks, including falling behind peers, missed opportunities and failing to ensure our graduates remain employable. The rapid evolution of AI technologies necessitates a proactive and strategic approach if we are to remain relevant.
Macroeconomics- Movie Location
This will be used as part of your Personal Professional Portfolio once graded.
Objective:
Prepare a presentation or a paper using research, basic comparative analysis, data organization and application of economic information. You will make an informed assessment of an economic climate outside of the United States to accomplish an entertainment industry objective.
Welcome to TechSoup New Member Orientation and Q&A (May 2024).pdfTechSoup
In this webinar you will learn how your organization can access TechSoup's wide variety of product discount and donation programs. From hardware to software, we'll give you a tour of the tools available to help your nonprofit with productivity, collaboration, financial management, donor tracking, security, and more.
IA on effectiveness of different types of catalysts MnO2 vs Fe(NO3)3 on the rate of decomposition of H2O2 measured using a pressure sensor.
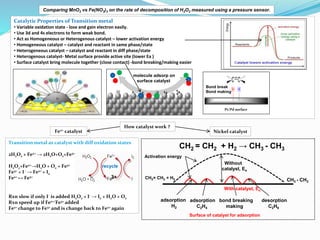
1. Pt/Pd surface
Catalytic Properties of Transition metal
• Variable oxidation state - lose and gain electron easily.
• Use 3d and 4s electrons to form weak bond.
• Act as Homogeneous or Heterogenous catalyst – lower activation energy
• Homogeneous catalyst – catalyst and reactant in same phase/state
• Heterogeneous catalyst – catalyst and reactant in diff phase/state
• Heterogenous catalyst- Metal surface provide active site (lower Ea )
• Surface catalyst bring molecule together (close contact) -bond breaking/making easier
Transition metal as catalyst with diff oxidation states
2H2O2 + Fe2+ → 2H2O+O2+Fe3+
H2O2+Fe2+→H2O + O2 + Fe3+
Fe3+ + I - → Fe2+ + I2
Fe2+ ↔ Fe3+
Rxn slow if only I- is added H2O2 + I- → I2 + H2O + O2
Rxn speed up if Fe2+/Fe3+ added
Fe2+ change to Fe3+ and is change back to Fe2+ again
recycle
molecule adsorp on
surface catalyst
Pt/Pd surface
Bond break
Bond making
3+
CH2 = CH2 + H2 → CH3 - CH3
Nickel catalyst
Without
catalyst, Ea
CH2= CH2 + H2 CH3 - CH3
Surface of catalyst for adsorption
With catalyst, Ea
adsorption
H2
adsorption
C2H4
bond breaking
making
desorption
C2H6
Fe2+ catalyst
How catalyst work ?
Activation energy
Comparing MnO2 vs Fe(NO3)3 on the rate of decomposition of H2O2 measured using a pressure sensor.
2. Across period
Cr - 4s13d5
• half filled more stable
Cu - 4s13d10
• fully filled more stable
Ca
4s2
K
4s1
Transition metal have partially fill 3d orbital
• 3d and 4s electron can be lost easily
• electron fill from 4s first then 3d
• electron lost from 4s first then 3d
• 3d and 4s energy level close together (similar in energy)
Filling electron- 4s level lower, fill first Losing electron- 4s higher, lose first
3d
4s
Comparing MnO2 vs Fe(NO3)3 on the rate of decomposition of H2O2 measured using a pressure sensor.
3. Solid vs solution catalyst will be compared. Assuming same surface area
Fe3+ solution and MnO2 solid
Same amount were used – 0.00005mol
5% H2O2 used. Pressure sensor to measure O2 released.
Diff temp used to find Ea
Reaction mechanism
Procedure:
0.00005mol of each catalyst added to H2O2
H2O2 and Fe(NO3)3 solution immersed in water bath at various temp.
Diff temp used (17, 30, 35, 38, 42C)
Mass of MnO2 is 0.00435g – (0.00005mol)
Ex: 1g of Fe(NO3)3 added to 100ml water – conc is = 0.0247M
To transfer 0.00005mol Fe3+ to H2O2, the vol needed will be 2ml
2ml Fe(NO3)3 was added to 1ml 5% H2O2 in a boiling tube
Pressure sensor attached.
1. Comparing homogenous solution (diff transition metal) against solid MnO2
2. Which transition metal works best (same amt of catalyst added, 0.0005mol)
3. Measure Ea value for diff transition metal and compared to MnO2 which is 41kJmol-1
4. Will Ea higher/lower for heterogenous catalyst (MnO2) compared to homogenous catalyst
like CuSO4, FeSO4, FeCI3
Research Questions
Hydrogen peroxide decomposition – O2 production
2H2O2→ 2H2O + O2
Fe3+ and MnO2
Comparing MnO2 vs Fe(NO3)3 on the rate of decomposition of H2O2 measured using a pressure sensor.
4. Expt done at diff temp for Fe(NO3)3
Slope/gradient taken over 15s
Rate decomposition increases exponential with temp.
Temp/
C
Temp/
K
Rate
kPa/s
1/T k ln k
17 290 0.06074 0.00344 0.06074 -2.801
30 303 0.5423 0.00330 0.5423 -0.611
35 308 1.277 0.00324 1.277 0.2445
38 311 1.505 0.00321 1.505 0.409
42 315 2.588 0.00317 2.588 0.951
Assuming rate constant, k. = Rate of decomposition.
y = 0.0051e0.1518x
R² = 0.989
0
0.5
1
1.5
2
2.5
3
3.5
0 10 20 30 40 50
Rate
decomposition
temp/C
Rate decomposition vs temp/C
Comparing MnO2 vs Fe(NO3)3 on the rate of decomposition of H2O2 measured using a pressure sensor.
Fe(NO3)3 catalyst at diff temp
5. Temp/
C
Temp/
K
Rate
kPa/s
1/T k ln k
17 290 0.06074 0.00344 0.06074 -2.801
30 303 0.5423 0.00330 0.5423 -0.611
35 308 1.277 0.00324 1.277 0.2445
38 311 1.505 0.00321 1.505 0.409
42 315 2.588 0.00317 2.588 0.951
Arrhenius Eqn
Ea from its gradient
Arrhenius Eqn - Ea by graphical Method
RT
Ea
e
A
k
.
.
T
R
E
A
k a 1
ln
ln
Plot ln k vs 1/T
ln both sides
-Ea/R
Gradient = -Ea/R
Gradient = - 13953
-13953 = -Ea/R
Ea = 13953 x 8.314
= 116 kJmol-1
ln k
1/T
Arrhenius plot to find Ea for Fe(NO3)3
y = -13953x + 45.294
R² = 0.9913
-3
-2.5
-2
-1.5
-1
-0.5
0
0.5
1
1.5
0.00315 0.0032 0.00325 0.0033 0.00335 0.0034 0.00345 0.0035
lnk
1/T
lnk vs 1/T
Assuming rate constant, k. = Rate of decomposition.
6. Expt done at diff temp for MnO2 Slope/gradient taken over 15s
MnO2 catalyst at diff temp.
Rate decomposition increases exponential with temp.
Temp/
C
Temp/
K
Rate
kPa/s
1/T k ln k
17 290 0.4098 0.00344 0.4098 -0.892
30 303 0.7466 0.00330 0.7466 -0.2922
35 308 0.8274 0.00324 0.8274 -0.1894
38 311 1.353 0.00321 1.353 0.3023
42 315 1.445 0.00317 1.445 0.368
Assuming rate constant, k. = Rate of decomposition.
y = 0.1644e0.0514x
R² = 0.9426
0
0.2
0.4
0.6
0.8
1
1.2
1.4
1.6
0 10 20 30 40 50
Rate
decomposition
temp/C
Rate decomposition vs temp/C
Comparing MnO2 vs Fe(NO3)3 on the rate of decomposition of H2O2 measured using a pressure sensor.
7. Arrhenius Eqn
Ea from its gradient
Arrhenius Eqn - Ea by graphical Method
RT
Ea
e
A
k
.
.
T
R
E
A
k a 1
ln
ln
Plot ln k vs 1/T
ln both sides
-Ea/R
Gradient = -Ea/R
Gradient = - 4703
-4703 = -Ea/R
Ea = 4703 x 8.314
= 39 kJmol-1
ln k
1/T
Arrhenius plot to find Ea for MnO2
Temp/
C
Temp/
K
Rate
kPa/s
1/T k ln k
17 290 0.4098 0.00344 0.4098 -0.892
30 303 0.7466 0.00330 0.7466 -0.2922
35 308 0.8274 0.00324 0.8274 -0.1894
38 311 1.353 0.00321 1.353 0.3023
42 315 1.445 0.00317 1.445 0.368
y = -4703.1x + 15.248
R² = 0.9375
-1
-0.8
-0.6
-0.4
-0.2
0
0.2
0.4
0.6
0.00315 0.0032 0.00325 0.0033 0.00335 0.0034 0.00345 0.0035
lnk
1/T
lnk vs 1/T
Assuming rate constant, k. = Rate of decomposition.
0
20
40
60
80
100
120
140
Fe(NO3)3 MnO2
Activation
energy
Type of catalyst
Type of catalyst vs activation energy
Comparison between solid catalyst (MnO2) vs solution (FeNO3)3
Lit value Ea.for MnO2 = (41 kJmol-1).
% 𝐞𝐫𝐫𝐨𝐫 =
(𝐋𝐢𝐭 𝐯𝐚𝐥𝐮𝐞−𝐞𝐱𝐩𝐭 𝐯𝐚𝐥𝐮𝐞)
𝐋𝐢𝐭 𝐯𝐚𝐥𝐮𝐞
x 100%
% error =
𝟒𝟏−𝟑𝟗
𝟒𝟏
𝐱 𝟏𝟎𝟎% = 𝟓%
MnO2 system has a lower Ea compared to Fe(NO3)3 system.
8. Method 1 Method 2
Time Time
Volume Pressure
• Rate = Δ vol O2 over time
• Volume recorded
• Rate = Δ pressure O2 over time
• Pressure recorded
Procedure
2H2O2 → O2 + 2H2O
Rxn: H2O2 with diff (catalyst) measured using TWO diff methods
• 2H2O2 → O2 + 2H2O
(H2O2 limiting, KI excess)
• Pipette 1ml 1.0M KI to 20ml of 1.5% H2O2
• Vol O2 released recorded at 1 min interval
• Repeated using 3% H2O2 conc
Time/m Vol O2
(H2O2 1.5%)
Vol O2
(H2O2 3.0%)
0 0.0 0.0
1 8.5 14.0
2 15.0 26.5
3 21.0 34.0
4 26.0 39.0
Volume O2
Time
3 %
1.5 %
Comparing MnO2 vs Fe(NO3)3 on the rate of decomposition of H2O2 measured using a pressure sensor.
9. • 2H2O2 → O2 + 2H2O
(H2O2 limiting, KI excess)
• Pipette 1ml 1.0M KI to 20ml of 1.5% H2O2
• Pressure O2 released recorded at 1 min interval
• Repeat using 3% H2O2 conc
Method 1 Method 2
Time Time
Volume Pressure
• Rate = Δ vol O2 over time
• Volume recorded
• Rate = Δ pressure O2 over time
• Pressure recorded
Procedure
2H2O2 → O2 + 2H2O
Time
3 %
1.5 %
Time/m Pressure O2
(H2O2 1.5%)
Pressure O2
(H2O2 3%)
0 101.3 101.3
1 102.4 103.4
2 103.5 105.6
3 110.3 115.2
4 113.5 118.2
Pressure O2
Comparing MnO2 vs Fe(NO3)3 on the rate of decomposition of H2O2 measured using a pressure sensor.