Integrating Automated Toll Discounts Into a Real-Time Ridesharing Program

Submitted Publication in the Transportation Research Record November 23, 2015 ABSTRACT A pilot program in Austin, Texas, tested the practicality of integrating a real-time ridesharing application with a toll operator to process toll discounts for carpools. The toll discounts appeared on monthly toll transaction statements. The program lasted for almost a year on the 183A Toll Road and the US 290 Manor Expressway. Travelers used a smartphone application to track, record, and submit their trips for discounts. Two-person carpools that used the application received a 50 percent discount, and carpools of three or more people could travel toll-free. The program was a partnership between the Central Texas Regional Mobility Authority, the local toll systems operator, and a private ridesharing vendor. Back-office processes matched trip data from the smartphone application to transactions recorded by the toll systems. A total of 95 unique drivers were provided toll rebates for 2,213 trips during the 10.5-month pilot period. Most trips during the pilot program were rebated for two-person carpools. Individual driver behavior varied considerably. A select few drivers had a high number of carpool trips, while others took a sporadic or infrequent trip. Drivers took a median of 7 trips during the pilot. Future rideshare programs should consider showing higher-dollar rebates that represent annual savings to incentivize behavior. Timely feedback was found to be an important factor for success. Additionally, program sponsors should provide positive customer service and engage users when problems exist that are not under their direct purview.

Recommandé
Contenu connexe
Tendances
Tendances (20)
Similaire à Integrating Automated Toll Discounts Into a Real-Time Ridesharing Program
Similaire à Integrating Automated Toll Discounts Into a Real-Time Ridesharing Program (20)
Plus de Texas A&M Transportation Institute
Plus de Texas A&M Transportation Institute (20)
Dernier
Dernier (20)
Integrating Automated Toll Discounts Into a Real-Time Ridesharing Program
- 1. INTEGRATING AUTOMATED TOLL DISCOUNTS INTO A REAL-TIME RIDESHARING PROGRAM Nicholas S. Wood, P.E., Corresponding Author Associate Transportation Researcher Texas A&M Transportation Institute 505 East Huntland Drive, Suite 455 Austin, TX 78752 Phone: 512-467-0946 Email: nickwood@tamu.edu S. Nathan Jones-Meyer Planner Williamson County 3151 S. E. Inner Loop, Suite B Georgetown, TX 78626 Phone: 512-943-3362 Email: s-jones@wilco.org Word Count: 5,848 (body) + 1,250 (5 figures) + 250 (1 table) = 7,348 Submitted Publication in the Transportation Research Record November 23, 2015
- 2. Wood and Jones 2 ABSTRACT A pilot program in Austin, Texas, tested the practicality of integrating a real-time ridesharing application with a toll operator to process toll discounts for carpools. The toll discounts appeared on monthly toll transaction statements. The program lasted for almost a year on the 183A Toll Road and the US 290 Manor Expressway. Travelers used a smartphone application to track, record, and submit their trips for discounts. Two-person carpools that used the application received a 50 percent discount, and carpools of three or more people could travel toll-free. The program was a partnership between the Central Texas Regional Mobility Authority, the local toll systems operator, and a private ridesharing vendor. Back-office processes matched trip data from the smartphone application to transactions recorded by the toll systems. A total of 95 unique drivers were provided toll rebates for 2,213 trips during the 10.5-month pilot period. Most trips during the pilot program were rebated for two-person carpools. Individual driver behavior varied considerably. A select few drivers had a high number of carpool trips, while others took a sporadic or infrequent trip. Drivers took a median of 7 trips during the pilot. Future rideshare programs should consider showing higher-dollar rebates that represent annual savings to incentivize behavior. Timely feedback was found to be an important factor for success. Additionally, program sponsors should provide positive customer service and engage users when problems exist that are not under their direct purview. Keywords: Pricing, Rideshare, Carpool, Rebate, Smartphone, Demand Management
- 3. Wood and Jones 3 INTRODUCTION Highway congestion has induced significant negative economic, social, and environmental outcomes. Yet, the financial and practical cost of expanding highway facilities is not feasible in many cases. As an alternative, commuters, employers, and governments have sought other solutions to better use existing roadway capacity. Carpooling and ridesharing have long been an option, with both formal and informal methods. Recent innovations in technology and changes in how society uses technology have allowed for a paradigm shift in regards to ridesharing. Real-time ridesharing relies on instant transmissions of information about commuter destinations to match and track riders. Accurate geo-locating and online social networking have promised quicker and increased ride-matching trips. The prevalence of smartphone devices throughout society can allow technology to monitor human activity on a large scale, given the assumption of one active device per user. In the context of ridesharing programs, smartphone devices can track, record, and verify trips made by specific persons as opposed to vehicles. Additionally, this type of technology has the potential to influence behavior by monitoring trip-making activities and engaging users. This paper shows how recent technological innovations have increased the viability of real-time ridesharing programs. A pilot of real-time ridesharing from Austin, Texas, assessed if a mobile smartphone application could engage, track, and record carpool trips that occurred on a tolled roadway facility. Drivers who took carpools received toll discounts and a rebate, with two-person carpools receiving 50 percent off their tolls and carpools of three or more people receiving toll-free trips. The official pilot launched to the public on February 18, 2014, and continued until December 31, 2014. The program applied to the 183A Toll Road and the US 290 Manor Expressway in Austin, both managed and operated by the Central Texas Regional Mobility Authority (CTRMA). A private rideshare vendor, called Carma, developed the smartphone application and managed the ridesharing pilot program for CTRMA. This paper presents the background of a project that integrated real-time ridesharing with a toll operator to provide toll discounts. LITERATURE REVIEW Real-time ridesharing, or ridesharing that occurs instantaneously, can be defined as “a single or recurring rideshare trip with no fixed schedule, organized on a one-time basis, with matching of participants occurring as little as a few minutes before departure or as far in advance as the evening before a trip is scheduled to take place” (1). The concept came from traditional forms of carpooling with more established matches between drivers and riders. The main benefit to users of real-time matching is the ability to be flexible and not have to adhere to a strict schedule. Challenges and Opportunities for Ridesharing In their work on real-time ridesharing, Amey, Attanucci, and Mishalani identified major economic, technical, and social challenges that face ridesharing services (1). The challenges identified are important in giving context to decisions regarding potential rideshare programs. Economic limitations of ridesharing stem from basic market limitations. By design, real-time ridesharing can offer few details about trip specifics. Imperfect information, such as questions the rider may have about the driver’s criminal record or the condition of the car, increases the risk associated with trip decisions, which plays a role in limiting the appeal of ridesharing. High transaction costs exist for scheduling rides, traveling to pick-up or drop-off sites, providing subsidies to single-occupancy vehicle (SOV) drivers, and paying for employee parking (1). Even
- 4. Wood and Jones 4 programs to encourage transit, cycling, or other alternative modes of transportation can be a disincentive to ridesharing. Siddiqi and Buliung (2) identified a variety of ridesharing programs from the 1990s and early 2000s. Early attempts to incentivize casual carpooling had underwhelming results. These projects were largely affected by technological limitations and promotional failures. An example of an early success was the Smart Traveler System from the Bellevue Transportation Management Association. The system sought workers with work-based commutes to the central business district from select employers. Participation was limited to the public. Commuter groups were divided by 59 employee participants based on where they lived. Using pagers, employees solicited rides and confirmed trips by phone. Roughly 500 rides were made with the system, and because logging rides was not required, only six were actually logged (2). Keeping and maintaining a logbook was a burdensome chore. The results showed an interest in ridesharing, but that interest was limited due to programmatic and technological constraints. The failures from prior programs showed the expectations that successful rideshare systems must fulfill, such as providing concise, inexpensive information about ridesharing opportunities and being marketed to reach a critical mass of users to alleviate fears about security. Subsequent programs addressed these issues to varying degrees. Integrating Recent Technological Advances into Ridesharing The most pervasive challenge to the successful implementation of real-time ridesharing has been technological limitations. However, over the past two decades, experiments that used advanced technology and social networks to facilitate instant access to traveler scheduling have seen successful results. These experiments evolved from co-workers using pagers to schedule trips to unrelated persons scheduling trips via mobile phone apps. The result has been the development of several ridesharing services that rely on mobile phones, geographic locating technology, and social networks to connect unrelated commuters who share a common destination and to create a system of incentives to carpool (2). Internet-enabled mobile phones and global positioning systems have led to the greatest technological enhancements for real-time ridesharing. These innovations have enabled real-time ridesharing programs to gain the essential critical mass of users and efficiently match users. Inspired by toll collection technologies, Kelley proposed the implementation of radio frequency devices and transponders to identify users and store information about each trip (3). As these technologies have evolved, they have enabled ridesharing systems to solve more complex ride- matching scenarios, for example, decreased preplanning and multi-hop, multi-objective route planning (4, 5). In a project meant to show the effectiveness of real-time ridesharing as a means of sustainable transport, Stach developed a platform called vHike that was dependent on smartphones and Web 2.0 technologies, such as online social networks. The system coordinated ride matches and used Bluetooth capabilities to detect nearby users (6). Abdel-Naby et al. developed another system that relied on Bluetooth capabilities, wireless communication, and mobile phones. The algorithm the researchers produced was an auction-based negotiation that sorted riders by their particular preferences (7). A major component of real-time ridesharing technology is the various algorithms that match riders and facilitate cost transactions. In fact, the major weakness of early ridesharing programs was the inability to effectively match and route users or handle complex transactions. Eventually, enhanced programs, based on advanced technology, began to see success where previous programs failed by creating more reliable matches (8). Fu et al. proposed a dynamic ridesharing system architecture that combined intelligent transportation systems and social
- 5. Wood and Jones 5 networks, which they dubbed the Dynamic Ride Sharing Community on Traffic Grid (DRSCTG). DRSCTG consisted of five functions that provided unique services, such as dynamic route navigation and social networking (9). Sghaier et al. focused on an approach that addressed the dynamic aspect of real-time ridesharing and allowed riders to match trips to a vehicle anywhere for any time. Their algorithm, called DOMARTiC, relied on advanced geospatial data optimization to identify multiple agents and distribute assignments (10). In an effort to address time windows, Herbawi and Weber developed a genetic and insertion heuristic algorithm that attempted to minimize the total travel distance and time of drivers in order to maximize the number of transported riders. By applying the algorithm to real-world data sets, the researchers showed that it was able to successfully optimize trips (11). In a related study, Ma et al. proposed a real-time taxi ridesharing system based on mobile-cloud architecture similar to that used in ridesharing programs. The researchers developed an algorithm that connected taxi users based on similar destinations so that they could share the taxi service. The algorithm proposed by the researchers was shown to effectively address two constraints, time window constraints and monetary constraints, found in ridesharing and taxi-sharing systems (12). Another model employed a discrete event system (DES) that considered the complexity of different activities, logic states, and conditions. The DES, developed by Di Febbraro et al., was evaluated in a real-world trial in Genoa, Italy, and was shown to be successful at reducing mean delay per user (13). The SR 520 corridor in Seattle hosted a real-time ridesharing project from 2010 to 2011, under a program administered by the Washington Department of Transportation (WSDOT). The Avego Corporation, now Carma, developed a smartphone application specifically for real-time ridesharing and recruited users. By using the application, users chose to be a driver or a rider. Avego charged a fee based on miles traveled, and the Avego system facilitated the payment to the driver. WSDOT provided further incentives, such as toll discounts, to encourage usage along the SR 520 corridor. For the initial phase, Avego set a goal to recruit 1,000 participants, 250 drivers, and 750 riders. Participants submitted several security checks administered by WSDOT. The security checks focused on potential drivers and consisted of a background check, proof of insurance up to $300,000, a copy of the participant’s driving record, and certification that the vehicle conformed to prescribed maintenance guidelines. Due to the rigor of the security checks, Avego reported significant difficulty in maintaining participants. However, when the project was finally in use, Avego was able to recruit 962 users (14). These examples show how technological innovations have extended and facilitated the benefits associated with real-time ridesharing. Both the technological changes of recent years (for example, increased smartphone usage and advanced geo-locating abilities) and the algorithms that allow them to efficiently match users and facilitate cost transactions have undergone extensive development in order to be adaptive to the growing real-time ridesharing market. As demographic trends change, potential users of ridesharing technology will likely increase. THE AUSTIN PILOT PROJECT A project to test the practicality of automating toll discounts with a real-time ridesharing program occurred from February 18th to December 31st , 2014, in Austin, Texas. That pilot attempted to link smartphone data with tolling systems to provide toll discounts. The project was a partnership between CTRMA, the local toll systems operator, and a private rideshare vendor. Carpoolers had the capability of downloading and using a smartphone application to create their own profiles, record trips, and link their toll transponder account to receive toll rebates. Vehicles with two
- 6. Wood and Jones 6 people received 50 percent off per tolled trip, and vehicles with three or more people traveled toll-free. However, the application had to be active for all of the riders, including the driver, and associated with an active toll transponder account (a TxTag transponder) to receive a rebate. Travelers who only rode as passengers were not required to obtain a toll transponder. The pilot operated on the 183A Toll Road and the US 290 Manor Expressway in Austin, Texas. Figure 1 shows a map of the 183A Toll Road and the US 290 Manor Expressway within the Austin metropolitan region. Services provided by Transportation Network Companies were not fully introduced by the time of the pilot. For example, the uberPOOL service from Uber that advertised sharing low- cost rides and splitting the cost was not launched for the Austin region until March 5, 2015 (15). A comparable service from Lyft, branded as Lyft Line, was introduced on March 9, 2015 (16). Both companies started their services right before the 2015 SXSW Interactive Festival, a major technology and media conference held annually in Austin, Texas. Real-Time Ridesharing Application The real-time ridesharing application advertised rides, recorded activity, and transmitted payments between users. After registering with the ridesharing program, participants indicated the starting and ending locations, with times, for common trips they took. Users designated their status, which included riding in another vehicle or driving and having the capacity to take additional passengers. The smartphone application could suggest riders or drivers in the path of the user or near the endpoint for a trip. Users had the option of sending private messages to specific individuals. Drivers and riders had the capability of rating users per trip, with an indication of a number of stars from one to five, with higher stars reflecting ratings that were more positive. Once participants took a trip with a registered rider, information from their trip was matched to the toll transaction so a toll discount could be processed. The toll discounts appeared on the user’s TxTag account statement the month after a completed trip. Drivers also had the capability of offering either free or reimbursed rides (with passengers paying the drivers). Upon registering, users had an account with the ridesharing service that allowed prepayment of trips. Additionally, users could receive payments from other users. For reimbursed rides, the driver had the option of charging riders $0.20 per mile (15 percent of which was retained by the ridesharing vendor for the cost of operation) for every passenger in the vehicle, up to a maximum of the standard mileage limit established by the Internal Revenue Service (set at $0.56 per mile during 2014). The step-by-step process for using the smartphone application was as follows: 1. Users activated the smartphone application and selected either the “plan trip” or “start trip” option. a. If users selected the plan trip option, they saw a screen where they could add a trip using start and end times, with locations; search for specific users; and scan current and local trip-making activity. b. If users selected the start trip option, they saw a screen where they could designate themselves as either a driver or a rider. 2. Users selected either driver or rider mode: a. If users selected the driver mode, a countdown clock appeared and the trip started recording. The smartphone transitioned into an active sensing mode where any detected rider was sensed (using the geolocation capabilities of the device) and added to the trip. The driver was not required to interact with the application until the trip was over.
- 7. Wood and Jones 7 b. If users selected the rider mode, they could enter the specific number for a driver or search for a driver in their list of friends. Users, under this mode, could indicate that a trip had started. 3. Users confirmed the conclusion of a trip: a. Drivers pressed the stop recording button and saw a short trip summary that described the amount earned (in dollars), number of miles traveled, and number of minutes for the trip. b. Both riders and riders saw a screen where they could rate the trip experience. c. Drivers and riders received email messages that verified the trip had occurred. d. Drivers received any money earned directly into their rideshare account. Processing Toll Rebates In order for trip payments to be processed, carpools had to undergo a verification process that confirmed travel under toll gantries on CTRMA toll facilities. The toll facilities operated by CTRMA on the 183A Toll Road and the Manor Expressway had toll gantries interspersed throughout the facility, located at points on the main facility and on the entry and exit ramps. A user who passed under a gantry had a toll that was specific to that location. Therefore, many trips had instances of multiple gantry crossings. On the 183 Toll Road, users had a toll that varied from $0.51 to $1.86 for a specific gantry, and on the US 290 Manor Expressway, users had a toll from $0.71 to $1.41 for each gantry crossing (all dollar amounts were for two-axle passenger vehicle trips during 2014). Trips made in a vehicle equipped with a TxTag transponder received a 25 percent discount off the base price. All drivers who received a toll reimbursement under the pilot program were required to travel with a TxTag. This verification process involved a multistep procedure that matched data from rideshare trips to individual toll transactions using the times indicated from each. In other words, trips were only rebated if the toll transaction occurred within the window of a rideshare trip starting and ending. The specific TxTag ID number had to match for the smartphone trip (based on entry from the user) and the toll transaction (based on the TxTag system). A time-based method was used instead of a geographic process because the smartphone application did not record a well- defined trail of latitude and longitude points for every trip. Only the start and end locations were recorded and archived for the study. The smartphone application limited the number of coordinates because recording more data points required more of a draw on battery power for smartphones. Specifically, the step-by-step process that Carma, the rideshare vendor, used to match trip to toll data was as follows (with Figure 2 shows a graphical representation of the steps): 1. Carma requested toll transaction data from CTRMA, given a list of registered TxTag IDs in Carma’s system. 2. CTRMA matched TxTag IDs to individual transactions from its toll database. 3. CTRMA provided the rideshare vendor with a data set of toll transactions. 4. Carma stored the transactions in its database. 5. Carma matched toll transactions to rideshare trips, based on the time of transaction. 6. Carma produced a verification report of vehicle occupancy and provided it to CTRMA for posting rebates to toll accounts. Due to the legacy toll systems in place, posted rebates for toll accounts only appeared in 10-day intervals, meaning a transaction that occurred for a single day could potentially not show up in a user account until 10 days later. However, users saw only monthly transaction statements.
- 8. Wood and Jones 8 The 10-day delay, at times, tended to cause rebates to show in the statement for the following month, leading to an additional delay for users. The reason for the delay was due to CTRMA’s toll system vendor checking and verifying transactions on its system, particularly for pay-by-plate users who did not have TxTag transponders. To verify transactions, the vendor had to observe images using license plate readers installed at each gantry. An operator had to observe the images to determine if each of the characters on a license plate were valid. If characters were identified, a transaction would be posted and a bill would be sent in the mail to the driver’s vehicle registration address. Additionally, users constantly changed their vehicles and toll transponders, making it difficult to have current and accurate information to process rebates. Therefore, the process to verify rebates was a time-sensitive process that required due diligence from both the vendor and CTRMA. If the toll systems were down, or miscommunication occurred, then it was very plausible for a delay in toll rebates to occur. Participants lose confidence in a system if there is any notice of disruptions, which includes not seeing expected incentives or rebates. The success of real-time ridesharing, similar to other transportation demand management programs, requires continual feedback and incentivizing of users to maintain and expand the service. Project Kickoff The real-time ridesharing project officially kicked off on February 18, 2014, for the 183A Toll Road and on May 17, 2014, for the US 290 Manor Expressway. The Manor Expressway kickoff was later because the facility was still being constructed and had not fully opened yet. However, part of the Manor Expressway was open when the pilot began, with one toll gantry operating in each direction. If participants were willing, they were capable of receiving toll discounts if they had trips on that small part of the Manor Expressway. The vendor started recruitment for the program beginning in late 2013, with a targeted campaign that focused on travelers who lived near both facilities. In October 2013, the vendor started a pre-launch test with the assistance of a major local employer, in addition to outreach with existing ridesharing programs (e.g., Commute Solutions from the Capital Area Metropolitan Planning Organization), transportation management associations (e.g., Movability Austin, representing downtown Austin), and representatives from the University of Texas at Austin. The context of each outreach activity with a potential partner consisted of understanding how existing programs functioned and how the real-time ridesharing pilot could augment their efforts. Other methods of recruitment included advertising on radio programs and billboards, and placing hangtags on the doors of suburban residential households in Cedar Park and Manor, Texas. RESULTS Ridesharing behavior, on a macroscopic level, was fairly consistent throughout the pilot program. However, individual behavior varied considerably, with a small number of drivers taking a high number of carpool trips. Most drivers took a small amount of infrequent trips. About 81 percent of all carpool trips were two-person carpools, and the average rebate was $1.08 per trip. Statistics about trip frequencies, number of passengers, rebate amounts, and time between first and last trip helped to provide insight about travel behavior. Most trips, roughly 65 percent of the total, occurred on the 183A Toll Road because that facility was fully operational at the onset of the pilot.
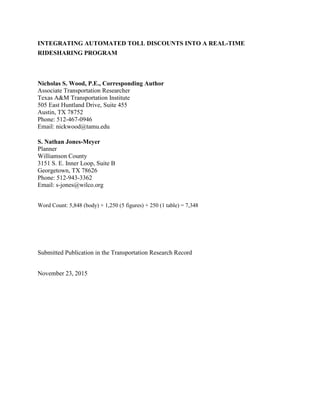
- 9. Wood and Jones 9 Number of Trips and Drivers From the initial kickoff through December 31, 2014, the real-time ridesharing project attracted a steady but small number of riders and trips. A total of 95 unique drivers were provided toll rebates for 2,213 trips during the pilot period. From March to May 2014, the total number of carpool trips was fairly consistent at an average of 177 trips per month. A spike to 246 trips occurred in June after the opening of the US 290 Manor Expressway. September had the highest number of carpools, with 305 toll rebates provided to users. A significant decrease occurred during November to a total of 165 carpool trips. That decrease was likely due to the Thanksgiving holiday, when drivers were taking fewer carpool trips. An average of 30 unique drivers was provided rebates each month, and the highest number of unique drivers was observed during June, with 41 unique drivers. Figure 3 shows the total number of rebated carpool trips and unique drivers per month. In short, the pilot program had an average of six to ten carpool trips per day – too small to have a measurable impact on local congestion. Based on drivers, the distribution of trips tended to be skewed more toward a select few who traveled frequently on the toll road using the ridesharing application. The driver withthe most activity during the pilot period had 254 toll-rebated trips (11.5 percent of all rebated trips). The second, third, and fourth most active drivers had 192, 175, and 167 rebated trips, respectively. In total, the five drivers with the highest number of rebated trips had a total of 885 trips, orroughly 40 percent of all rebated trips. Drivers took a median number of seven trips. Figure 4 shows the distribution of the number of trips per driver. Rideshare Activity and Toll Rebates Most trips during the pilot program were rebated for two-person carpools. Approximately 81 percent of all rebated trips occurred as two-person carpools, for a total of 1,802 trips. Other trips occurred as three-person, four-person, five-person, or six-person trips. The trip with the highest number of occupants had eight registered passengers in the vehicle. The amount of rebates posted to toll accounts varied from a high of $4.37 for a single trip to a minimum of $0.19. The highest rebate was for a vehicle with four axles, the only four-axle vehicle that was rebated for a carpool trip. The average rebate posted to a toll account was $1.08 for a single trip (median was $0.96). Table 1 shows the distribution of trips by the amount of the rebate posted. Overall, $2,393.67 in toll rebates was provided during the 10.5-month pilot program. Most drivers took advantage of providing free rides to passengers who used the ridesharing application. Drivers were only reimbursed for their travel by riders for 369 trips (16.7 percent of all trips). Riders paid slightly more than what drivers received so that the vendor could collect a small fee to help administer the program. For the pilot program, riders paid $1,388.50 in reimbursements, and drivers received $1,180.24. The vendor collected the remaining $208.26 in administrative fees, or 15 percent of the tolled amount collected, from trips that used CTRMA toll facilities. Longitudinal Trip Frequency Individual driver behavior varied considerably throughout the duration of the pilot program. A few drivers took advantage of the toll discounts early during the pilot and continued regular use until the end of 2014. Other drivers took an occasional, sporadic trip, and five drivers received only one toll rebate. The drivers who received one rebate likely tried the ridesharing application once, and then stopped soon thereafter. The median time period between the first and last rebated carpool trip per driver was 162 days (considering that some drivers may have started the program late during the pilot period).
- 10. Wood and Jones 10 Figure 5 shows a boxplot diagram of the number of days between the first and last carpool trip, by month of when each driver starting participating in the program. Drivers who started participating in March had a median time of 82 days between the first and last trip, and took a median of seven trips during the pilot. The total number of carpool trips from that March cohort varied from one to 167 trips during the pilot period. The declining maximum value, from February to November, was indicative of the fewer number of days that existed from that month to the end of the pilot. The high median for the May cohort was likely influenced by the full opening of the Manor Expressway, which was completely opened to traffic during that same month. The February cohort included drivers who started using the ridesharing application before the official pilot began, and no drivers started using the application for carpool rebates in December. DISCUSSION The presence and availability of advanced technology does not solely contribute to the success of a ridesharing program. During the pilot, CTRMA and the rideshare vendor attempted a number of different techniques to advertise rebates and engage potential users. Some of the approaches included coordinated recruitment events with major employers, paid advertisements on billboards, radio stations, websites, and social media, as well as door-to-door canvasing of suburban residential households. A number of reasons exist for the limited number of participating drivers. The small amount of money offered as a rebate, per trip, may not have been large enough to induce carpool behavior. The decreasing cost of fuel may have also had an impact on carpool trip decisions. Fuel prices decreased from $3.12 per gallon during January 2014 to $2.07 per gallon during December 2014 (17). In comparison, drivers received a median of $1.08 per trip during the pilot, which translated to $2.16 per day if the carpool had a standard journey-to-work activity pattern. The decrease negated an incentive for travelers to use carpooling as a means to save money, since of the amount of the toll rebate was similar to the reduction in fuel prices. However, structural changes in the value of the incentive, or trip costs, have not shown to be major factors the influence the decision to form a carpool. Prior research found that psychosocial attitudes and beliefs – not travel time and cost – constitute a major reason for why travelers carpool (18). A possible improvement to the program may be to market the rebate savings across an entire year as opposed to a single trip or day. An extrapolated estimate of savings for carpooling could potentially be $540 per year, assuming two trips taken for 250 workdays. A rearranged incentive structure could show travelers annualized toll savings from traveling as a carpool. The annual value would be higher thandisplayingaper-triprebateamount,providinganadditionalmeansfor incentivizingbehavior. Thesmartphone application can track and monitor recurrent progress toward meeting an annual goal. Another factor that may have influenced participation could be related to problems with the processing of toll transactions and perceptions related to tolling. In the middle of 2014, the Texas Department of Transportation (TxDOT) switched to a new billing and customer service contractor for its Toll Operations Division. TxDOT handles a significant portion of the toll transaction process for CTRMA. The switch to a new vendor caused some drivers to be charged for trips they did not take, and customers had long wait times for phone calls to the service center (19). Texas is not unique in its poor performance of handling toll bills. Both California (20) and Washington State (21) have experienced similar administrative problems. Problematic billing and customer service are disincentives for toll road use that work against the positive reinforcement of toll rebates. Future ridesharing programs that rely on the integration of tolling
- 11. Wood and Jones 11 systems need to anticipate problems with technologies not directly controlled by the program and engage the users appropriately. CONCLUSION Real-time ridesharing programs, facilitated by smartphone technology, have the potential to incentivize behavior. In a pilot program administered by CTRMA, carpool drivers had the ability to automatically receive toll rebates by using a linked smartphone application. The application enabled drivers to find riders in real time to form carpool trips. Incentives were provided in the form of toll rebates and participating drivers received discounts. The pilot attracted a small number of drivers who made either occasional or frequent carpool trips. A few select drivers made regular carpool trips, and made over 100 trips during the year. High participation rates were not achieved, despite CTRMA and the vendor making a significant and continuous effort to inform travelers about the incentive program. The pilot results offer a glimpse into how such a program can function and how travelers react and behave toward the system. ACKNOWLEDGMENTS This research was conducted as part of the Real-Time Ridesharing Technology to Support Differential Tolling by Occupancy Project, funded through the Value Pricing Pilot Program administered by the Federal Highway Administration. The project received additional support from the Central Texas Regional Mobility Authority, Texas Department of Transportation, and Carma, as well as in-kind partnership from the Capital Area Metropolitan Planning Organization. The authors would also like to thank Greg Griffin and Ginger Goodin from the Texas A&M Transportation Institute for their guidance and support. REFERENCES 1. Amey, A., J. Attanucci, and R. Mishalani. Real-Time Ridesharing. In Transportation Research Record: Journal of the Transportation Research Board, No. 2217, Transportation Research Board of the National Academies, Washington, D.C., 2011, pp. 103–110. 2. Siddiqi, Z., and R. Buliung. Dynamic Ridesharing and Information and Communications Technology: Past, Present and Future Prospects. Transportation Planning and Technology, Vol. 36, No. 6, 2013, pp. 479–498. 3. Kelley, K. L. Casual Carpooling—Enhanced. Journal of Public Transportation, Vol. 10, No. 4, 2007, pp. 119–130. 4. Massaro, D. W., B. Chaney, S. Bigler, J. Lancaster, S. Iyer, M. Gawade, M. Eccleston, E. Gurrola, and A. Lopez. Just-in-Time Carpooling without Elaborate Preplanning. Webist 2009: Proceedings of the Fifth International Conference on Web Information Systems and Technologies, Lisbon, Portugal, 2009, pp. 219–224. 5. Herbawi, W., and M. Weber. Comparison of Multiobjective Evolutionary Algorithms for Solving the Multiobjective Route Planning in Dynamic Multi-Hop Ridesharing. 2011 IEEE Congress on Evolutionary Computation (CEC), New Orleans, La., 2010, pp. 2099–2106. 6. Stach, C. Saving Time, Money and the Environment—VHike, A Dynamic Ride- Sharing Service for Mobile Devices. IEEE International Conference on Pervasive Computing and Communications Workshops, Seattle, Wa., 2011, pp. 352–355.
- 12. Wood and Jones 12 7. Abdel-Naby, S., S. Fante, and P. Giorgini. Auctions Negotiation for Mobile Rideshare Service. Second International Conference on Pervasive Computing and Applications, Toronto, Canada, 2007, pp. 225–230. 8. Chan, N. D., and S. A. Shaheen. Ridesharing in North America: Past, Present, and Future. Transport Reviews, Vol. 32, No. 1, 2012, pp. 93–112. 9. Fu, Y., Y. Fang, C. Jiang, and J. Cheng. Dynamic Ride Sharing Community Service on Traffic Information Grid. Proceedings International Conference on Intelligent Computation Technology and Automation, Changsha, Hunan, China, Vol. 2, 2008, pp. 348–352. 10. Sghaier, M., H. Zgaya, S. Hammadi, and C. Tahon. A Distributed Optimized Approach based on the Multi Agent Concept for the Implementation of a Real Time Carpooling Service with an Optimization Aspect on Siblings. International Journal of Engineering, Vol. 5, No. 2, 2011, pp. 217–241. 11. Herbawi, W. M., and M. Weber. A Genetic and Insertion Heuristic Algorithm for Solving the Dynamic Ridematching Problem with Time Windows. Proceedings of the Fourteenth International Conference on Genetic and Evolutionary Computation Conference, Philadelphia, Pa., 2012, p. 385. 12. Ma, S., Y. Zheng, and O. Wolfson. Real-Time City-Scale Taxi Ridesharing. IEEE Transactions on Knowledge and Data Engineering, Vol. 27, No. 7, 2015, pp. 1–14. 13. Di Febbraro, A., E. Gattorna, and N. Sacco. Optimization of Dynamic Ridesharing Systems. In Transportation Research Record: Journal of the Transportation Research Board, No. 2359, Transportation Research Board of the National Academies, Washington, D.C., 2013, pp. 44–50. 14. O’Sullivan, S. Case Study in Real-Time Ridesharing: SR 500 Carpooling Pilot Project, Seattle WA. Proceedings, 18th ITS World Congress, Orlando, Fla., 2011. 15. Rigney, Lauren. “UberPOOL Arrives in Austin.” Uber Press Release, March 5, 2015. https://newsroom.uber.com/austin/2015/03/5-uberpool-rides-2/. Accessed November 23, 2015. 16. “Lyft Takes Over SXSW with Magic Mode, Lyft Line, and Logan.” Lyft Press Release, March 9, 2015. http://thehub.lyft.com/blog/2015/3/9/lyft-takes-over-sxsw- with-magic-mode-lyft-line-and-logan. Accessed November 23, 2015. 17. U.S. Energy Information Administration. Gulf Coast Gasoline and Diesel Retail Rates. http://www.eia.gov/dnav/pet/pet_pri_gnd_dcus_r30_w.htm. Accessed May 6, 2015. 18. Wang, T., and C. Chen. Attitudes, Mode Switching Behavior, and the Build Environment: A Longitudinal Study in the Puget Sound Region. Transportation Research Part A, Vol. 46, No. 10, 2012, pp. 1594–1607. 19. Batheja, A. TxDOT: Toll Billing Problems Being Addressed. Texas Tribune, January 29, 2015. http://www.texastribune.org/2015/01/29/txdot-toll-billing-problems-being- addressed/. Accessed July 15, 2015. 20. Finney, M. 7 on Your Side: Customers Unfairly Hit with Penalties. ABC 7 News, February 12, 2015. http://abc7news.com/technology/7-on-your-side-fastrak- customers-unfairly-hit-with-penalties/515536/. Accessed July 15, 2015. 21. Hahn, E. Attorneys File Class Action Suit over Good to Go Billing Process. KING 5 News, January 29, 2015. http://www.king5.com/story/news/2015/01/ 29/520-bridge- toll-class-action-lawsuit-billing-problems/22553149/. Accessed July 15, 2015.
- 13. Wood and Jones 13 LIST OF FIGURES AND TABLES FIGURE 1 Location of the 183A Toll Road and US 290 Manor Expressway. FIGURE 2 Database processes to verify toll rebates (Source: Carma Technology Corporation). FIGURE 3 Number of toll-rebated trips and unique drivers. FIGURE 4 Distribution of number of trips per driver. FIGURE 5 Driver trip frequency by month of starting program. TABLE 1 Number of trips by rebate amount.
- 14. Wood and Jones 14 FIGURE 1 Location of the 183A Toll Road and US 290 Manor Expressway.
- 15. Wood and Jones 15 FIGURE 2 Database processes to verify toll rebates (Source: Carma Technology Corporation).
- 16. Wood and Jones 16 *Figures for February are reflective of a 2/18/2014 start date FIGURE 3 Number of toll-rebated trips and unique drivers.
- 17. Wood and Jones 17 FIGURE 4 Distribution of number of trips per driver.
- 18. Wood and Jones 18 FIGURE 5 Driver trip frequency by month of starting program.
- 19. Wood and Jones 19 TABLE 1 Number of trips by rebate amount. Toll Posted Number of Trips Less than $0.50 81 $0.50–$0.99 1,226 $1.00–$1.49 611 $1.50–$1.99 174 $2.00–$2.49 85 $2.50–$2.99 31 Over $3.00 3