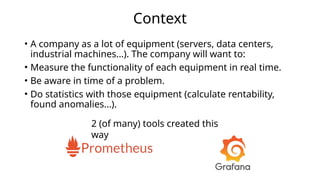
Context
• A companyas a lot of equipment (servers, data centers,
industrial machines...). The company will want to:
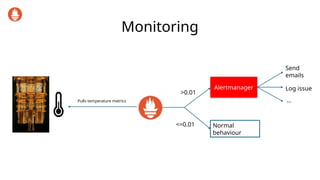
• Measure the functionality of each equipment in real time.
• Be aware in time of a problem.
• Do statistics with those equipment (calculate rentability,
found anomalies...).
2 (of many) tools created this
way
What it does
•Regularly pulls metrics
• Stores time series as dimensional data model
• Delivers metrics on demand
5.
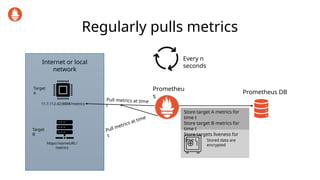
Regularly pulls metrics
Internetor local
network
11.7.112.42:8888/metrics
https://someURL/
metrics
Target
A
Target
B
Prometheu
s
Prometheus DB
Pull metrics at time
t
Every n
seconds
Pull metrics at time
t
Store target A metrics for
time t
Store target B metrics for
time t
Store targets liveness for
time t Stored data are
encrypted
6.
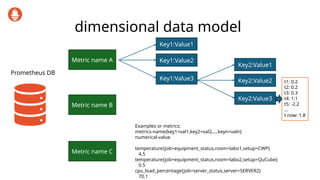
dimensional data model
PrometheusDB
Metric name A
Metric name B
Metric name C
Key1:Value1
Key1:Value2
Key1:Value3
Key2:Value1
Key2:Value2
Key2:Value3
t1: 0.2
t2: 0.2
t3: 0.3
t4: 1.1
t5: -2.2
…
t now: 1.8
Examples or metrics:
metrics-name{key1=val1,key2=val2,…,keyn=valn}
numerical-value
temperature{job=equipment_status,room=labo1,setup=CWP}
4.5
temperature{job=equipment_status,room=labo2,setup=QuCube}
0.5
cpu_load_percentage{job=server_status,server=SERVER2}
70.1
7.
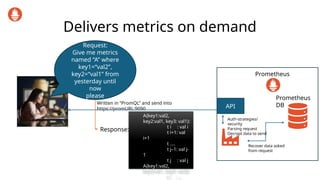
Delivers metrics ondemand
Request:
Give me metrics
named “A” where
key1=“val2”,
key2=“val1” from
yesterday until
now
please
Written in “PromQL” and send into
https://promURL:9090
Prometheus
API
Prometheus
DB
A{key1:val2,
key2:val1, key3: val1}:
t i : val i
t i+1: val
i+1
t ….
t j–1: val j-
1
t j : val j
A{key1:val2,
key2:val1, key3: val2}:
t i : …
Response:
Auth-strategies/
security
Parsing request
Decrypt data to send
Recover data asked
from request
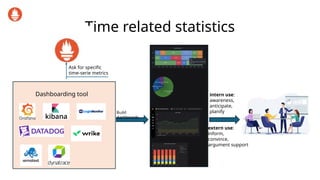
Time related statistics
Dashboardingtool
Ask for specific
time-serie metrics
Build
dashboards
intern use:
awareness,
anticipate,
planify
extern use:
inform,
convince,
argument support
11.
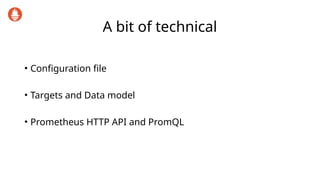
A bit oftechnical
• Configuration file
• Targets and Data model
• Prometheus HTTP API and PromQL
12.
Configuration file
global:
scrape_interval: 15s
scrape_configs:
-job_name: ‘someJob1’
scrape_interval: 5s
static_configs:
- targets: [‘Some URL1’, ‘Some
URL2’]
labels:
key1: ‘value1’
- targets:[‘Some URL3’]
labels:
key1:’value2’
- job_name:’someJob2’
…
Prometheus configuration = 1file
The data depends only to the targets
responses.
13.
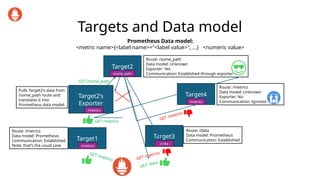
Targets and Datamodel
Target1
/metrics
Target2
/some_path
Target2’s
Exporter
/metrics
Target3
/data
Target4
/metrics
Route: /metrics
Data model: Prometheus
Communication: Established
Note: that’s the usual case
Route: /data
Data model: Prometheus
Communication: Established
Route: /metrics
Data model: Unknown
Exporter: No
Communication: Ignored
GET /metrics
GET /data
GET /metrics
GET /metrics
GET /metrics
Route: /some_path
Data model: Unknown
Exporter: Yes
Communication: Established through exporter
Pulls Target2’s data from
/some_path route and
translates it into
Prometheus data model.
Prometheus Data model:
<metric name>{<label name>="<label value>", ...} <numeric value>
GET /some_path
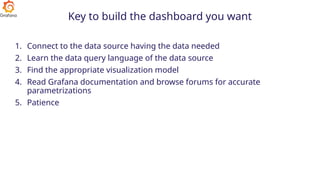
Key to buildthe dashboard you want
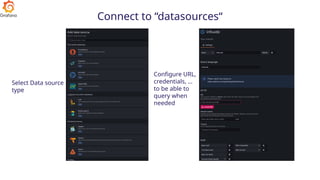
1. Connect to the data source having the data needed
2. Learn the data query language of the data source
3. Find the appropriate visualization model
4. Read Grafana documentation and browse forums for accurate
parametrizations
5. Patience
20.
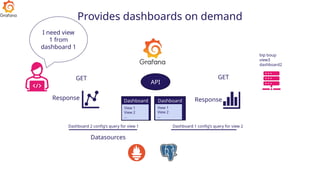
Provides dashboards ondemand
Datasources
Dashboard
1
Dashboard
2
I need view
1 from
dashboard 1
View 1
View 2
…
View 1
View 2
…
API
bip boup
view3
dashboard2
GET GET
Dashboard 2 config’s query for view 1 Dashboard 1 config’s query for view 2
Response Response


![Configuration file
global:
scrape_interval: 15s
scrape_configs:
- job_name: ‘someJob1’
scrape_interval: 5s
static_configs:
- targets: [‘Some URL1’, ‘Some
URL2’]
labels:
key1: ‘value1’
- targets:[‘Some URL3’]
labels:
key1:’value2’
- job_name:’someJob2’
…
Prometheus configuration = 1file
The data depends only to the targets
responses.](https://image.slidesharecdn.com/monitoring-250922114350-9e097e6d/85/Monitoring-d-equipements-avec-Prometheus-et-Grafana-12-320.jpg)