Téléchargez gratuitement pendant 30 jours
Se connecter
Mettre en ligne
Langue (FR)
Assistance clientèle
Business
Mobile
Médias sociaux
Marketing
Technologie
Art & Photos
Carrière
Design
Formation
Présentations et discours publics
Gouvernement et associations à but non lucratif
Santé
Internet
Droit
Direction et management
Industrie automobile
Ingénierie
Logiciels
Recrutement & RH
Commerce de détail
Ventes
Services
Sciences
Petites entreprises & entrepreunariat
Alimentation
Environnement
Économie & finance
Données & analyses
Relations avec les actionnaires
Sports
Spirituel
Actualités & Politique
Voyages
Développement personnel
Immobilier
Divertissement et humour
Santé & Médecine
Périphériques & matériel
Mode de vie
Changer de langue
Langue
English
Español
Português
Français
Deutsche
Annuler
Enregistrer
Soumettre la recherche
FR
Téléchargé par
Dmitry Grapov
PDF, PPTX
10 vues
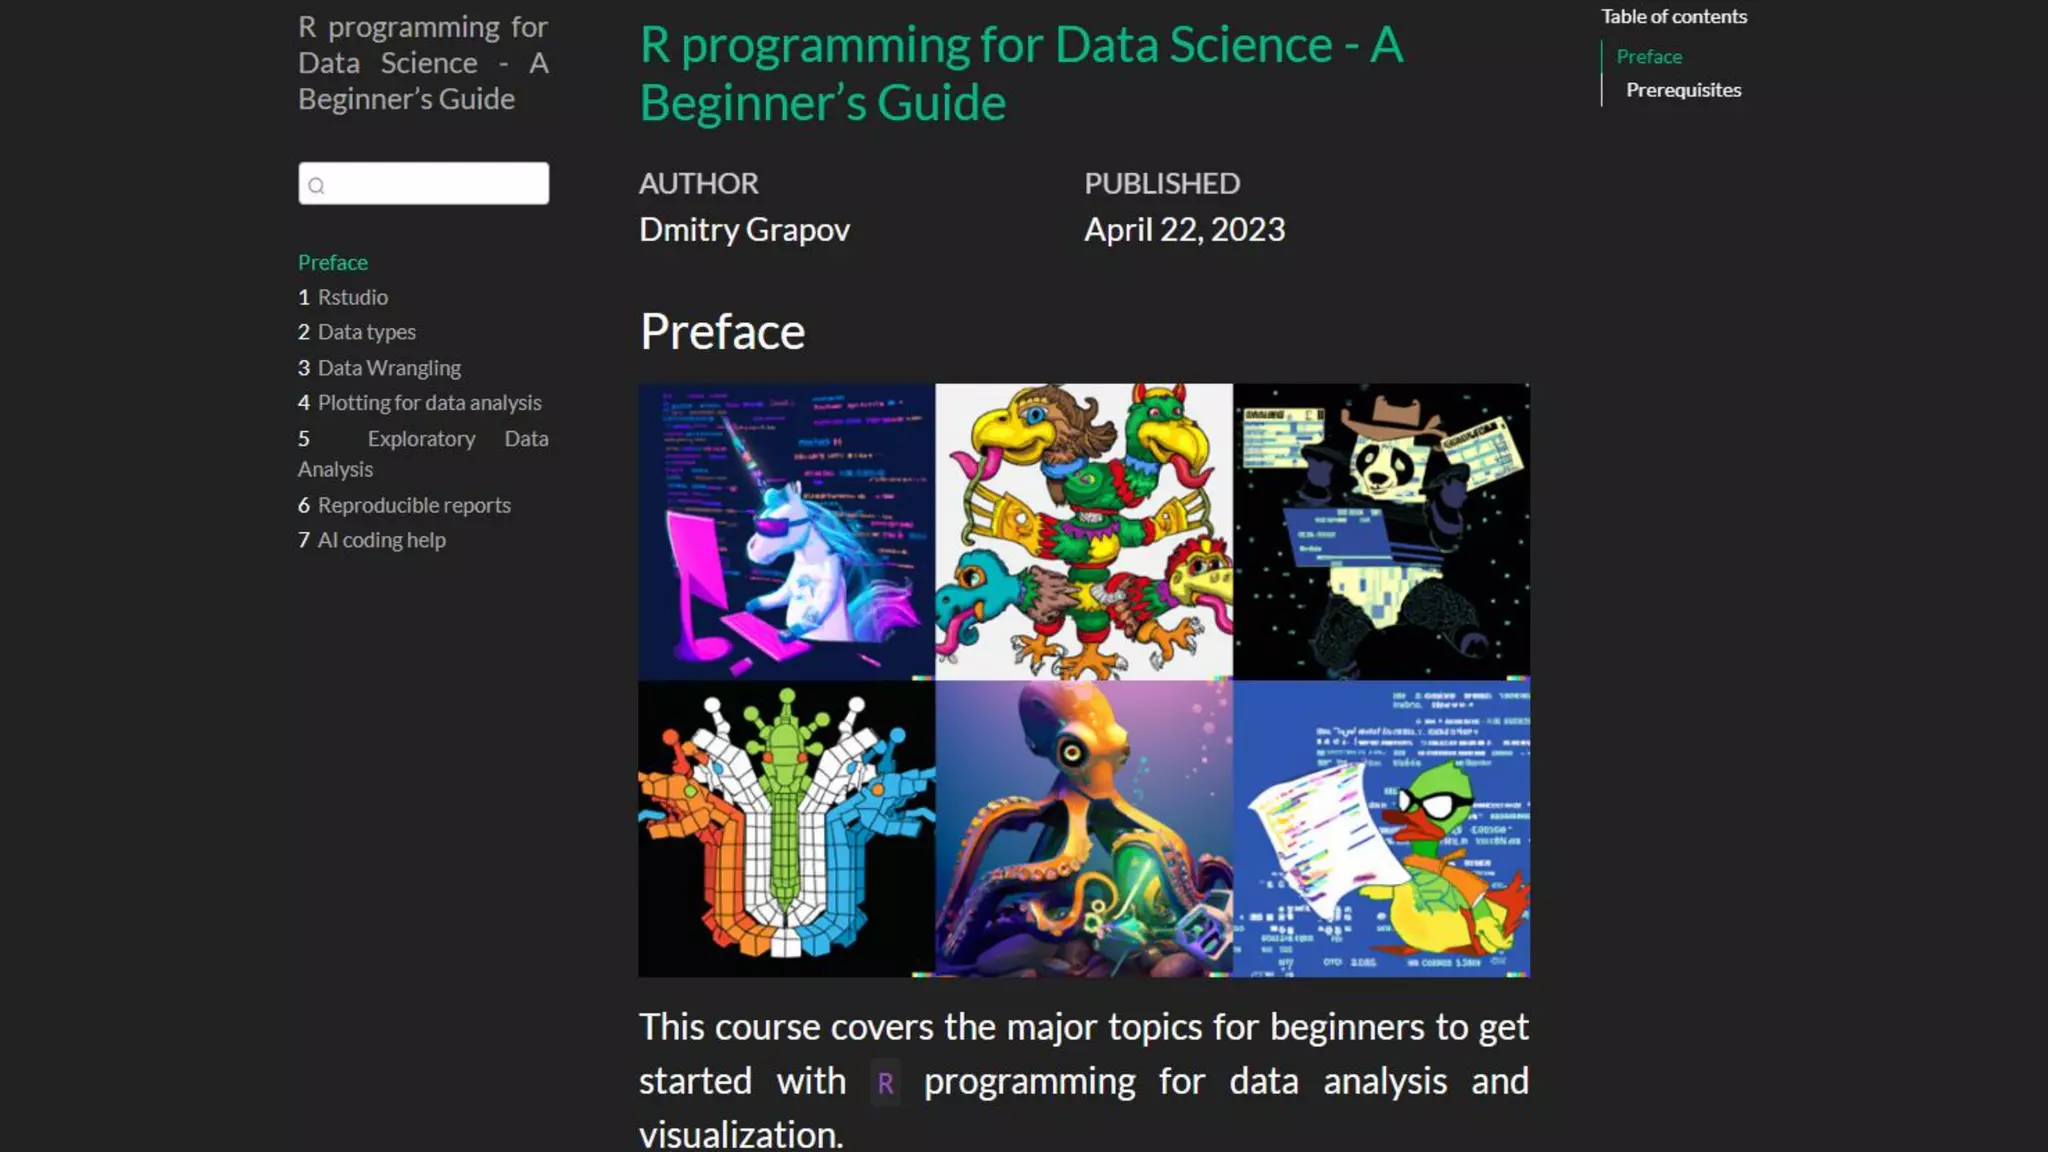
R programming for Data Science - A Beginner’s Guide
https://creativedatasolutions.github.io/R_programming_for_DS_beginner/
Données & analyses
◦
Sujets connexes:
Data Science Insights
•
Data Visualization Techniques
•
Lire la suite
0
Enregistrer
Partager
Intégrer
Intégrer la présentation
Télécharger
Télécharger en tant que PDF, PPTX
1
/ 1
Contenu connexe
PPTX
Data analysis workflows part 1 2015
par
Dmitry Grapov
PPTX
Machine Learning Powered Metabolomic Network Analysis
par
Dmitry Grapov
PDF
Network mapping 101 course
par
Dmitry Grapov
PDF
Dmitry Grapov Resume and CV
par
Dmitry Grapov
PDF
Rise of Deep Learning for Genomic, Proteomic, and Metabolomic Data Integratio...
par
Dmitry Grapov
PPTX
Data analysis workflows part 2 2015
par
Dmitry Grapov
PPTX
Complex Systems Biology Informed Data Analysis and Machine Learning
par
Dmitry Grapov
PPTX
Metabolomics and Beyond Challenges and Strategies for Next-gen Omic Analyses
par
Dmitry Grapov
Data analysis workflows part 1 2015
par
Dmitry Grapov
Machine Learning Powered Metabolomic Network Analysis
par
Dmitry Grapov
Network mapping 101 course
par
Dmitry Grapov
Dmitry Grapov Resume and CV
par
Dmitry Grapov
Rise of Deep Learning for Genomic, Proteomic, and Metabolomic Data Integratio...
par
Dmitry Grapov
Data analysis workflows part 2 2015
par
Dmitry Grapov
Complex Systems Biology Informed Data Analysis and Machine Learning
par
Dmitry Grapov
Metabolomics and Beyond Challenges and Strategies for Next-gen Omic Analyses
par
Dmitry Grapov
Plus de Dmitry Grapov
PDF
Case Study: Overview of Metabolomic Data Normalization Strategies
par
Dmitry Grapov
PPTX
American Society of Mass Spectrommetry Conference 2014
par
Dmitry Grapov
PPTX
Normalization of Large-Scale Metabolomic Studies 2014
par
Dmitry Grapov
PPT
Gene Ontology Enrichment Network Analysis -Tutorial
par
Dmitry Grapov
PPTX
Modeling poster
par
Dmitry Grapov
PPTX
Metabolomic Data Analysis Workshop and Tutorials (2014)
par
Dmitry Grapov
PPTX
High Dimensional Biological Data Analysis and Visualization
par
Dmitry Grapov
PPT
Prote-OMIC Data Analysis and Visualization
par
Dmitry Grapov
PPTX
Metabolomic data analysis and visualization tools
par
Dmitry Grapov
PPTX
4 partial least squares modeling
par
Dmitry Grapov
PPTX
3 data normalization (2014 lab tutorial)
par
Dmitry Grapov
PPTX
3 principal components analysis
par
Dmitry Grapov
PPTX
Automation of (Biological) Data Analysis and Report Generation
par
Dmitry Grapov
PPTX
2 cluster analysis
par
Dmitry Grapov
PPTX
Data Normalization Approaches for Large-scale Biological Studies
par
Dmitry Grapov
PPTX
6 metabolite enrichment analysis
par
Dmitry Grapov
PPT
Multivarite and network tools for biological data analysis
par
Dmitry Grapov
PPTX
Omic Data Integration Strategies
par
Dmitry Grapov
PPTX
Mapping to the Metabolomic Manifold
par
Dmitry Grapov
PPTX
5 data analysis case study
par
Dmitry Grapov
Case Study: Overview of Metabolomic Data Normalization Strategies
par
Dmitry Grapov
American Society of Mass Spectrommetry Conference 2014
par
Dmitry Grapov
Normalization of Large-Scale Metabolomic Studies 2014
par
Dmitry Grapov
Gene Ontology Enrichment Network Analysis -Tutorial
par
Dmitry Grapov
Modeling poster
par
Dmitry Grapov
Metabolomic Data Analysis Workshop and Tutorials (2014)
par
Dmitry Grapov
High Dimensional Biological Data Analysis and Visualization
par
Dmitry Grapov
Prote-OMIC Data Analysis and Visualization
par
Dmitry Grapov
Metabolomic data analysis and visualization tools
par
Dmitry Grapov
4 partial least squares modeling
par
Dmitry Grapov
3 data normalization (2014 lab tutorial)
par
Dmitry Grapov
3 principal components analysis
par
Dmitry Grapov
Automation of (Biological) Data Analysis and Report Generation
par
Dmitry Grapov
2 cluster analysis
par
Dmitry Grapov
Data Normalization Approaches for Large-scale Biological Studies
par
Dmitry Grapov
6 metabolite enrichment analysis
par
Dmitry Grapov
Multivarite and network tools for biological data analysis
par
Dmitry Grapov
Omic Data Integration Strategies
par
Dmitry Grapov
Mapping to the Metabolomic Manifold
par
Dmitry Grapov
5 data analysis case study
par
Dmitry Grapov
Télécharger