
Recommandé
Recommandé
Contenu connexe
En vedette
En vedette (6)
Plus de Sloan Sports Conference
Plus de Sloan Sports Conference (8)
Scoring Strategies for the Underdog – Using Risk as an Ally in Determining Optimal Sports Strategies
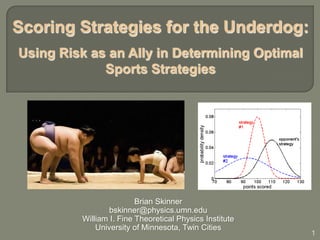
- 1. Scoring Strategies for the Underdog: Using Risk as an Ally in Determining Optimal Sports Strategies Brian Skinner bskinner@physics.umn.edu William I. Fine Theoretical Physics Institute University of Minnesota, Twin Cities 1
- 2. This is not a talk about data analysis • Every analysis begins with a question. • Usually: “Here is some data. What can I learn from it?” • Here: “Assume I know everything about my offense. How do I optimize its performance?” • Which plays do I run, and how often? • How do I allocate shots among players? • When (and to what extent) should I use high-risk tactics? 2
- 3. This is not a talk about data analysis • Every analysis begins with a question. • Usually: “Here is some data. What can I learn from it?” • Here: “Assume I know everything about my offense. How do I optimize its performance?” • Which plays do I run, and how often? • How do I allocate shots among players? • When (and to what extent) should I use high-risk tactics? Goal: A simple, quantitative rule for assessing risk/reward decisions and calculating optimal strategies. 3
- 4. When should I take risks? Example: A simple shooting contest – score the most points on 100 shots X Shoot 2-pointers: 2PT% = 75% X or 3-pointers: 3PT% = 50% Winner gets $1,600,000. Question: Should you choose to shoot 2’s or 3’s? Answer: It depends entirely on how good your friend is. 4
- 5. A strategy is characterized by a probability distribution 0.06 For a given mean shoot 2's shoot 3's score, more risk implies more variance 0.04 Which distribution should probability density 150 8.7 you choose? 0.02 150 15 0 100 120 140 160 180 200 points scored 5
- 6. A strategy is characterized by a probability distribution 0.06 For a given mean better score, more risk implies 0.05 opponent more variance probability density 0.04 Which distribution should you choose? 0.03 0.02 shoot 3's Underdogs should pursue riskier strategies. 0.01 0 100 120 140 160 180 200 points scored 6
- 7. A strategy is characterized by a probability distribution 0.06 For a given mean score, more risk implies 0.05 worse more variance opponent probability density 0.04 Which distribution should shoot 2's you choose? 0.03 0.02 Underdogs should pursue riskier strategies. 0.01 0 Favored teams should be 100 120 140 160 180 200 points scored conservative. [Dean Oliver, 1995, http://www.rawbw.com/~deano/] [Malcolm Gladwell, “How David Beats Goliath”,The New Yorker, 2009] 7
- 8. What’s better: larger variance or a higher mean? An underdog should be willing to sacrifice from its mean score in order to increase the variance in the outcome. Sometimes the best strategy is the one that leads, on average, to a worse loss. How can we optimize the risk/reward tradeoff? 8
- 9. The elements of offensive strategy A team has a set of plays it can call: i = 1, 2, 3, … Each has point value vi and success rate pi. “Strategy”: The number of times Ni that each play is run. Assumption: All plays are statistically independent. [Huizinga and Weil, “Hot Hand or Hot Head? …”, SSAC, 2009] Consequence: The final score follows the binomial distribution. mean: μ = Σi Ni vi pi variance: σ2 = Σi Ni vi2 pi (1-pi) 9
- 10. The “CLT Rule” The Central Limit Theorem (CLT): When many plays remain, the quantity Δ = (your score) – (opponent’s score) is Gaussian distributed with mean μ – μopp and variance σ2 + σ2opp. So the probability of winning depends only on the quantity μ μopp μ = Σi Ni vi pi Z σ 2 σopp 2 σ2 = Σi Ni vi2 pi (1-pi) The CLT Rule: A team’s best long-term strategy is the one that gives the largest value of Z. 10
- 11. Example 1: UNC vs. Duke The recipe for an upset UNC 2010-11: 2PT% = 0.498 Duke 2010-11: 2PT% = 0.522 3PT% = 0.317 Should UNC shoot 2’s or 3’s? Say UNC trails by s with N poss. left shoot If they shoot 2’s: Z 0.048N s 3’s 2 1.99N If they shoot 3’s: Z 0.093N s 3 2.95N shoot Z3 > Z2 when 2’s s > 0.16 N 11
- 12. Example 2: Stalling for Time It is in the interest of the underdog to keep the game short. underdog: p2 = 0.5 opponent: p2 = 0.55 regular possessions = 16 seconds OR “stalled” possessions = 24 seconds ? An underdog can benefit from stalling even when they don’t have the lead. 12
- 13. Example 3: Playing Hack-a-Shaq A winning team protects its lead by preventing high- variance plays. One way: foul the opponent’s worst free throw shooter Shaq Brian Skinner [Getty Images/Tom Hauck] [AP Photo/Greg Wahl-Stephens] 13
- 14. Example 3: Playing Hack-a-Shaq Suppose your team shoots p2 = 0.55. Shaq’s team: p2 = 0.5 pFT = 0.55 When should you foul? 14
- 15. A word about “skill curves” In reality, a given play should not be run 100% of the time. Play effectiveness declines with frequency of use. This amounts to a dependence pi(Ni). shoot 3’s shoot 3’s shoot shoot 2’s 2’s 15
- 16. Conclusions: quantifying risk/reward decisions in sports • When winning is unlikely, an underdog must take risk. • “How much risk?” can be answered quantitatively. • If different plays can be considered statistically independent, the binomial distribution completely describes the outcome. • Optimal (mixed) strategies can be calculated – when many plays remain the CLT Rule gives an excellent approximation. • When the coach/player thinks “I know I should be doing X, but I don’t know to what extent I should do it”, there is a great opportunity for analytic approaches to be helpful. Questions? 16