Impact driven product management @ Scrum gathering Dublin 2017
•
5 j'aime•611 vues

This document discusses impact-driven product management and impact mapping. It introduces impact mapping as a framework to help deliver desirable products by mapping out the desired impact, how the product will achieve that impact through user needs and behaviors, and the technical solution. The document provides examples of impact maps and exercises for readers to practice creating impact maps, including identifying metrics, users, and evaluating designs. The goal of impact mapping is to provide guidance for product development by clearly linking it to the desired business and user impacts.

Recommandé
Recommandé
Contenu connexe
Tendances
Tendances (20)
Similaire à Impact driven product management @ Scrum gathering Dublin 2017
Similaire à Impact driven product management @ Scrum gathering Dublin 2017 (20)
Plus de Sara Lerén
Plus de Sara Lerén (11)
Dernier
Dernier (20)
Impact driven product management @ Scrum gathering Dublin 2017
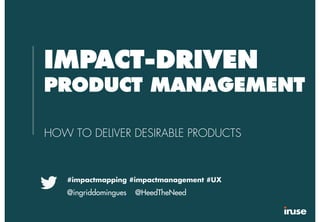
- 1. IMPACT-DRIVEN PRODUCT MANAGEMENT HOW TO DELIVER DESIRABLE PRODUCTS #impactmapping #impactmanagement #UX @ingriddomingues @HeedTheNeed
- 3. WHAT IS THIS ”IMPACT-DRIVEN” THING HOW CAN IT HELP YOU? AND
- 4. ENVELOPES
- 5. THE DESIRED IMPACT CAN ONLY OCCUR IF THE SERVICE WORKS WELL IN USE SERVICE IMPACT INVESTMENT EFFORT BENEFIT USER SERVICE OWNER
- 6. IDEA DRIVENNEEDS DRIVEN IMPACT DRIVEN SERVICE IMPACT INVESTMENT EFFORT BENEFIT SERVICE OWNER
- 11. IMPACT MAP EFFEKTKARTA ®
- 13. WHY IMPACT ON BUSINESS HOW IMPACT ON USE WHAT SOLUTION AIM or SLOGAN DOMAINS METRICS USERS BEHAVIOURS NEEDS CAPABILITIES FUNCTIONS
- 14. WHY IMPACT ON BUSINESS HOW IMPACT ON USE WHAT SOLUTION AIM or SLOGAN DOMAINS METRICS USERS BEHAVIOURS NEEDS CAPABILITIES FUNCTIONS SCOPING MEASURING LONG- TERM SUCCESS PRIORITIZING TESTING DESIGN EVALUATING SOLUTIONS and GENERATING SUGGESTIONS GROUND FOR SPECIFICATION
- 15. A few defined rules and structures makes the Impact Map a solid ground for design, planning and quality assurance, thus delivering desired value: 1. The WHY must consist of at least two domains 2. The HOW must be based on user studies, even if rudimentary 3. The HOW must be prioritized, based on impact on the WHY 4. Every point in the chain from WHY to WHAT should add a clear value
- 16. WHY IMPACT ON BUSINESS HOW IMPACT ON USE WHAT SOLUTION AIM or SLOGAN DOMAINS METRICS USER and her NEEDS CAPABILITY and its FUNCTIONS PRIORITIZING TESTING DESIGN EVALUATING SOLUTIONS and GENERATING SUGGESTIONS GROUND FOR SPECIFICATION
- 17. START WITH DOMAINS • Productivity • Effectiveness • Time spent • Customer satisfaction • Recurrent customers • Conversion • Correctness • Brand awareness • Recommendation • Learnability • …
- 18. CONTINUE WITH METRICS EFFICIENT WORK DAY 75% of employees state in yearly SEI that the intranet has made personal administration more efficient TRUST 75% customers state they recommended ACME to others Trust Pilot Rate >5 by end of 2018 INCREASED SELF SERVICE 50% reduction of customer calls concerning invoices
- 19. QUANTITATIVE METHODS QUALITATIVE METHODS OBSERVED BEHAVIOUR Log analytics, user testing & field studies • Visitor behaviour • Success rate ANALYSED OPINIONS User testing, in-depth interviews, focus groups • Attitudes • Explained behaviour MEASUREMENTS Log analytics, absolute measurements • No. of mistakes • Conversion rate • No. of returning customers • Task time MEASURED OPINIONS Surveys • Attitudes • Satisfaction • Estimated time spent • Estimated quality BEHAVIOURS ATTITUDES
- 20. BEHAVIOURS QUANTITATIVE METHODS QUALITATIVE METHODS ATTITUDES Polls Field studies Lab test Moderated usability tests Focus groups In-depth interviews Surveys A/B test Multivariate tests Unmoderated usability tests Eye tracking Funnel analysis Logging Observation Customer service
- 21. SUMMARIZE WITH AIM • One sentence • Summarises the domains and metrics • Describes the value that the solution brings to the business • Could (if you want) be completed with a catchy slogan
- 22. The #impactmap describes metrics for desired outcome
- 23. EXERCISE Metrics
- 24. ENVELOPE #1
- 25. EXERCISE - METRICS ● Find metrics. 10 min. ● Read the aim and the domains ● Think about how to measure success ● Write at least one metric for each domain ● Presentation and discussion Tip: Think about quantitative vs. qualitative methods, subjective vs. objective metrics.
- 26. ENVELOPE #2
- 27. WHY IMPACT ON BUSINESS HOW IMPACT ON USE WHAT SOLUTION AIM or SLOGAN DOMAIN and its METRICS USER and her NEEDS CAPABILITY and its FUNCTIONS SCOPING MEASURING LONG- TERM SUCCESS PRIORITIZING TESTING DESIGN EVALUATING SOLUTIONS and GENERATING SUGGESTIONS GROUND FOR SPECIFICATION
- 28. ”Remember, people do not want to buy a quarter-inch drill. They want a quarter- inch hole” Theodore Levitt
- 30. The Eager
- 31. The Focused
- 32. People do not want a drill. Or a hole. They want their life to be great.
- 33. The Dreamer ”This would look awesome at Liza’s place” The Dreamer spends time thinking about interior decoration and smart solutions for their own home, or even other people’s homes. Collecting smart and beautiful solutions for now or the future, and likes to share their ideas with others. Design Challenge make it super easy to search, collect and share interesting stuff
- 35. PRIORITISE • Will give guidance for the project: – Release plan – Design – Cuttings • Defined by business managers. Based on contribution to desired business impact and: – Number of users – Activity – Impact on others
- 36. NEEDS • A sentence that starts with either – WANTS – close at heart – MUST – resistance • The sentence should give guidance for validating designs e.g ”wants to easily check what she has paid for”
- 37. EXERCISE Users
- 38. ENVELOPE #3
- 39. EXERCISE - USERS ● Name the users. 10 min. ● Read the user descriptions ● What sets them apart from each other? ● Come up with a name for each user that summarizes the description ● Prioritize the users based on their contribution to the Impact goal ● Presentation and discussion Tip: Think about usage patterns, not demographics. E.g. ”The Busy Bee” instead of ”Female, age 37.”
- 40. ENVELOPE #4
- 42. A steering model
- 45. #impactmanagement support teams and leaders in delivering desired outcome
- 47. ENVELOPE #5
- 48. WHY IMPACT ON BUSINESS HOW IMPACT ON USE WHAT SOLUTION AIM or SLOGAN DOMAIN and its METRICS USER and her NEEDS CAPABILITY and its FUNCTIONS SCOPING MEASURING LONG- TERM SUCCESS PRIORITIZING TESTING DESIGN EVALUATING SOLUTIONS and GENERATING SUGGESTIONS GROUND FOR SPECIFICATION
- 49. EXERCISE - EVALUATION ● Pick a design. 10 min. ● Study the impact map ● Study the two different designs ● Based on the impact map, decide which design is best ● Presentation and discussion Tip: Which design can best help create the desired impact? Which design will satisfy the needs of the highest prioritised user?
- 50. READING Download the Impact Map template Google ”Impact Map Tempate inUse” The Birth of Impact Mapping The Evolution of Impact Mapping The Many Faces of Impact Mapping Impact Driven Scrum Delivery