Financial Networks: II. Fundamentals of Network Theory and FNA
•Télécharger en tant que PPTX, PDF•
2 j'aime•1,046 vues

Second lecture of a PhD level course on "Financial Networks" at Center for Financial Research at Goethe University, Frankfurt.

Recommandé
Recommandé
Contenu connexe
Similaire à Financial Networks: II. Fundamentals of Network Theory and FNA
Similaire à Financial Networks: II. Fundamentals of Network Theory and FNA (20)
Plus de Kimmo Soramaki
Plus de Kimmo Soramaki (20)
Dernier
Dernier (20)
Financial Networks: II. Fundamentals of Network Theory and FNA
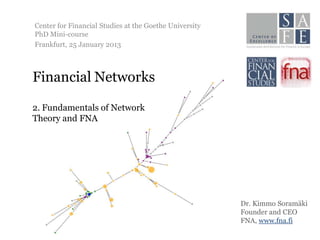
- 1. Center for Financial Studies at the Goethe University PhD Mini-course Frankfurt, 25 January 2013 Financial Networks 2. Fundamentals of Network Theory and FNA Dr. Kimmo Soramäki Founder and CEO FNA, www.fna.fi
- 2. FNA www.fna.fi
- 3. FNA Platform • Go to www.fna.fi • Register account (click login on top right) • Watch ‘Getting started with FNA’ video • More documentation available at www.fna.fi/gettingstarted 3
- 4. FNA Commands • FNA operates on commands that are submitted to FNA server for execution. Commands explore the database, alter it or create visualizations from it • Command syntax: commandname –parameter1 value1 –parameter2 value2 … e.g. loada -file sample-arcs.csv -preserve false (load arcs from sample-arcs.csv file and don’t preserve any existing networks in database) • Each command is on a single line. Character # marks a comment line • Commands can be bundled into scripts and executed in one go 4
- 5. Data Model loada -file sample-arcs.csv -preserve false sample-arcs.csv network,source,target,value 2005-1Q,Australia,Austria,499 2005-1Q,Australia,Belgium,1135 Stores the data into 2005-1Q,Australia,Canada,1884 a graph database ... on FNA Server net_id : 2005-1Q arc_id : Australia-Austria vertex_id : Austria value : 499 … vertex_id : Australia vertex_id : Belgium … vertex_id : Canada 5
- 6. Basic terms • Graph • Network = Graph with properties • Node, Vertex, (Point) • Link, (Line) • Arc = Directed Link • Edge = Undirected Link 6
- 7. Types of Networks 7
- 8. Trivial Graph (1) #G(V,E) = Trivial Graph #V = {1} #E = {empty set} # Add network ‘Trivial' to database. addn -n Trivial -preserve false # Add vertex v1 to network ‘Trivial' . addv -id Trivial -v v1 # Visualize network ‘Trivial'. viz -id Trivial -vlabel vertex_id -vsizedefault 10 -fontsize 25 -saveas TrivialViz -scale 1
- 9. Empty Graph (2) # G(V,E) = Empty Graph # V = {1, 2, 3, 4} # E = {empty set} # Add network ‘Empty' to database. # The -preserve parameter defines whethe to keep # existing networks in memory or to delete them addn -n Empty -preserve false # Add vertices v1 to v4 to network ‘Empty' . addv -id Empty -v v1 addv -id Empty -v v2 addv -id Empty -v v3 addv -id Empty -v v4 # Visualize network ‘Empty' . Add vertex names using -vlabel and change the font size of these labels using -fontsize. Set size of vertices to size 10 using -vsizedefault. viz -id Empty -vlabel vertex_id -vsizedefault 10 -fontsize 25 -saveas EmptyViz
- 10. Simple Undirected Graph (3) # G(V,E) = Simple Graph # V = {1, 2, 3, 4} # E = {(1,2),(1,3),(2,3),(2,4),(3,4)} # Add network ‘Simple' to database. addn -n Simple -preserve false # Add vertices v1 to v4 to network ‘Simple'. addv -id Simple -v v1 addv -id Simple -v v2 addv -id Simple -v v3 addv -id Simple -v v4 # Add arcs to network ‘Simple'. adda -id Simple -a v1-v2 adda -id Simple -a v1-v3 adda -id Simple -a v2-v3 adda -id Simple -a v2-v4 adda -id Simple -a v3-v4 # Visualize network ‘Simple'. viz -id Simple -vlabel vertex_id -awidthdefault 2 -vsizedefault 10 -fontsize 25 -arrows false -saveas SimpleViz
- 11. Complete Graph –K4 (4) # Add network 'netk4' to database. complete -nv 4 -directed false -preserve false # Visualize network netk4. viz -vlabel vertex_id -awidthdefault 2 -vsizedefault 10 -fontsize 25 -arrows false -saveas complete_k4 Notes If no -saveas parameter is given, created networks are autonamed Without -id paremeter in the viz - command all networks in memry are visualized
- 12. Complete Graph –K7 (5) # Add network 'netk7' to database. complete -nv 7 -directed false -saveas netk7 -preserve false # Visualize network netk7. viz -vlabel vertex_id -awidthdefault 2 -vsizedefault 10 -fontsize 25 -arrows false -saveas complete_k7
- 13. Directed Graph, Digraph (6) # Create a Petersen Graph # '-direction any' allows creation of arcs in any direction between two vertices petersen -direction any -seed 111 -saveas Digraph -preserve false # Visualize the network. Setting the parameter -arrows true gives a directed network. viz -id Digraph -awidthdefault 2 -vsizedefault 10 -fontsize 25 -vlabel vertex_id -arrows true -saveas Digraph
- 14. Directed Weighted Graph (7) # A directed and weighed Petersen graph. # Create a Petersen Graph # '-direction both' creates arcs in both direction petersen -direction both -seed 111 -saveas WeightedDigraph -preserve false # Set random arc property calcap -e [?random:uniform:1,10?] -saveas value # Visualize the network # Setting the parameter '-arrows true' shows direction of arcs viz -id WeightedDigraph -alabel value -awidthdefault 3 -vsizedefault 10 - fontsize 25 -vlabel vertex_id -arrows true -saveas Digraph # Visualize arc values as arc width viz -id WeightedDigraph -awidth value -awidthdefault 3 -vsizedefault 10 - fontsize 25 -vlabel vertex_id -arrows true -saveas Digraph
- 15. Example application areas Cross-border banking exposures Interbank payment flows 15
- 16. Bipartite Graph (8) #G(V,E) = Bipartite Graph # Vl = {1, 2, 3, 4, 5, 6, 7, 8} # Vr = {9, 10, 11, 12, 13, 14, 15, 16} # E = {randomly generated set}
- 17. Bipartite Graph # Create a bipartite graph with 8 vertices in left group (-nl) and 8 vertices in right group (-nr) and 12 randomly assigned arcs (-na) that will go in both directions. bipartite -nl 8 -nr 8 -na 12 -direction any -partition true -seed 123 -saveas bipartite -preserve false # Separate the two sets of vertices, ready for visualization. bipartitelayout -partition partition # Visualize the bipartite network. viz -vsizedefault 10 -vlabel vertex_id -awidthdefault 2 -fontsize 25 -saveas Bipartite Notes Adding the parameter -seed to the bipartite command will generate a specific graph. So for example using -seed 111 will always assign the arcs in the same way, to generate the same graph. Without the -seed parameter the the random generator is initialized from system time.
- 18. Example application areas Banks Countries Insurers Risk Drivers 18
- 19. Tree (9) # A tree is a graph with no cycles # Create a tree with 6 vertices tree -nv 10 -seed 111 -saveas Tree #Visualize the tree viz -id Tree -vlabel vertex_id -vsizedefault 5 -awidthdefault 3 Notes A forest is a disjoint union of trees
- 20. Minimum Spanning Tree (10) #G(V,E) = MST, #V = {1, 2, 3, 4, 5, 6, 7} #E = {(1,2),(1,4),(3,2),(3,4),(4,6),(4,7),(5,3),(5,4),(6,5),(6,7),(7,6)}
- 21. Minimum Spanning Tree # Create random network with 10 vertices and 30 arcs random -nv 5 -na 10 -seed 123 -preserve false # Calculate random arc property between 1 and 10 calcap -e [?random:uniform:1,10:111?] -saveas value # Visualize original network viz -vlabel vertex_id -awidthdefault 2 -saveas Random # Identify minimun spanning tree for 'value' property minst -p value # Highlight Minimum Spannign Tree in 'Random' network viz -acolor minst -alabel value -awidthdefault 2 -saveas RandomWithMST # Drop arcs not in Minimum Spannin tree dropa -e minst=false # Visualize Minimum Spanning Tree viz -vlabel vertex_id -awidthdefault 2 -alabel value -saveas MST
- 22. MST: Application Rosario Mantegna (1999). Hierarchical Structure in Financial Markets. Eur. Phys. J. B 11, 193-197. 22
- 23. Connectivity 23
- 24. Degree Degree (11) # Add network 'degree' to database petersen -direction any -seed 111 -saveas Path -preserve false # Calculate degree, in-degree and out-degree In-Degree degree -saveas degree degree -direction in -saveas in-degree degree -direction out -saveas out-degree # Visualize network degree. The vertices are labelled using their degree. viz -vlabel degree -vsizedefault 10 -vcolordefault orange - fontsize 25 -awidthdefault 3 -saveas Degree viz -vlabel in-degree -vsizedefault 10 -vcolordefault orange - Out-Degree fontsize 25 -awidthdefault 3 -saveas In-Degree viz -vlabel out-degree -vsizedefault 10 -vcolordefault orange - fontsize 25 -awidthdefault 3 -saveas Out-Degree
- 25. Degree Distribution The topology of interbank payment flows. Soramäki et al. Physica A: Statistical Mechanics and its Applications 379 (1), 317-333 25
- 26. Degree Correlations • Calculate – Neighbor degree/out-degree/in-degree (and) – Successor degree/out-degree/in-degree (asd) – Predecessor degree/out-degree/in-degree (apd) • Correlate to degree/out-degree/in-degree of each node: – zero for uncorrelated networks – positive for assortative networks and – negative fordisasortative networks • In assortative networks nodes with a given degree are more likely to have links with nodes of similar degree. Disassortative if the opposite is true. 26
- 27. Example: US Banks 27
- 28. Paths, Trails, Walks (12) # Create a Petersen Graph # -seed 111 allows the same standard layout to be produced each time. petersen -direction any -seed 111 -saveas Path -preserve false # Calculate the path from vertex 5 to vertex 8 distance -from 00005 -to 00008 -p value -savepath true # Visualize the network. The arc colors highlight the path viz -acolor path(00005,00008) -awidthdefault 2 -vsizedefault 10 - fontsize 25 -vlabel vertex_id -saveas Path Notes A Walk is any free movement along the arcs A Trail is a walk where a given arc is visited only once A Path is a walk where a given vertex is visited only once A Geadesic Path is the Shortest Path A Cycle is a path starting and ending to the same vertex
- 29. Other connectivity measures • Size: Number of arcs • Order: Number of vertices • Connectivity: order/(size*(size-1)) • Ego distance: distance to/from given vertex from/to other vertices • Eccentricity: Maximum distance from/to a vertex • Diameter: Maximum eccentricity • Clustering coefficient: Share of neighbours with links 29
- 30. Weighted Shortest Path (13) # Create a Petersen Graph # -seed 111 allows the same standard layout to be produced each time. petersen -direction any -seed 111 -saveas Path -preserve false #Assign random values to arcs. calcap -e[?random:uniform:1,10:104?] -saveas value # Calculate the path from vertex 5 to vertex 8 distance -from 00005 -to 00008 -p value -savepath true # Visualize the network. The arc colors highlight the path viz -acolor path(00005,00008) -alabel value -awidthdefault 2 - vsizedefault 10 -fontsize 25 -vhover vertex_id -saveas WeightedPath4 30
- 31. Components GWCC : Giant Weakly Connected Component GIN : Giant In-Component GSSC : Giant Strongly Connected Component Dorogovtsev S.N., J.F.F. Mendes, and A.N. Samukhin GOUT : Giant Out-Component (2001). “Giant strongly connected component of directed networks”, Phys. Rev. E 64.
- 32. Weakly Connected Graph (14) # Create random network random -nv 30 -na 40 -seed 100 -preserve false # Identify SC wc # Color vertices in SC as red setvp -p color -value black setvp -e wc=0 -p color -value red # Create visualization viz -vcolor color -vsizedefault 5 -saveas WCViZ
- 33. Strongly Connected Graph (15) # Create random network random -nv 30 -na 60 -seed 100 -preserve false # Identify SC sc # Color vertices in SC as red setvp -p color -value black setvp -e sc=0 -p color -value red # Color arcs within nodes in SC as red calcap -e source.sc=0 -saveas srcsc calcap -e target.sc=0 -saveas tgtsc calcap -e "srcsc AND tgtsc" -saveas scarc setap -p color -value black setap -p color -e scarc=true -value red # Create visualization viz -vcolor color -acolor color -vsizedefault 8 -awidthdefault 2 -saveas SCViZ
- 34. Blog, Library and Demos at www.fna.fi Dr. Kimmo Soramäki kimmo@soramaki.net Twitter: soramaki