Investment Research
•
1 j'aime•568 vues

The document analyzes Corinthian Colleges Inc (COCO), a for-profit education company. It finds that: 1) COCO has experienced strong recent growth in profits, enrollment, and margins due to the countercyclical nature of its industry during the economic recession. 2) However, this growth trajectory is unsustainable as economic conditions improve. Enrollment growth is expected to slow by half towards the long-term average. 3) Margins are also expected to decline from recent highs as marketing expenditures and bad debt expenses increase from current low levels, posing risks to COCO's stock price target of $14.01.

Recommandé
Contenu connexe
Similaire à Investment Research
Similaire à Investment Research (20)
Investment Research
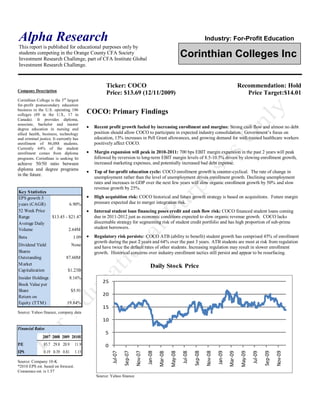
- 1. Alpha Research Industry: For-Profit Education This report is published for educational purposes only by students competing in the Orange County CFA Society Investment Research Challenge, part of CFA Institute Global Corinthian Colleges Inc Investment Research Challenge. Ticker: COCO Recommendation: Hold Company Description Price: $13.69 (12/11/2009) Price Target:$14.01 Corinthian College is the 3 rd largest for-profit postsecondary education business in the U.S. operating 106 colleges (89 in the U.S., 17 in COCO: Primary Findings Canada). It provides diploma, associate, bachelor and master degree education in nursing and Recent profit growth fueled by increasing enrollment and margins: Strong cash flow and almost no debt allied health, business, technology position should allow COCO to participate in expected industry consolidation. Government’s focus on and criminal justice. It currently has education, 13% increases in Pell Grant allowances, and growing demand for well-trained healthcare workers enrollment of 86,088 students. positively affect COCO. Currently 64% of the student enrollment comes from diploma Margin expansion will peak in 2010-2011: 700 bps EBIT margin expansion in the past 2 years will peak programs. Corinthian is seeking to followed by reversion to long-term EBIT margin levels of 8.5-10.5% driven by slowing enrollment growth, achieve 50/50 ratio between increased marketing expenses, and potentially increased bad debt expense. diploma and degree programs Top of for-profit education cycle: COCO enrollment growth is counter-cyclical. The rate of change in in the future. unemployment rather than the level of unemployment drives enrollment growth. Declining unemployment rates and increases in GDP over the next few years will slow organic enrollment growth by 50% and slow revenue growth by 25%. Key S tatistics EPS growth 5 High acquisition risk: COCO historical and future growth strategy is based on acquisitions. Future margin years (CAGR) 6.90% pressure expected due to merger integration risk. 52 Week Price Internal student loan financing poses credit and cash flow risk: COCO financed student loans coming Range $13.45 - $21.47 due in 2011-2012 just as economic conditions expected to slow organic revenue growth. COCO lacks Average Daily discernable strategy for segmenting risk of student credit portfolio and has high proportion of sub-prime Volume 2.64M student borrowers. Beta 1.09 Regulatory risk persists: COCO ATB (ability to benefit) student growth has comprised 45% of enrollment growth during the past 2 years and 64% over the past 3 years. ATB students are most at risk from regulation Dividend Yield None and have twice the default rates of other students. Increasing regulation may result in slower enrollment Shares growth. Historical concerns over industry enrollment tactics still persist and appear to be resurfacing. Outstanding 87.60M M arket Daily Stock Price Capitalization $1.23B Insider Holdings 8.16% 25 Book Value per Share $5.91 Return on 20 Equity (TTM ) 19.84% 15 Source: Yahoo finance, company data 10 Financial Ratios 5 2007 2008 2009 2010E P/E 85.7 29.8 20.9 11.9 0 EPS 0.19 0.39 0.81 1.15 Nov-07 Nov-08 Nov-09 Jan-08 Jan-09 Sep-08 Sep-09 Sep-07 May-08 May-09 Jul-08 Jul-09 Jul-07 Mar-08 Mar-09 Source: Company 10-K *2010 EPS est. based on forecast. Consensus est. is 1.57 Source: Yahoo finance
- 2. 2 Enrollment growth is counter-cyclical COCO Investment Summary Starting in 2004, COCO embarked upon a turnaround effort to improve operations. The restructuring of COCO combined with the counter-cyclical nature of the for-profit education industry, resulted in strong revenue growth during the recession over the past two years. From 2007-2009, revenue grew at 19.2% CAGR, while EBIT margins increased by 670 bps from 2.4% to 9.1%. Increasing demand for education, tuition increases, government stimulus spending on education, and depressed advertising rates have supported operating gains. An important point for investors to remember is that the for-profit education industry is counter-cyclical. It tends to perform well when the total economy performs poorly. This is demonstrated by college enrollment rates at all time highs across the country with 41% of 18- 24 yr olds enrolled in some form of college program. While we do not expect the economic recovery to be immediate or overly robust, there is risk that as the economy recovers Source: Company 10-K, enrollment growth may decrease from recent highs. US Bureau of Economic Analysis Concerns over revenue recognition policies, enrollment practices, and a stricter regulatory environment hurt the industry and stock prices in 2004. COCO’s stock fell 36% for the year Counter-cyclical business: current growth after being down as much as 64%. We are concerned that the same issues are resurfacing. In trajectory unsustainable. Expect growth addition, the sub-prime student loans market has decreased and has forced COCO to institute rates to revert 50% towards long-term avg. vendor financing with the associated balance sheet and cash flow risks. This is especially pertinent as COCO typically enrolls higher portion of students with subprime credit. These risks combined, with a future revenue growth strategy based on acquisition and what we see as aggressive long-term margin targets of 15% by COCO lead us to be cautious on the outlook for the company. We believe that there is more downside than upside potential likely in the shares which supports our hold recommendation until regulation concerns recede and until we see evidence of successful acquisition integration. We believe the current price level is appropriate given the known risks. Because the stock is trading near our DCF forecasted price and our assumptions are below consensus, we feel our price target is discounting appropriate risks. COCO Valuation Methods and Assumptions Two approaches to value COCO: Discounted Cash Flow, EV/EBITDA. EV/EBITDA DCF Valuation Range $13.84 $14.01 $13.03 - $15.20 Indus try Mul ti pl e 7.98x DCF As s umpti ons Ri s k-Free Rate=3.4% 5-yr revenue (cagr%) = 11% Beta=1.07 5-yr EBIT Margi n (avg%)=9.4% Market Ri s k Premi um = 7% Termi nal Growth Rate=3% WACC = 10.8% ____________________________________________________________________ Source: Risk free rate and Beta from Bloomberg Valuation Range between $13.03 and $15.20: Sensitivity analysis is based on discount rate and terminal growth rate. Discount Rate $14.01 9.8% 10.1% 10.3% 10.6% 10.8% 11.1% 11.3% 11.6% 11.8% 1.0% 13.32 12.96 12.61 12.29 11.98 11.68 11.40 11.14 10.88 Long-Term Growth Rate 1.5% 13.87 13.47 13.10 12.74 12.40 12.08 11.78 11.49 11.22 2.0% 14.49 14.05 13.64 13.25 12.88 12.53 12.20 11.89 11.59 2.5% 15.20 14.71 14.25 13.82 13.41 13.03 12.67 12.32 12.00 3.0% 16.01 15.46 14.95 14.46 14.01 13.59 13.19 12.81 12.46 3.5% 16.95 16.33 15.74 15.20 14.69 14.22 13.78 13.36 12.97 4.0% 18.06 17.33 16.67 16.05 15.48 14.94 14.45 13.98 13.55 4.5% 19.37 18.52 17.75 17.04 16.38 15.78 15.22 14.70 14.21 5.0% 20.95 19.95 19.04 18.21 17.45 16.75 16.11 15.51 14.96
- 3. 3 Revenue: Organic growth rate slowing by half Enrollment growth lags Revenue Drivers: Student enrollment and tuition increases drive revenue. Historically, COCO has driven revenue growth through acquisitions and will continue to do so. unemployment rate of change Organic enrollment growth for COCO and for-profit education is counter-cyclical. From 12-18 months 2004-2007 COCO experienced declining student enrollment growth. Due to economic weakness, student enrollment growth increased 11.4% in 2008 and the average student population increased 15.1% in 2009. Enrollment growth coupled with a 4-6% average tuition increase led to revenue growth of 16.3% and 22.4% in 2008-2009. Due to the counter-cyclical nature of for-profit education and unemployment typically lagging GDP by 9-12 months, COCO should sustain above-average student population growth for 2010 and first half of 2011 before reverting to longer-term levels in 2012-2014 Revenue Analysis: Management stated that 50% of student population growth in 2008-2009 can be attributed directly to the recession, which would place non-recession growth rates at Source: Company 10-K, US Bureau of Economic Analysis 10-13%, and that long-term growth rate is 8%. Ability To Benefit (ATB) students have increased to 23-25% of new student enrollments in 2009 from 10% in 2006. (Further detail in risks section) Increased regulatory scrutiny of this specific ATB student population means this particular growth driver is not sustainable, which was confirmed by the company. If we assume that sustainable enrollment growth rate was 13% without the ATB segment and 50% of overall demand was due to recession, and then long-term organic enrollment growth rate of Future unemployment COCO is more likely to be at 6.5%. Combined with annual tuition increases averaging 5.5%, this translates into a revenue CAGR% of 9.7% from 2010-2014. decrease + timing lag effect = slowing organic revenue Overall estimated revenue increases while revenue growth rate expected to slow growth Source: Company 10-K, forecast Margin Drivers: marketing expenditures and bad debt assumptions drive margins. Historically, COCO has had gross margins of 42.6% and operating margins (EBIT) of 5.7%. During 2007-2009, COCO increased EBIT margins from 2.4% to 4.2% to 9.1%. The Company expects continued margin expansion to 12-13% for 2010 and 15% in 2011 and believes that it can sustain long-term margins in the mid to high teens. We believe that these margin targets are aggressive and overly biased by assumptions of continued depressed advertising rates, decreasing bad debt expenses as well as increased economies of scale from future acquisitions. We expect that the Company will be able to expand margins to 10.2 %( +110 bps) through 2011 and average 9.4% long-term versus company projections of 15 %( +600 bps) through 2011 and high teens long-term. We acknowledge that COCO has improved operational performance, but feel this was accomplished during a period of high industry growth that will become harder to sustain in alternative economic environments. During the recent recession, advertising rates have compressed approximately 25% and the Company’s 15% margin target assumes that there is no rebound in advertising rates. Bad Debt: COCO classifies “educational expenses” as part of cost of goods sold. Bad debt Bad debt expense increasing, expense drives educational expense and thus gross margin, which is affected by student credit marketing expenditures likely profiles as well as job placement rates. Educational expenses also include some traditional to increase COGS to deliver and administer educational programs as well as depreciation and amortization that should fluctuate normally with revenue. Historically, bad debt expense has
- 4. 4 Historical Bad Debt Expense ranged from 5-9% of revenue. Industry analysts watch this number carefully as it affects volatility of earnings quarter-over-quarter. We assumed a constant percentage in the middle of (% of revenue) the range at 8%, but believe the increasing portion of higher credit risk ATB student growth could further the recent bad debt trend upward. Since vendor financing has replaced the government financing agency Sallie Mae in 2008, COCO now is required to buy back the loans. Placement rates are likely to increase going forward from depressed levels which would be positive. However, the Company stated that they do not have visibility on bad debt figures until the last few weeks of each quarter and cannot segment their credit portfolio. COCO’s student population contains higher percentage of subprime loan borrowers. Undisclosed lending standards used to attract ATB students, combined with lack of credit-risk segmentation capability increase the probability of bad debt expense surprises in 2010-2012 even as placement rates increase. Sensitivity analysis of bad debt % of revenue at various discount rates Source: Company 10-K Discount Rate $14.01 9.8% 10.1% 10.3% 10.6% 10.8% 11.1% 11.3% 11.6% 11.8% Bad Debt % of revenue 5.0% 21.93 21.15 20.43 19.76 19.13 18.53 17.98 17.45 16.95 A 3% increase in bad debt 6.0% 19.96 19.26 18.60 17.99 17.42 16.88 16.38 15.90 15.46 expense = 24% downside 7.0% 17.98 17.36 16.77 16.23 15.72 15.24 14.78 14.36 13.96 8.0% 16.01 15.46 14.95 14.46 14.01 13.59 13.19 12.81 12.46 for COCO’s stock price 9.0% 14.04 13.56 13.12 12.70 12.31 11.94 11.59 11.27 10.96 10.0% 12.07 11.67 11.29 10.93 10.60 10.29 10.00 9.72 9.46 11.0% 10.10 9.77 9.46 9.17 8.90 8.64 8.40 8.17 7.96 12.0% 8.13 7.87 7.63 7.40 7.19 6.99 6.81 6.63 6.46 Marketing Expenses: Marketing expenses are the main driver of SG&A expenses. Since 2006, marketing expense has averaged 25.5% of revenue decreasing to 22% FY09. COCO projections for marketing expenses assume that advertising expenses over the long term remain at the depressed recessionary rates (-20%) of historical rates. We believe this is overly aggressive. We estimate marketing/revenue will gradually increase back towards historical percentages by 2014. According to the company they do not expect to change marketing mix or increase response rates. Business Description COCO has provided for-profit post-secondary education since its founding in 1995. It grew rd rapidly in terms of revenue and student base after going public in 1999 and today operates 106 3 largest For-Profit colleges (89 in the U.S. and 17 in Canada) serving approximately 79,622 students at the end of player. Strategy of growth 2009. COCO has historically relied heavily acquisitions for growth (1999-2003). 74 of by acquisitions COCO’s 106 campuses were obtained through acquisition. COCO offers diploma and degree programs in four concentrations: nursing and allied health, business, technology and criminal justice. Throughout the program, COCO provides career placement assistance to their graduates. Source: Company 10-K Source: Company 10-K Currently, 64% of the student enrollment comes from diploma, 31% from associate degree, 4% from bachelor’s degree and 1% from master’s degrees. According to the company, degree program offers higher margin than diploma program. While the fixed expenses, such as marketing, administration and operations, of different programs do not vary much from
- 5. 5 program to program, degree programs generate more revenue due to longer enrollment periods. As of 2009, 64% of COCO’s revenue comes from diploma programs, and management aims to increase the share of degree programs in the future. COCO attracts students through mass media outlets such as television and the internet as well as through direct recruitment at high school campuses. COCO provides students with many support services to help them succeed in the program and beyond. A primary source of income for COCO comes from student’s Title IV loans. COCO provides assistance with applying for and administering government and private loans to fund the student’s educational program. In the U.S. COCO students receive government Title IV loans for approximately 80% of their educational costs. COCO operates both on-ground (traditional class room) campuses and online campuses. Most Management aims to COCO students attend classes in the traditional on-ground locations but some supplement their expand online and on-ground curriculum with online classes. Some students attend online classes exclusively. COCO offers online courses and programs for students for the sake of convenience and to degree programs address increasing demand for flexibility. According to the company, online courses haven’t yet resulted in significant savings because COCO currently lacks significant economies of scale online. COCO is considering ways to increase online exposure. However, the possible savings from heavier weight on online operations remain uncertain. Industry Overview and Competitive Positioning Corinthian Colleges is the 3rd largest (by students) for-profit private post-secondary education business in the U.S. This is a highly fragmented industry with the top company Apollo (APOL) taking 22.9% market share and runner up CECO accounting for 5.8% share. Overall industrygrowth but COCO’s growth relies on acquisitions. Current management has little experience with acquisitions: From 1997 to 2007, student enrollment in the for-profit post-secondary education experienced 14% CAGR. For-profit education share of the total student education population increased from 2% in 1997 to 9% in 2007. We estimate for-profit share to increase to 13.9% by 2014. The recent increases in the rate of unemployment and in the historical high number of high school graduates have contributed to strong demand in this industry. However, COCO market share has not been growing since 2004 when it abandoned its growth strategy by acquisition and changed the management team. Recently announced Heald acquisition will add to student enrollment by about 12,300 or 14%. It is uncertain whether COCO will be able to deliver higher than average growth rate through 2014 due to acquisitions. (NCES, company 10-k’s, team forecasts) Source: Companies 10-K’s
- 6. 6 Forecast of COCO’s market share growth of For-Profit market Forecast of COCO Share of For-Profit Market 13.20% 13.90% 11.80% 12.50% 10.40% 11.10% 4.45% 4.87% 5.13% 5.36% 5.33% 5.21% 2009 2010 2011 2012 2013 COCO enrollment to For-profit Enrollment 2014 For Profit Enrollment to Total Education Enrollment Source: NCES (National Center for Educational Statistics), 10-k Pricing: Tuitions in different schools vary significantly depending on the kind of programs Relatively high flexibility the institution or company offers. Certain programs can charge much higher tuition than in pricing helped others. COCO has been increasing revenue per student by 5% annually since 2005. We expect COCO to maintain this pricing power in the future. increase revenue in recent years Government funding: Revenue for this industry relies heavily on local and state government funding in education. As a silver lining, government is unlikely to limit the supply of Title IV loans and private loans in the near future. Risk remains that if congress tightens the requirement for Title IV loans, revenue will decrease dramatically. This risk is common among all major players in the industry. Thus we do not see it a particular threat for COCO. Cost Structure: Almost half of the cost of running an education business is associated with labor. Labor costs include wages for faculty, management, supporting staff, and other staff that keep a college campus up and running. We expect the wage component to stay stable or decrease slightly as companies increase the Due to labor intensive student to faculty ratio. We also expect labor costs to decrease as more and more technology is structure, significant cost used to supplement staff or increase the staff to student ratio such as through online education models. There is likely to be a shortage in teaching staff in STEM (science, technology, reduction is hard to engineering, and math) and Nursing fields. These trends cancel out each other and put deliver COCO’s leverage on labor cost back to medium level. Even though COCO could expand by acquisition strategy, it’s hard to achieve pricing power above industry averages in this highly fragmented market. Taking all the factors above in to account, we do not expect significant sustainable improvements in COCO’s EBITDA margin at 13% to 15%. Competition level in traditional (ground) school is low. COCO has room to grow. The market is highly fragmented. Each college serves its local area. Students who attend these colleges tend to be local and commute to school from their homes. Students pick the schools based on price, reputation, courses offered and placement. Some students choose these colleges because of the flexibility of for-profit private education. For-profit private education firms typically provide rolling admissions and programs of studies whereas research universities’ admissions are typically conducted once or twice a year (spring and fall). COCO stock price is subject to “headline event risk” from lawsuits. The industry is highly regulated. Lawsuits filed by government agencies, students or former employees are common among the players in the industry, There are 8 active lawsuits filed against the company between 2004 and 2008. There may be adverse material impact on the company’s future cash flow should COCO pay damages, fines or be limited on the ability to open new schools.
- 7. 7 Financial Analysis COCO has enjoyed overall revenue growth during the past few years; however, the revenue growth is inconsistent. Similar to the trend of revenue, student enrollment has been increasing constantly, with its growth rate fluctuating. This consistent feature can be attributed to the counter-cyclical business nature of COCO, which poses a big question mark to the sustainable growth of the firm in the future. Revenue Growth 2005-2009 Historical enrollment and growth rate Source: Company 10-K Source: Company 10-K Earnings For the past five years, COCO’s average ratio of Net Income to CFO (a key indicator of earnings quality) was at 45%, which is far below the benchmark of 1. This shows that earnings quality is less impressive, despite the company’s overall growth. Part of the underlying reason is related to the industry-wide fact that revenue largely comes from student loans, which incur big accrual accounts and results in the difference between Net Income and CFO. However, we can not underestimate the effects of possible earnings fluctuation in this industry, since companies have huge flexibility regarding revenue recognition and bad debt expense booking. ROA vs. ROE Earnings Quality Analysis 2005-2009 Source: Company documents, student estimates Source: Company 10-K Cash Flow
- 8. 8 Historically, COCO’s cash flow was mostly generated from operating activities, implying healthy growth pattern of the firm. However, CFO fails to demonstrate a smooth upward trend, largely due to huge swing in accrual accounts such as accounts payable, prepaid tuition and student notes receivable. This could be a negative sign concerning the firm’s revenue recognition policy and bad debt risk. As for CFI, COCO continued to spend cash on investing activities, primarily on capital expenditures, showing the aggressive expansion strategy of the firm. There were ups and downs in CFF, mainly due to frequent debt financing activities from debt retirement to credit line renewal. Source: Company 10-K Balance Sheet & Financing COCO’s total assets size has grown slightly for the past few years; at the same time, its leverage ratio keeps quite constant, with the average debt to equity ratio of 0.69. A closer look at COCO’s liabilities shows that the company doesn’t have large amount of debt, which is a good indication of a healthy financial structure. Limited reliance on debt offers COCO more flexibility in financing, as well as a lower cost of capital to expand in the future. 2005 2006 2007 2008 2009 Debt to Equity 0.64 0.68 0.91 0.65 0.54 Average 0.69 Source: Company 10-K
- 9. 9 Investment Risks Vender Financing In 2008, a primary lender to COCO students, Sallie Mae stopped providing loans to high risk students. To continue to serve those students for the remaining 20% of educational expenses, COCO formed a relationship with Genesis, a private lending organization. Full exposure to default risk With Genesis, COCO is obligated to immediately purchase the loans back from the lender. While COCO benefits from all the loan payments and interest for the loans, they also incur the default risk associated with these loans. These loan amounts were $10mm in 2008, $120mm in 2009, and estimated to be $130mm in 2010. Once students have completed their educational program, they are expected to start paying off their loans 6 months after graduation. Heald Merger In October, Corinthian signed an agreement to acquire Heald Capital LLC, the parent company of Heald College. Heald is a regionally accredited institution that has been providing career-focused academic programs to students since 1863. Heald prepares students for careers in healthcare, business, legal, information technology and other growing fields, primarily through associate degree programs. Heald is headquartered in San Francisco, California, operates 11 campuses throughout California and had approximately 12,300 students on September 30, 2009. The acquisition is expected to be slightly accretive to earnings in the second-half of 2010. Expected to leverage Corinthian is seeking to achieve a 50/50 ratio between diploma program and degree programs. Heald’s online platform Heald will support the degree education part of Corinthian’s program. This move may help to and regional bring up the profit margins, since degree program lasts longer and generates more revenue but cost about the same as other programs. Heald also brings a well-established online learning accreditation platform to Corinthian, helping the school to focus more on online education programs, a stated goal of the firm. COCO takes risk of purchasing potential takeover targets with high growth expectations at the top of the recent for-profit education cyclical performance. COCO also encounters risks through issues related integration while growing through acquisition. Regulation Government regulations both in the U.S. and in Canada have a significant impact on COCO’s operations and require extensive management attention. These regulations dictate the maximum percent of income from Title IV loans allowed, the maximum allowed loan default rate, and minimum placement rates for graduates. Failure to comply with these regulations can result in offending campuses losing accreditation and students at those campuses becoming ineligible to receive Title IV loans. This could significantly impact COCO’s revenue and margins. 90/10 rule: Within the revenue that the school receives, federal student loans cannot exceed certain percentage (90% currently), or the school will be imposed with sanctions. Regulatory risks persist Cohort default rate: default rate by students on federally guaranteed loans needs to be maintained below a specific rate (25% currently), or the school will be imposed with sanctions. Placement rates must be 65% or greater for institutions to qualify for Title IV funding. In order for students to qualify for Title IV loans, COCO’s individual campuses must remain in good standing with their respective accrediting organizations. There are a number of ways that an individual campus can be put at risk. If an individual campus has a loan default rate at or above 25% for 3 consecutive years, the campus will lose its accreditation and students will no longer be able to receive Title IV loans. The government has limitations on the amount of income which can come from Title IV loans. If COCO receives more than 90% of their income from Title IV loans, COCO’s accreditation will be at risk. Finally, the government
- 10. 10 requires that COCO maintain placement rates for graduates at 65%. If COCO does not maintain placement rates of 65%, their accreditation will be at risk. Ability to Benefit The entire for-profit education sector and COCO has been the target of increasing public scrutiny. In particular, ATB student enrollment is the focus of current government’s inquiries. ATB students are non-high school graduates that must pass entrance exams approved by the U.S. Education Department. ATB students cannot make up more than 50% of total enrollment at individual schools. Over the past four years, 64% of the new enrollment has come from the segment. There is concern that ATB enrollment policies have been lax and even speculation of enrollment fraud related to ATB students. If tighter regulation is imposed on the ATB segment, COCO’s future growth rate could be lower than expected. ATB segment: recent growth engine with higher default risk is not sustainable Source: Company 10-K Allegations of inappropriate student performance measurements in the ATB segment have been an ongoing problem. There have also been a number of legal cases brought against COCO alleging that COCO has falsely represented their accreditation or their performance numbers. Reputation is very important to COCO’s brand so these types of public suits could potentially damage COCO’s reputation and its brand. The growth in enrollment has been strongest among high credit risk students. This has two possible negative effects for COCO; first, these students will provide less cash flow due to defaults. Second, these students raise the total default rates for COCO which could put COCO at risk of violating default regulations and result in COCO losing access to Title IV loans. Executive Compensation There is a mismatch between COCO's executive compensation and common shareholders' cumulative total return in the past five years. During the period, the top executive had an Principal-agency problem average 95% annual increase in total compensation while the share holders experienced -32% compromises returns. management’s ability to Current management stock ownership is insignificant as each executive owns less than 1% and execute the business plan all directors and executive officers as a group owns 3.9% shares. The top managements’ profiles do not show significant experiences in the for-profit post-secondary education field. These problems could put a downward pressure on COCO’s stock price.
- 11. 11 Corporate Governance Ratings Overall, board's profile demonstrated sufficient business background and the ability to serve shareholders' interests. Governance Factors Positive Neutral Negative Board’s independence x Board and its members possess adequate experience x Adequate board committees x A classified board x Executive compensation showed excessive growth x Figure 1: Income Statement In millions Income S tatement Years Ended June 30, 2006 2007 2008 2009 2010 2011 2012 2013 2014 Revenue: $907,815 $919,224 $1,068,671 $1,307,825 $1,628,111 $1,940,953 $2,293,430 $2,564,743 $2,814,036 Operating Expenses: Educational services* 507,832 528,125 625,481 753,707 935,705 1,115,501 1,318,076 1,474,005 1,617,278 General and administrative 92,677 110,654 114,938 135,747 162,811 194,095 229,343 256,474 281,404 M arketing and admissions 240,373 248,447 276,875 294,728 358,184 427,010 527,489 589,891 675,369 Impairment, facility closing and severance charges 4,170 9,693 6,603 4,378 4,393 6,497 7,677 8,586 9,420 Total operating expenses 845,052 896,919 1,023,897 1,188,560 1,461,094 1,743,104 2,082,586 2,328,955 2,583,470 Income from Operations (EBIT) 62,763 22,305 44,774 119,265 167,018 197,849 210,844 235,787 230,566 Interest income (5,772) (6,244) (3,376) (1,763) (3,936) (3,759) (5,760) (5,985) (5,916) Interest expense+ 3,162 2,811 1,793 2,715 1,202 1,202 1,202 1,202 1,202 Other expense (income), net (1,137) (1,039) (1,387) 1,170 1,457 1,736 2,052 2,294 2,517 Income from operations before income taxes 66,510 26,777 47,744 117,143 168,296 198,670 213,351 238,276 232,762 Provision for income taxes 24,025 9,950 14,879 46,015 67,318 79,468 85,340 95,310 93,105 Income from continuing operations 42,485 16,827 32,865 71,128 100,977 119,202 128,011 142,966 139,657 Loss from discontinued operations (1,003) (9,595) (11,598) (2,368) (9,853) (11,746) (13,879) (15,521) (17,029) Net Income $41,482 $7,232 $21,267 $68,760 $91,125 $107,456 $114,132 $127,445 $122,628 Income per share basic: Income from continuing operations $0.48 $0.20 $0.39 $0.83 $1.17 $1.34 $1.44 $1.61 $1.58 Loss from discontinued operations ($0.01) ($0.11) ($0.14) ($0.03) ($0.11) ($0.14) ($0.16) ($0.18) ($0.20) Net income $0.47 $0.08 $0.25 $0.80 $1.06 $1.25 $1.33 $1.48 $1.42 Income per share diluted: Income from continuing operations $0.47 $0.19 $0.38 $0.81 $1.15 $1.36 $1.46 $1.63 $1.60 Loss from discontinued operations ($0.01) ($0.11) ($0.13) ($0.03) ($0.11) ($0.13) ($0.16) ($0.18) ($0.19) Net income $0.46 $0.08 $0.25 $0.79 $1.04 $1.23 $1.30 $1.46 $1.40 Weighted average number of common shares outstanding: Basic 88,627 85,887 84,954 86,121 86,121 86,121 86,121 86,121 86,121 Diluted 89,973 87,097 86,013 87,517 87,517 87,517 87,517 87,517 87,517 Source: Company Documents, Student Estimates
- 12. 12 Figure 2: Balance Sheet In millions Balance S heet As of June 30, 2006 2007 2008 2009 2010 2011 2012 2013 2014 Assets Current Assets: Cash and cash equivalents $36,795 $99,789 $32,004 $160,276 $131,217 $125,297 $192,008 $199,500 $197,211 Restricted Cash 10 0 0 0 0 0 0 0 0 M arketable securities 55,900 15,000 0 0 0 0 0 0 0 Accounts receivable, net of allowance+ 53,530 68,382 115,085 65,976 171,265 111,562 222,627 151,096 258,953 Student notes receivable, net of allowance- 2,463 3,785 4,478 11,532 14,356 17,115 20,223 22,615 24,813 Deferred income taxes 20,943 25,756 29,156 32,369 47,355 55,901 60,032 67,046 65,494 Prepaid expenses and other current assets 42,771 44,366 32,729 37,946 47,239 56,316 66,543 74,415 81,648 Assets held for sale from discontinued operations 2,590 18,724 3,507 432 0 0 0 0 0 Total current assets: 215,002 275,802 216,959 308,531 411,432 366,191 561,432 514,672 628,119 Property and equipment, net 193,621 214,215 226,514 227,553 289,152 272,357 357,829 340,270 389,895 Other assets: Goodwill 191,466 189,954 191,950 186,644 186,644 184,223 181,802 179,381 176,960 Other intangibles, net 47,276 41,583 40,118 38,647 37,547 36,464 36,018 35,902 35,887 Student notes receivable, net of allowance& 3,385 6,140 12,562 29,938 37,270 44,431 52,500 58,711 64,417 Deposits and other assets 5,133 4,654 4,203 3,709 4,617 5,505 6,504 7,274 7,981 Deferred income taxes 4,041 3,660 3,849 5,631 6,647 7,138 7,972 7,788 Assets held for sale from discontinued operations 14,123 1,587 0 0 0 0 0 Total Assets: 670,006 737,976 695,966 798,871 972,293 915,818 1,203,224 1,144,182 1,311,046 Liabilities and S tockholders Equity Current liabilities: Accounts payable 33,790 38,803 29,124 39,159 62,839 58,758 84,921 75,755 100,539 Accrued compensation and related liabilities 39,412 34,627 48,626 79,989 99,578 118,712 140,270 156,864 172,112 Accrued expenses 11,495 17,795 7,150 13,048 16,243 19,365 22,881 25,588 28,075 Prepaid tuition 55,530 49,455 45,176 66,656 82,980 98,925 116,889 130,717 143,423 Current portion of capital lease obligations 325 373 428 474 400 400 400 400 400 Current portion of long-term debt 1,183 11 0 0 0 0 0 0 0 Liabilities held for sale from discontinued operations 9,436 10,175 3,141 1,257 0 0 0 0 0 Total current liabilities: 151,171 151,239 133,645 200,583 262,041 296,160 365,362 389,325 444,549 Long-term capital lease obligations, net of current portion 14,151 15,141 14,689 14,189 13,789 13,389 12,989 12,589 12,189 Long-term debt. net of current portion 31,402 112,913 62,491 13,895 13,895 13,895 13,895 13,895 13,895 Deferred income tax 27,265 32,339 20,399 14,922 21,830 25,770 27,675 30,908 30,193 Other long-term liabilities 43,439 40,200 42,720 37,614 37,614 37,614 37,614 37,614 37,614 Liabilities held for sale from discontinued operations 3,050 722 0 0 0 0 0 0 0 Total Liabilities: 270,478 352,554 273,944 281,203 349,169 386,828 457,535 484,331 538,439 S tockholders Equity: Common Stock, $0.0001 par value: Common Stock, 120,000 shares authorized* 9 9 9 9 9 9 9 9 9 Additional paid-in capital 150,225 160,312 178,542 208,331 226,039 245,252 266,099 288,717 313,258 Treasury stock (31,368) (31,368) (31,368) (31,368) (31,368) (31,368) (31,368) (31,368) Retained earnings 248,362 255,594 274,437 343,197 428,444 315,096 510,950 402,493 490,707 Accumulated other comprehensive income (loss) 932 875 402 (2,501) 0 0 0 0 0 Total stockholders equity: 399,528 385,422 422,022 517,668 623,124 528,990 745,689 659,851 772,607 Total Liabilities and S hareholders Equity: $670,006 $737,976 $695,966 $798,871 $972,293 $915,818 $1,203,224 $1,144,182 $1,311,046 Source: Company Documents, Student Estimates
- 13. 13 Figure 3: Statement of Cash Flows In millions S tatement of Cash Flows Years Ended June 30, 2006 2007 2008 2009 2010 2011 2012 2013 2014 CAS H FLOWS FROM OPERATING ACTIVITIES : Net income $41,482 $7,232 $21,267 $68,760 $91,125 $107,456 $114,132 $127,445 $122,628 Adjustments to reconcile net income to net cash provided by operating activities: Depreciation and amortization 39,269 43,064 44,777 52,155 64928 77404 91460 102280 112221 Stock based compensation 8,699 6,428 10,892 11,776 12,718 13,736 14,834 16,021 17,303 Excess tax benefit from share-based compensation (4,701) 0 0 0 0 0 Deferred income taxes (2,339) (8,854) (3,019) (3,402) (16,768) (9,563) (4,622) (7,847) 1,736 Loss on disposal of assets (1,232) 769 821 16 0 0 0 0 0 Impairment charge 2,293 10,494 977 0 0 0 0 0 0 Changes in assets and liabilities, net of effects from acquisitions: Accounts receivable, net (5,779) (21,542) (40,294) 48,569 (105,289) 59,703 (111,065) 71,530 (107,856) Student notes receivable, net (104) (4,063) (7,107) (24,436) (2,824) (2,759) (3,108) (2,392) (2,198) Prepaid expenses and other assets 14,114 (942) 12,411 (4,777) (9,293) (9,077) (10,227) (7,872) (7,233) Accounts payable 5,600 4,018 (11,350) 5,430 23,680 -4,081 26,163 -9,166 24,784 Accrued expenses and other liabilities 6,644 672 10,808 34,918 19,589 19,134 21,558 16,594 15,247 Income taxes payable 6 2 (9,111) 24 0 0 0 0 0 Prepaid tuition 7,166 (7,973) (5,199) 22,242 16,324 15,945 17,965 13,828 12,706 Other long-term liabilities 2,895 153 (1,022) (4,656) 0 0 0 0 0 Net cash provided by operating activities 118,714 29,458 24,851 201,918 94,190 267,898 157,090 320,420 189,337 CAS H FLOWS FROM INVES TING ACTIVITIES : Disposals of schools, colleges and training centers, net of cash acquired 18,594 2,941 0 0 0 0 0 0 Capital expenditures (56,054) (70,977) (54,880) (49,525) (61,126) (86,834) (75,296) (92,794) (85,103) Change in restricted cash 10 0 0 0 0 0 0 0 Proceeds from sale of assets 397 2,972 371 731 0 0 0 0 0 Sales of marketable securities 181,100 258,950 94,450 0 0 0 0 0 0 Purchases of marketable securities (195,625) (218,050) (79,450) 0 0 0 0 0 0 Net cash used in investing activities (51,588) (27,095) (36,568) (48,794) (61,126) (86,834) (75,296) (92,794) (85,103) CAS H FLOWS FROM FINANCING ACTIVITIES : Proceeds from borrowings 80,000 12,924 0 0 0 0 0 Principal repayments on capital lease obligations and long-term debt (27,291) (1,514) (52,196) (58,291) (58,291) (58,291) (58,291) (58,291) (58,291) Proceeds from exercise of stock options and employee stock purchase plan* 7,461 4,004 7,282 19,246 9498 10008 11508 12565 10895 Excess tax benefit from share-based compensation 4,701 0 0 0 0 0 Purchase of treasury stock (69,999) (31,368) Net cash (used in) provided by financing activities (89,829) 51,122 (44,914) (21,420) (48,793) (48,283) (46,783) (45,726) (47,396) EFFECTS OF EXCHANGE RATE CHANGES ON CAS H AND CAS H EQUIVALENTS163 1,645 84 (191) 0 0 0 0 0 NET INCREAS E (DECREAS E) IN CAS H AND CAS H EQUIVALENTS (21,058) 53,648 (56,547) 131,513 (15,729) 132,780 35,011 181,901 56,838 CASH AND CASH EQUIVALENTS, beginning of year 57,853 36,795 90,443 33,896 165,409 149,680 282,460 317,471 499,372 CASH AND CASH EQUIVALENTS, end of year $36,795 $90,443 $33,896 $165,409 $149,680 $282,460 $317,471 $499,372 $556,210 Source: Company Documents, Student Estimates
- 14. 14 Figure 4: Beta Calculation Source: Bloomberg Disclosures:
- 15. 15 Ownership and material conflicts of interest: The authors or a member of their household, of this report do not hold a financial interest in the securities of this company. The authors or a member of their household, of this report do not know of the existence of any conflicts of interest that might bias the content or publication of this report. Receipt of compensation: Compensation of the authors of this report is not based on investment banking revenue. Position as an officer or director: The authors, or a member of their household, do not serve as an officer, director or advisory board member of the subject company. Market making: The authors do act as a market maker in the subject company’s securities. Ratings guide: Banks rate companies as a BUY, HOLD or SELL. A BUY rating is given when the security is expected to deliver absolute returns of 15% or greater over the next twelve month period, and recommends that investors take a position above the security’s weight in the S&P 500, or any other relevant index. A SELL rating is given when the security is expected to deliver negative returns over the next twelve months, while a HOLD rating implies flat returns over the next twelve months. Investment Research Challenge and Global Investment Research Challenge Acknowledgement: Western Regional and CFA Society of Orange County Investment Research Challenge as part of the CFA Institute Global Investment Research Challenge are based on the Investment Research Challenge originally developed by the New York Society of Security Analysts. Disclaimer: The information set forth herein has been obtained or derived from sources generally available to the public and believed by the authors to be reliable, but the authors do not make any representation or warranty, express or implied, as to its accuracy or completeness. The information is not intended to be used as the basis of any investment decisions by any person or entity. This information does not constitute investment advice, nor is it an offer or a solicitation of an offer to buy or sell any security. This report should not be considered to be a recommendation by any individual affiliated with CFA Society of Orange County, CFA Institute or the Global Investment Research Challenge with regard to this company’s stock.