More Related Content
More from เนส เหงาจัง (13)
ใบความรู้ที่ 9 ขั้นตอนการสร้างแผนภูมิ ใน excel 2010
- 1. ใบความรู้ที่ 9 ขั้นตอนการสร้างแผนภูมิ ใน Excel
2010
การสร้างแผนภูมิแบบพื้นผิว แสดงแนวโน้มของข้อมูลโดยนำาค่าแทน แกน
X และแกน Y มาใช้เปรียบเทียบโดยแสดงกราฟที่มีข้อมูลต่อเนื่อง
1. เปิดไฟล์ Excel ใหม่ และพิมพ์ข้อมูลให้เหมือนในภาพข้างล่างนี้
2. คลิกเซลล์ใดเซลล์หนึ่งในบริเวณ A1:D4 เพื่อระบุขอบเขตของ
ข้อมูลที่จะนำามาจัดเป็นแผนภูมิ ข้อมูลที่จะนำามาใช้ต้องอยู่ในลักษณะ
ตาราง
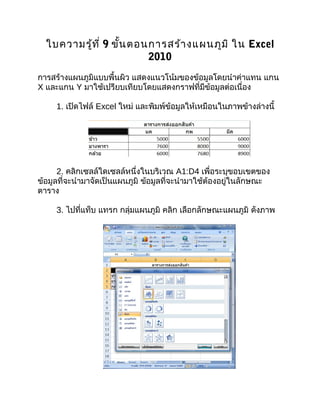
3. ไปที่แท็บ แทรก กลุ่มแผนภูมิ คลิก เลือกลักษณะแผนภูมิ ดังภาพ