The document contains three charts related to job training expenses, executive pay disparity, and capital gains tax rates in the US over time. The first chart shows job training expenses as a percentage of GDP for various countries. The second chart shows the increasing ratio of top executive pay to average worker pay from 1939 to 2005. The third chart depicts the long-term decline of capital gains tax rates in the US from 1916 to 2008.
1. 0.0%
0.1%
0.2%
0.3%
0.4%
0.5%
0.6%
0.7%
0.8%
0.9%
Denmark
Finland
Germany
Sweden
Netherlands
Portugal
Spain
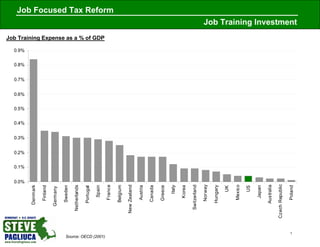
Job Training Expense as a % of GDP
Source: OECD (2001)
France
Job Focused Tax Reform
Belgium
New Zealand
Austria
Canada
Greece
Italy
Korea
Switzerland
Norway
Hungary
UK
Mexico
US
Japan
Australia
Czech Republic
1
Poland
Job Training Investment
2. Job Focused Tax Reform
Executive Pay Disparity
Ratio of Compensation of 3 Highest Paid Officers at 50 Largest Public Companies to National Average Worker
140x
120x
100x
80x
60x
40x
20x
0x
1939
1942
1945
1954
1957
1960
1972
1975
1978
1987
1990
1993
2002
2005
1936
1948
1951
1963
1966
1969
1981
1984
1996
1999
Source: Federal Reserve Board, “Executive Compensation: A New View from a Long-Term
Perspective, 1936-2005”
2