The Long View Electric Cars
•
1 j'aime•2,587 vues

Informative research on electric cars, cost of batteries, comparison of batteries.

Recommandé
Contenu connexe
Tendances
Tendances (20)
En vedette
En vedette (15)
Similaire à The Long View Electric Cars
Similaire à The Long View Electric Cars (20)
Plus de Stradablog
Plus de Stradablog (20)
Dernier
Dernier (20)
The Long View Electric Cars
- 1. Global Autos and Technology March 17, 2014 Max Warburton (Senior Analyst) • max.warburton@bernstein.com • +65-6230-4651 Mark C. Newman (Senior Analyst) • mark.newman@bernstein.com • +852-2918-5753 Robin Zhu • robin.zhu@bernstein.com • +852-2918-5733 Bo Wen • bo.wen@bernstein.com • +852-2918-5718 Abbas Ali Quettawala, ACA • abbas.quettawala@bernstein.com • +44-207-170-0535 Soojin Park • soojin.park@bernstein.com • +852-2918-5702 The Long View: Electric Vehicles - Tesla & The Falling Costs Of Batteries - Are We Still Underestimating The Potential? Please see the Disclosure Appendix for the ratings and price targets of the companies covered in this report. Highlights We would admit to being long standing skeptics about the potential of Electric Vehicles (EVs). We published a 440 page detailed study of alternative powertrains in 2011, in cooperation with technical consultancy Ricardo PLC, that concluded it would be very difficult for EVs to become cost competitive with conventional cars due to the high costs of battery pack production. Recent developments suggest we may have been too bearish. While most mainstream EVs have been sales failures so far (Nissan Leaf, Renault Zoe etc.) due to high costs and poor usability, the success of Tesla has clearly disturbed the status quo. While Tesla's product is very high-end and niche – and sells for emotional rather than rational factors – the company is also making extraordinary claims about its low battery costs – and its ability to move down market. If such claims are correct, then battery costs may be on track to fall sufficiently to make mainstream EVs cost competitive. In recent months we have spoken with a number of EV specialists in the large OEMs as well as several Asian battery suppliers to triangulate Tesla's claims. The large OEMs are not convinced that Tesla has a real technology edge – but they admit they can't yet match Tesla's claimed battery costs. Most struggle to understand Tesla's claims – they are not able to find suppliers able to match such low levels. However, most OEMs report that battery costs are falling fast and some OEMs believe that Tesla's claimed cost levels may be possible by the end of the decade – subject to achieving massive production scale (this now looks to be the critical factor). It may be the case that EVs are going to be more competitive than we previously assumed – and will make up a much larger part of the fleet in future years. Collaborating with our Tech colleagues (Global Memory & Consumer Electronics), we revisit our battery cost modeling, technology analysis and cost of ownership calculations. Nissan and Renault (both rated Outperform) look best placed amongst the mainstream OEMs to achieve full scale battery production. Σ The Tesla effect. With Electric Vehicle (EV) offerings from mainstream OEMs failing to sell and with battery costs apparently too high to be competitive with conventional engines, most industry followers concluded a while ago that EVs were going to remain niche. Even OEMs themselves – and government policy makers – seemed discouraged. But then along came Tesla – and the extraordinary technical achievements and sales success of the Model S – to disturb the consensus. Tesla is now front and centre in every discussion with auto sector investors. The established OEMs are clearly also fascinated by the company. But does Tesla's success – and future plans – mean we need to revisit our assumptions about battery costs and EV competitiveness? Σ Tesla is a triumph of positioning rather than differentiated technology…so far. The genius of Tesla has been to position its product at the high end of the market – this has been more instrumental to its success than cost or technology. While rational car buyers don't want to buy mainstream EVs because they are more expensive and offer inferior performance to combustion engined cars (Nissan Leaf sales remain very, very poor), Tesla is selling cars to emotional buyers who are comparing the Tesla S to other emotional, irrational and expensive products – such as the Mercedes S-Classes and Maserati. That's the See Disclosure Appendix of this report for important disclosures and analyst certifications.
- 2. Global Autos and Technology March 17, 2014 genius of the product – consumers are not doing any cost/benefit calculations – but rather just saying "I want one"! It is also obvious German executives who have driven the Tesla and watched its sales success have been slapping their heads and shouting "D’oh! Why didn't we think of this?'', at least in private. It is obvious that all of the German OEMs have plans to launch high-end Tesla rivals within a few years. Σ Tesla also claims much lower battery costs than mainstream OEMs. While Tesla is first and foremost a triumph of positioning and branding, the company is also making increasingly bold claims about its battery costs – and its plans to move down market. Tesla claims that is battery costs (for full batteries, not just cells) are now between US$200 and 300 per kWh (the industry measures battery power and cost on this basis – for reference a Model S battery is 80 kWh). This compares to mainstream OEMs that talked of over US$700 per kWh in 2011 and still seem to be paying c.US$500 now. We have spent time talking to specialists in the mainstream OEMs – Renault, Nissan, VW and Daimler – as well as Asian battery suppliers to try to triangulate Tesla's claims and understand what Tesla's advantage might be. Σ Does Tesla have a real technology edge? We don't think so. Has Tesla developed unique technology? One argument put forward is that Tesla battery technology involves packaging thousands of 'commodity' lithium-ion cells, similar to those used in laptops, into an automotive battery. This is a different approach to the mainstream OEMs that are using large format lithium-ion cells, designed directly for automotive applications. Is Tesla's battery fundamentally different, other than in structure? OEM engineers we've met with insist not. Most, if not all, OEMs have bought a Tesla and have torn it down. To quote one "We all know the chemistry – it's all settled…we may be able to spice it a bit but essentially we are using exactly the same chemistry – whether you're talking about cylindrical, pouch or prismatic cells". To quote another "there is nothing special about Tesla's technology – it's pretty simple". To quote another "they have some good software, it's interesting how they've chosen to control the battery, but is it better than our big energy cells? I don't think there is a big difference". Σ Does Tesla have a genuine cost advantage? Possibly. The figures that Tesla puts out for battery costs are pretty stunning. Some OEM executives we have spoken with refuse to believe the claims. To quote one from a large European automaker, after we sent him Tesla's claimed costs: "sorry for my late answer, but I was so shocked by the number in your e-mail…!! What I can tell you is that I would be very happy to buy a battery for this price even in 2 to 3 years…".Another argued that "we simply are not aware of suppliers anywhere that could match that cost". Another executive said ''you have to be very careful with these kind of claims – do they mean pack cost or cell cost? Does it include cooling system costs? Do they mean full battery size of available power output? Often these claims are not like for like"'. However Tesla claims the figure they provide is for the 'all-in' battery cost (although Tesla's larger battery size means the costs of the cooling and control system are spread over more kWhs). But we did find some more positive views. One executive said "I think the cost you tell me for Tesla will eventually be possible, even if we are not there yet. I am a true believer that there will be a technology or production breakthrough – there's just so much money and so much brainpower being focused on this. We will have a new generation of cell technology in 6 or 7 years time I believe". Σ Does Tesla have a scale advantage? Our understanding is that Tesla has cell chemistry and variable costs that should not, in theory, be much different to the mainstream industry (who are also buying cells from Asian suppliers). Where Tesla may already have a small advantage – and where it may go on to press its advantage – is scale. If the key to getting battery costs down is scale (for mass production), then it's notable that Tesla already buys more kWh of batteries than any other OEM. It makes fewer electric cars than Nissan, but its average battery size is greater (e.g. Tesla made 22,500 cars x 80 kWh = 1.8mn kWh of battery capacity procured in 2013; Nissan made less than 50,000 Leafs but its battery is only 24 kWh = 1mn kWh of batteries procured). If Tesla moves fast and builds its much discussed 'gigafactory' with capacity for 500,000 batteries or more a year, it could quickly pull away in the scale race (although 2
- 3. Global Autos and Technology March 17, 2014 Asian suppliers are also building bigger plants and there is obviously a risk of overcapacity if the cars don't sell). Σ Scale is key – our battery cost modeling work. We have dusted off our battery cost reduction model – first built in 2011 with the help of Ricardo PLC – and updated it, to try to understand how the industry has reduced battery costs faster than we originally anticipated. Our model splits battery costs into cells, the battery management system, labour, overhead and R&D. It also breaks down the raw material costs within cells. This analysis suggests that a significant reduction in raw material costs (c.40% of total battery costs) is unlikely. But there may be big savings from automated production, battery management system improvement and the amortization of development costs and overheads. We assume this is where battery producers and OEMs have made the big gains – and how they can now claim costs of c.US$500 per kWh or lower, even at the mainstream OEMs. Σ How far do battery costs need to fall to be competitive? We have also updated a total cost of ownership model (TCO) that looks at what battery costs are needed to make owning an EV competitive with owning a conventional petrol or diesel powered cars. While running costs are lower for an EV (annual charging costs can be as little as US$500 for a typical annual driving distance), the purchase price remains much higher and there are also issues related to residuals. Our TCO analysis suggests battery costs need to fall below US$200 per kWh for a C-segment (VW Golf / Nissan Leaf sized) vehicle to be competitive with a normal vehicle (using European fuel prices – in the US battery costs would need to fall even further). We believe the mainstream OEMs are still some way from this cost. But Tesla claims it is already there – and the rest of the industry hopes to move closer. If such hopes can be realized, we may at a tipping point for EVs. Σ Are we underestimating the potential of EVs? So far, Tesla is the only commercial success story for EVs – but it is a niche high end car that is sold on emotional (and offers much greater range than smaller EVs). For EVs to go mainstream, they will need to appeal to heads as well as hearts – and that means being cost competitive with normal cars. It is clear battery costs are falling fast – mainly due to manufacturing scale, rather than chemistry or technology advances (which may mean someone in the supply chain is taking some pain as capacity and price run ahead of utilization). The established OEMs tell us that costs are still not competitive with normal cars. But we are increasingly willing to accept that they may get close by the end of the decade and EV sales are set to accelerate from here. Σ What would stronger EV sales mean for stocks? It may be that EVs take more market share than we anticipated – particularly if we include plug-in hybrids and range extenders (cars with internal combustion engines but also a substantial battery and the ability to run on electric power only). On the positive side, perhaps we are underestimating the ability of companies like Nissan, Renault and BMW to get a payback on their investments. Perhaps suppliers of batteries and other components will enjoy more growth. More worryingly, perhaps laggard OEMs will need to spend more on R&D and capacity to be competitive. It's hard to be precise – but we are increasingly aware that we have been too bearish on EVs. Σ Investment Conclusion We have a Neutral stance on the European auto sector. The key call in European autos is whether we are going to see a genuine European market recovery. The prospects for significant profit growth from outside Europe look dull – China profits may inch up, but not dramatically, while we believe US earnings have peaked. So it is all about the home markets. After 5 years of very difficult conditions in Europe, is there any reason to believe that demand can improve from here? The European SAAR appeared to trough in 2013 at c.11.5mn units, but the SAAR in the final two months crept back towards 12mn. Perhaps it will be a false dawn, but the upside for Euro-focused OEMs is material if demand trends upwards in 2014 and 2015. We rate PSA, Renault and BMW Outperform. 3
- 4. Global Autos and Technology March 17, 2014 We have a Neutral stance on the Chinese auto sector. Chinese car sales growth surprised in 2013 and we expect further growth in 2014. However, we expect growth rates to moderate in future years – when they will collide with large increases in production capacity. Margins in the Chinese market are far above industry norms but must surely fall in the medium term. Direct government financial assistance appears to be playing a role in China's fast increasing capacity, which will ultimately lower returns. Within the group, we find some stocks more attractive than others. We rate Brilliance and Dongfeng Outperform. We rate Great Wall and GAC Market-perform. We rate Geely Underperform. Within Asian autos we also cover Tata (rated Outperform) and Nissan (rated Outperform). We are Positive on both Samsung Electronics and Toshiba. Samsung Electronics owns 20% of Samsung SDI, the world's largest Lithium Ion Battery maker, which is now expanding from batteries for tech gadgets to EV batteries. Majority of profits for Samsung Electronics come from handsets, where commoditization concerns are overdone, with earnings growth mainly coming from structural changes in the memory industry. Toshiba's earnings growth is mainly coming from memory too, but the company is making strides in to batteries for both EV and ESS (Electric Storage Systems). We rate both Samsung Electronics and Toshiba Outperform. Details Thank you Elon Elon Musk is making life for everyone involved in the auto industry more complicated. His car company likes to see itself as a disruptive force and the commercial success of the Model S – and the degree to which it has shaken the establishment – suggests it has the potential to live up to its billing. As followers of mainstream European and Asian OEMs, we get asked almost daily about Tesla. We get asked about the company and its soaring stock price. We get asked about its technology and product plans. We get asked about its cost competitiveness. We get asked about what it means for the existing OEMs. Some of these questions are imponderable – but we think the key issue, above all else, is cost. Does Tesla have a cost advantage that can shake the industry? First, in terms of giving Tesla an operating advantage. Second, has Tesla found a way to make batteries that the rest of the industry can replicate – thereby making everyone's EVs competitive with conventional cars? Can Tesla go mainstream – or can existing OEMs match its costs? Tesla's success so far has been based on offering expensive products at a high price. But this is by definition a niche – albeit a very profitable one for the incumbents such as the Germans. Tesla's volumes and market share in this segment are increasingly relevant – as we show in Exhibit 1 and Exhibit 2, and it is probably going to affect German OEM profits to some small degree (a lot now rests on the commercial success of the Model S in China). But for Tesla to be a true disruptive force, it needs to go down market and pursue much greater volumes in more mainstream segments. For that, it will need more scale and even lower costs. That is exactly what it claims it will soon do – including building massive new battery production capacity. 4
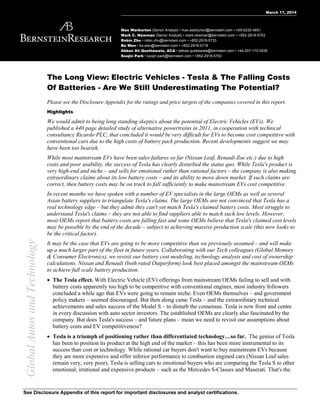
- 5. Global Autos and Technology March 17, 2014 5 Exhibit 1 Tesla saw its sales volume climb steadily to 6,900 units in Q4 2013 Exhibit 2 It sold 22,400 units in 2013, close to the global volume of Porsche Panamera and ahead of US sales of others 8 7 6 5 4 3 2 1 0 Tesla Sales Volume by Quarter Q3 2012 Q4 2012 Q1 2013 Q2 2013 Q3 2013 Q4 2013 SalesVolume ('000 Units) 80 70 60 50 40 30 20 10 0 2013: Global Sales Volume of Tesla and Mercedes S-Class Premium Models BMW 7-series Audi A8 Porsche Panamera Sales Volume ('000 Units) Source: Company reports and Bernstein analysis. Source: IHS Global Insight and Bernstein analysis. Tesla Ferrari Mainstream EV sales remain very poor The challenge facing Electric Vehicles is highlighted when we revisit the Nissan Leaf. The Tesla sells to Silicon Valley entrepreneurs and people in the investment industry (it feels like half of all US investors we speak with have bought one, have ordered one or have a neighbor who owns one…). But back in the real world, more modest EVs just don't seem to sell. Renault has already quietly killed the Fluence EV. Plans for a Twingo EV have been put on hold. Over at Nissan, the Leaf is selling less than 25% of its planned volumes. Is that because the Leaf is a poor product? No, it's an impressive product. Is it because the Leaf lacks the Tesla's range? Possibly – while cheaper small cars always have less performance than big expensive cars, they usually have more range than luxury cars, not less. Is it because in the real world people don't just buy the latest cool car, but rather are price sensitive and work out stuff like total cost of ownership? That's our assumption. The residual values of the Leaf tell a story too – and suggest even when cheaper than gasoline cars, there are other factors that put 'real' buyers off.. In the UK, little-used Leafs can be bought for under 10,000 GBP. But even at this price, buyers don't seem interested.
- 6. Global Autos and Technology March 17, 2014 6 Exhibit 3 Nissan Leaf sales are less than 50k p.a. globally and the key US market just doesn't seem very interested in the car Exhibit 4 Nissan keeps cutting the price and raising incentives but to little effect – 'real'' customers are not convinced 3000 2500 2000 1500 1000 500 0 2011-2013: Nissan Leaf US Monthly Sales A price cut of US$6,400 on basic sepc Jan 11 Mar 11 May 11 Jul 11 Sep 11 Nov 11 Jan 12 Mar 12 May 12 Jul 12 Sep 12 Nov 12 Jan 13 Mar 13 May 13 Jul 13 Sep 13 Nov 13 Sales Volume (Units) 9000 8000 7000 6000 5000 4000 3000 2000 1000 0 2011-2013: Nissan Leaf US Monthly Incentive Spending Jan 11 Mar 11 May 11 Jul 11 Sep 11 Nov 11 Jan 12 Mar 12 May 12 Jul 12 Sep 12 Nov 12 Jan 13 Mar 13 May 13 Jul 13 Sep 13 Nov 13 Incentive (US$) Source: Autodata and Bernstein analysis. Source: Autodata and Bernstein analysis. Revisiting the issues of battery technology and cost Tesla's claims – and evidence of accelerating plans by Asian battery providers to invest in production capacity (e.g. Samsung SDI) has spurred us to revisit our previous assumptions about battery costs – by talking again with technology specialists and by seeking meetings with executives running the EV programmes at the mainstream OEMs. We come out of these discussions aware that battery costs are falling fast, but with no mainstream OEMs able to match Tesla's claimed costs. Most are dubious – but obviously worried – about Tesla's claimed battery cost levels. We have structured this 'Long View' report into 5 sections: Understanding the current costs of EVs Modelling battery cost reduction Modelling the total cost of ownership (TCO) challenge for EVs TCO conclusion: battery costs need to fall to US$200 per kWh or below Appendix: the essential parts of a modern automotive battery.
- 7. Global Autos and Technology March 17, 2014 7 1. Understanding the current cost of EVs Battery costs do appear to be falling faster than we had expected We argued back in 2011 that battery costs were above US$700 per kWh – for a full system included packaging and thermal management systems. Our assumption in 2011 was that battery costs would fall by about 4-5% p.a. - allowing battery costs to fall to under US$600 per kWh by 2015. So far they appear to have fallen much faster. Our understanding is that German OEMs are already able to buy large batteries for EV applications at around US$550 per kWh (for an EV battery – smaller batteries for plug-in hybrids cost more per kWh as the battery management system costs a similar amount, but is shared between fewer kWhs). Renault-Nissan, a volume leader in EVs, will not provide exact guidance - but we believe its costs are still around US$400 per kWh. Tesla's claim seems incredibly bold, with the company talking of US$200-300 per kWh. Few other participants share quite this degree of optimism. Understanding the cost issue – the primary problem for electric vehicles To understand the realism of Tesla's claims – and what they mean for the broader industry – it's necessary to dig deeply into the cost components of a battery – both raw materials and other factor costs. Battery costs do appear to be falling fast – but to model the potential of cost reduction we need to understand the fixed and variable cost split of production. In our view, the potential for cost decline will ultimately be limited by material costs. There is clearly some potential to reduce material density and there have already been some positive developments on material selection. But our understanding is that cells still account for 60% of the cost of an EV battery and within this, raw materials comprise over 60% of cell costs. So material costs still represent c.36% of the cost of a battery pack (60% of 60%). Reducing the costs of these materials further will be hard. Automation and mass production matter – hence Tesla's 'gigafactory' plan Volume will therefore be the key to reducing battery costs. Getting battery costs lower still will require significantly more scale to allow supplier to build proper plants with higher levels of automation and better overheads recovery. This is clearly what Tesla is planning with its talk of a 'Gigafactory' in the South West of the US, designed to build 500,000 battery packs or more. At present, costs are high and most 'mass market' electric vehicles are loss making The reality at present is that Electric Vehicles remain substantially more expensive to develop and produce than conventional vehicles due to high battery costs. Nissan's pricing for the purely battery-powered Leaf starts at just ~$33,000 in the U.S. after further price cuts - a price at which we believe Nissan loses money. Even after generous government subsidies lead to lower net prices, prospective buyers still face a significant price premium compared to a conventional vehicle. The sobering fact is that even at these elevated prices, every mainstream EV sold is likely to result in a loss for the OEMs. Exhibit 5 shows our estimate of the cost walk of a full battery electric vehicle from a standard gasoline ICE vs. the US MSRP of the Nissan Leaf (US$33, 000 upwards). The main cost item is the battery which we believe costs Nissan over US$13,000 (a 24 kWh battery at US$500-550 per kWh) – although Nissan
- 8. Global Autos and Technology March 17, 2014 8 suggests its costs are now trending below this level. This cost walk does not include extra allocations for higher R&D, capex, marketing or overhead costs. Exhibit 5 Even at current high prices, electric vehicles are still likely to result in a loss for the OEM (battery cost is key and this analysis assumes over US$500 per kWh for the Leaf) 1,688 225 200 750 1,250 18,000 $40,000 $35,000 $30,000 $25,000 $20,000 $15,000 $10,000 $5,000 Source: Ricardo and Bernstein estimates and analysis. 3,750 313 400 13,200 15,100 A quick comparison of powertrain option costs To understand EVs – and their ability to compete - we need to compare their powertrain costs to traditional powertrains (gasoline and diesel engines). To do this, we need to capture the engine cost but also electrification costs and transmission and driveline costs for each technology. Each category therefore consists of several subcategories. Based on the most appropriate technology specification for a current C-segment model, we estimate that current baseline powertrain costs range from US$2,300 for a simple gasoline ICE powertrain to almost US$18,000 for full electric vehicle – see Exhibit 6. 38,000 33,000 $0 Vehicle Cost (excl. VAT) ICE Fuel System Exhaust System Transmission Ex-Powertrain Cost Electric Motor(s) Power Electronics & Charging E-Transmission Other Vehicle Cost Battery Cost EV Cost (ex. VAT) Nissan Leaf (US MSRP) Vehicle Cost Gasoline ICE to Full Electric Vehicle Cost Walk (C-Segment, 2013 Level)
- 9. Global Autos and Technology March 17, 2014 9 Exhibit 6 We believe EV powertrains still cost c.6x that of current basic gasoline engined powertrains 25 20 15 10 5 0 Powertrain Costs by Category (2013) 1. ICE G 2. ICE D 3. HEV G 4. HEV D 5. PHEV G 6. PHEV D 7. BEV Powertrain Costs (US$ 000) ICE System Fuel System Exhaust System & Aftertreatment Battery System (not SLI) E-Motors Other Power Electronics Transmission Driveline Source: Ricardo and Bernstein estimates and analysis. What's needed within an EV powertrain? When it comes to analyzing the cost of EV powertrains, we need to include the battery system (full pack incl. battery management system), the e-motors (traction and generator motors) and other powertrain electronics, which includes DC-DC converters, low voltage system controllers, inverter, adapted electric ancillaries as well as charging equipment, where applicable. Battery system costs depend on the chosen chemistry, the price per kWh of this chemistry and the required battery capacity. There are various chemistries (e.g. Lithium Iron Phosphate vs. Lithium Manganese Oxide Spinel, high energy vs. high power) but we do not believe their costs are vastly different. The battery requirements can obviously vary significantly across different types of EV. But a typical C-segment car like a Nissan leave needs a battery of c. 24 kWh – see Exhibit 7. The specifications in this exhibit allow PHEVs an all-electric range of about 50km/30miles under ideal conditions (based on an energy consumption of ~0.16kWh/km). Our full EV specifications result in a range of c.160km/100miles. Full hybrids are typically optimized to support the ICE when extra power is required rather than maximize all electric drive range. But the 1.7-2.1 kWh capacity does nevertheless offer some kilometers of all electric drive under certain conditions. Air conditioning, heating, rapid acceleration or heavy loads can decrease the technical range by a third in a real-life scenario. Battery costs have fallen fast – but we believe a Nissan Leaf battery is still a US$10,000 plus item Pure electric driving without the back-up function of an on-board engine for longer trips requires a massive battery pack – which at 25kWh weighs around 300kg in itself and – if battery costs are now down at the US$550 per kWh level, may cost around US$13,000. If costs are now nearer US$400 per kWh (which Nissan alludes to), the cost would obviously be in the region of US$10,000. If we take Tesla's claims at face value, a battery pack of this size could cost as little as US$5,000. Based on our battery cost trajectory and the expected battery efficiency improvements (see Exhibit 8), this figure could fall to the level claimed by Tesla (US$5,000) by 2025 – but this is unproven – and would mean costs that are still substantially higher than the full powertrain of traditional diesel or gasoline ICE options.
- 10. Global Autos and Technology March 17, 2014 10 Exhibit 7 We expect battery prices to fall by over 50% over the next 15 years – but we may still be too conservative Exhibit 8 A pure C-segment EV is estimated to require 25kWh of battery capacity Assumed Battery Price Development 550 ($/kWh) 440 300 243 600 500 400 300 200 100 0 2013 2015 2020 2025 Battery Capacity ($/kWh) Assumed Battery Capacity Requirements 1.7 2.1 8.0 8.2 30 25 20 15 10 5 0 3. HEV G 4. HEV D 5. PHEV G 6. PHEV D 7. BEV Battery Capacity (kWh) Source: Ricardo and Bernstein analysis and estimates. Source: Ricardo and Bernstein analysis and estimates. 25.0 Other costs: E-motors currently add US$900 to US$1,500 to xEV vehicle costs There are three main motor technology choices for hybrids and electric vehicles: brushless permanent magnet motors, induction motors and switched reluctance motors. Permanent magnet motors allow high-torque density and are relatively compact. They are therefore the preferred choice for hybrids and plug-in hybrids. Electric vehicles face less packaging restraints and thus can use induction motors, which have the added advantage of lower production costs even if their power density is not as high. Our model assumes the use of a surface-mounted permanent magnet 50kW traction motor and an additional 30kW generator motor for diesel and gasoline full hybrid and plug-in hybrid applications. The combined cost is estimated at around US$1,500. Pure electric vehicles do not require a generator motor and the traction motor is assumed to be a 70kW AC induction motor. System costs are likely to be 20% lower than those for hybrid applications. Looking ahead, we believe economies of scale and further efficiency improvements will allow cost reductions of 30% over five years, followed by a further 20% until 2020. Rising costs for magnets are a short-term risk to these estimates. Longer term, we believe that material intensity of magnets used in motors will reduce and balance some of the effects. Power electronics are an often overlooked cost category Non-e-motor related power electronics are an often underappreciated cost category. This cost category covers three major functional systems: 1. Inverters, which convert the DC current from the battery into a 3-phase current to the motor and vice versa.
- 11. Global Autos and Technology March 17, 2014 2. Voltage boosters, which are used to boost the battery voltage to a higher, stable level for the inverter, thereby improving the efficiency of the inverter and motor, and allowing a battery with fewer cells. 3. DC-DC converters, which convert the high voltage from the battery to 12V required for other vehicle systems. Additionally we also include costs for adapted electric ancillaries as well as on-board charging equipment. Costs for these systems are substantial and far exceed the costs of electric motors. Full hybrids are estimated to have about US$3,000 worth of power electronics equipment on board. More expensive inverters and onboard chargers increase this to around US$4,000 for plug-in variants. The power electronics architecture of EVs is somewhat less complex than PHEVs. Transmission and driveline costs of xEVs are lower vs. conventional vehicles Manual transmissions are set to continue to be used for some time in pure ICE applications due to their low production and running costs. But we will likely see a shift from 5 to 6 speed versions. Pure EVs could theoretically completely dispose off a transmission if in-wheel motors are used. However, we think in practice most will use a relatively cheap electric variable transmission (epicyclic) transmission, similar to the one used in hybrids. We estimate that transmission and driveline cost combined are around US$900 for diesel and gasoline ICE powertrains, US$500 for hybrids and PHEVs and US$350 for EVs. 11 2. Modelling battery cost reduction Understanding and forecasting battery costs In 2011, we developed a very detailed battery cost model, with help from Ricardo PLC, which looked at material costs in battery cells, battery management systems, labour and assembly costs and overheads. The material cost analysis breaks down the cells into cathode, anode, separator, electrolyte, copper and aluminium foil – and packaging materials. It models the potential cost reduction from materials purchasing and efficiency gains via technological advances. We have revisited and updated this model to check our assumptions against the claims being made by mature OEMs – and by Tesla. We believe we may have previously failed to capture the potential for cost reduction from production scale. But the gains from material costs are still modest. We believe this model gives a sensible view on what is possible for cost reduction – and suggests it may be possible to get battery costs down to as low as US$300 per kWh or even lower – but only with vast volumes. This cost is still above what Tesla claims is possible…today. Scale is critical Forecasting battery costs accurately is nearly impossible as the relationship of virtually all cost drivers is dynamic: A strong initial EV uptake for example allows for economies of scale and learning curve effects to materialize quickly and is likely to encourage further investments in research and development. All of which should help to drive down battery costs and thus increase the competitiveness and uptake of EVs further. Sluggish sales however will inhibit major cost reductions, possible suppressing future demand further.
- 12. Global Autos and Technology March 17, 2014 12 Material costs (difficult to reduce) vs. fixed costs (scaleable) To understand and to forecast cost developments, we need to understand the constituent costs of batteries. Working with Ricardo PLC in 2011, we broke down batteries into six main cost categories. We believe these estimates are still reasonably accurate: Σ Materials (raw material costs and processing costs) - 39% of total costs Σ Battery Management System (BMS) - 15% of total costs Σ Labour - 18% of total costs Σ Overhead - 19.5% of total costs Σ Research & Development - 8.5% of total costs Σ Profit margin - <1% of total costs When it comes to cost reduction potential, it's likely that labour efficiency and overhead cost amortization offer the greatest potential for advances – as well as reducing the cost of the battery management system. This is mainly driven by economies of scale achieved through the forecast acceleration of EV sales. As fixed costs fall, raw materials will actually increase in relative importance. Exhibit 9 Our assumptions about the cost break down of an automotive Lithium-Ion battery Complete Battery Level Pack Level Materials 39.0% Cells 60% BMS 15.0% BMS 15% Labour 18.1% Labour 11% Overhead 19.4% Overhead 11% R&D 8.4% R&D 3% Operating Profit 0.1% Operating Profit 0% Total 100.0% Total 100% Source: Ricardo and Bernstein analysis and estimates. Cell level costs account for 60% of the full pack costs Cell costs are the largest single driver of battery costs and typically account for around 60% of the pack costs (see Exhibit 10). On a cell level, material costs – which include raw material prices and processing expenditure – can make up two-thirds of the costs (see Exhibit 11).
- 13. Global Autos and Technology March 17, 2014 13 Exhibit 10 Cells typically account for 60% of battery pack costs – the battery management system ranks second Exhibit 11 Materials are the main cell cost driver, but overhead costs, R&D, etc. are also very significant Battery Pack - Cost Composition Cells, 60% R&D, 3% Overhead, Labour , 11% 11% BMS, 15% Cell Level - Cost Composition Overhead, 14% Labour, 12% R&D, 9% Source: Axeon and Bernstein research. Source: Axeon and Bernstein research. Material, 65% Battery management system is also a large part of cost The second most important cost block is the battery management system. Due to the relative immaturity of the battery management system in EVs, costs can amount to circa $3,000 for a full EV system. Labour and overhead follow with a cumulative 18% and 19% cost share respectively (considers pack as well as cell level costs). Low manufacturing quantities mean that the cost burden coming from these items can amount to more than $250/kWh. Material costs account for ~40% of today's full pack level costs Li-Ion material costs account for about 40% of today's full pack level costs – or around $300-350/kWh. A fraction of these costs come from the direct raw material costs, while the vast majority is dependent on the required manufacturing complexity. Exhibit 12 shows the raw material composition of a typical Li-Ion battery, while Exhibit 13 gives an overview of the cost split for the six key components in a battery cell.
- 14. Global Autos and Technology March 17, 2014 14 Exhibit 12 Typical raw material split of a Li-Ion battery (by weight) Exhibit 13 Cost split of a Li-Ion battery cell Material Split Li-Ion Battery Aluminium 29.2% Copper Cobalt 2.7% Lithium Oxide (LiO2) 5.3% Nickel 2.6% Electrolyte 8.7% Manganese Graphite/ Carbon 10.6% 2.5% Other 2.9% Plastic 24.5% 11.0% Cell Material Cost Split Cathode 42% Aluminium Separator 30% Electrolyte Foil 3% Anode 12% 5% Copper Foil 8% Source: Argonne National Laboratory and Bernstein analysis. Source: Yano Research and Bernstein analysis. Raw materials: actual Lithium content in Li-Ion batteries is low At the raw material level, Li-Ion cells are predominantly made of aluminum and copper. Based on today's average pack level energy density of 80 Wh/kg – or 12.5kg/kWh – every kWh Li-Ion battery contains as much as 3.6kg aluminum and 3.1kg copper (aluminum and copper are used as the cathode and anode current collectors, respectively). With a total weight of 1.4kg per kWh, plastic comes in third. Key use of the polypropylene and polyethylene is in the highly sophisticated porous separators that act as a semi-permeable membrane in the electrolyte. The graphite/carbon used for the anodes weighs a further 1.3kg/kWh, followed by the electrolyte – typically a non-aqueous inorganic solvent – with just over 1kg/kWh. Contrary to popular belief, the actual lithium content in Li-Ion is relatively low. Lithium Oxide (LiO2) accounts for about 5.3% of total weight. The weight of the actual lithium metal is only about half as much – or circa 300 g per kWh. The remaining material is mainly bound in the cathode and varies with the specific chemistry used. The split shown in Exhibit 12 is for a Lithium Nickel Cobalt Manganese specification, with a 2.7% cobalt, 2.6% nickel and 2.5% manganese weight share for the full battery pack. Cost split: cathode material and separators account for more than 70% of total cost Li-Ion battery variants are typically named after their cathode materials, which largely define the performance characteristics of the battery. Most research efforts and expenditures therefore concentrate on the development of new cathode material compositions and manufacturing processes. Unsurprisingly, the cathode commands the highest cost share of the six key cell elements – about $130/kWh, or circa 42% of today's Li-Ion battery cell material costs (see Exhibit 13).
- 15. Global Autos and Technology March 17, 2014 The material used for separators might be only about 11% of the total battery weight – but the costs associated with these membranes are substantial: About 30% of the cell material costs, or circa $100/kWh. Separators are crucial to prevent heat-up accidents. Higher value-added products are frequently introduced to the market. Compared to their cathode counterpart, anodes are fairly simple, which is reflected in lower costs of just ~$35/kWh. Anodes are usually made of synthetic graphite/carbon, but it is also possible to use lithium titanate instead. This allows for a much longer cycle life, albeit at a lower energy density level compared to traditional graphite-based systems. The aluminum and copper foils used at the positive and negative pole respectively might dominate the split by weight, but their cost importance is much lower: About 8% ($25/kWh) for copper and just 3% ($11) for aluminum. Dissolved lithium salt in an organic solvent – e.g., LiPF6 in propylene carbonate – is the most common electrolyte. Its manufacturing process is already highly optimized and its cost share a moderate 5% – or ~ $15/kWh. Modelling battery costs in detail To model the cost reduction potential, we have pulled together all the assumptions outlined above into a proper cost model. We first published this in late 2011. While we think the methodology is still valid, it does seem that costs have fallen far faster than we assumed. Exhibit 14 gives an overview of the cost estimates (in $/kWh) that we published in 2011, compared to the 2010 base cost of $750-$800/kWh. It seems that battery costs have fallen far faster than we originally anticipated – being below 2015's estimate already and rapidly closing on our 2020 forecast! If Tesla's claims are representative, the US company may already be at or below 2025's cost target. 15 Exhibit 14 Our original forecasts called for Li-Ion battery costs to fall to c.US$400 per kWh by 2020 – has this been achieved already? 100% $900 $800 $700 $600 $500 $400 $300 $200 $100 Source: Bernstein research and analysis. 80% 54% 44% 100% 80% 60% 40% 20% 0% $0 2010 2015 2020 2025 Cost Level vs. 2010 Cost per kWh Lithium-Ion Battery Cost Development - $/kWh (2010-2025) Materials BMS Labour Overhead R&D Operating Profit
- 16. Global Autos and Technology March 17, 2014 Our cost reduction assumptions in detail To model Lithium-Ion cost reduction potential we break down the typical cost structure of a battery pack by item (materials, battery management system, labour, overhead and R&D) and model their cost reduction potential on a kWh basis. Starting from our understanding of 2010 levels, we have modeled the path towards competitive costs, as summarized in Exhibit 15. It seems that the industry is already moving faster than anticipated and is on course to hit our 2020 assumption many years early. We explore the detailed cost reduction assumptions in detail below. 16 Exhibit 15 Our original modeling of the cost reduction potential by area of an automotive Lithium-Ion battery Complete Battery Level ($ per kWh) 2010 2015 2020 2025 Materials $312 $249 $190 $169 BMS $120 $76 $48 $33 Labour $145 $104 $71 $52 Overhead $155 $131 $69 $39 R&D $67 $54 $28 $18 Operating Profit $1 $24 $30 $42 Total $800 $637 $435 $353 % Change 2010 2015 2020 2025 Materials 0% -20% -39% -46% BMS 0% -37% -60% -72% Labour 0% -28% -51% -64% Overhead 0% -16% -56% -75% R&D 0% -20% -59% -74% Operating Profit 0% n.a. n.a. n.a. Total 0% -20% -46% -56% % from 100 100% 80% 54% 44% Source: Ricardo and Bernstein analysis and estimates. Material cost reduction assumptions: the hardest area to take out cost Current Li-Ion batteries have a very high material intensity. Cell energy densities of c.120-140Wh/kg translate into approximately 80Wh/kg on a pack level – or about 12.5kg/kWh. A 25kWh electric vehicle battery pack – as for example used in the Nissan Leaf – thus weighs around 300kg. This extra weight also requires additional expensive, and again heavy, battery cells. Furthermore, a heavy battery pack affects the handling of the car and causes packaging problems for the vehicle designers (rather cleverly solved by Tesla's vehicle design with low, flat battery – but this may be one of the factors creating problems now with the battery being damaged in impacts and catching fire, according to some of the OEMs we have discussed the issue with).
- 17. Global Autos and Technology March 17, 2014 Materials Requirement (kg/kWh) 2010 2015 2020 2025 Aluminium 3.963 3.148 2.249 1.787 Copper 3.125 2.482 1.774 1.409 Polymer 1.375 1.092 0.781 0.620 Lithium 0.313 0.248 0.177 0.141 Nickel 0.375 0.298 0.213 0.169 Other 3.350 2.661 1.902 1.511 Total 12.500 9.929 7.096 5.636 Materials Requirement - % improvement over 2010 Base year 2010 2015 2020 2025 Aluminium -21% -43% -55% Copper -21% -43% -55% Polymer -21% -43% -55% Lithium -21% -43% -55% Nickel -21% -43% -55% Other -21% -43% -55% Total -21% -43% -55% Total 100% 79% 57% 45% 17 Exhibit 16 Our assumptions about material weights in a typical Lithium-Ion battery – and the reduction potential Source: Ricardo and Bernstein analysis and estimates. The high material intensity also exposes battery costs more to swings in raw material prices. A lot of research and development effort therefore goes into Li-Ion chemistries with higher energy densities, i.e., higher Wh rating per kg of battery. Based on feedback from leading battery suppliers in the xEV battery industry, we have put together a potential development curve for Li-Ion weight per kWh (see Exhibit 17). Exhibit 17 As energy density increases, batteries reduce in weight and require fewer raw materials 100% 14.00 12.00 10.00 8.00 6.00 4.00 2.00 Source: Bernstein research and estimates. 79% 57% 45% 100% 80% 60% 40% 20% 0% -20% 0.00 2010 2015 2020 2025 Weight Level vs. 2010 Weight kg/kWh Material Requirement - kg/kWh (2010-2025) Aluminium Copper Polymer Lithium Nickel Other
- 18. Global Autos and Technology March 17, 2014 Materials Cost per kWh excl. Raw Material Price Changes 2010 2015 2020 2025 Cathode $131 $99 $67 $57 Anode $37 $30 $21 $19 Seperator $94 $78 $66 $59 Electrolyte $16 $14 $12 $11 Copper Foil $25 $21 $18 $16 Aluminium Foil $9 $8 $7 $6 Total $312 $249 $190 $169 % Development 100% 80% 61% 54% YoY Improvement 2010 2015 2020 2025 Cathode 0% -25% -49% -56% Anode 0% -21% -43% -50% Seperator 0% -16% -30% -37% Electrolyte 0% -12% -24% -30% Copper Foil 0% -16% -28% -35% Aluminium Foil 0% -16% -28% -35% Total 0% -20% -39% -46% % Development 100% -20% -39% -46% 18 In the short term, improving existing chemistries via development engineering can yield a 3-4.5% annual energy density improvement curve over the next five years. The significant money poured into Li-Ion battery R&D over the past 3-5 years is largely credited with achieving this relatively rapid progress. In the medium term, the development of advanced cathode materials, Lithium alloys and silicon carbide compounds are expected to yield a further 20-40% improvement. In the long term, explorative research into advanced lithium systems, oxide- based systems or other new energy storage systems may be able to reduce weight per kWh substantially. Efficiency and material cost improvements We forecast that cell material costs will reduce from currently circa $320/kWh to $250 in 2015, to $190/kWh and finally reach $170/kWh – see Exhibit 18. The relative cost reduction potential is slightly lower than that of the material intensity, as many performance-enhancing options will need either more expensive raw materials or require complex and expensive advanced processing (e.g., nanotechnology). Exhibit 18 Our estimate of material cost savings for a Li-Ion battery per kWh Source: Ricardo and Bernstein analysis and estimates. Of the different material cost elements, we expect cathodes to yield some of the biggest cost reduction potential. Cheaper Li-Ion variants and economies of scale for cathode processing are estimated to reduce costs by 25% in the short term and ~50% in the medium term. In the long term, we expect battery suppliers to focus increasingly on superior performance characteristics rather than just lower costs. We therefore expect cost levels to only reduce by a moderate 10% from 2020 to 2025. Due to their relative simplicity, anodes will mainly benefit from economies of scale, but less so from technological advancements. We therefore expect them to lag behind the cost progress made by cathodes and expect an average annual cost reduction of ~4.5% p.a.
- 19. Global Autos and Technology March 17, 2014 Separators are likely to receive continued research and development attention. Future value added products are expected to balance improved safety profiles with lower costs. We expect a cost decline of 3.5% p.a. in the short and medium term, trailing off to around 2% p.a. in the longer run. Electrolytes are already some of the most mature components used in xEV cells. Further cost improvements will be strongly linked to energy cost reductions and very substantial volume improvement. Current collecting copper and aluminium foil prices are closely linked to the raw material costs. Additional demand from xEVs is unlikely to affect prices for these commodities, in our view. Nevertheless, efforts are being made to decrease the required raw material content to reduce battery weight and limited exposure to raw material price swings. 19 Exhibit 19 Cell material costs are expected to come down by c.40% until the end of the decade, driven by economies of scale and technology advancements 100% Cell Material Cost Development - $/kWh (2010-2025) 80% $350 $300 $250 $200 $150 $100 $50 $0 2010 2015 2020 2025 Cost per kWh Cathode Anode Seperator Electrolyte Copper Foil Aluminium Foil Source: Axeon, Yano Research and Bernstein research and estimates. 61% 54% 100% 80% 60% 40% 20% 0% -20% Cost Level vs 2010 Battery management system – Tesla may have an edge in this area The BMS is one of the most promising sources of rapid cost reduction. Currently, we believe the BMS for a full EV costs around $3,000 – or $120/kWh. Yet, industry experts expect them to come down fast – potentially to as little as $500 per system ($20/kWh based on a 25kWh battery pack) in the medium to long term. This may already be an important part of Tesla's claimed cost edge. BMS feature both kWh-rating dependent and independent cost elements. On average, we therefore keep our cost forecast above the $20/kWh level, but we acknowledge that especially vehicles with large battery packs could benefit from even lower average BMS cost per kWh (this is relevant to Tesla, with its large battery pack). We expect the average cost per kWh to fall 37% over the next five years to $75/kWh – see Exhibit 20 – followed by another drop of the same magnitude over the subsequent five years to reach $50/kWh in 2020. By 2025, costs should have reduced to below $35/kWh for the lower electrification grade vehicles (hybrids and PHEVs with relatively low battery capacities). Pure electric vehicles and PHEVs with large battery packs are likely to achieve even better cost figures. The above cost estimates are based on individual cost forecasts for the key components in a BMS: A single battery control module (BCM) and multiple cell voltage and temperature monitoring circuit boards
- 20. Global Autos and Technology March 17, 2014 (VTMB) devices. Current costs are estimated at circa $150 per battery pack for a BCM and further $110/kWh for the various cell monitoring units. Learning curve effects and economies of scale should quickly yield cost improvements – especially for the still very immature VTMBs. Based on historical microprocessor trends and forecasts, we estimate that VTMBs could fall in price by ~9% annually until 2020, followed by 7% until 2025 (see Exhibit 21). BCMs are more mature, but will also benefit from higher xEV sales volumes. 20 Exhibit 20 BMS cost are expected to fall below $35/kWh – from >$120/kWh currently Exhibit 21 Efficiency improvements should offer savings of >5% per year on manufacturing $140 $120 $100 $80 $60 $40 $20 $0 BMS Cost - $/kWh 2010 2015 2020 2025 Average Cost per kWh (based on 25kWh battery) $160 $140 $120 $100 $80 $60 $40 $20 $0 Labour & Manufacturing Costs - $/kWh 2010 2015 2020 2025 Cell Assembly Module Assembly Source: Bernstein research and estimates. Source: Bernstein research and estimates. Labour and manufacturing costs have strong potential for cost reduction, thanks to scale Current manufacturing costs amount to $145/kWh – of which $60/kWh is allocated for the already comparatively automated cell assembly.1 The remaining $85/kWh is required to assemble the cells into modules. These manufacturing costs include direct labor costs as well as CAPEX expenditure for the machines and facilities. Scale will matter: the logic of Tesla's 'gigaplant' As volumes pick-up and new, highly automated production facility come on-line, manufacturing efficiencies based on our xEV forecast are likely to run at 7-8% in the short and medium term for the cell assembly. Module level manufacturing will also benefit from the growing xEV uptake – potentially at a cost-reduction rate of 6-7% per year. In the longer term, efficiency improvement will slow as early scale and learning improvements have been "banked." According to industry sources, battery suppliers can reduce costs by circa one-third with every 7- 1 State-of-the-art manufacturing of battery cells on a production line includes mixing and coating, calendaring and slitting, cutting, tab welding, automated assembly and inspection, followed by testing, cycling and packaging.
- 21. Global Autos and Technology March 17, 2014 10-fold increase of production volumes. This rate of growth is relatively easily achieved in the short term and to some degree in the medium term, but less so in the long term, when market volumes have picked up. Over the forecast period we expect cell assembly costs to fall to $40/kWh in 2015, $25/kWh in 2020 and reach $20/kWh in 2025 – see Exhibit 21. Module level assembly costs are expected to fall slightly slower from $85/kWh in 2010, to $65/kWh in 2015, $45/kWh in 2020 and finally $30/kWh in 2025. R&D costs – will remain high but can be amortized over volume Research and development for new battery chemistries suitable for electric propulsion incurs high upfront costs and long lead times before a product is actually used in the market. Our estimates quantify R&D costs per kWh at around $40-$45/kWh for the cells and a further $25/kWh for the module integration and optimization (see Exhibit 22). These figures are for relatively mature chemistries and technologies. The development of entirely new chemistries (e.g., lithium air) will require much higher upfront investment. At the current level, R&D costs are in excess of 8% of total battery costs – and potentially higher if the costs of exploratory research are also allocated to today's production volumes. We believe that the total investment in battery chemistries will further increase in the coming years, but because of higher unit volumes, relative cost allocation will drop. Based on industry sources and our own xEV uptake projections, we believe R&D allocation can decrease to 7% in the medium term and settle at around 4-5% in the long term – the long-term figure corresponds to the R&D level currently observed for "regular" consumer electronics battery suppliers. 21 Exhibit 22 R&D costs are expected to settle at around 4-5% of total costs by 2025E Exhibit 23 Current low production volumes result in high SG&A costs $80 $70 $60 $50 $40 $30 $20 $10 $0 R&D Allocation- $/kWh 2010 2015 2020 2025 Cell Level Module Level $180 $160 $140 $120 $100 $80 $60 $40 $20 $0 Overhead Costs - $/kWh 2010 2015 2020 2025 Cell Level Module Level Source: Bernstein research and estimates. Source: Bernstein research and estimates.
- 22. Global Autos and Technology March 17, 2014 Scale will also drive down SG&A costs Because of low annual production volumes, sales, administration and other overhead costs account for a disproportionally high cost share. On a full battery level, we estimate that ~19% of costs fall into this category, equal to about $155/kWh (compare Exhibit 23). Mainstream volume battery companies operate on a typical SG&A allocation of around 7-10% of total revenues, potentially even lower. LG Chem for example, the company that supplies the battery pack for the GM Volt and owns the largest dedicated plant for EV batteries, runs at around 6.0-6.5% SG&A allocation (based on total company revenues, not just electric vehicle battery revenues). We believe that xEV volumes will not be sufficient over the forecast period to drive SG&A allocation towards the lower end of this continuum, especially since so many new players are entering this industry. However, we believe that a 10-11% allocation by 2025 can be realistically achieved. 22 3. Modelling the total cost of ownership (TCO) challenge for EVs We believe it's impossible to forecast the potential of EVs without looking at the economics of buying one from the perspective of a consumer. Logical consumers will only buy new-generation vehicles in significant quantities when it makes economic sense to do so. In 2011 we published an in-depth, bottom-up Total Cost of Ownership (TCO) model that demonstrated just how tough the cost challenges are for EVs. We have dusted this model off and updated it for our understanding of the latest developments in lithium-ion battery costs. But even with battery costs falling faster than we expected they are still far from competitive. EVs are not cost competitive for consumers At current prices, electrified vehicles without exception fail to offer any cost savings. Even with subsidies, free parking and other incentives, the cost of ownership calculation is not convincing. Lower running costs are not enough to justify the high initial investment and subsequent higher capital depreciation. Compared to the cheapest TCO option – the traditional diesel ICE – we calculate that driving a hybrid will cost the buyer an additional ~€400-500p.a., plug-in hybrids are €1,000 more expensive per year to own and a pure EV incurs a cost penalty in excess of €2,500. By the end of the decade, falling battery costs will lower EV prices and therefore improve the total ownership costs of these vehicles – but we believe full electric vehicles will continue to trail behind other powertrain options. Our detailed model to analyze and forecast the total cost of ownership (TCO) Are EVs a rational choice based on a TCO assessment? In order to answer this question, we have built a detailed bottom up TCO model. This model calculates current and forecasted vehicle sales prices and residual values as well as full running costs for seven different powertrain options over a 15 years' time frame (2010-2025). It calculates costs based on a typical new vehicle first ownership period of four years and an annual mileage of 14,000km. The full details of this complex model are available in our original 2011 Blackbook on the subject (see "Don't Believe The Hype: Analyzing the Costs and Potential Of Fuel Efficient Technology" – September 26, 2011). For this note, we have updated the analysis and provide a summary of the conclusions.
- 23. Global Autos and Technology March 17, 2014 TCOs modeled for a C-segment car with 7 different powertrain options With the help of specialist consultancy Ricardo PLC, we modeled and forecasted total cost of ownership for a C-segment vehicle with seven different powertrain configurations: 1. Gasoline Internal Combustion Engine (ICE G) 2. Diesel Internal Combustion Engine (ICE D) 3. Full Gasoline Hybrid (HEV G) 4. Full Diesel Hybrid (HEV D) 5. Gasoline Plug-In Hybrid (PHEV G) 6. Diesel Plug-In Hybrid (PHEV D) 7. Battery Electric Vehicle (BEV) Vehicle list prices were calculated taking into account powertrain costs (engine system incl. fuel system and after treatment, batteries and motors, and transmissions), non-powertrain-related costs (the vehicle glider) as well as vehicle development and assembly costs and any other OEM-related mark-ups. For the TCO calculation we used the delta between the initial purchase prices and the estimated residual value over the ownership period. The annual running costs were based on estimates and forecasts for fuel economy and fuel prices (diesel, gasoline and electricity), insurance premiums, maintenance costs and taxes. Outright purchase incentives as well as the decisions of OEMs to market vehicles at prices below the direct vehicle costs were not considered. EVs cost more to buy, but less to run The spread of current prices is substantial: Regular diesel vehicles cost on average €2,500 more than a gasoline version. Full hybrids sell at around €23,000 for a gasoline version, while diesel counterparts carry a further €1,500-€2,000 cost penalty. A full EV realistically needs a price tag of well over €35,000 to cover the actual vehicle costs – and much more if we would consider a proportional profit and R&D allocation. The TCO comparison - conventional cars will see powertrain costs climb in the future EVs look very expensive now, but their costs will fall and the cost – and price – of conventional cars will also rise over the next 10-15 years. Internal combustion engines will need to become much more sophisticated to meet increasingly stringent emission and fuel-economy legislation. We expect that future vehicle prices will reflect these changes in the underlying cost structure and result in lower vehicle prices for xEVs and higher prices for vehicles powered by conventional powertrains – but not enough to make EVs fully competitive. Fuel efficiency technology and emissions standards will raise costs Internal combustion engines will need to employ more sophisticated technologies to meet upcoming fuel economy and emission legislation. Even more so if they are to remain the only source of power generation. Consequently we expect the costs of gasoline and diesel powertrains used in non-hybrids to increase sharply. Over the course of the next 15-years we expect gasoline powertrain costs of a C-segment car to increase by over 60% from today's level. While aftertreatment and fuel system costs are expected to remain fairly stable, the engine system itself will undergo a series of additions: stop-start system, direct injection, variable valve timing and a variable geometry turbocharger in 2015, upgraded turbo charging and e-boost in 2020, and an e-compound turbo in 2025. 23
- 24. Global Autos and Technology March 17, 2014 Diesel technology is fundamentally more efficient than gasoline ICE, but it is also more expensive and results in a cost delta of ~€1,600 versus a gasoline engine. Turbo charging and an EGR system add to the cost of the assumed 100 kW base engine, as do the diesel particulate filter and the diesel oxidation catalyst. Gasoline hybrids currently employ a slightly more expensive ICE technology than their non-electrified counterparts (variable valve timing with twin phasing), but remain otherwise comparable (total powertrain costs of €1,750). Diesel hybrids, on the other hand, are likely to use downsized engines, thus somewhat lowering the associated costs as well as the related costs for the fuel system and aftertreatment (total cost of €2,700). 24 Exhibit 24 Gasoline ICE powertrain costs are expected to have the highest relative cost increase, but diesels will likely stay more expensive 1.7 3.3 2.2 3.7 2.5 3.8 2.8 ICE Powertrain Costs (2013-2025) 3.8 4.0 3.5 3.0 2.5 2.0 1.5 1.0 0.5 0.0 ICE - Gasoline ICE - Diesel Full Hybrid - Gasoline Full Hybrid - Diesel Plug-In Hybrid - ICE Cost (€ 000) Source: Ricardo and Bernstein estimates and analysis. 1.7 2.7 1.7 2.7 1.8 2.8 1.7 2.8 1.8 2.9 1.8 2.9 2.2 2.9 1.8 2.9 Gasoline Plug-In Hybrid - Diesel 2013 2015 2020 2025 Full powertrain cost differences versus EVs will obviously decrease We currently estimate that current total powertrain costs range from €2,300 for a complete gasoline ICE system to c. €18,000 for a full battery electric vehicle –a spread of about 700%. By 2025 we estimate that the gap will have narrowed dramatically, but will still be significant. TCO running costs: just how much cheaper are EVs to operate? Just how much cheaper are xEVs to operate? To answer this question, we have individually modeled fuel-economy improvements by powertrain type as well as expected fuel costs for gasoline, diesel and electricity until 2025. Apart from fueling costs, we have also considered expenditure on insurance, maintenance and vehicle excise duty as the most relevant operating costs in our TCO model. We calculate that at the current fuel prices (fossil fuels and electricity), battery electric vehicles save on average €900 per year in running costs compared to a standard gasoline engine vehicle and €500 per year compared to a diesel. Plug-in hybrids will still save the owner about €650-€750 per year vs. a petrol car, but a meager €300 vs. a diesel.
- 25. Global Autos and Technology March 17, 2014 EVs are ~€900 cheaper to operate per year than a conventional gasoline vehicle We calculate that at the current fuel prices (fossil fuels and electricity), battery electric vehicles save on average €900 per year in running cost compared to a standard gasoline engine vehicle and €500 per year compared to a diesel – see Exhibit 25. Plug-in hybrids will save the owner about €650-€750 per year. Full diesel hybrids still offer a €600 saving compared to a gasoline engine and €250 compared to a diesel. But the cost advantage becomes weaker for gasoline full hybrids, which are estimated to save only about €100 in running costs compared to a regular diesel ICE and €500 compared to a gasoline ICE. The largest cost delta comes not surprisingly from different fuelling costs, but tax advantages for low-emission vehicles also contribute. Below we provide further details on the different cost categories. 25 Exhibit 25 Electric vehicles have approximately a €900 p.a. operating cost advantage over gasoline ICEs and save €500 p.a. versus conventional diesel vehicles 2,500 2,000 1,500 1,000 500 0 Annual Running Costs- C-Segment Vehicle (2013, Europe) €2,400 €2,000 €1,900 €1,730 €1,670 €1,760 €1,500 1. ICE G 2. ICE D 3. HEV G 4. HEV D 5. PHEV G 6. PHEV D 7. BEV Annual Cost (€) Fossil Fuel Electricity Insurance Maintenance Taxes Source: Ricardo and Bernstein research and analysis. EVs are chasing a moving target - conventional engines will become more fuel efficient Most discussions about running cost savings for xEVs focus on the reduced bill the driver has to pay at the gas station and the amount of fossil fuel that can be saved. We have modeled just by how much xEVs can realistically lower fuel consumption and what improvements are still in store for traditional gasoline and diesel engines. With an average consumption of 4.6l/100km, diesel powertrains are about 30% more efficient than gasoline versions. Full gasoline hybrids come in just below, at 4.3l/100km. A diesel hybrid lowers fuel consumption by 46% compared to the gasoline ICE reference powertrain. Once electricity is supplied from the grid, savings cross the 2/3 threshold: Plug-in hybrids are expected to run on 2.3l/100km for a gasoline PHEV and 1.7l/100km for a diesel PHEV. EVs completely dispose of the need for a fuel pump. By 2025 we expect that the projected technology changes2 enable gasoline ICEs to further reduce fuel consumption by 35%. Diesel ICEs are expected to become 25% more efficient over the same horizon. Full hybrids and plug-in hybrids will also benefit from general vehicle optimization and improvements to the 2 Compare section above on changes made to powertrain as well as the individual technology close-ups.
- 26. Global Autos and Technology March 17, 2014 combustion engine. By 2025, we thus see gasoline ICEs using just 4.2l/100km, diesels 3.5l/100km, gasoline and diesel full hybrids 3.0l and 2.6l per 100km, respectively. Plug-ins will use between ~7.5kWh and ~15.2kWh of electricity per 100km Plug-in vehicles offer superior liquid fuel economy but at the same time they also consume electricity from the grid. Plug-in hybrids consume about 7.5kWh per 100km over the New European Drive Cycle (NEDC), while the heavier diesel versions will require around 7.8kWh per 100km. Electricity-only powered electric EVs will use around twice as much with an estimated consumption of 15.2kWh per 100km – a level that can go up by c. 30% under heavy loads or if air conditioning/heating is used extensively. Electricity costs are a small cost component: highest in Europe European retail customers pay circa 18 cents per kWh (Source: Europe's Energy Portal, based on an average consumption of 3,500 kWh/year), while U.S. and Chinese customers pay less than half of this level (Source: U.S. Energy Information Administration). Looking ahead, there will be some sensitivity to electricity prices but unless governments start taxing electricity like they do gasoline, it is likely to be a minor element in the cost calculation. Charging a pure EV for a year will cost ~€390 Running a pure EV will cost around €2.80 in electricity cost per 100km or about €390 for the full year – see Exhibit 26 and Exhibit 27. This is less than one-third of the fossil fuel cost for a regular gasoline car and about one-half of the cost of a diesel. Plug-in hybrids will incur electricity costs of around €2/100km in addition to the fossil fuel costs outlined above. Because of the relatively high electricity costs and low diesel fuel costs in Europe, this leads to the situation where a diesel hybrid will cost less in fuelling costs than a gasoline PHEV – see Exhibit 26. Electricity Cost in € per year Europe (2010-2025) 2010 2015 2020 2025 26 Exhibit 26 Total fuelling costs in €/100km Exhibit 27 Annual assumed electricity costs for plug-In vehicles (€, Europe, 2010-25E) 10.0 9.0 8.0 7.0 6.0 5.0 4.0 3.0 2.0 1.0 0.0 Fuel Cost €/100km Fuelling Cost in €/100km Europe Fossil Fuel Costs (€/100km) Electricity Cost (€/100km) 800 700 600 500 400 300 200 100 0 Fuel Cost €/year 5. PHEV G 6. PHEV D 7. BEV Source: Ricardo and Bernstein research and analysis. Source: Ricardo and Bernstein research and analysis.
- 27. Global Autos and Technology March 17, 2014 In the United States, a full EV will cost just €1.22/100km — and even less in China In countries with lower electricity costs, e.g. China and the U.S., diesel hybrids do not enjoy the same superior cost position compared to gasoline PHEVs. Total fuelling costs (fossil fuel plus electricity) for a gasoline PHEV will come up to €1.89/100km in the U.S. and €2.41/100km in China. This compares to diesel hybrid costs of €2.17/100km and €2.69/100km, respectively. In the United States, full EVs will cost just €1.22/100km to run, and even less in China – see Exhibit 28 and Exhibit 29. 27 Exhibit 28 U.S. fueling cost in €/100km Exhibit 29 Chinese fueling cost in €/100km 10.0 9.0 8.0 7.0 6.0 5.0 4.0 3.0 2.0 1.0 0.0 Fuel Cost €/100km Fuelling Cost in €/100km United States Fossil Fuel Costs (€/100km) Electricity Cost (€/100km) 10.0 9.0 8.0 7.0 6.0 5.0 4.0 3.0 2.0 1.0 0.0 Fuel Cost €/100km Fuelling Cost in €/100km China Fossil Fuel Costs (€/100km) Electricity Cost (€/100km) Source: Ricardo and Bernstein research and analysis. Source: Ricardo and Bernstein research and analysis. Ignoring purchase price, EVs are much cheaper to run every day than gasoline ICEs Based on the cost estimates and trajectories of operating costs in the key categories, we estimate that the owner of a C-segment gasoline powered car is likely to spend about €2,400 per year – or €200 per month – to operate the vehicle. About 50% of this amount goes toward fuel; the rest will pay for the insurance premium (24% of total cost), maintenance (18% of total cost) and taxes (6% of total cost.). Changing to a diesel version can lower this bill by ~16%. Hybrid versions will save about €500 per year for a gasoline HEV (20% cost saving versus a gasoline ICE) and €640 for a diesel HEV (26% cost saving versus a gasoline ICE). Sourcing energy from the grid will only lower operating costs further. PHEVs achieve an additional 9% reduction for the gasoline variants and 5% for diesel variants versus their non-plugged-in counterparts (savings versus a gasoline ICE of 28% and 30%, respectively). Pure electric vehicles will cost about €1,500 to run – 37% lower than the gasoline ICE comparison.
- 28. Global Autos and Technology March 17, 2014 28 Exhibit 30 Annual running cost for C-segment vehicle 2,500 2,000 1,500 1,000 500 0 Annual Running Costs- C-Segment Vehicle (2013, Europe) €2,400 €2,000 €1,900 €1,730 €1,670 €1,760 €1,500 1. ICE G 2. ICE D 3. HEV G 4. HEV D 5. PHEV G 6. PHEV D 7. BEV Annual Cost (€) Fossil Fuel Electricity Insurance Maintenance Taxes Source: Ricardo and Bernstein research and analysis. 4. TCO conclusion: battery costs still need to fall below US$200 per kWh to be competitive Despite a quicker pace of improvement in battery costs than we had previously anticipated, current full electric vehicles are simply too expensive to be competitive. While they enjoy lower running costs (lower fuelling costs, lower vehicle excise duties and in the case of electric vehicles also lower maintenance costs), these are not sufficient to compensate for higher capital cost in virtually all realistic usage scenarios. The key cost driver for plug-in hybrids and full electric vehicles are the battery packs. But just how low do battery prices need to fall before plug-in vehicles become not only a low emission but also a low cost option? Our sensitivity analysis suggests they still need to tumble dramatically. At current fuel prices and with the related low running costs of conventional vehicles, battery costs would need to drop by almost c.75% if EVs are to break even with gasoline ICEs – and even lower compared to diesel variants. Battery costs would need to fall to under $200/kWh for EVs to compete with diesel engines in 2020 Full electric vehicles are the powertrain type most impacted by variations in battery costs. With a typical pack size of 20-25kWh a battery pack currently costs around US$13,000, based on battery costs of US$550 per kWh. However, to break even with a gasoline or diesel C-segment vehicle, battery costs would need to be a fraction of this price. In effect, battery prices need to drop to as low as 20-25% of today's realistic level. The economic proposition of EVs may start to improve somewhat towards the end of the decade, as the cost of conventional powertrains increases. But a lot rests on fuel prices. If fuel prices remain unchanged, EVs may not be competitive unless costs fall to US$200 per kWh.
- 29. Global Autos and Technology March 17, 2014 Exhibit 31 shows our best estimate of the battery cost levels EVs need to achieve if they are to become the best powertrain option based on the lowest total cost of ownership. This assumes flat fuel prices but increase costs of conventional powertrains. Full battery pack prices would need to be one third of current levels by 2020 to be competitive. We stress again that this is a European example, where fuel prices are higher than in the US. The comparison for TCO is tougher still in the US market. 29 Exhibit 31 We calculate that battery costs need to fall to below US$200 per kWh to be competitive with conventional cars 600 500 400 300 200 100 0 Required Battery Cost ($/kWh) to Make EVs competitive on TCO Option vs. Forecasted Battery Cost (2013 - 2025) Current 2020 2025 Battery Cost $/kWh) Battery Cost ($/kWh) to make EV lowest TCO option Estimated Battery Cost Source: Ricardo and Bernstein research and analysis. Our sensitivity analysis considers battery pack costs of €0-1,000/kWh Our TCO sensitivity analysis in Exhibit 32 shows various battery cost scenarios. This is based on an average ownership period of 4 years with a typical mileage of 14,000km/year as well as the full operating costs for fuelling, taxes, maintenance and insurance. Fuelling costs are broken down into charges for gasoline and diesel fossil fuels and any additional charges for grid electricity for the plug-in variants. Vehicle depreciation ex battery values are calculated by first deducting the implied battery costs from the vehicle price and then applying the same depreciation curve assumptions. Subsequently, battery costs in the sensitivity analysis are added back by calculating the theoretically cumulative depreciation for battery costs from €0/kWh to €1,000/kWh. Battery costs need to fall to ~$200/kWh by 2020 for EVs to compete with traditional ICEs Based on the current assumptions, traditional diesel engines provide the best TCO prospects for the average buyer of a C-segment vehicle in Europe. Gasoline ICEs are ~€200p.a. more expensive – but we would like to stress again that the results for individual European countries can vary, especially if vehicle excise duties and fuel taxation vary significantly from those we assumed in our model. All other xEVs feature TCOs that are already higher than those of gasoline or diesel vehicles, even if the battery pack were to be offered for free. If batteries could be procured for under US$100/kWh, then they would be competitive in comparison with current internal combustion engine cars. But we believe with costs of conventional engines set to rise, US$200/kWh is probably the likely 'breakeven' point for around 2020. Is this possible? Tesla insists it is.
- 30. Global Autos and Technology March 17, 2014 Other OEMs are less convinced. But perhaps the industry can get reasonably close – and then a combination of tax breaks and other incentives, fashion and environmental attitudes could swing the market more significantly towards EVs? We believe it is increasingly possible. Exhibit 32 Details for annual Total Cost of Ownership for a C-segment vehicle with seven different PT configurations and battery costs of $0-1,000/kWh – we believe US$200/kWh is the key threshold for affordability and competitiveness 30 Annual Costs Battery Cost Sensitivity Analysis (Annual Costs, 4 Year Ownership Period, 14,000km/Year, European Fuel Costs) Battery Cost ($/kWh) 1. ICE G 2. ICE D 3. HEV G 4. HEV D 5. PHEV G 6. PHEV D 7. BEV Minimum Tech 0 5,335 5,167 5,368 5,402 5,392 5,478 4,993 4,993 BEV 34 5,335 5,167 5,376 5,412 5,431 5,517 5,123 5,123 BEV 68 5,335 5,167 5,384 5,422 5,470 5,556 5,253 5,167 ICE D 81 5,335 5,167 5,387 5,426 5,485 5,572 5,305 5,167 ICE D 108 5,335 5,167 5,394 5,434 5,516 5,603 5,409 5,167 ICE D 135 5,335 5,167 5,400 5,442 5,547 5,635 5,513 5,167 ICE D 162 5,335 5,167 5,407 5,450 5,578 5,666 5,617 5,167 ICE D 189 5,335 5,167 5,413 5,458 5,609 5,697 5,721 5,167 ICE D 2020 TARGET? 5,335 5,167 5,420 5,466 5,640 5,729 5,825 5,167 ICE D 243 5,335 5,167 5,426 5,474 5,671 5,760 5,929 5,167 ICE D 270 5,335 5,167 5,433 5,481 5,702 5,791 6,033 5,167 ICE D 297 5,335 5,167 5,439 5,489 5,733 5,823 6,137 5,167 ICE D 324 5,335 5,167 5,445 5,497 5,763 5,854 6,241 5,167 ICE D 351 5,335 5,167 5,452 5,505 5,794 5,885 6,345 5,167 ICE D 378 5,335 5,167 5,458 5,513 5,825 5,917 6,449 5,167 ICE D 405 5,335 5,167 5,465 5,521 5,856 5,948 6,553 5,167 ICE D 432 5,335 5,167 5,471 5,529 5,887 5,979 6,657 5,167 ICE D 459 5,335 5,167 5,478 5,537 5,918 6,011 6,761 5,167 ICE D 486 5,335 5,167 5,484 5,545 5,949 6,042 6,865 5,167 ICE D 513 5,335 5,167 5,491 5,553 5,980 6,073 6,969 5,167 ICE D 540 5,335 5,167 5,497 5,561 6,011 6,105 7,073 5,167 ICE D CURRENT COST? 5,335 5,167 5,504 5,569 6,042 6,136 7,177 5,167 ICE D 594 5,335 5,167 5,510 5,577 6,073 6,167 7,281 5,167 ICE D 621 5,335 5,167 5,516 5,585 6,104 6,199 7,385 5,167 ICE D 648 5,335 5,167 5,523 5,593 6,135 6,230 7,489 5,167 ICE D 675 5,335 5,167 5,529 5,601 6,166 6,261 7,593 5,167 ICE D 702 5,335 5,167 5,536 5,609 6,196 6,293 7,697 5,167 ICE D 729 5,335 5,167 5,542 5,617 6,227 6,324 7,801 5,167 ICE D 756 5,335 5,167 5,549 5,625 6,258 6,355 7,905 5,167 ICE D 783 5,335 5,167 5,555 5,633 6,289 6,387 8,009 5,167 ICE D 810 5,335 5,167 5,562 5,640 6,320 6,418 8,113 5,167 ICE D 837 5,335 5,167 5,568 5,648 6,351 6,449 8,217 5,167 ICE D 864 5,335 5,167 5,575 5,656 6,382 6,481 8,321 5,167 ICE D 891 5,335 5,167 5,581 5,664 6,413 6,512 8,425 5,167 ICE D 918 5,335 5,167 5,587 5,672 6,444 6,543 8,529 5,167 ICE D 945 5,335 5,167 5,594 5,680 6,475 6,575 8,633 5,167 ICE D 972 5,335 5,167 5,600 5,688 6,506 6,606 8,737 5,167 ICE D 999 5,335 5,167 5,607 5,696 6,537 6,637 8,841 5,167 ICE D 1026 5,335 5,167 5,613 5,704 6,568 6,669 8,945 5,167 ICE D Source: Bernstein estimates and analysis.
- 31. Global Autos and Technology March 17, 2014 31 Exhibit 33 TCO battery cost sensitivity analysis (Europe) 31 29 27 25 23 21 19 17 15 TCO Sensitivity Analysis - Battery Cost ($/kWh) Europe 0 70 110 160 220 270 325 375 430 490 540 600 TCO (€ 000) 1. ICE G 2. ICE D 3. HEV G 4. HEV D 5. PHEV G 6. PHEV D 7. BEV Source: Bernstein estimates and analysis. Battery Cost ($ per kWh) EVs may still require heavy subsidies to be competitive for consumers At a full battery cost of US$750 per kWh, governments – or OEMs –need to subsidize every electric vehicle sold with around €10k in benefits to compensate for the extra expenditure the driver faces over the first four year of ownership (see Exhibit 34). Battery costs of $500/kWh or $350/kWh could reduce this amount to ~€7k and ~€5k, respectively – compare Exhibit 35 and Exhibit 36. Plug-in hybrids would require less than half of this amount and full hybrids need an incentive of c. €1.5k. If battery costs fall towards $200/kWh then EVs may be in business in their own right.
- 32. Global Autos and Technology March 17, 2014 32 Exhibit 34 Subsidy requirement, Europe, battery cost $750/kWh Exhibit 35 Subsidy requirement, Europe, battery cost $500/kWh Exhibit 36 Subsidy requirement, Europe, battery cost $350/kWh Subsidy Requirement Battery Cost $750/kWh 0.7 0.0 1.5 1.8 4.3 4.7 10.7 12 10 8 6 4 2 0 € (000) Subsidy Requirement Battery Cost $500/kWh 0.7 0.0 1.3 1.5 3.2 3.6 7.0 8 7 6 5 € (000) 4 3 2 1 0 Subsidy Requirement Battery Cost $350/kWh 0.7 0.0 1.1 1.4 2.5 2.9 5 4.5 4 3.5 3 € (000) 2.5 2 1.5 1 0.5 0 Source: Bernstein estimates and analysis. Source: Bernstein estimates and analysis. Source: Bernstein estimates and analysis. Appendix: The essential parts of a modern automotive battery 4.7 Battery fundamentals This report has focused on the cost reduction potential of batteries. To help readers understand the issues better, we have also put together a brief summary of battery technology, components and chemistry. The main performance characteristics of automotive batteries are largely determined by the chosen cell chemistry and the battery management system (BMS), which comprises the electronics that control the battery. Other key elements of the battery include busbars, which are used to electronically connect cells, traction cables that connect the modules, and wiring harnesses to connect temperature and voltage sensors from the cells to the BMS (see Exhibit 37).
- 33. Global Autos and Technology March 17, 2014 Exhibit 37 Cells and the battery electronics (battery management system) are key elements of automotive propulsion batteries 33 Source: Axeon. To ensure operational safety, current measuring devices track the amount of amperes during charging and discharging while isolation monitoring devices test for electrical leakage and thus reduce the risk of an electrical shock. The vehicle interface transmits information such as state of charge (SOC), battery voltage temperature and current from the battery to the vehicle via a CAN-BUS. Cells: the heart of the automotive battery Battery cells are at the heart of the automotive battery – both in terms of cost as well as performance impact – and most of the current research and development expenditure goes into improving both key dimensions. Battery cells store energy chemically in their electro-active electrode materials. They are connected in series and/or parallel strings to achieve the required power and capacity. Cells are made up of positive and negative charged plates in an electrolyte. Electrical charge is then created via an electrochemical redox reaction – see Exhibit 38. The electrical pressure created is known as the electromotive force (or voltage). In a Lithium-Ion cell, the Lithium transfers from a high-energy state in the anode to a low-energy configuration in the cathode to produce the required electric energy.
- 34. Global Autos and Technology March 17, 2014 34 Exhibit 38 Batteries are electron pumps that convert chemical energy Into electrical energy on demand Exhibit 39 The three key cell components are the cathode, the anode and the electrolyte Source: Axeon. Source: Axeon. Three key cell components: anode, cathode and electrolyte The main components of a lithium battery cell are the anode, the cathode and the electrolyte (see Exhibit 39). The anode is the negative electrode. During the discharging process (i.e., the electricity generation) it releases electrons and Li+ ions to the external circuit and is oxidized during the process. The majority of commercially available cells use carbon/graphite based electrodes, but metal or alloy versions are also available. The positive electrode – the cathode – accepts the released electrons and Li+ ions. The cathode is reduced during the discharging process. Cathodes usually consist of a lithium transition metal oxide or phosphate. The specific material used typically gives the name to the various existing Lithium-Ion chemistries. The electrolyte separates the two electrodes and provides the medium for the charge transfer inside the cell. The electrolyte does not participate in the chemical reaction and thus remains unchanged during the discharging process. Lithium-Ion batteries typically employ a non-aqueous inorganic solvent that contains dissolved Lithium salt (e.g., LiPF6 in propylene carbonate) as electrolyte. Electrolytes can be solid or liquid/gel. Solid polymer electrolytes are less volatile, have a lower chance of failure because of leakage and a lower flash point, but liquid variants have the benefit of lower internal impedance. A short circuit is prevented by the addition of a porous separator that keeps the two electrodes apart. Battery cells come in prismatic, cylindrical or pouch housings Lithium-Ion cells are traditionally packaged in prismatic aluminum or steel cans (see Exhibit 40). These have the advantages of good durability, heat dissipation and packaging density. Prismatic cells have high energy densities and come in sizes up to 100 Ah.
- 35. Global Autos and Technology March 17, 2014 Small cylindrical cells are produced in very high volumes and the casings are often designed around their standard shape to reduce costs (e.g., for laptop applications). While the cells have high energy densities, their bulky size means an inefficient use of space. Cylindrical cells come in sizes of up to 200 Ah, but sizes larger than those used for typical consumer goods applications tend to be very expensive. Tesla's battery packs use huge numbers of cylindrical cells, assembled together. Pouch cells don't use a rigid metal case, instead they use metalized foil pouches to house the cells. This makes them highly packaging-efficient (90-95%) and lightweight, resulting in a higher energy density on the complete pack. Pouch cells can be custom-shaped depending on the manufacturer's application requirements. Cells in pouch housings use polymers for the electrolyte (less prone to leakage). Because of the low mechanical stability of the cells, battery pack housing needs to be more robust than in other types of cell construction. For automotive use, Lithium polymer pouches are increasingly considered a viable alternative to standard prismatic cells. 35 Exhibit 40 Prismatic cell Exhibit 41 Cylindrical cell Exhibit 42 Pouch cell Source: Axeon. Source: Axeon. Source: Axeon. Battery cell chemistries Key chemistry categories: Lead acid, Nickel Metal Hydride and Lithium-Ion Lithium-Ion batteries are widely considered the most suitable choice for use in automotive propulsion. But Lithium-Ion is not the only available chemistry – nor is there such a thing as "the" Lithium-Ion chemistry. Choosing battery chemistry is always a tradeoff between specific energy (Wh/kg), specific power (W/kg), costs and in most instances also safety. Exhibit 43 shows an overview of the most relevant chemistry options.
- 36. Global Autos and Technology March 17, 2014 36 Exhibit 43 Overview of specific power And specific energy characteristics of key battery chemistries Source: Axeon and Electropedia. Lead acid is a low-cost option Lead acid battery chemistry has been used in automotive starter batteries for decades. The batteries consist of a lead-dioxide cathode, a sponge metallic lead anode and a sulphuric acid solution electrolyte. Lead acid batteries are highly commoditized and available at relatively low costs. They have a good power density, decent high and low temperature performance, good charge retention and are comparatively easy to recycle. On the downside, lead acid batteries are heavy and have poor energy density (see Exhibit 44). They also have long charge times and typically a cycle life3 below 1,000 – too low for use in xEVs. Nickel Metal Hydride: the preferred chemistry for hybrids for many years Nickel Metal Hydride (NiMH) was traditionally the most popular chemistry for hybrid vehicles – such as the Toyota Prius – and several million cars with NiMH-battery packs are now on the roads. The cathode in this type of chemistry uses nickel hydroxide Ni(OH)2, the anode is made from a metal hydride such as lanthanum and rare earths. The metal hydride provides reduced hydrogen, which then can be oxidized to form protons. The electrolyte is alkaline (e.g., potassium hydroxide). NiMH cells have a decent power density, long cycle life and minimal environmental problems. On the downside, NiMH has a high self-discharge rate and relatively high-cost anodes (see Exhibit 44 for key characteristics). 3 Cycle life is defined as the number of charge and discharge cycles a battery can perform before its capacity falls below 80% of its initial available capacity. Alternatively, cycle life can also be interpreted as the total energy throughput during the life of a cell.
- 37. Global Autos and Technology March 17, 2014 Lithium-Ion chemistries provide the highest energy densities Using Lithium in rechargeable batteries provides three times the energy density of other chemistries (again, see Exhibit 44). Performance is expected to improve further as solid state options advance. Apart from performance characteristics, most developments now focus on reducing costs by using cheaper raw materials and manufacturing processes, improved fast charge ability and better environmental friendliness. Lithium-Ion cells generally employ carbon-based anodes, but lithium titanate options are also available. The compounds for the cathode vary significantly and largely determine the specific characteristics of the main lithium variants (we look at these in more detail below). Therefore, much of the research and development attention concentrates on finding alternative cathode materials. 37 Exhibit 44 Comparison of different cell chemistries Property Unit of Measurement Lead Acid NiMH Lithium-Ion Cell Voltage Volts 2 1.2 3.2-2.6 Energy Density Wh/kg 30-40 50-80 100-200 Power Density W/kg 100-200 100-500 500-8,000 Maximum Discharge Rate 6-10C 15C 100C Useful Capacity Depth of Discharge% 50 50-80 >80 Charge Efficiency % 60-80 70-90 ~100 Self Discharge %/Month 3-4 30 2-3 Temperature Range ˚C -40 +60 -30 +60 -40 + 60 Cycle Life Number of Cycles 600-900 >1,000 >2,000 Micro-Cycle Tolerance Deteriorates Yes Yes Robust (Over/Under Voltage) Yes (no BMS required) Yes (no BMS required) No (BMS required) Source: Axeon and Bernstein research. Lithium-Ion battery chemistry variants: Lithium Cobalt Oxide – LiCoO2 Lithium Cobalt Oxide (LiCoO2) is the most widely used cathode material for consumer goods applications such as laptops and mobile phones. It provides decent specific power and energy and at a cell cost of $310- $460 per kWh it comes with a lower price tag than most alternatives. Durability is relatively weak (~500 cycles), but the biggest drawback is the poor safety track record. Drawing too much current or puncturing the cell, for example in case of an accident, can cause thermal runaway or even a fire. These characteristics make Lithium Cobalt unsuitable for automotive use – reports of one exploding car battery would probably have a devastating effect on the prospect of electric mobility for a very, very long time. Please also refer to Exhibit 45 for a comparison of the main lithium variants.
- 38. Global Autos and Technology March 17, 2014 38 Exhibit 45 Comparison of main Lithium variants Cell Chemistry Name Formula Lithium Cobalt Oxide LiCoO2 Lithium Iron Phosphate LiFePO2 HEV 80-108 >1,000 800-1,200 Lithium Iron Phosphate LiFePO2 EV/PHEV 90-125 2,000 300-600 Lithium Manganese Oxide Spinel LiMn2O2 EV/PHEV 90-110 >1,000 450-550 3-5C cont. 255˚C 3.8 -20 to 50˚C Lithium (NCM) – Nickel Cobalt Manganese LiNixCoyMnzO2 HEV 150 1,500 500-580 Lithium (NCM) – Nickel Cobalt Manganese LiNixCoyMnzO2 EV/PHEV 155-190 1,500 500-580 Lithium Titanate Oxide Li4Ti5O12 HEV/PHEV 65-100 12,000 1,000-1,700 Notes: DoD Depth of Discharge HEV Hybrid Electric Vehicle PHEV Plug-In Hybrid EV (Battery) Electric Vehicle Source: Axeon and Bernstein research. Main Application Cell Level Energy Density (Wh/kg) Durability Cycle Life (100% DoD) Price $ / kWh (Cell Level) Power C-Rate Safety Thermal Runaway Onset Potential (Voltage) Operating Temperature Range Consumer Electronics 170-185 500 310-460 1C 170˚C 3.6 -20 to 60˚C 30C cont. 50C pulse 270˚C 3.2 -20 to 60˚C 5C cont. 10C pulse 270˚C 3.2 -20 to 60˚C 20C cont. 40C pulse 215˚C 3.7 -20 to 60˚C 1C cont. 5C pulse 215˚C 3.7 -20 to 60˚C 10C cont. 20C pulse Not suspectible 2.5 -50 to 75˚C Lithium Iron Phosphate – LiFePO2 Phosphate-based chemistries have inherently better thermal and chemical stability and are thus safer than other Lithium-ion technologies. Lithium phosphate cells (LiFePO2) do not combust in the event of mishandling during charge or discharge. They also do not release oxygen and are therefore much less prone to thermal runaway. Their energy density is lower than that of lithium cobalt, but they offer better durability and can support higher currents. Lithium-Ion Phosphate batteries are considered a major improvement over cobalt variants in terms of safety and environmental friendliness. Lithium Manganese Oxide Spinel – LiMn2O2 Batteries using Lithium Manganese Oxide Spinel (LiMn2O2) in their cathode offer higher cell voltages than cobalt-based chemistries and are thermally more stable, but feature a lower energy densities. Manganese is environmentally benign and provides good higher-temperature performance. Lithium (NCM) – Nickel Cobalt Manganese Oxide – LiNixCoyMnzO2 Nickel Cobalt Manganese Oxide (LiNixCoyMnzO2) batteries provide a good compromise of electrochemical performance and lower costs. The cells have energy and power density superior to LiFePO2 and are increasingly finding their way into high-energy-density packs for EVs. Lithium Titanate Oxide – Li4Ti5O12 Cells that fall into the Lithium Titanate Oxide (Li4Ti5O12) category replace the graphite anode with one made of lithium titanate. The cathode could be any one of the above described options, but most often they are used in combination with high-voltage manganese-based materials.
- 39. Global Autos and Technology March 17, 2014 Titanate anodes offer the benefit of wider operating temperature ranges and built-in overcharge protection. They also result in much longer cycle lives, as the titanate does not react with the electrolyte, and thus avoids forming a "choking" layer. Negative points are the lower energy density ratings and the currently still very high costs. 39 Future developments concentrate on costs, durability and energy and power density Cells are the fundamental building blocks of batteries, and the cell chemistry largely determines the key characteristics of the battery pack. The development focus continues to be on: Reducing cell costs by using cheaper materials & manufacturing processes. Extending the cycle life of batteries, ideally up to the point where battery durability matches that of the vehicle. Improve performance characteristics, especially energy density for battery electric vehicle applications and power density for hybrid applications Chemistry development for automotive propulsion is still in its early stages and alternative materials are currently being tested that have a much higher potential energy and/or power density of those available at present – see Exhibit 46. Exhibit 46 Cell chemistries currently under development could offer more than 10x the energy density – however, they will not come close to that of gasoline 120 180 230 260 310 410 8,000 7,000 6,000 5,000 4,000 3,000 2,000 1,000 Source: Axeon and Bernstein research. 1,100 2,600 TMO and Silicon alloys: higher energy density than graphite anodes Replacing the graphite anode with silicon-alloy materials could offer up to three times as high energy densities – potentially at cheaper costs than standard soft, hard and semi-graphitized carbons. When silicon-alloy anodes are combined with advanced Transition Metal Oxide (TMO) or silicate-based cathodes, the resulting theoretic energy density could be as much as 310 Wh/kg (see Exhibit 46). 5,200 12,200 0 Lithium Iron Phosphate Lithium Cobalt Oxide Nickel Cobalt Manganese - Graphite Nickel Cobalt Manganese - Alloy Transition Metal Oxide - Titanate or Alloy Advanced Transition Metal Oxide Zinc Air Lithium Sulphur Lithium Air Gasoline Energy Density (Wh/kg) Theoretical Maximum Energy Density of Different Cell Chemistries