SlideShare une entreprise Scribd logo
1  sur  79
Scripts and Tools for Oracle Troubleshooting and
Advanced Performance Analysis
Tanel Põder
http://www.enkitec.com
http://blog.tanelpoder.com

www.enkitec.com

1
Intro: About me
• Tanel Põder
Oracle Database Performance geek
Exadata Performance geek
Hadoop Performance geek

• Enkitec
• Consultant
• Researcher
• Technology Evangelist

Expert Oracle Exadata
book
(with Kerry Osborne and
Randy Johnson of Enkitec)
www.enkitec.com

2
All scripts and tools are downloadable and free

• Download the scripts and tools from:
• http://blog.tanelpoder.com/files/

• Updates (since I delivered this class in 2010):
• I have shut the PlanViz website down so ignore some slides
• I haven't updated the PerfSheet v3 tool since 2010
• Luca Canali has built a new PerfSheet v4:
• http://canali.web.cern.ch/canali/resources.htm

www.enkitec.com

3
Intro: About this Training Day - 1
1.
2.
3.
4.

Your Performance
Database Performance
SQL Performance
Performance visualization, trending and advanced analysis

• We will talk about scripts, tools and a systematic approach to
troubleshooting & tuning
• Case studies!

• Download the scripts and tools from:
• http://tech.e2sn.com/oracle-scripts-and-tools

www.enkitec.com

4
Intro: About this Training Day - 2
• Productivity and speed of action
• Both on Unix and Windows clients

• Scripts and Tools
•
•
•
•

Snapper v3.0
MOATS v1.0
LatchProf v2.0
And many more… :-)

• Trending & Visual Performance Analysis
• Tools
• Data Collection (even without Diag Pack licenses)
• Visualization - PerfSheet v3.0

www.enkitec.com

5
Productivity and speed of action
• Talking to Oracle
• SQLPLUS still rocks 
• …especially in cases where you need to deviate from the usual path

• You’ll have a (searchable) history of output of your last commands
• On the screen or in a spool/logfile…

• You can run your scripts

• It’s more “pure” than GUI development tools (which try to be clever, do extra
stuff, don’t fetch all data etc)

www.enkitec.com

6
SQLPLUS on Windows
• Configuration
• Do NOT use sqlplusw.exe ->
• This is what you get when
running sqlplus from Start
menu
• Luckily sqlplusw.exe is
gone since 11g!
• Use CMD.exe and run
sqlplus.exe ->

Much better!!!

www.enkitec.com

7
SQLPLUS on Windows – CMD.exe settings
• CMD.exe needs some tweaking…
• You should check QuickEdit mode, Increase Screen Buffer size etc
1.

2.

3.

www.enkitec.com

8
Setting SQLPLUS Window title automatically
• Set cmd window title to include database session info
• SQL> host title “test”
• @i.sql queries session, instance info from V$ views and sets title accordingly
• i.sql is automatically
called by login.sql
if its in SQLPATH
directory

www.enkitec.com

9
SQLPLUS on Windows
• Command line history
• Up/Down arrow - navigate between commands
• CTRL+Left/Right arrow – jump one word left/right
• F7 – Display a popup box with command line history
•
•
•
•

Use up/down arrows to navigate
ENTER to execute command
Right arrow to put the command to command line for editing
First letter of command to jump between commands starting with that letter
(case sensitive)

• F8 – Retrieve command from history
• Type a beginning of the command (for example “sel”) and press F8
• This will jump through all commands starting with “sel” (case sensitive)

• List commands from history
• SQL> host doskey /history /exename=sqlplus.exe
• @h <text> – history script showing old commands with text int them
• @ha – history all
www.enkitec.com

10
SQLPLUS on Windows
• Output formatting
• @HTML
• Uses SET MARKUP ON HTML
• Runs the query in SQLPLUS buffer and spools the output to .HTML file
• Launches that .HTML file with appropriate OS command

• @XLS
• Same as above, but spools to an .XLS file and launches it :-)

• @CSV
• Uses SET COLSEP “,” and spools to a .CSV file

www.enkitec.com

11
SQLPLUS on Unix / Linux / MacOS
• Configuration
• Setting xterm title
• From shell
– echo -ne "033]0; your text here 007”

• From SQLPLUS
– host echo -ne "033]0; your text here 007”

• From vi
– set title
– set titlelen=20

• Decent terminal emulators
• Putty on Windows (small, lightweight and works well!)
– http://www.chiark.greenend.org.uk/~sgtatham/putty/

• Terminator on MacOS, Unix, Linux (and apparently Windows)
– http://software.jessies.org/terminator/
www.enkitec.com

12
SQLPLUS on Unix / Linux / MacOS
• Output formatting
• Same as on Windows
• Launching the HTML file is done with a different command:
• MacOS – open command launches the program associated with .HTML extension
• Unix/Linux – I just run firefox by default, but you can change it in the script

• Terminal with left-right scrolling capability?
• I’m using Terminator
• (Not the one you can install from Ubuntu repositories)
• http://software.jessies.org/terminator/
• However, it needs to install its own terminfo file to function properly!
– This will be an issue if you need to SSH into a lot of servers in an enterprise
– Good for demoing stuff though! 

• SQL> set truncate on
• Sqlplus allows you to truncate the columns which don’t fit into the linesize
instead of wrapping
www.enkitec.com

13
SQLPLUS on Unix / Linux / MacOS X
• Command line history using RLWRAP
• Rlwrap (readline wrapper) adds GNU readline capability for any text mode
application
• BASH shell has the same functionality built in
• Just run rlwrap sqlplus instead of just sqlplus (or any other utility)

• Rlwrap gives also tab completion!
• If you tell it to…
• It can use a wordfile (with Oracle keywords, view, column names)
– rlwrap -f

• And it can remember every word it sees on the screen!
– rlwrap -r

www.enkitec.com

14
SQLPLUS with RLWRAP – Keyboard shortcuts
• Keyboard shortcuts (Emacs mode):
•
•
•
•

Up/down arrows – navigate command line history
CTRL+A – go to beginning of line
CTRL+E – go to end of line
CTRL+R – search command history backwards
• press CTRL+R again to move on to next match

• CTRL+S – search command history forward
• go “back” from too many CTRL+R’s

• ALT+F / ALT+B – Move Forward / Backward by one word
• This works if ALT is used as the META key for emacs (check your terminal
emulator preferences)

•
•
•
•

CTRL+K – erase (kill) line from current position to the end of line
CTRL+X, BACKSPACE – erase line from current position to the beginning
CTRL+W or ALT+BACKSPACE – erase one word at a time
CTRL + _ - undo command edit! (or CTRL+X, u)
www.enkitec.com

15
Installing RLWRAP
• Linux
• RHEL/OEL/CentOS – Get from here: http://fedoraproject.org/wiki/EPEL
• Ubuntu: apt-get install rlwrap

• MacOS X – Get it from an open source package site for MacOS
• MacPorts - http://www.macports.org/
• DarwinPorts - http://darwinports.com/
• Fink - http://www.finkproject.org/

• Solaris (SPARC and Intel)
• http://www.sunfreeware.com/

• On HP-UX there’s a similar built in command: ied
• Should also work on Windows with Cygwin
•

http://blog.tanelpoder.com/2010/05/07/flexible-sqlplus-command-line-history-with-rlwrap/
www.enkitec.com

16
Setting up TPT scripts - 1
• Tanel’s Performance Tuning scripts :-)
• 500+ scripts which I use “every day”
• Most scripts do one thing only (such as show parameter values etc)
• Also latest versions of the more sophisticated scripts (Snapper, LatchProfX etc)
are in there

• Download the .zip file and unzip to a directory:
• http://tech.e2sn.com/oracle-scripts-and-tools

• Set SQLPATH variable to point to the script directory
• Unix:
• export SQLPATH=$HOME/tpt

• Windows:
• set SQLPATH=C:userstaneltpt
• Or Right click on My Computer -> Properties -> Advanced Settings -> Environment
Variables; and add it there

www.enkitec.com

17
Setting up TPT scripts - 2
• Edit init.sql (init.sql sets up various sqlplus variables)
• Uncomment the appropriate parameters in the SETUP section
• It tells sqlplus whether you’re running it on Windows, Unix or MacOS
-- SETUP SECTION –
-------------------------------------------------------------------- Uncomment the following lines if you run your sqlplus on Windows
-------------------------------------------------------------------- def SQLPATH=%SQLPATH%
-- def _start=start
-- def _delete=del
-- host doskey /exename=sqlplus.exe desc=set lines 80 sqlprompt ""$Tdescribe $*$Tset lines 299
sqlprompt "SQL> "
-------------------------------------------------------------------

• Edit i.sql (i.sql is the “who am I” script which also sets window title)
• Uncomment the appropriate title command in the setup section (EOF)
host title &_i_user@&_i_conn [sid=&mysid ser#=&_i_serial spid=&_i_spid …
-- host echo -ne "033]0;&_i_user@&_i_inst sid=&mysid,&_i_serial007"

www.enkitec.com

18
Database Performance Tools

www.enkitec.com

19
What is Oracle Database activity about?
1. A bunch of sessions
• You need a session for doing anything in Oracle

1. Applications use these sessions to execute (PL)SQL cursors
• Any database call requires use of a cursor
• Including PL/SQL stored procedure calls

1. The cursor execution will do some work
• During the execution, the processes either:
• Work on CPU
– Or at least want to work on CPU, but OS scheduler doesn’t allow them

• Do not Work on CPU
– They have been put to sleep by OS because of a blocking system call
– They have gone to sleep voluntarily, waiting for some event completion

www.enkitec.com

20
Sampling session activity details over time – Which SQL?
SID 10

SELECT A

idle

SELECT B

SID 11

SID 14
SID 15

UPDATE C

idle

SELECT X

SID 12
SID 13

idle

SELECT Y
SELECT N

SELECT N

SELECT A
idle

SELECT N

idle

UPDATE K

SELECT B

SELECT A

idle

idle

idle

idle

SELECT N

UPDATE C
UPDATE C

INSERT Z
SEL
idle

idle

COMMIT

Time
Sample session
activity over
time ->
(v$session)

2 x SELECT A
1 x SELECT X
1 x SELECT Y
1 x SELECT N

3 x SELECT A
1 x SELECT X
1 x SELECT Y
1 x SELECT N
www.enkitec.com

…

3 x UPDATE C
1 x SELECT X
1 x SELECT Y

Count the number of
(active) sessions each
sample,
group by SQL ID

21
Sampling session activity – Working or Waiting?
SID 10

SELECT A

idle

SELECT B

SID 11

SID 14
SID 15

UPDATE C

idle

SELECT X

SID 12
SID 13

idle

SELECT Y
SELECT N
SELECT A
idle

SELECT N
idle
SELECT A

SELECT N

idle
UPDATE K

SELECT B
idle

idle

idle

SELECT N

UPDATE C
UPDATE C

INSERT Z
SEL
idle

idle

COMMIT

Time

CPU
User IO
Locks

Session
count

Commit
www.enkitec.com

Time

22
Understanding Database Performance
• Performance diagnosis data should have at least these details
• Which Sessions?
• Which SQL?
• Work or wait?

-> v$session.sid
-> v$session.sql_id, plsql_(sub)program_id
-> v$session.state, v$session.event, p1,p2,p3

• When?

-> Time when samples were taken

• This data can be grouped and summarized by any dimension
depending on the “performance question” asked!
• The sampled session activity dataset is like a FACT table in DW’s
• The existence of a session sample shows that the session was active
• The dimension attributes show a large variety of extra details
• Which SQL was running, Working or Waiting, Which event, P1,P2..
www.enkitec.com

23
A selective list of dimensions for performance analysis
Status is ACTIVE for

SQL> desc v$session
sessions running a
Name
Null?
Type
database call (background
------------------------------- -------- ---------------------------sessions are always in a
1
SADDR
RAW(8)
call)
2
SID
NUMBER
Easy way to get TOP SQL,
7
USERNAME
VARCHAR2(30)
just group and count the
12
STATUS
VARCHAR2(8)
samples by SQL_ID
21
PROGRAM
VARCHAR2(48)
25
SQL_ID
VARCHAR2(13)
37
PLSQL_OBJECT_ID
NUMBER
From 10.2.0.3 onwards
38
PLSQL_SUBPROGRAM_ID
NUMBER
39
MODULE
VARCHAR2(48)
you can get easy TOP
41
ACTION
VARCHAR2(32)
PL/SQL, just group by
45
ROW_WAIT_OBJ#
NUMBERTOP
PL_SQL_OBJECT_ID/SUBP
If you want the
61
CLIENT_IDENTIFIER
VARCHAR2(64)
ROGRAM_ID and join to
BLOCKER, just group the
64
BLOCKING_SESSION
NUMBER
same columns in
samples by
70
EVENT
VARCHAR2(64)
DBA_PROCEDURES
blocking_session
71
P1TEXT
VARCHAR2(64)
72
P1
NUMBER
74
P2TEXT
For TOP WAITs, just VARCHAR2(64)
Very important to
75
P2
group the samples by NUMBER
remember: If wait STATE
77
P3TEXT
VARCHAR2(64)
EVENT where
!= WAITING, the session
78
P3
NUMBER
STATE=WAITING
is NOT WAITING (It’s
82
WAIT_CLASS
VARCHAR2(64)
working on CPU or tries to
85
STATE
VARCHAR2(19)

get onto CPU)
www.enkitec.com

24
Instance Activity overview
• What is the database (instance) doing right now?
• @a.sql – Instance Activity SQL
• It takes one ASH style sample of V$SESSION and shows TOP sql/wait

• I wrote it to show how easy it is to get an overview of instance activity
• But it’s also very short to type – I actually use it regularly :-)
• I just run it couple of times in a row!
select
count(*)
, sql_id
, case state when 'WAITING' then 'WAITING' else 'ON
, case state when 'WAITING' then event else 'On CPU
from
v$session
where
status='ACTIVE’
and wait_class != 'Idle'
and sid != (select sid from v$mystat where rownum=1)
group by
sql_id
, case state when 'WAITING' then 'WAITING' else 'ON
, case state when 'WAITING' then event else 'On CPU
order by
count(*) desc

CPU' end state
/ runqueue' end event

CPU' end
/ runqueue' end

www.enkitec.com

25
Snapper v3 - Overview
• Major improvement – ASH style session activity sampling!
• From V$SESSION / V$SESSION_WAIT (no separate licenses needed)
• @snapper ash <total_seconds> <sampling_interval> <SIDs>

• Still works all the way from Oracle 9.2 to latest Oracle version
• Still NO installation/database changes are needed!
• It’s just an anonymous PL/SQL block, parsed on the fly…
• Look into the code to see some cool challenges involved!!!

• Still free and still has a picture of a real Snapper (fish) in it! ;-)
• …and you can still run it directly from web if you feel adventurous
• SQL> @http://www.tanelpoder.com/files/scripts/snapper.sql .....
www.enkitec.com

26
Snapper v3 – Session Activity Sampling
• Example 1a: Single Session troubleshooting:
SQL> @snapper ash,gather=n 5 1 32
-- Session Snapper v3.01 by Tanel Poder ( http://www.tanelpoder.com )
------------------------------- Sampled Session Activity Profile ------------------------ Act% | Wait Event
| Wait Class
| SQL_ID
----------------------------------------------------------------------------------------84% | db file scattered read | User I/O
| g723q6scvr9h8
11% | ON CPU
| ON CPU
| g723q6scvr9h8
3% | db file sequential read | User I/O
|
3% | ON CPU
| ON CPU
| c0j6cx9kzjf7g
SQL> @sqlid g723q6scvr9h8

As we measure a single
session, then the max
Activity% can be 100% (allow
for some rounding errors).

HASH_VALUE CH# SQL_TEXT
---------- ---- ----------------------------------------------------------------------431728136
0 /* SQL Analyze(0) */ select the activity is measured less
If /*+ full(t) no_parallel(t)
no_parallel_index(t) dbms_stats100%, it means that the
than cursor_sharing_exact use_weak_name_resl
dynamic_sampling(0) no_monitoring was not active the */to_char(count
session no_substrb_pad
("SYS_NC00009$")),to_char(substrb(dump(min("SYS_NC00009$"),16,0,32),
remaining time (it was idle).
www.enkitec.com

27
Snapper v3 – Session Activity and Performance Counters
• Example 1b: Single Session troubleshooting with perf counters
SQL> @snapper ash,stats 5 1 146
-- Session Snapper v3.01 by Tanel Poder ( http://www.tanelpoder.com )
-------------------------------------------------------------------------------------------------------SID, USERNAME , TYPE, STATISTIC
,
DELTA, HDELTA/SEC,
%TIME,
-------------------------------------------------------------------------------------------------------146, SYS
, STAT, session logical reads
,
309970,
61.99k,
146, SYS
, STAT, consistent gets
,
309966,
61.99k,
146, SYS
, STAT, consistent gets from cache
,
309967,
61.99k,
146, SYS
, STAT, consistent gets from cache (fastpath)
,
309968,
61.99k,
146, SYS
, STAT, calls to kcmgcs
,
1660,
332,
146, SYS
, STAT, no work - consistent read gets
,
308388,
61.68k,
146, SYS
, STAT, table scans (short tables)
,
332,
66.4,
146, SYS
, STAT, table scan rows gotten
,
25006755,
5M,
146, SYS
, STAT, table scan blocks gotten
,
308415,
61.68k,
146, SYS
, TIME, DB CPU
,
3960000,
792ms,
79.2%
146, SYS
, TIME, sql execute elapsed time
,
4059947,
811.99ms,
81.2%
146, SYS
, TIME, DB time
,
4059947,
811.99ms,
81.2%
-- End of snap 1, end=2010-03-01 11:31:10, seconds=5
---------------------------------- Sampled Session Activity Profile ------------------------------- Act% | Wait Event
| Wait Class
| SQL_ID
--------------------------------------------------------------------------------------------------100% | ON CPU
| ON CPU
| 7vxd09448zcrx

www.enkitec.com

28
Snapper v3 – Session Activity Sampling
• Example 2: Whole instance overview
• You can write any query instead of the list of SIDs:
SQL> @snapper ash,stats,gather=n 30 1 "select sid from v$session"
-- Session Snapper v3.01 by Tanel Poder ( http://www.tanelpoder.com )
------------------- Sampled Session Activity Profile ----------------------------- Act% | Wait Event
| Wait Class
| SQL_ID
---------------------------------------------------------------------------------164% | read by other session
| User I/O
| 3jbwa65aqmkvm
99% | ON CPU
| ON CPU
| 7vxd09448zcrx
99% | ON CPU
| ON CPU
| bt4txmkqf7u89
98% | db file scattered read
| User I/O
| 3jbwa65aqmkvm
98% | direct path read
| User I/O
| 3jbwa65aqmkvm
61% | db file scattered read
| User I/O
| dw2zgaapax1sg
41% | control file parallel wri | System I/O
34% | db file async I/O submit | System I/O
27% | log file parallel write
| System I/O
As we are measuring more
24% | db file sequential read
| User I/O
| 0bzhqhhj9mpaa

than one session, then it’s ok
to see over 100% of activity.
100% stands for all response
time of a single session!

www.enkitec.com

29
Snapper v3 – Performance Counters
• Example 3a - Find top REDO geneators
SQL> @snapper ash,stats,gather=s,sinclude=redo_size 5 1 "select sid from v$session”
-- Session Snapper v3.01 by Tanel Poder ( http://www.tanelpoder.com )
-----------------------------------------------------------------------------------------------SID, USERNAME , TYPE, STATISTIC
,
DELTA, HDELTA/SEC,
-----------------------------------------------------------------------------------------------20, SYS
, STAT, redo size
,
13376076,
2.68M,
31, SYS
, STAT, redo size
,
18232,
3.65k,
143, SYS
, STAT, redo size
,
26796,
5.36k,
-- End of snap 1, end=2010-03-01 11:52:47, seconds=5
--------------------------------- Sampled Session Activity Profile ------------------------------ Act% | Wait Event
| Wait Class
| SQL_ID
------------------------------------------------------------------------------------------------69% | log file parallel write
| System I/O
50% | ON CPU
| ON CPU
| crwqs334cz65x
27% | log buffer space
| Configuration
| crwqs334cz65x
12% | log buffer space
| Configuration
| f6f6wxb0st0yp
8% | ON CPU
| ON CPU
8% | db file sequential read
| User I/O
| gvt8zu1k1tsff

www.enkitec.com

30
Snapper v3 – Performance Counters
• Example 3b:
• Find top IO throughput (MB) users
SQL> @snapper stats,gather=s,sinclude=physical%bytes 5 1 "select sid from v$session"
-- Session Snapper v3.01 by Tanel Poder ( http://www.tanelpoder.com )
----------------------------------------------------------------------------------------------SID, USERNAME , TYPE, STATISTIC
,
DELTA, HDELTA/SEC,
----------------------------------------------------------------------------------------------6, (CKPT)
, STAT, physical read total bytes
,
16384,
3.28k,
6, (CKPT)
, STAT, physical write total bytes
,
32768,
6.55k,
6, (CKPT)
, STAT, cell physical IO interconnect bytes
,
49152,
9.83k,
20, SYS
, STAT, physical read total bytes
,
29360128,
5.87M,
20, SYS
, STAT, cell physical IO interconnect bytes
,
29360128,
5.87M,
20, SYS
, STAT, physical read bytes
,
29360128,
5.87M,
139, SOE
, STAT, physical read total bytes
,
1835008,
367k,
139, SOE
, STAT, cell physical IO interconnect bytes
,
1835008,
367k,
139, SOE
, STAT, physical read bytes
,
1835008,
367k,
-- End of snap 1, end=2010-03-01 12:00:35, seconds=5

• You can use the same trick with any performance counter
•
•

IOPS – @snappiops
CPU – @snapcpu
www.enkitec.com

31
Snapper v3 – Write output to a tracefile
• Example 4:
• SQL> @snapper ash,trace 30 999999 all
• Uses DBMS_SYSTEM.KSDWRT() for writing to the tracefile
• In above example, a Snapper snapshot is written to a tracefile every 30
seconds (and 999999 times in a row unless you cancel)
• You can run tail -f in OS for realtime Snapper output monitoring
• “all” option instead of a SID stands for all sessions in the database
• Note that gathering V$SESSTAT stats for a lot of sessions frequently is CPUexpensive
• That’s why the “all” option disables V$SESSTAT gathering in Snapper v3.0 by
default
• You can still enable it by adding the gather=… option to collect the stats you want
(read the script header for documentation)

www.enkitec.com

32
Snapper v3 – Advanced Performance Counters
• Over 600 V$SESSTAT performance counters in Oracle 11.2
• One separate set for each session!

• Where are the performance counters documented?
• Oracle Database Reference – “Statistics Descriptions”
• http://download.oracle.com/docs/cd/E14072_01/server.112/e10820/stats002.htm
• Note that the above URL may change when Oracle releases new docs

• tech.E2SN:
• http://tech.e2sn.com/oracle/performance/reference
• I’ll be updating this one over time…

www.enkitec.com

33
Case study – Bad index build performance - 1
• An index build was taking too long time
•
•
•
•

Function based index build on a busy table
Build, not re-build
Ran with ONLINE option
Executed in parallel

• The parallel slaves were doing the full table scan
• But they were waiting for db file sequential read for over 80% of their time
• Why would be the parallel slaves (which did a full table scan) be doing single
block reads so much?

www.enkitec.com

34
Case study – Bad index build performance - 2
--------------------------------------------------------------------------------Total single block IO requests
-- SID, TYPE, STATISTIC
,
DELTA, HDELTA/SEC
=
total IO requests –
--------------------------------------------------------------------------------3768, STAT, session logical reads
, total multi block requests =
11522,
677.76
246 – 51 = 195
3768, STAT, physical read total IO requests
,
4188,
246.35
3768, STAT, physical read total multi block requests,
877,
51.59
3768, STAT, physical read total bytes
,
73924608,
4.35M
3768, STAT, consistent gets
,
11559,
679.94
physical reads is a misleading
3768, STAT, consistent gets from cache
,
11556,
679.76
name – it’s really the number
3768, STAT, consistent gets - examination
36.18
of blocks,
read via PIOs 615,
3768, STAT, physical reads
,
8988,
528.71
3768, STAT, physical reads cache
,
8988,
528.71
3768, STAT, physical read IO requests
,
4197,
246.88
3768, STAT, physical read bytes
,
73637888,
4.33M
3768, STAT, physical reads cache prefetch
,
4752,
279.53
single block reads due
3768, STAT, table scan rows gotten
,
28079,
1.65k
chained / migrated rows!
3768, STAT, table scan blocks gotten
,
7399,
435.24
3768, STAT, table fetch continued row
,
3335,
196.18
3768, STAT, PX local messages sent
,
192,
11.29
3768, WAIT, db file sequential read
,
14393221,
846.66ms
3768, WAIT, db file scattered read
,
1040277,
61.19ms
www.enkitec.com

35
Snapper v3 - Summary
• Oracle Session Snapper is a powerful ad-hoc session-level
performance diagnosis tool which does not require any installation
or database changes!
• Features:
• ASH style session activity sampling
• Reports top SQL, top Waits, etc
• Very useful for drilling down to details when the plain wait interface and SQL
trace do not give enough details
• Takes snapshots of V$ views (V$SESSTAT, etc) and reports deltas
• Report all stats of some sessions (like the advanced diagnosis example)
• Report some stats of all sessions (like the redo or IO example)

• Flexible!
www.enkitec.com

36
Beyond Oracle’s instrumentation
• V$ views, ASH, SQL trace etc will tell you what Oracle thinks is
happening
• They all are based on Oracle’s built-in instrumentation…
• …Which isn’t measuring everything and may have bugs
• If Oracle’s instrumentation lies, all tools on top of that lie

www.enkitec.com

37
Oracle troubleshooting “drilldown” sequence
1. Which sessions, what SQL, wait or not?
•
•

V$SESSION, ASH, SQL Trace, Snapper
Where is the response time spent?

2. Which performance counters increase?
•
•

V$SESSTAT, Snapper
What kind of work Oracle reports to be doing internally?

3. Which Oracle kernel functions are executed
•
•

pstack, DTrace, os_watcher
Exactly what work is Oracle doing internally?

www.enkitec.com

38
Case study – ASSM bug - 1
1. DW on Oracle 10.1.0.3 a few years ago…
2. Inserts in ETL process occasionally very slow
• The wait interface showed log file sync as the main wait event!
• Why would plain INSERT statements wait for log file sync???

3. Perhaps some recursive (autonomous) transactions committing?
•
•
•

There were recursive calls because of triggers, but…
…I ran Snapper on the session – user commits was not increasing!
(…and triggers running in the context of parent transaction can’t commit
anyway)

4. I went through the stats which did increment in V$SESSTAT
•

Incrementing (or decrementing) stats show what kind of operations Oracle
is doing (and how many of them)

www.enkitec.com

39
Case study – ASSM bug – 2
--------------------------------------------------------------------------------- SID, TYPE, STATISTIC
,
DELTA, HDELTA/S
-------------------------------------------------------------------------------319, STAT, recursive calls
,
208,
69.33
319, STAT, session logical reads
,
4002,
1.33k
319, STAT, db block gets
,
3359,
1.12k
86 transaction rollbacks3359,
319, STAT, db block gets from cache
,
1.12k
319, STAT, consistent gets
,
643,
214.33
per second, but no
319, STAT, consistent gets from cache
,
643,
214.33
user rollbacks!!!
319, STAT, consistent gets - examination
,
531,
177
319, STAT, db block changes
,
2503,
834.33
319, STAT, redo synch writes
,
257,
85.67
319, STAT, redo entries
,
1266,
422
319, STAT, redo size
,
401184,
133.73k
319, STAT, redo ordering marks
,
213,
71
319, STAT, undo change vector size
,
122376,
40.79k
319, STAT, rollback changes - undo records applied ,
257,
85.67
319, STAT, transaction rollbacks
,
257,
85.67
319, STAT, commit txn count during cleanout
,
3,
1
319, STAT, active txn count during cleanout
,
271,
90.33
319, STAT, cleanout - number of ktugct calls
,
268,
89.33
319, STAT, execute count
,
208,
69.33
319, WAIT, log file sync
,
2344749, 781.58ms
319, WAIT, db file sequential read
,
28394,
9.46ms
-- End of snap 1
www.enkitec.com

40
Case study – ASSM bug - 3
• Metric definitions from “Statistics Descriptions” @ Reference
Guide:
• transaction rollbacks
• Number of transactions being successfully rolled back

• user rollbacks
• Number of times users manually issue the ROLLBACK statement or an error occurs
during a user's transactions

• Time for a search in Metalink:
• I searched for “transaction rollbacks user rollbacks log file sync”
• ASSM Bug # 4664513 Slow Insert - Waiting For 'log File Sync' - High
'transaction Rollback' Stat ( Base bug# 4288876 )
• ASSM space manager failed to find free space in a block thought to be empty
enough and had to roll back its internal transaction
• Rollbacks also wait for log file sync!!!
www.enkitec.com

41
Case study – ASSM bug - 4
• Long term solution was to patch the database
• Short term workaround was to rebuild the fact table indexes to
FREELIST managed tablespaces
• We started from the latest partitions only as these were where the most
inserts were done

• Note that even though this time the V$SESSTAT stats gave us a good
match in Metalink, I wanted to be sure:
• And I looked into the ultimate (but microscopic) source of information
• The process stack!
• Remember, Oracle is just a program, written in C, so whatever it is doing, it
must be doing it so because of some C function in its kernel
www.enkitec.com

42
Case study – ASSM bug - 5
$ pstack 26490
26490: oracleXYZ
ffffffff7c9a5288
ffffffff7c9a071c
0000000102f78238
0000000100afece0
0000000100aff7a0
0000000100c19198
0000000100aff75c
00000001003d6c4c
0000000100e86fd0
0000000100e84680
0000000100a261c8
00000001009f8728
00000001009bfb88
0000000101ec4984
0000000101e8ea64
000000010067dbe0
000000010067e160
0000000100678bb8
00000001006770b4
0000000101e8f890

semsys – sleep and wake

Read Metalink
note# 175982.1
for more info
about Oracle
kernel modules
and functions

(DESCRIPTION=(LOCAL=YES)(ADDRESS=(PROTOCOL=beq)))
up when someone posts
semsys
(4, 12440007, semaphore
us via a ffffffff7ffdd78c, 1, ffffffff7ffdd778)
semtimedop (12440007, ffffffff7ffdd78c,kslwait is used for voluntarily going
1, ffffffff7ffdd778, 1
to sleep waiting for someone to
sskgpwwait (ffffffff7ffdd910, f423f, fa000, 0, ffffffff7ffdd91
wake us up. Event 0x64 was log file
ksliwat (10506aae0, 87f323ce8, 0, 0, 0, 10506adf8) + 2c0
sync in
kslwaitns (64, 1, 121, 202cc9, d76, 0) + v$event_name in that version
20
kskthbwt (64, 1, 121, 202cc9, d76, 0) + 98
kslwait (64, 121, 202cc9, 7e7, 908, 0) + 5c kcrf_commit_force is
kcrf_commit_force (380016a10, 380016000, 10506e8e8, 3800169b0,
actually used for sync’ing
kcbchg1 (100e84, 100e89000, dc7c614667b50, 10506ae10, fc00, 10
both commits and
kcbchg (ffffffff7ffde490, 800000000, a0dd00, 100000000, 1, 100
rollbacks!
ktucmt (874a769f0, ffffffff7b9d1ea8, 0, 0, 0, 3) + 5a8
ktuabt (1, 2, 1, 1, 874a769f0, 105000) + 448
ktcrab (874a769f0, 0, 200000, Kernel Transaction ffff) + 128
2, 10506adf8, Undo
Abort transaction
kdisdelete (0, 1131, 104c00, 10506a, ffffffff7ffdef20, 0) + 44
kdisnew_bseg_srch_cbk (ffffffff7ffe2368, ffffffff7ffe0950, 280
Kernel Transaction Space
ktspfpblk (ffffffff7ffe0520, ffffffff7ffe2378, 3, ffffffff7b9d
scan BitMap Block – this
ktspfsrch (5, 3b45ba10, 0, ffffffff7ffe0520, ffffffff7ffe02a8,
function was also
ktspscan_bmb (9, 9, ffffffff7ffe0520, 2, 19, 10) + b8
mentioned in the
ktspgsp_cbk (0, ec11411, fff7, 1, 380000, 1) + 174
Metalink note
kdisnew (101e8d, 1fe8, ffffffff7ffe2368, 101e8d000, 2, fffffff
www.enkitec.com

43
Case study – ASSM bug - 6
0000000101e91aec kdisnewle (ffffffff7b9d7fd8, 3b447592, ffffffff7bb7a9b8, fffff
0000000101eb1d00 kdisle (b5, 0, 55, 0, 2, ffffffff7ffe6dc0) + 1500
0000000101de2ca8 kdiins0 (b5, 0, 1fe8, ffffffff7fff33b8, ffffffff7ffe6dc0, 0) +
kdi = Kernel Data Index
0000000101e2ca40 kdiins (831cdef10, 0, 0, ffffffff7fff33b8, 2000000000000, ff)
management
0000000101cbe2cc kauxsin (105068000, 10506f, 105000, 105068860, 105068, 0) + 88
0000000102388d8c insidx (1, 0, 0, 0, 0, 0) + 2ec
0000000102385660 insrow (8678f63c8, ffffffff7fff5e40, 40000681, ffffffff7bb6eea
0000000102384910 insdrv (4f, 40000681, 105068860, 10000, ffffffff7fff6460, 4000
00000001023839fc inscovexe (40000681, 1c01, 1050683c0,insert a row
4000, 7b9aebd88, fffffff
0000000102395710 insExecStmtExecIniEngine (867818710, 8678f63c8, ffffffff7fff76
0000000102384148 insexe (105074, 7f1, 2e5, 10506aae0, 105070a14, ffffffff7ba19e
0000000101acf090 opiexe (e, ffffffff7bc68ee8, ffffffff7fff6fb0, 0, 1, ffffffff7
0000000101ad7be8 opipls (1, 20, ffffffff7bc60210, ffffffff7bb6dce0, 2, ffffffff
00000001002d0058 opiodr (6, 10506ae10, 10434cfb0, Oracle Program Interface
10506a, 105000, 104000) + 598
00000001002d4ec0 rpidrus (ffffffff7fff8810, 105067f18,execute cursor 86f5cb288, 86
– 105068860,
0000000102f615e4 skgmstack (ffffffff7fff8a38, ffffffff7f87cf7f, ffffffff7fff897
00000001002d504c rpidru (ffffffff7fff9130, 10422b000, 10422a918, 104229598, 410
00000001002d4808 rpiswu2 (0, 104556000, ffffffff7fff8b78, 2, 104556418, fffffff
Recursive Program Interface - set
...some functions snipped...
up a recursive call. This is
00000001002cc174 opidrv (0, 4, 10506a, 105071450, 0, 3c) + 354
essentially what a “PL/SQL
00000001002c9828 sou2o (ffffffff7fffe6a8, 3c, 4, ffffffff7fffe688, 104aa6000, 1
context switch” 0, means – a
00000001002a7b34 main (2, ffffffff7fffe788, ffffffff7fffe7a0, also 0, 100000000)
recursive call.
00000001002a7a7c _start (0, 0, 0, 0, 0, 0) + 17c

www.enkitec.com

44
MOATS v1.0 - Overview
• MOATS stands for the Mother Of All Tuning Scripts :-)
•
•
•
•
•
•

While Snapper is an ad-hoc, “no footprint”, simple troubleshooting utility…
…MOATS requires installation of a PL/SQL package and optionally tables
MOATS is (will be) more powerful
MOATS automatically displays related performance data
MOATS can be used for constant performance monitoring
MOATS runs on Oracle 10g+
• C’mon people, 9i is ancient ;-)
• Snapper still works on 9.2 too…

www.enkitec.com

45
MOATS v1.0 – Overview
• Written by:
• Adrian Billington – a PL/SQL guru (http://www.oracle-developer.net)
• And me – an Oracle performance geek
• Downloadable from: http://tech.e2sn.com/oracle-scripts-and-tools

• The 1st goal is to write a decent TOP utility for Oracle
• Which should run inside Oracle of course – I mean sqlplus!

• Coming in v2.0:
• Persist session activity samples
– Yet-another-ASH clone based on V$SESSION / X$KSUSE (but better ;-)

• Persistent V$LATCHHOLDER data
• Graphical visualization with PerfSheet
www.enkitec.com

46
MOATS v1.0 – Oracle Top output
SQL> set arraysize 72
SQL> select * from table(moats.top);
MOATS: The Mother Of All Tuning Scripts v1.0 by Tanel Poder & Adrian Billington
http://www.e2sn.com & http://www.oracle-developer.net
+ INSTANCE SUMMARY -----------------------------------------------------------------------------------------+
| Instance: SOL112
| Execs/s:
29.6 | sParse/s:
9.7 | LIOs/s:
4390.1 | Read MB/s:
1.2 |
| Cur Time: 01-Mar 09:38:44 | Calls/s:
20.5 | hParse/s:
4.9 | PhyRD/s:
11.0 | Write MB/s:
0.3 |
| History: 0h 1m 17s
| Commits/s:
0.4 | ccHits/s:
25.8 | PhyWR/s:
3.7 | Redo MB/s:
0.0 |
+------------------------------------------------------------------------------------------------------------+
+ TOP SQL_ID (child#) -----+ TOP SESSIONS ---------+
| 100% | 3jbwa65aqmkvm (0) | 30,28,154,142,14
|
| 40% | (0)
|
|
| 20% | 13sp89mx21tab (0) | 32
|
| 20% | cq8hzxwd7mk8d (0) | 143
|
|
|
|
+--------------------------------------------------+

+ TOP WAITS ------------------------+ WAIT CLASS --+
| 80% | direct path write temp
| User I/O
|
| 20% | log file parallel write
| System I/O
|
| 20% | db file sequential read
| User I/O
|
| 20% | control file parallel write| System I/O
|
| 20% | direct path read
| User I/O
|
+--------------------------------------------------+

+ TOP SQL_ID -- PLAN_HASH --- SQL TEXT ----------------------------------------------------------------------+
3jbwa65aqmkvm
2645209246
SELECT O.ORDER_ID, LINE_ITEM_ID, PRODUCT_ID, UNIT_PRICE, QUANTITY, ORDER_MODE, O
RDER_STATUS, ORDER_TOTAL, SALES_REP_ID, PROMOTION_ID, C.CUSTOMER_ID, CUST_FIRST_
13sp89mx21tab

644658511

SELECT MOATS_ASH_OT( SYSTIMESTAMP, SADDR, SID, SERIAL#, AUDSID, PADDR, USER#, US
ERNAME, COMMAND, OWNERID, TADDR, LOCKWAIT, STATUS, SERVER, SCHEMA#, SCHEMANAME,

cq8hzxwd7mk8d

415205717

SELECT VALUE FROM NLS_DATABASE_PARAMETERS WHERE PARAMETER = 'NLS_NCHAR_CHARACTER
SET'

www.enkitec.com

47
MOATS v1.0 - Architecture
• It’s running in plain old SQLPLUS !
• You heard right, no Perl, Python, Java etc
• Moats.top() is a PL/SQL pipelined function
• Returning 72 rows at a time, then sleeping, returning more rows, etc
• SQLPLUS default arraysize is 15, so use SET ARRAYSIZE 72 first

• We’ve even created a view on top of the pipelined function:
• CREATE OR REPLACE VIEW top AS SELECT * FROM TABLE(moats.top)

• So you can just log on via sqlplus and run:
• SELECT * FROM top;

www.enkitec.com

48
LatchProf and LatchProfX v2.0
• Lath Holder Profiler
• Troubleshoot latch contention by measuring who holds the latch the most
• Note that you should troubleshoot latch contention only when you see
significant waiting for latches!
• By significant I mean a significant part of your query response time
• Some latch contention in (highly concurrent) systems is fine (and healthy)

• Version 2.0 gives 2 major improvements:
• Report SQL_ID (or hash_value in 9i) of the statements causing latches to be
held
• A package for collecting and storing latch holder data over time
• Just like ASH, but not for active sessions, but for “active” latches

www.enkitec.com

49
LatchProf 2.0 Syntax and example
• Syntax:
• @latchprof <what_columns> <sid> <latch_name> <samples>
• @latchprofx <what_columns> <sid> <latch_name> <samples>
• Look inside the scripts for full reference

• Example
• Show top SID and SQL_ID holding a latch (break down by name)
SQL> @latchprof sid,name,sqlid % % 100000
-- LatchProf 2.01 by Tanel Poder ( http://www.tanelpoder.com )
SID
---143
32
143
32
132
32
130

NAME
--------------------cache buffers chains
shared pool
simulator lru latch
shared pool
row cache objects
shared pool
redo writing

SQLID
Held Gets Held % Held ms Avg hold ms
------------- ----- ----- ------- -------- ----------bt4txmkqf7u89 1586 1468
1.59
19.984
.014
529
529
.53
6.665
.013
bt4txmkqf7u89
89
89
.09
1.121
.013
cumzymmfh1uvr
50
50
.05
.630
.013
1
1
.00
.013
.013
0000000000000
1
1
.00
.013
.013
1
1
.00
.013
.013

www.enkitec.com

50
A little detour to hangs, systemstate dumps (if we have time)
• Interpreting hanganalyze dump
• $ grep LEAF tracefile.trc
• LEAF – leaf node in the hang chain
• Fix (or kill) the leaf and the hang goes away

• NLEAF – Not a Leaf
• LEAF_NW – leaf NoWait (on CPU)

• V$WAIT_CHAINS in 11g
• RAC aware, “free” – no Diagnostics Pack licenses needed
• Query V$ view or if you can’t log in even as SYSDBA then:
• $ sqlplus –prelim “/as sysdba”
• SQL> ORADEBUG DIRECT_ACCESS select * from x$ksdhng_chains

• Systemstate dump explorer – it’s very simple! ;-)
• ssexplorer.sh <tracefile>
• Open the output with a fast browser (preferrably Chrome) as systemstate dumps
are large. In some cases pre-filtering is needed to reduce dump size!
www.enkitec.com

51
A set of random little (but useful) scripts
• @pvalid <parameter_name>
• Shows valid values of a multioption parameter
• Uses X$KSPVLD_VALUES -- 10g+
• V$PARAMETER_VALID_VALUES does not show undocumented params

• @hint <name>
• Shows which hints are available from which database version
• Uses V$SQL_HINT – 11g+

• @lt <type>
• Shows the descriptions of enqueue lock types (like TX,TM,KO, etc)
• Shows what these enqueues ID1, ID2 values mean!
• V$LOCK_TYPE --10g+
www.enkitec.com

52
SQL Performance Tools

www.enkitec.com

53
Getting execution plans
• How to not get an execution plan
• Forget about the EXPLAIN PLAN FOR command *
1.
2.

It does not peek bind variable values
It assumes all bind variables are VARCHAR2
– This causes implicit datatype conversions to be added to the plan
– And this may cause the explained plan to be different from the real plan

3.

It uses current optimizer stats and current session’s optimizer environment
–

•

…these may be different from the stats and environment used at the time of the
problem SQL plan compilation

Read the plan directly from the child cursor instead
•
•
•

V$SQL_PLAN (v9.2+)
DBMS_XPLAN.DISPLAY_CURSOR (v10.1+) uses also V$SQL_PLAN
Or grep for STAT# lines in a SQL trace file
www.enkitec.com

54
Cases where we still may need to use the old explain plan
• Estimating DDL execution plans
• EXPLAIN PLAN FOR CREATE TABLE AS SELECT …
• However the limitations mentioned in previous slide still apply

• EXPLAIN PLAN FOR ALTER INDEX REBUILD …

• Testing DML plans in production
• Did I just say that?! ;-)
• Do it it you want to spice up your work life
• Or perhaps even get a new job ;-)

• But if you really do need to do it for whatever reason, then you can still see
the real plan without actually running the DML…

www.enkitec.com

55
Testing in production is a bad idea!
SQL> set transaction read only;
Transaction set.

WARNING! This trick does not work if you are
connected as SYS, as for SYS this command doesn’t do
anything, so your DML would actually run!

SQL> delete t where owner not in (select username from all_users);
delete t where owner not in (select username from all_users)
*
ERROR at line 1:
ORA-01456: may not perform insert/delete/update operation inside a READ ONLY transaction
SQL> select * from table(dbms_xplan.display_cursor);
---------------------------------------------------------------------------------| Id | Operation
| Name | Rows | Bytes | Cost (%CPU)| Time
|
---------------------------------------------------------------------------------|
0 | DELETE STATEMENT
|
|
|
| 1636 (100)|
|
|
1 | DELETE
| T
|
|
|
|
|
|* 2 |
FILTER
|
|
|
|
|
|
|
3 |
TABLE ACCESS FULL
| T
|
299K| 8781K| 1631
(1)| 00:00:20 |
|
4 |
NESTED LOOPS
|
|
1 |
26 |
5
(0)| 00:00:01 |
|
5 |
NESTED LOOPS
|
|
1 |
23 |
4
(0)| 00:00:01 |
|* 6 |
TABLE ACCESS FULL
| USER$ |
1 |
20 |
3
(0)| 00:00:01 |
|
7 |
TABLE ACCESS CLUSTER| TS$
|
1 |
3 |
1
(0)| 00:00:01 |
|* 8 |
INDEX UNIQUE SCAN | I_TS# |
1 |
|
0
(0)|
|
|
9 |
TABLE ACCESS CLUSTER | TS$
|
1 |
3 |
1
(0)| 00:00:01 |
|* 10 |
INDEX UNIQUE SCAN
| I_TS# |
1 |
|
0
(0)|
|
----------------------------------------------------------------------------------

www.enkitec.com

56
Viewing the parameters used for plan compilation
• Optimizer environment is stored inside every child cursor
• V$SQL
• optimizer_env
RAW(839)
• optimizer_env_hash_value NUMBER

• V$SQL_OPTIMIZER_ENV
• V$SES_OPTIMIZER_ENV
• V$SYS_OPTIMIZER_ENV

• Scripts to query the underlying X$ tables
• @sqlopt <hash_value> <child#> <%parameter%>
• @sesopt <sid> <%parameter%>
• @sysopt <%parameter%>

www.enkitec.com

57
Using optimizer_features_enable for troubleshooting
• Very useful for reverting back to “old” behavior after upgrade
• At session / application level
• With ALTER SESSION

• Or at SQL statement level
• Using OPTIMIZER_FEATURES_ENABLE(’<version>’) hint

• But also very useful for troubleshooting SQL issues after upgrade –
easy way to narrow down some issues
• The first things I check when some SQL runs badly after upgrade
1.
2.

The execution plan (obviously)
The differences in (undocumented) optimizer parameters
–
–

Using sqlopt.sql for a specific SQL (need to run it on both old and new db)
Or a script which gives me the optimizer parameter changes between any Oracle
database release (see next slide)

www.enkitec.com

58
Compare optimizer_features_enable impact
• Create the opt_param_matrix table
• SQL> @tools/optimizer/optimizer_features_matrix.sql

• Report parameter differences with @cofep.sql
SQL> @cofep.sql 10.2.0.4 11.1.0.7
Compare Optimizer_Features_Enable Parameter differences for values
10.2.0.4 and 11.1.0.7
PARAMETER
---------------------------------------_bloom_folding_enabled
_bloom_pruning_enabled
_first_k_rows_dynamic_proration
_nlj_batching_enabled
_optimizer_adaptive_cursor_sharing
_optimizer_enable_density_improvements
_optimizer_enable_extended_stats
_optimizer_extend_jppd_view_types
_optimizer_extended_cursor_sharing_rel
_optimizer_extended_stats_usage_control
...

'10.2.0.4'
---------FALSE
FALSE
FALSE
0
FALSE
FALSE
FALSE
FALSE
NONE
255

www.enkitec.com

'11.1.0.7'
---------TRUE
TRUE
TRUE
1
TRUE
TRUE
TRUE
TRUE
SIMPLE
224

59
Reading execution plans – on one slide
• Execution plan is a tree
• Tree of row source operators (which are internally just C functions)

• Root of the tree is where all “matching” rows are pulled from the
leaves
• Root is the execution plan line with ID=0 (top line in the plan output)
• For SELECT STATEMENT the root operation passes rows to OPI Fetch which
sends the rows back to client
• For DML, the root operation will modify the rows returned to it from
branches under it

• Tree hierarchy
• Every row source in the tree can get input only from its direct children
• CBO can push predicates deeper towards the leaves of the tree

• Data access starts from the first leaf operation of the tree *
• Joins can join only two child row sources together at a time
www.enkitec.com

60
Flexible DBMS_XPLAN.DISPLAY_CURSOR alternatives
• XM (eXplain from Memory) scripts
• @xmsh <hash_value> <child#>
• eXplain from Memory with Statistics by hash_value)

• @xmsi <sqlid> <child#>
• eXplain from Memory with Statistics by SQL ID)

• @xms
• eXplain from Memory with statistics – last SQL executed in current session)

• They use V$SQL_PLAN% views
•
•
•
•

just like DBMS_XPLAN.DISPLAY_CURSOR does
They work from Oracle 9.2
They report better detail than DBMS_XPLAN.DISPLAY_CURSOR does
DML example – report consistent gets vs current gets
www.enkitec.com

61
Profiling execution plans - 1
• Just like you can profile which SQLs take most of the application
response time, you can profile which SQL execution plan lines take
most of a SQL statement response time
• alter session set statistics_level = all
• Or _rowsource_execution_statistics = true
• Works since 9.2

• gather_plan_statistics hint
• Works from 10.2

• SQL_TRACE enables plan profiling too – for newly parsed cursors!
• You can verify it by looking into the sqlstat_enabled compilation environment
parameter (using @sqlopt.sql)

www.enkitec.com

62
Profiling execution plans - 2
• The V$SQL_PLAN_STATISTICS[_ALL] views are updated at the end of
the call (fetch for example)
• If the statement is already overrunning its time, you can cancel it with
CTRL+C, resource manager or even kill the session (but not the process)
• And the statistics up to the query cancellation will be loaded to
V$SQL_PLAN_STATISTICS

• Since 11g, ASH samples current execution plan line info too!
• _rowsource_profiling_statistics = true by default
• Populates new columns in V$ACTIVE_SESSION_HISTORY:
• SQL_PLAN_LINE_ID
– corresponds to the ID in V$SQL_PLAN
• SQL_PLAN_OPERATION – for example: TABLE ACCESS
• SQL_PLAN_OPTIONS – for example: FULL

www.enkitec.com

63
Profiling execution plans - 3
• Starting from 10g, the rowsource function elapsed times are
sampled (not every row source call is timed)
• The sampled times are extrapolated and accounted to the rowsource which
was active during the sample
• This may skew the profile stats in some cases
• You can set the _rowsource_statistics_sampfreq lower for test run
• Must be power of 2 (default is 128)
• Note that the CPU usage goes much higher (especially with NL joins)
-------------------------------------------------------------------------------------------------| Id | Operation
| Name
| Starts | E-Rows | A-Rows |
A-Time
|
-------------------------------------------------------------------------------------------------|
0 | SELECT STATEMENT
|
|
1 |
|
1 |00:00:01.10 |
|
1 | SORT AGGREGATE
|
|
1 |
1 |
1 |00:00:01.10 |
|
2 |
VIEW
| DBA_SOURCE
|
1 |
589K|
624K|00:00:03.58 |
|
3 |
UNION-ALL
|
|
1 |
|
624K|00:00:03.02 |
|* 4 |
FILTER
|
|
1 |
|
624K|00:00:01.91 |
|* 5 |
HASH JOIN
|
|
1 |
589K|
624K|00:00:01.09 |
|* 6 |
HASH JOIN
|
|
1 |
6446 |
6899 |00:00:00.04 |
|
7 |
INDEX FULL SCAN
| I_USER2
|
1 |
100 |
101 |00:00:00.01 |
|* 8 |
HASH JOIN
|
|
1 |
6446 |
6899 |00:00:00.03 |

www.enkitec.com

64
Visualizing execution plan profiles
• Challenge
• The elapsed time figures reported by SQL plan profiling are cumulative
• They include time spent:
• In the execution plan line (rowsource) itself
• All child rowsources “under” it in the execution plan tree

• It’s not convenient to manually calculate the real non-cumulative runtimes
• Especially for large plans
•

PlanViz - http://tech.e2sn.com/apps/planviz/

• Free online execution plan hierarchy and response time profile visualizer
• Parses DBMS_XPLAN.DISPLAY(_CURSOR) output
• Calculates the non-cumulative A-Time values
• Visualizes the plan profile for quick drilldown
www.enkitec.com

65
PlanViz

The right side height of
the box shows the
individual row source’s
elapsed time
The left side height
shows the cumulative
elapsed time of the row
source (and its children)

www.enkitec.com

66
Reading PlanViz plan output - 1

The #5 hash join
(light green) itself
takes 1/3 of total
execution time of
the plan.
The #5 hash join
and all its
children/grandchi
ldren
(#6,7,8,9,10) take
over 50% of total
response time

www.enkitec.com

67
Reading PlanViz plan output- 2
The #6 hash join
(light green) itself
takes 1/4 of total
execution time of
the plan.

The #6 hash join
and all its
children/grandchi
ldren take over
50% of total
response time

www.enkitec.com

68
Reading PlanViz plan output – 3 (continued)
• Color row sources by time spent in them
Select color by Time

Color meanings – it’s a range
•Red is the “most” time of this plan
•Blue – “least” of time
•And colors in between represent
time amounts in between “most”
and “least”
This is useful for easy visual
spotting of things of interest, but to
get exact values, you still need to
look at the numbers!

www.enkitec.com

69
Reading PlanViz plan output – 4 (continued)
• Color row sources by number of rows they return to parent
Select color by Rows

Color meanings – it’s a range
•Red is the “most” of rows in this
plan
•Blue – “least” rows
•And colors in between represent
time amounts in between “most”
and “least”
This is useful for easy visual
spotting of things of interest, but to
get exact values, you still need to
look at the numbers!

www.enkitec.com

70
@descx.sql
@descxx.sql

A better describe command

• @desc
• Shows basic optimizer statistics (also column low/high values)
SQL> @desc obj$
Col#
---1
2
3
4
5
6
7
8
9
10
11
12
13
14
15
16
17
18
19
20
21

Column Name
------------OBJ#
DATAOBJ#
OWNER#
NAME
NAMESPACE
SUBNAME
TYPE#
CTIME
MTIME
STIME
STATUS
REMOTEOWNER
LINKNAME
FLAGS
OID$
SPARE1
SPARE2
SPARE3
SPARE4
SPARE5
SPARE6

Null?
Type
NUM_DISTINCT
DENSITY NUM_NULLS NUM_BUCKETS
---------- ---------------- ------------ ---------- ---------- ----------NOT NULL
NUMBER(,)
74760 .000013376
0
1
NUMBER(,)
9657 .000103552
65059
1
NOT NULL
NUMBER(,)
35 6.6338E-06
0
28
NOT NULL
VARCHAR2(30)
44960 .000040124
0
254
NOT NULL
NUMBER(,)
21 6.6338E-06
0
15
VARCHAR2(30)
577 .00205538
73440
254
NOT NULL
NUMBER(,)
46 6.6338E-06
0
33
NOT NULL
DATE(7)
2671 .001430615
0
254
NOT NULL
DATE(7)
2702 .001455604
0
254
NOT NULL
DATE(7)
2776 .001432665
0
254
NOT NULL
NUMBER(,)
2 6.6338E-06
0
1
VARCHAR2(30)
0
0
74760
0
VARCHAR2(128)
0
0
74760
0
NUMBER(,)
10 6.6338E-06
0
9
RAW(16)
3268 .000305998
71492
1
NUMBER(,)
2
.5
0
1
NUMBER(,)
11 .090909091
0
1
NUMBER(,)
35 6.6338E-06
0
28
VARCHAR2(1000)
0
0
74760
0
VARCHAR2(1000)
0
0
74760
0
DATE(7)
0
0
74760
0

www.enkitec.com

71
See also @xp,
@xph, @xpa scripts
(SQL Monitoring)

Parallel Execution slave communication

• @tq
• Shows how many rows PX slaves have consumed from communications
buffers (Table Queues) in different parallel execution plan phases (TQ_IDs)
SQL> @tq
Show PX Table Queue statistics from last Parallel Execution in this session...
TQ_ID
(DFO,SET) SERVER_TYPE
NUM_ROWS
BYTES
WAITS
TIMEOUTS PROCESS
INSTANCE DFO_NUMBER TQ_ID
---------- ------------- ---------- ---------- ------- ---------- -------- ---------- ---------- -----:TQ10000
Produced
376
1289
0
0 QC
1
1
0
Consumed
94
399
6
3 P007
1
Consumed
94
399
5
1 P005
1
Consumed
94
399
4
0 P004
1
Consumed
94
399
6
1 P006
1
:TQ10001

Produced
Consumed
Consumed
Consumed
Consumed

376
94
94
94
94

2562
1189
1189
1189
1189

0
3
5
4
6

0
0
1
0
1

QC
P007
P005
P004
P006

1
1
1
1
1

1

1

:TQ10002

Produced
Produced
Produced
Produced
Consumed
Consumed
...

6968
7956
9172
3884
6995
6995

132404
150304
171052
72856
131654
131654

3
8
2
8
4
4

2
2
0
1
1
1

P007
P006
P005
P004
P002
P000

1
1
1
1
1
1

1

2

www.enkitec.com

72
Visualization Tools for Performance Analysis

www.enkitec.com

73
PerfSheet v3.0 - Introduction
• Problem:
• Visualize (performance) data
• Do it easily…
• Not manually!
• The manual cycle:
• SELECT -> SPOOL -> FIX -> LOAD TO EXCEL -> FIX -> CREATE CHART

• Solution:
•
•
•
•
•

PerfSheet
Automates the manual cycle above
Nothing more
You still need to write the queries (if the existing ones in there aren’t enough)
PerfSheet (now v3.0) greatly speeds up graphical data analysis work!
www.enkitec.com

74
PerfSheet v3.0 - Demo
SELECT -> FETCH -> LOAD TO EXCEL -> VISUALIZE

www.enkitec.com

75
PerfSheet v3.0 - Architecture
• Requires Excel 2002+
• Does not work on the MacOS Office (No VBA support in Excel 2008)

• Uses MS ADODB
• Oracle (instant) client drivers must be installed and available
• No need for manual ODBC data source setup
• No need for TNSNAMES.ORA or naming configuration!

• When you select a query and hit “Show me!” then PerfSheet will:
1.

2.
3.

Go to Queries Tab and get the SQL text corresponding to the query name
you selected
Log on to database you selected, run the SQL and fetch all data
Create a PivotChart out of the data and visualize it as defined in the
selected View (visualization rules are defined on the Views tab)

www.enkitec.com

76
PerfSheet v3.0 – Setting up your own queries
1. Go to Queries sheet
2. Add new query to the end of the list (follow other examples)
3. Go to front page, select your query in query browser and click
“Show me”
4. Drag & Drop the columns you want to appropriate axis on the
chart
5. Click “Save View As” and type in a view name
•
•

View is just a way to visualize the queries data
You can have multiple views per query to show the same date in a different
way

6. You’re all done
•

You need to save the PerfSheet.xls of course
www.enkitec.com

77
“Free” AWR views in 11g
• Since 11g you may query following AWR views even if you don’t have
Diagnostics Pack license
• DBA_HIST_SEG_STAT
• DBA_HIST_SEG_STAT_OBJ
• DBA_HIST_UNDOSTAT
• Documented in Oracle Licensing Guide
• http://download.oracle.com/docs/cd/B28359_01/license.111/b28287/options.htm#st
href69 (or google for “Free AWR views”, you’ll land on my blog article)
• All data dictionary views beginning with the prefix DBA_HIST_ are part of this pack,
along with their underlying tables. The only exception are the views:
DBA_HIST_SNAPSHOT, DBA_HIST_DATABASE_INSTANCE, DBA_HIST_SNAP_ERROR,
DBA_HIST_SEG_STAT, DBA_HIST_SEG_STAT_OBJ, and DBA_HIST_UNDOSTAT. They can
be used without the Diagnostic Pack license.

• In 10g you’d need to stick with StatsPack level 7
• Or modify the snap() procedure to include segment stats without the execution
plan snapshots (level 6)

www.enkitec.com

78
Demo - Identifying trends inside execution plans
• 11g + ASH only, unfortunately
• Or on Solaris 10 with Dtrace ;-)
• ASH has new SQL_PLAN_LINE_ID column
SQL> desc V$ACTIVE_SESSION_HISTORY
Name
Null?
Type
------------------------------- -------- -------------1
SAMPLE_ID
NUMBER
2
SAMPLE_TIME
TIMESTAMP(3)
4
SESSION_ID
NUMBER
5
SESSION_SERIAL#
NUMBER
9
SQL_ID
VARCHAR2(13)
11
SQL_CHILD_NUMBER
NUMBER
17
SQL_PLAN_HASH_VALUE
NUMBER
18
SQL_PLAN_LINE_ID
NUMBER
19
SQL_PLAN_OPERATION
VARCHAR2(30)
SQL_ID, SQL_CHILD_NUMBER, SQL_PLAN_LINE_ID
SQL_ID, SQL_PLAN_HASH_VALUE,
20
SQL_PLAN_OPTIONS
VARCHAR2(30)
identify the execution plan line if the plan is still in
SQL_PLAN_LINE_ID identify the execution plan
cache. Its still good to join by plan_hash_value as well
to avoid cases where a new plan has been loaded
under the child
www.enkitec.com

line in cases where the SQL has been aged out
from cache (and you need to go to AWR or
StatsPack)

79

Contenu connexe

Tendances

DB Time, Average Active Sessions, and ASH Math - Oracle performance fundamentals
DB Time, Average Active Sessions, and ASH Math - Oracle performance fundamentalsDB Time, Average Active Sessions, and ASH Math - Oracle performance fundamentals
DB Time, Average Active Sessions, and ASH Math - Oracle performance fundamentalsJohn Beresniewicz
 
Oracle db performance tuning
Oracle db performance tuningOracle db performance tuning
Oracle db performance tuningSimon Huang
 
Troubleshooting Complex Oracle Performance Problems with Tanel Poder
Troubleshooting Complex Oracle Performance Problems with Tanel PoderTroubleshooting Complex Oracle Performance Problems with Tanel Poder
Troubleshooting Complex Oracle Performance Problems with Tanel PoderTanel Poder
 
SQL Monitoring in Oracle Database 12c
SQL Monitoring in Oracle Database 12cSQL Monitoring in Oracle Database 12c
SQL Monitoring in Oracle Database 12cTanel Poder
 
Understanding SQL Trace, TKPROF and Execution Plan for beginners
Understanding SQL Trace, TKPROF and Execution Plan for beginnersUnderstanding SQL Trace, TKPROF and Execution Plan for beginners
Understanding SQL Trace, TKPROF and Execution Plan for beginnersCarlos Sierra
 
How a Developer can Troubleshoot a SQL performing poorly on a Production DB
How a Developer can Troubleshoot a SQL performing poorly on a Production DBHow a Developer can Troubleshoot a SQL performing poorly on a Production DB
How a Developer can Troubleshoot a SQL performing poorly on a Production DBCarlos Sierra
 
My First 100 days with an Exadata (PPT)
My First 100 days with an Exadata (PPT)My First 100 days with an Exadata (PPT)
My First 100 days with an Exadata (PPT)Gustavo Rene Antunez
 
Part3 Explain the Explain Plan
Part3 Explain the Explain PlanPart3 Explain the Explain Plan
Part3 Explain the Explain PlanMaria Colgan
 
Oracle RAC 19c: Best Practices and Secret Internals
Oracle RAC 19c: Best Practices and Secret InternalsOracle RAC 19c: Best Practices and Secret Internals
Oracle RAC 19c: Best Practices and Secret InternalsAnil Nair
 
Your tuning arsenal: AWR, ADDM, ASH, Metrics and Advisors
Your tuning arsenal: AWR, ADDM, ASH, Metrics and AdvisorsYour tuning arsenal: AWR, ADDM, ASH, Metrics and Advisors
Your tuning arsenal: AWR, ADDM, ASH, Metrics and AdvisorsJohn Kanagaraj
 
How to find what is making your Oracle database slow
How to find what is making your Oracle database slowHow to find what is making your Oracle database slow
How to find what is making your Oracle database slowSolarWinds
 
Understanding oracle rac internals part 1 - slides
Understanding oracle rac internals   part 1 - slidesUnderstanding oracle rac internals   part 1 - slides
Understanding oracle rac internals part 1 - slidesMohamed Farouk
 
Tanel Poder - Troubleshooting Complex Oracle Performance Issues - Part 2
Tanel Poder - Troubleshooting Complex Oracle Performance Issues - Part 2Tanel Poder - Troubleshooting Complex Oracle Performance Issues - Part 2
Tanel Poder - Troubleshooting Complex Oracle Performance Issues - Part 2Tanel Poder
 
Ash masters : advanced ash analytics on Oracle
Ash masters : advanced ash analytics on Oracle Ash masters : advanced ash analytics on Oracle
Ash masters : advanced ash analytics on Oracle Kyle Hailey
 
Analysis of Database Issues using AHF and Machine Learning v2 - AOUG2022
Analysis of Database Issues using AHF and Machine Learning v2 -  AOUG2022Analysis of Database Issues using AHF and Machine Learning v2 -  AOUG2022
Analysis of Database Issues using AHF and Machine Learning v2 - AOUG2022Sandesh Rao
 
Oracle RAC Internals - The Cache Fusion Edition
Oracle RAC Internals - The Cache Fusion EditionOracle RAC Internals - The Cache Fusion Edition
Oracle RAC Internals - The Cache Fusion EditionMarkus Michalewicz
 
Active dataguard
Active dataguardActive dataguard
Active dataguardManoj Kumar
 

Tendances (20)

DB Time, Average Active Sessions, and ASH Math - Oracle performance fundamentals
DB Time, Average Active Sessions, and ASH Math - Oracle performance fundamentalsDB Time, Average Active Sessions, and ASH Math - Oracle performance fundamentals
DB Time, Average Active Sessions, and ASH Math - Oracle performance fundamentals
 
Oracle db performance tuning
Oracle db performance tuningOracle db performance tuning
Oracle db performance tuning
 
Troubleshooting Complex Oracle Performance Problems with Tanel Poder
Troubleshooting Complex Oracle Performance Problems with Tanel PoderTroubleshooting Complex Oracle Performance Problems with Tanel Poder
Troubleshooting Complex Oracle Performance Problems with Tanel Poder
 
SQL Monitoring in Oracle Database 12c
SQL Monitoring in Oracle Database 12cSQL Monitoring in Oracle Database 12c
SQL Monitoring in Oracle Database 12c
 
Understanding SQL Trace, TKPROF and Execution Plan for beginners
Understanding SQL Trace, TKPROF and Execution Plan for beginnersUnderstanding SQL Trace, TKPROF and Execution Plan for beginners
Understanding SQL Trace, TKPROF and Execution Plan for beginners
 
How a Developer can Troubleshoot a SQL performing poorly on a Production DB
How a Developer can Troubleshoot a SQL performing poorly on a Production DBHow a Developer can Troubleshoot a SQL performing poorly on a Production DB
How a Developer can Troubleshoot a SQL performing poorly on a Production DB
 
My First 100 days with an Exadata (PPT)
My First 100 days with an Exadata (PPT)My First 100 days with an Exadata (PPT)
My First 100 days with an Exadata (PPT)
 
Part3 Explain the Explain Plan
Part3 Explain the Explain PlanPart3 Explain the Explain Plan
Part3 Explain the Explain Plan
 
Oracle RAC 19c: Best Practices and Secret Internals
Oracle RAC 19c: Best Practices and Secret InternalsOracle RAC 19c: Best Practices and Secret Internals
Oracle RAC 19c: Best Practices and Secret Internals
 
Your tuning arsenal: AWR, ADDM, ASH, Metrics and Advisors
Your tuning arsenal: AWR, ADDM, ASH, Metrics and AdvisorsYour tuning arsenal: AWR, ADDM, ASH, Metrics and Advisors
Your tuning arsenal: AWR, ADDM, ASH, Metrics and Advisors
 
How to find what is making your Oracle database slow
How to find what is making your Oracle database slowHow to find what is making your Oracle database slow
How to find what is making your Oracle database slow
 
AWR and ASH Deep Dive
AWR and ASH Deep DiveAWR and ASH Deep Dive
AWR and ASH Deep Dive
 
Understanding oracle rac internals part 1 - slides
Understanding oracle rac internals   part 1 - slidesUnderstanding oracle rac internals   part 1 - slides
Understanding oracle rac internals part 1 - slides
 
Tanel Poder - Troubleshooting Complex Oracle Performance Issues - Part 2
Tanel Poder - Troubleshooting Complex Oracle Performance Issues - Part 2Tanel Poder - Troubleshooting Complex Oracle Performance Issues - Part 2
Tanel Poder - Troubleshooting Complex Oracle Performance Issues - Part 2
 
Ash masters : advanced ash analytics on Oracle
Ash masters : advanced ash analytics on Oracle Ash masters : advanced ash analytics on Oracle
Ash masters : advanced ash analytics on Oracle
 
AWR reports-Measuring CPU
AWR reports-Measuring CPUAWR reports-Measuring CPU
AWR reports-Measuring CPU
 
Analysis of Database Issues using AHF and Machine Learning v2 - AOUG2022
Analysis of Database Issues using AHF and Machine Learning v2 -  AOUG2022Analysis of Database Issues using AHF and Machine Learning v2 -  AOUG2022
Analysis of Database Issues using AHF and Machine Learning v2 - AOUG2022
 
SQL Tuning 101
SQL Tuning 101SQL Tuning 101
SQL Tuning 101
 
Oracle RAC Internals - The Cache Fusion Edition
Oracle RAC Internals - The Cache Fusion EditionOracle RAC Internals - The Cache Fusion Edition
Oracle RAC Internals - The Cache Fusion Edition
 
Active dataguard
Active dataguardActive dataguard
Active dataguard
 

Similaire à Tanel Poder Oracle Scripts and Tools (2010)

PowerShellForDBDevelopers
PowerShellForDBDevelopersPowerShellForDBDevelopers
PowerShellForDBDevelopersBryan Cafferky
 
Rajnish singh(presentation on oracle )
Rajnish singh(presentation on  oracle )Rajnish singh(presentation on  oracle )
Rajnish singh(presentation on oracle )Rajput Rajnish
 
Performance Benchmarking: Tips, Tricks, and Lessons Learned
Performance Benchmarking: Tips, Tricks, and Lessons LearnedPerformance Benchmarking: Tips, Tricks, and Lessons Learned
Performance Benchmarking: Tips, Tricks, and Lessons LearnedTim Callaghan
 
Oracle Fusion Middleware provisioning with Puppet
Oracle Fusion Middleware provisioning with PuppetOracle Fusion Middleware provisioning with Puppet
Oracle Fusion Middleware provisioning with PuppetEdwin Biemond
 
Oracle Linux and Oracle Database - A Trusted Combination
Oracle Linux and Oracle Database - A Trusted Combination Oracle Linux and Oracle Database - A Trusted Combination
Oracle Linux and Oracle Database - A Trusted Combination Guatemala User Group
 
Docker 102 - Immutable Infrastructure
Docker 102 - Immutable InfrastructureDocker 102 - Immutable Infrastructure
Docker 102 - Immutable InfrastructureAdrian Otto
 
SQLcl the next generation of SQLPlus?
SQLcl the next generation of SQLPlus?SQLcl the next generation of SQLPlus?
SQLcl the next generation of SQLPlus?Zohar Elkayam
 
Creating a Benchmarking Infrastructure That Just Works
Creating a Benchmarking Infrastructure That Just WorksCreating a Benchmarking Infrastructure That Just Works
Creating a Benchmarking Infrastructure That Just WorksTim Callaghan
 
PowerShell for Penetration Testers
PowerShell for Penetration TestersPowerShell for Penetration Testers
PowerShell for Penetration TestersNikhil Mittal
 
TryStack: A Sandbox for OpenStack Users and Admins
TryStack: A Sandbox for OpenStack Users and AdminsTryStack: A Sandbox for OpenStack Users and Admins
TryStack: A Sandbox for OpenStack Users and AdminsAnne Gentle
 
Making MySQL Administration a Breeze - A look into a MySQL DBA's toolchest
Making MySQL Administration a Breeze - A look into a MySQL DBA's toolchest Making MySQL Administration a Breeze - A look into a MySQL DBA's toolchest
Making MySQL Administration a Breeze - A look into a MySQL DBA's toolchest Lenz Grimmer
 
Holy PowerShell, BATman! - dogfood edition
Holy PowerShell, BATman! - dogfood editionHoly PowerShell, BATman! - dogfood edition
Holy PowerShell, BATman! - dogfood editionDave Diehl
 
FITC - Node.js 101
FITC - Node.js 101FITC - Node.js 101
FITC - Node.js 101Rami Sayar
 

Similaire à Tanel Poder Oracle Scripts and Tools (2010) (20)

Plantilla oracle
Plantilla oraclePlantilla oracle
Plantilla oracle
 
PowerShellForDBDevelopers
PowerShellForDBDevelopersPowerShellForDBDevelopers
PowerShellForDBDevelopers
 
Rajnish singh(presentation on oracle )
Rajnish singh(presentation on  oracle )Rajnish singh(presentation on  oracle )
Rajnish singh(presentation on oracle )
 
Performance Benchmarking: Tips, Tricks, and Lessons Learned
Performance Benchmarking: Tips, Tricks, and Lessons LearnedPerformance Benchmarking: Tips, Tricks, and Lessons Learned
Performance Benchmarking: Tips, Tricks, and Lessons Learned
 
ow.ppt
ow.pptow.ppt
ow.ppt
 
ow.ppt
ow.pptow.ppt
ow.ppt
 
Ow
OwOw
Ow
 
Oracle Fusion Middleware provisioning with Puppet
Oracle Fusion Middleware provisioning with PuppetOracle Fusion Middleware provisioning with Puppet
Oracle Fusion Middleware provisioning with Puppet
 
Oracle Linux and Oracle Database - A Trusted Combination
Oracle Linux and Oracle Database - A Trusted Combination Oracle Linux and Oracle Database - A Trusted Combination
Oracle Linux and Oracle Database - A Trusted Combination
 
Docker 102 - Immutable Infrastructure
Docker 102 - Immutable InfrastructureDocker 102 - Immutable Infrastructure
Docker 102 - Immutable Infrastructure
 
PowerShell-1
PowerShell-1PowerShell-1
PowerShell-1
 
SQLcl the next generation of SQLPlus?
SQLcl the next generation of SQLPlus?SQLcl the next generation of SQLPlus?
SQLcl the next generation of SQLPlus?
 
Creating a Benchmarking Infrastructure That Just Works
Creating a Benchmarking Infrastructure That Just WorksCreating a Benchmarking Infrastructure That Just Works
Creating a Benchmarking Infrastructure That Just Works
 
PowerShell for Penetration Testers
PowerShell for Penetration TestersPowerShell for Penetration Testers
PowerShell for Penetration Testers
 
DevOps for database
DevOps for databaseDevOps for database
DevOps for database
 
TryStack: A Sandbox for OpenStack Users and Admins
TryStack: A Sandbox for OpenStack Users and AdminsTryStack: A Sandbox for OpenStack Users and Admins
TryStack: A Sandbox for OpenStack Users and Admins
 
Making MySQL Administration a Breeze - A look into a MySQL DBA's toolchest
Making MySQL Administration a Breeze - A look into a MySQL DBA's toolchest Making MySQL Administration a Breeze - A look into a MySQL DBA's toolchest
Making MySQL Administration a Breeze - A look into a MySQL DBA's toolchest
 
Holy PowerShell, BATman! - dogfood edition
Holy PowerShell, BATman! - dogfood editionHoly PowerShell, BATman! - dogfood edition
Holy PowerShell, BATman! - dogfood edition
 
FITC - Node.js 101
FITC - Node.js 101FITC - Node.js 101
FITC - Node.js 101
 
#WeSpeakLinux Session
#WeSpeakLinux Session#WeSpeakLinux Session
#WeSpeakLinux Session
 

Plus de Tanel Poder

Low Level CPU Performance Profiling Examples
Low Level CPU Performance Profiling ExamplesLow Level CPU Performance Profiling Examples
Low Level CPU Performance Profiling ExamplesTanel Poder
 
Modern Linux Performance Tools for Application Troubleshooting
Modern Linux Performance Tools for Application TroubleshootingModern Linux Performance Tools for Application Troubleshooting
Modern Linux Performance Tools for Application TroubleshootingTanel Poder
 
GNW01: In-Memory Processing for Databases
GNW01: In-Memory Processing for DatabasesGNW01: In-Memory Processing for Databases
GNW01: In-Memory Processing for DatabasesTanel Poder
 
SQL in the Hybrid World
SQL in the Hybrid WorldSQL in the Hybrid World
SQL in the Hybrid WorldTanel Poder
 
Troubleshooting Complex Performance issues - Oracle SEG$ contention
Troubleshooting Complex Performance issues - Oracle SEG$ contentionTroubleshooting Complex Performance issues - Oracle SEG$ contention
Troubleshooting Complex Performance issues - Oracle SEG$ contentionTanel Poder
 
Connecting Hadoop and Oracle
Connecting Hadoop and OracleConnecting Hadoop and Oracle
Connecting Hadoop and OracleTanel Poder
 
Oracle Exadata Performance: Latest Improvements and Less Known Features
Oracle Exadata Performance: Latest Improvements and Less Known FeaturesOracle Exadata Performance: Latest Improvements and Less Known Features
Oracle Exadata Performance: Latest Improvements and Less Known FeaturesTanel Poder
 
Oracle Database In-Memory Option in Action
Oracle Database In-Memory Option in ActionOracle Database In-Memory Option in Action
Oracle Database In-Memory Option in ActionTanel Poder
 
Tanel Poder - Troubleshooting Complex Oracle Performance Issues - Part 1
Tanel Poder - Troubleshooting Complex Oracle Performance Issues - Part 1Tanel Poder - Troubleshooting Complex Oracle Performance Issues - Part 1
Tanel Poder - Troubleshooting Complex Oracle Performance Issues - Part 1Tanel Poder
 
Oracle Latch and Mutex Contention Troubleshooting
Oracle Latch and Mutex Contention TroubleshootingOracle Latch and Mutex Contention Troubleshooting
Oracle Latch and Mutex Contention TroubleshootingTanel Poder
 
Oracle LOB Internals and Performance Tuning
Oracle LOB Internals and Performance TuningOracle LOB Internals and Performance Tuning
Oracle LOB Internals and Performance TuningTanel Poder
 

Plus de Tanel Poder (11)

Low Level CPU Performance Profiling Examples
Low Level CPU Performance Profiling ExamplesLow Level CPU Performance Profiling Examples
Low Level CPU Performance Profiling Examples
 
Modern Linux Performance Tools for Application Troubleshooting
Modern Linux Performance Tools for Application TroubleshootingModern Linux Performance Tools for Application Troubleshooting
Modern Linux Performance Tools for Application Troubleshooting
 
GNW01: In-Memory Processing for Databases
GNW01: In-Memory Processing for DatabasesGNW01: In-Memory Processing for Databases
GNW01: In-Memory Processing for Databases
 
SQL in the Hybrid World
SQL in the Hybrid WorldSQL in the Hybrid World
SQL in the Hybrid World
 
Troubleshooting Complex Performance issues - Oracle SEG$ contention
Troubleshooting Complex Performance issues - Oracle SEG$ contentionTroubleshooting Complex Performance issues - Oracle SEG$ contention
Troubleshooting Complex Performance issues - Oracle SEG$ contention
 
Connecting Hadoop and Oracle
Connecting Hadoop and OracleConnecting Hadoop and Oracle
Connecting Hadoop and Oracle
 
Oracle Exadata Performance: Latest Improvements and Less Known Features
Oracle Exadata Performance: Latest Improvements and Less Known FeaturesOracle Exadata Performance: Latest Improvements and Less Known Features
Oracle Exadata Performance: Latest Improvements and Less Known Features
 
Oracle Database In-Memory Option in Action
Oracle Database In-Memory Option in ActionOracle Database In-Memory Option in Action
Oracle Database In-Memory Option in Action
 
Tanel Poder - Troubleshooting Complex Oracle Performance Issues - Part 1
Tanel Poder - Troubleshooting Complex Oracle Performance Issues - Part 1Tanel Poder - Troubleshooting Complex Oracle Performance Issues - Part 1
Tanel Poder - Troubleshooting Complex Oracle Performance Issues - Part 1
 
Oracle Latch and Mutex Contention Troubleshooting
Oracle Latch and Mutex Contention TroubleshootingOracle Latch and Mutex Contention Troubleshooting
Oracle Latch and Mutex Contention Troubleshooting
 
Oracle LOB Internals and Performance Tuning
Oracle LOB Internals and Performance TuningOracle LOB Internals and Performance Tuning
Oracle LOB Internals and Performance Tuning
 

Dernier

Strategies for Landing an Oracle DBA Job as a Fresher
Strategies for Landing an Oracle DBA Job as a FresherStrategies for Landing an Oracle DBA Job as a Fresher
Strategies for Landing an Oracle DBA Job as a FresherRemote DBA Services
 
WSO2's API Vision: Unifying Control, Empowering Developers
WSO2's API Vision: Unifying Control, Empowering DevelopersWSO2's API Vision: Unifying Control, Empowering Developers
WSO2's API Vision: Unifying Control, Empowering DevelopersWSO2
 
Elevate Developer Efficiency & build GenAI Application with Amazon Q​
Elevate Developer Efficiency & build GenAI Application with Amazon Q​Elevate Developer Efficiency & build GenAI Application with Amazon Q​
Elevate Developer Efficiency & build GenAI Application with Amazon Q​Bhuvaneswari Subramani
 
Modular Monolith - a Practical Alternative to Microservices @ Devoxx UK 2024
Modular Monolith - a Practical Alternative to Microservices @ Devoxx UK 2024Modular Monolith - a Practical Alternative to Microservices @ Devoxx UK 2024
Modular Monolith - a Practical Alternative to Microservices @ Devoxx UK 2024Victor Rentea
 
Apidays New York 2024 - APIs in 2030: The Risk of Technological Sleepwalk by ...
Apidays New York 2024 - APIs in 2030: The Risk of Technological Sleepwalk by ...Apidays New York 2024 - APIs in 2030: The Risk of Technological Sleepwalk by ...
Apidays New York 2024 - APIs in 2030: The Risk of Technological Sleepwalk by ...apidays
 
ICT role in 21st century education and its challenges
ICT role in 21st century education and its challengesICT role in 21st century education and its challenges
ICT role in 21st century education and its challengesrafiqahmad00786416
 
Six Myths about Ontologies: The Basics of Formal Ontology
Six Myths about Ontologies: The Basics of Formal OntologySix Myths about Ontologies: The Basics of Formal Ontology
Six Myths about Ontologies: The Basics of Formal Ontologyjohnbeverley2021
 
MS Copilot expands with MS Graph connectors
MS Copilot expands with MS Graph connectorsMS Copilot expands with MS Graph connectors
MS Copilot expands with MS Graph connectorsNanddeep Nachan
 
Corporate and higher education May webinar.pptx
Corporate and higher education May webinar.pptxCorporate and higher education May webinar.pptx
Corporate and higher education May webinar.pptxRustici Software
 
FWD Group - Insurer Innovation Award 2024
FWD Group - Insurer Innovation Award 2024FWD Group - Insurer Innovation Award 2024
FWD Group - Insurer Innovation Award 2024The Digital Insurer
 
Why Teams call analytics are critical to your entire business
Why Teams call analytics are critical to your entire businessWhy Teams call analytics are critical to your entire business
Why Teams call analytics are critical to your entire businesspanagenda
 
Navigating the Deluge_ Dubai Floods and the Resilience of Dubai International...
Navigating the Deluge_ Dubai Floods and the Resilience of Dubai International...Navigating the Deluge_ Dubai Floods and the Resilience of Dubai International...
Navigating the Deluge_ Dubai Floods and the Resilience of Dubai International...Orbitshub
 
Biography Of Angeliki Cooney | Senior Vice President Life Sciences | Albany, ...
Biography Of Angeliki Cooney | Senior Vice President Life Sciences | Albany, ...Biography Of Angeliki Cooney | Senior Vice President Life Sciences | Albany, ...
Biography Of Angeliki Cooney | Senior Vice President Life Sciences | Albany, ...Angeliki Cooney
 
EMPOWERMENT TECHNOLOGY GRADE 11 QUARTER 2 REVIEWER
EMPOWERMENT TECHNOLOGY GRADE 11 QUARTER 2 REVIEWEREMPOWERMENT TECHNOLOGY GRADE 11 QUARTER 2 REVIEWER
EMPOWERMENT TECHNOLOGY GRADE 11 QUARTER 2 REVIEWERMadyBayot
 
Polkadot JAM Slides - Token2049 - By Dr. Gavin Wood
Polkadot JAM Slides - Token2049 - By Dr. Gavin WoodPolkadot JAM Slides - Token2049 - By Dr. Gavin Wood
Polkadot JAM Slides - Token2049 - By Dr. Gavin WoodJuan lago vázquez
 
presentation ICT roal in 21st century education
presentation ICT roal in 21st century educationpresentation ICT roal in 21st century education
presentation ICT roal in 21st century educationjfdjdjcjdnsjd
 
Apidays New York 2024 - The value of a flexible API Management solution for O...
Apidays New York 2024 - The value of a flexible API Management solution for O...Apidays New York 2024 - The value of a flexible API Management solution for O...
Apidays New York 2024 - The value of a flexible API Management solution for O...apidays
 
CNIC Information System with Pakdata Cf In Pakistan
CNIC Information System with Pakdata Cf In PakistanCNIC Information System with Pakdata Cf In Pakistan
CNIC Information System with Pakdata Cf In Pakistandanishmna97
 
MINDCTI Revenue Release Quarter One 2024
MINDCTI Revenue Release Quarter One 2024MINDCTI Revenue Release Quarter One 2024
MINDCTI Revenue Release Quarter One 2024MIND CTI
 

Dernier (20)

Strategies for Landing an Oracle DBA Job as a Fresher
Strategies for Landing an Oracle DBA Job as a FresherStrategies for Landing an Oracle DBA Job as a Fresher
Strategies for Landing an Oracle DBA Job as a Fresher
 
WSO2's API Vision: Unifying Control, Empowering Developers
WSO2's API Vision: Unifying Control, Empowering DevelopersWSO2's API Vision: Unifying Control, Empowering Developers
WSO2's API Vision: Unifying Control, Empowering Developers
 
Elevate Developer Efficiency & build GenAI Application with Amazon Q​
Elevate Developer Efficiency & build GenAI Application with Amazon Q​Elevate Developer Efficiency & build GenAI Application with Amazon Q​
Elevate Developer Efficiency & build GenAI Application with Amazon Q​
 
Modular Monolith - a Practical Alternative to Microservices @ Devoxx UK 2024
Modular Monolith - a Practical Alternative to Microservices @ Devoxx UK 2024Modular Monolith - a Practical Alternative to Microservices @ Devoxx UK 2024
Modular Monolith - a Practical Alternative to Microservices @ Devoxx UK 2024
 
Apidays New York 2024 - APIs in 2030: The Risk of Technological Sleepwalk by ...
Apidays New York 2024 - APIs in 2030: The Risk of Technological Sleepwalk by ...Apidays New York 2024 - APIs in 2030: The Risk of Technological Sleepwalk by ...
Apidays New York 2024 - APIs in 2030: The Risk of Technological Sleepwalk by ...
 
ICT role in 21st century education and its challenges
ICT role in 21st century education and its challengesICT role in 21st century education and its challenges
ICT role in 21st century education and its challenges
 
Six Myths about Ontologies: The Basics of Formal Ontology
Six Myths about Ontologies: The Basics of Formal OntologySix Myths about Ontologies: The Basics of Formal Ontology
Six Myths about Ontologies: The Basics of Formal Ontology
 
MS Copilot expands with MS Graph connectors
MS Copilot expands with MS Graph connectorsMS Copilot expands with MS Graph connectors
MS Copilot expands with MS Graph connectors
 
Understanding the FAA Part 107 License ..
Understanding the FAA Part 107 License ..Understanding the FAA Part 107 License ..
Understanding the FAA Part 107 License ..
 
Corporate and higher education May webinar.pptx
Corporate and higher education May webinar.pptxCorporate and higher education May webinar.pptx
Corporate and higher education May webinar.pptx
 
FWD Group - Insurer Innovation Award 2024
FWD Group - Insurer Innovation Award 2024FWD Group - Insurer Innovation Award 2024
FWD Group - Insurer Innovation Award 2024
 
Why Teams call analytics are critical to your entire business
Why Teams call analytics are critical to your entire businessWhy Teams call analytics are critical to your entire business
Why Teams call analytics are critical to your entire business
 
Navigating the Deluge_ Dubai Floods and the Resilience of Dubai International...
Navigating the Deluge_ Dubai Floods and the Resilience of Dubai International...Navigating the Deluge_ Dubai Floods and the Resilience of Dubai International...
Navigating the Deluge_ Dubai Floods and the Resilience of Dubai International...
 
Biography Of Angeliki Cooney | Senior Vice President Life Sciences | Albany, ...
Biography Of Angeliki Cooney | Senior Vice President Life Sciences | Albany, ...Biography Of Angeliki Cooney | Senior Vice President Life Sciences | Albany, ...
Biography Of Angeliki Cooney | Senior Vice President Life Sciences | Albany, ...
 
EMPOWERMENT TECHNOLOGY GRADE 11 QUARTER 2 REVIEWER
EMPOWERMENT TECHNOLOGY GRADE 11 QUARTER 2 REVIEWEREMPOWERMENT TECHNOLOGY GRADE 11 QUARTER 2 REVIEWER
EMPOWERMENT TECHNOLOGY GRADE 11 QUARTER 2 REVIEWER
 
Polkadot JAM Slides - Token2049 - By Dr. Gavin Wood
Polkadot JAM Slides - Token2049 - By Dr. Gavin WoodPolkadot JAM Slides - Token2049 - By Dr. Gavin Wood
Polkadot JAM Slides - Token2049 - By Dr. Gavin Wood
 
presentation ICT roal in 21st century education
presentation ICT roal in 21st century educationpresentation ICT roal in 21st century education
presentation ICT roal in 21st century education
 
Apidays New York 2024 - The value of a flexible API Management solution for O...
Apidays New York 2024 - The value of a flexible API Management solution for O...Apidays New York 2024 - The value of a flexible API Management solution for O...
Apidays New York 2024 - The value of a flexible API Management solution for O...
 
CNIC Information System with Pakdata Cf In Pakistan
CNIC Information System with Pakdata Cf In PakistanCNIC Information System with Pakdata Cf In Pakistan
CNIC Information System with Pakdata Cf In Pakistan
 
MINDCTI Revenue Release Quarter One 2024
MINDCTI Revenue Release Quarter One 2024MINDCTI Revenue Release Quarter One 2024
MINDCTI Revenue Release Quarter One 2024
 

Tanel Poder Oracle Scripts and Tools (2010)

  • 1. Scripts and Tools for Oracle Troubleshooting and Advanced Performance Analysis Tanel Põder http://www.enkitec.com http://blog.tanelpoder.com www.enkitec.com 1
  • 2. Intro: About me • Tanel Põder Oracle Database Performance geek Exadata Performance geek Hadoop Performance geek • Enkitec • Consultant • Researcher • Technology Evangelist Expert Oracle Exadata book (with Kerry Osborne and Randy Johnson of Enkitec) www.enkitec.com 2
  • 3. All scripts and tools are downloadable and free • Download the scripts and tools from: • http://blog.tanelpoder.com/files/ • Updates (since I delivered this class in 2010): • I have shut the PlanViz website down so ignore some slides • I haven't updated the PerfSheet v3 tool since 2010 • Luca Canali has built a new PerfSheet v4: • http://canali.web.cern.ch/canali/resources.htm www.enkitec.com 3
  • 4. Intro: About this Training Day - 1 1. 2. 3. 4. Your Performance Database Performance SQL Performance Performance visualization, trending and advanced analysis • We will talk about scripts, tools and a systematic approach to troubleshooting & tuning • Case studies! • Download the scripts and tools from: • http://tech.e2sn.com/oracle-scripts-and-tools www.enkitec.com 4
  • 5. Intro: About this Training Day - 2 • Productivity and speed of action • Both on Unix and Windows clients • Scripts and Tools • • • • Snapper v3.0 MOATS v1.0 LatchProf v2.0 And many more… :-) • Trending & Visual Performance Analysis • Tools • Data Collection (even without Diag Pack licenses) • Visualization - PerfSheet v3.0 www.enkitec.com 5
  • 6. Productivity and speed of action • Talking to Oracle • SQLPLUS still rocks  • …especially in cases where you need to deviate from the usual path • You’ll have a (searchable) history of output of your last commands • On the screen or in a spool/logfile… • You can run your scripts • It’s more “pure” than GUI development tools (which try to be clever, do extra stuff, don’t fetch all data etc) www.enkitec.com 6
  • 7. SQLPLUS on Windows • Configuration • Do NOT use sqlplusw.exe -> • This is what you get when running sqlplus from Start menu • Luckily sqlplusw.exe is gone since 11g! • Use CMD.exe and run sqlplus.exe -> Much better!!! www.enkitec.com 7
  • 8. SQLPLUS on Windows – CMD.exe settings • CMD.exe needs some tweaking… • You should check QuickEdit mode, Increase Screen Buffer size etc 1. 2. 3. www.enkitec.com 8
  • 9. Setting SQLPLUS Window title automatically • Set cmd window title to include database session info • SQL> host title “test” • @i.sql queries session, instance info from V$ views and sets title accordingly • i.sql is automatically called by login.sql if its in SQLPATH directory www.enkitec.com 9
  • 10. SQLPLUS on Windows • Command line history • Up/Down arrow - navigate between commands • CTRL+Left/Right arrow – jump one word left/right • F7 – Display a popup box with command line history • • • • Use up/down arrows to navigate ENTER to execute command Right arrow to put the command to command line for editing First letter of command to jump between commands starting with that letter (case sensitive) • F8 – Retrieve command from history • Type a beginning of the command (for example “sel”) and press F8 • This will jump through all commands starting with “sel” (case sensitive) • List commands from history • SQL> host doskey /history /exename=sqlplus.exe • @h <text> – history script showing old commands with text int them • @ha – history all www.enkitec.com 10
  • 11. SQLPLUS on Windows • Output formatting • @HTML • Uses SET MARKUP ON HTML • Runs the query in SQLPLUS buffer and spools the output to .HTML file • Launches that .HTML file with appropriate OS command • @XLS • Same as above, but spools to an .XLS file and launches it :-) • @CSV • Uses SET COLSEP “,” and spools to a .CSV file www.enkitec.com 11
  • 12. SQLPLUS on Unix / Linux / MacOS • Configuration • Setting xterm title • From shell – echo -ne "033]0; your text here 007” • From SQLPLUS – host echo -ne "033]0; your text here 007” • From vi – set title – set titlelen=20 • Decent terminal emulators • Putty on Windows (small, lightweight and works well!) – http://www.chiark.greenend.org.uk/~sgtatham/putty/ • Terminator on MacOS, Unix, Linux (and apparently Windows) – http://software.jessies.org/terminator/ www.enkitec.com 12
  • 13. SQLPLUS on Unix / Linux / MacOS • Output formatting • Same as on Windows • Launching the HTML file is done with a different command: • MacOS – open command launches the program associated with .HTML extension • Unix/Linux – I just run firefox by default, but you can change it in the script • Terminal with left-right scrolling capability? • I’m using Terminator • (Not the one you can install from Ubuntu repositories) • http://software.jessies.org/terminator/ • However, it needs to install its own terminfo file to function properly! – This will be an issue if you need to SSH into a lot of servers in an enterprise – Good for demoing stuff though!  • SQL> set truncate on • Sqlplus allows you to truncate the columns which don’t fit into the linesize instead of wrapping www.enkitec.com 13
  • 14. SQLPLUS on Unix / Linux / MacOS X • Command line history using RLWRAP • Rlwrap (readline wrapper) adds GNU readline capability for any text mode application • BASH shell has the same functionality built in • Just run rlwrap sqlplus instead of just sqlplus (or any other utility) • Rlwrap gives also tab completion! • If you tell it to… • It can use a wordfile (with Oracle keywords, view, column names) – rlwrap -f • And it can remember every word it sees on the screen! – rlwrap -r www.enkitec.com 14
  • 15. SQLPLUS with RLWRAP – Keyboard shortcuts • Keyboard shortcuts (Emacs mode): • • • • Up/down arrows – navigate command line history CTRL+A – go to beginning of line CTRL+E – go to end of line CTRL+R – search command history backwards • press CTRL+R again to move on to next match • CTRL+S – search command history forward • go “back” from too many CTRL+R’s • ALT+F / ALT+B – Move Forward / Backward by one word • This works if ALT is used as the META key for emacs (check your terminal emulator preferences) • • • • CTRL+K – erase (kill) line from current position to the end of line CTRL+X, BACKSPACE – erase line from current position to the beginning CTRL+W or ALT+BACKSPACE – erase one word at a time CTRL + _ - undo command edit! (or CTRL+X, u) www.enkitec.com 15
  • 16. Installing RLWRAP • Linux • RHEL/OEL/CentOS – Get from here: http://fedoraproject.org/wiki/EPEL • Ubuntu: apt-get install rlwrap • MacOS X – Get it from an open source package site for MacOS • MacPorts - http://www.macports.org/ • DarwinPorts - http://darwinports.com/ • Fink - http://www.finkproject.org/ • Solaris (SPARC and Intel) • http://www.sunfreeware.com/ • On HP-UX there’s a similar built in command: ied • Should also work on Windows with Cygwin • http://blog.tanelpoder.com/2010/05/07/flexible-sqlplus-command-line-history-with-rlwrap/ www.enkitec.com 16
  • 17. Setting up TPT scripts - 1 • Tanel’s Performance Tuning scripts :-) • 500+ scripts which I use “every day” • Most scripts do one thing only (such as show parameter values etc) • Also latest versions of the more sophisticated scripts (Snapper, LatchProfX etc) are in there • Download the .zip file and unzip to a directory: • http://tech.e2sn.com/oracle-scripts-and-tools • Set SQLPATH variable to point to the script directory • Unix: • export SQLPATH=$HOME/tpt • Windows: • set SQLPATH=C:userstaneltpt • Or Right click on My Computer -> Properties -> Advanced Settings -> Environment Variables; and add it there www.enkitec.com 17
  • 18. Setting up TPT scripts - 2 • Edit init.sql (init.sql sets up various sqlplus variables) • Uncomment the appropriate parameters in the SETUP section • It tells sqlplus whether you’re running it on Windows, Unix or MacOS -- SETUP SECTION – -------------------------------------------------------------------- Uncomment the following lines if you run your sqlplus on Windows -------------------------------------------------------------------- def SQLPATH=%SQLPATH% -- def _start=start -- def _delete=del -- host doskey /exename=sqlplus.exe desc=set lines 80 sqlprompt ""$Tdescribe $*$Tset lines 299 sqlprompt "SQL> " ------------------------------------------------------------------- • Edit i.sql (i.sql is the “who am I” script which also sets window title) • Uncomment the appropriate title command in the setup section (EOF) host title &_i_user@&_i_conn [sid=&mysid ser#=&_i_serial spid=&_i_spid … -- host echo -ne "033]0;&_i_user@&_i_inst sid=&mysid,&_i_serial007" www.enkitec.com 18
  • 20. What is Oracle Database activity about? 1. A bunch of sessions • You need a session for doing anything in Oracle 1. Applications use these sessions to execute (PL)SQL cursors • Any database call requires use of a cursor • Including PL/SQL stored procedure calls 1. The cursor execution will do some work • During the execution, the processes either: • Work on CPU – Or at least want to work on CPU, but OS scheduler doesn’t allow them • Do not Work on CPU – They have been put to sleep by OS because of a blocking system call – They have gone to sleep voluntarily, waiting for some event completion www.enkitec.com 20
  • 21. Sampling session activity details over time – Which SQL? SID 10 SELECT A idle SELECT B SID 11 SID 14 SID 15 UPDATE C idle SELECT X SID 12 SID 13 idle SELECT Y SELECT N SELECT N SELECT A idle SELECT N idle UPDATE K SELECT B SELECT A idle idle idle idle SELECT N UPDATE C UPDATE C INSERT Z SEL idle idle COMMIT Time Sample session activity over time -> (v$session) 2 x SELECT A 1 x SELECT X 1 x SELECT Y 1 x SELECT N 3 x SELECT A 1 x SELECT X 1 x SELECT Y 1 x SELECT N www.enkitec.com … 3 x UPDATE C 1 x SELECT X 1 x SELECT Y Count the number of (active) sessions each sample, group by SQL ID 21
  • 22. Sampling session activity – Working or Waiting? SID 10 SELECT A idle SELECT B SID 11 SID 14 SID 15 UPDATE C idle SELECT X SID 12 SID 13 idle SELECT Y SELECT N SELECT A idle SELECT N idle SELECT A SELECT N idle UPDATE K SELECT B idle idle idle SELECT N UPDATE C UPDATE C INSERT Z SEL idle idle COMMIT Time CPU User IO Locks Session count Commit www.enkitec.com Time 22
  • 23. Understanding Database Performance • Performance diagnosis data should have at least these details • Which Sessions? • Which SQL? • Work or wait? -> v$session.sid -> v$session.sql_id, plsql_(sub)program_id -> v$session.state, v$session.event, p1,p2,p3 • When? -> Time when samples were taken • This data can be grouped and summarized by any dimension depending on the “performance question” asked! • The sampled session activity dataset is like a FACT table in DW’s • The existence of a session sample shows that the session was active • The dimension attributes show a large variety of extra details • Which SQL was running, Working or Waiting, Which event, P1,P2.. www.enkitec.com 23
  • 24. A selective list of dimensions for performance analysis Status is ACTIVE for SQL> desc v$session sessions running a Name Null? Type database call (background ------------------------------- -------- ---------------------------sessions are always in a 1 SADDR RAW(8) call) 2 SID NUMBER Easy way to get TOP SQL, 7 USERNAME VARCHAR2(30) just group and count the 12 STATUS VARCHAR2(8) samples by SQL_ID 21 PROGRAM VARCHAR2(48) 25 SQL_ID VARCHAR2(13) 37 PLSQL_OBJECT_ID NUMBER From 10.2.0.3 onwards 38 PLSQL_SUBPROGRAM_ID NUMBER 39 MODULE VARCHAR2(48) you can get easy TOP 41 ACTION VARCHAR2(32) PL/SQL, just group by 45 ROW_WAIT_OBJ# NUMBERTOP PL_SQL_OBJECT_ID/SUBP If you want the 61 CLIENT_IDENTIFIER VARCHAR2(64) ROGRAM_ID and join to BLOCKER, just group the 64 BLOCKING_SESSION NUMBER same columns in samples by 70 EVENT VARCHAR2(64) DBA_PROCEDURES blocking_session 71 P1TEXT VARCHAR2(64) 72 P1 NUMBER 74 P2TEXT For TOP WAITs, just VARCHAR2(64) Very important to 75 P2 group the samples by NUMBER remember: If wait STATE 77 P3TEXT VARCHAR2(64) EVENT where != WAITING, the session 78 P3 NUMBER STATE=WAITING is NOT WAITING (It’s 82 WAIT_CLASS VARCHAR2(64) working on CPU or tries to 85 STATE VARCHAR2(19) get onto CPU) www.enkitec.com 24
  • 25. Instance Activity overview • What is the database (instance) doing right now? • @a.sql – Instance Activity SQL • It takes one ASH style sample of V$SESSION and shows TOP sql/wait • I wrote it to show how easy it is to get an overview of instance activity • But it’s also very short to type – I actually use it regularly :-) • I just run it couple of times in a row! select count(*) , sql_id , case state when 'WAITING' then 'WAITING' else 'ON , case state when 'WAITING' then event else 'On CPU from v$session where status='ACTIVE’ and wait_class != 'Idle' and sid != (select sid from v$mystat where rownum=1) group by sql_id , case state when 'WAITING' then 'WAITING' else 'ON , case state when 'WAITING' then event else 'On CPU order by count(*) desc CPU' end state / runqueue' end event CPU' end / runqueue' end www.enkitec.com 25
  • 26. Snapper v3 - Overview • Major improvement – ASH style session activity sampling! • From V$SESSION / V$SESSION_WAIT (no separate licenses needed) • @snapper ash <total_seconds> <sampling_interval> <SIDs> • Still works all the way from Oracle 9.2 to latest Oracle version • Still NO installation/database changes are needed! • It’s just an anonymous PL/SQL block, parsed on the fly… • Look into the code to see some cool challenges involved!!! • Still free and still has a picture of a real Snapper (fish) in it! ;-) • …and you can still run it directly from web if you feel adventurous • SQL> @http://www.tanelpoder.com/files/scripts/snapper.sql ..... www.enkitec.com 26
  • 27. Snapper v3 – Session Activity Sampling • Example 1a: Single Session troubleshooting: SQL> @snapper ash,gather=n 5 1 32 -- Session Snapper v3.01 by Tanel Poder ( http://www.tanelpoder.com ) ------------------------------- Sampled Session Activity Profile ------------------------ Act% | Wait Event | Wait Class | SQL_ID ----------------------------------------------------------------------------------------84% | db file scattered read | User I/O | g723q6scvr9h8 11% | ON CPU | ON CPU | g723q6scvr9h8 3% | db file sequential read | User I/O | 3% | ON CPU | ON CPU | c0j6cx9kzjf7g SQL> @sqlid g723q6scvr9h8 As we measure a single session, then the max Activity% can be 100% (allow for some rounding errors). HASH_VALUE CH# SQL_TEXT ---------- ---- ----------------------------------------------------------------------431728136 0 /* SQL Analyze(0) */ select the activity is measured less If /*+ full(t) no_parallel(t) no_parallel_index(t) dbms_stats100%, it means that the than cursor_sharing_exact use_weak_name_resl dynamic_sampling(0) no_monitoring was not active the */to_char(count session no_substrb_pad ("SYS_NC00009$")),to_char(substrb(dump(min("SYS_NC00009$"),16,0,32), remaining time (it was idle). www.enkitec.com 27
  • 28. Snapper v3 – Session Activity and Performance Counters • Example 1b: Single Session troubleshooting with perf counters SQL> @snapper ash,stats 5 1 146 -- Session Snapper v3.01 by Tanel Poder ( http://www.tanelpoder.com ) -------------------------------------------------------------------------------------------------------SID, USERNAME , TYPE, STATISTIC , DELTA, HDELTA/SEC, %TIME, -------------------------------------------------------------------------------------------------------146, SYS , STAT, session logical reads , 309970, 61.99k, 146, SYS , STAT, consistent gets , 309966, 61.99k, 146, SYS , STAT, consistent gets from cache , 309967, 61.99k, 146, SYS , STAT, consistent gets from cache (fastpath) , 309968, 61.99k, 146, SYS , STAT, calls to kcmgcs , 1660, 332, 146, SYS , STAT, no work - consistent read gets , 308388, 61.68k, 146, SYS , STAT, table scans (short tables) , 332, 66.4, 146, SYS , STAT, table scan rows gotten , 25006755, 5M, 146, SYS , STAT, table scan blocks gotten , 308415, 61.68k, 146, SYS , TIME, DB CPU , 3960000, 792ms, 79.2% 146, SYS , TIME, sql execute elapsed time , 4059947, 811.99ms, 81.2% 146, SYS , TIME, DB time , 4059947, 811.99ms, 81.2% -- End of snap 1, end=2010-03-01 11:31:10, seconds=5 ---------------------------------- Sampled Session Activity Profile ------------------------------- Act% | Wait Event | Wait Class | SQL_ID --------------------------------------------------------------------------------------------------100% | ON CPU | ON CPU | 7vxd09448zcrx www.enkitec.com 28
  • 29. Snapper v3 – Session Activity Sampling • Example 2: Whole instance overview • You can write any query instead of the list of SIDs: SQL> @snapper ash,stats,gather=n 30 1 "select sid from v$session" -- Session Snapper v3.01 by Tanel Poder ( http://www.tanelpoder.com ) ------------------- Sampled Session Activity Profile ----------------------------- Act% | Wait Event | Wait Class | SQL_ID ---------------------------------------------------------------------------------164% | read by other session | User I/O | 3jbwa65aqmkvm 99% | ON CPU | ON CPU | 7vxd09448zcrx 99% | ON CPU | ON CPU | bt4txmkqf7u89 98% | db file scattered read | User I/O | 3jbwa65aqmkvm 98% | direct path read | User I/O | 3jbwa65aqmkvm 61% | db file scattered read | User I/O | dw2zgaapax1sg 41% | control file parallel wri | System I/O 34% | db file async I/O submit | System I/O 27% | log file parallel write | System I/O As we are measuring more 24% | db file sequential read | User I/O | 0bzhqhhj9mpaa than one session, then it’s ok to see over 100% of activity. 100% stands for all response time of a single session! www.enkitec.com 29
  • 30. Snapper v3 – Performance Counters • Example 3a - Find top REDO geneators SQL> @snapper ash,stats,gather=s,sinclude=redo_size 5 1 "select sid from v$session” -- Session Snapper v3.01 by Tanel Poder ( http://www.tanelpoder.com ) -----------------------------------------------------------------------------------------------SID, USERNAME , TYPE, STATISTIC , DELTA, HDELTA/SEC, -----------------------------------------------------------------------------------------------20, SYS , STAT, redo size , 13376076, 2.68M, 31, SYS , STAT, redo size , 18232, 3.65k, 143, SYS , STAT, redo size , 26796, 5.36k, -- End of snap 1, end=2010-03-01 11:52:47, seconds=5 --------------------------------- Sampled Session Activity Profile ------------------------------ Act% | Wait Event | Wait Class | SQL_ID ------------------------------------------------------------------------------------------------69% | log file parallel write | System I/O 50% | ON CPU | ON CPU | crwqs334cz65x 27% | log buffer space | Configuration | crwqs334cz65x 12% | log buffer space | Configuration | f6f6wxb0st0yp 8% | ON CPU | ON CPU 8% | db file sequential read | User I/O | gvt8zu1k1tsff www.enkitec.com 30
  • 31. Snapper v3 – Performance Counters • Example 3b: • Find top IO throughput (MB) users SQL> @snapper stats,gather=s,sinclude=physical%bytes 5 1 "select sid from v$session" -- Session Snapper v3.01 by Tanel Poder ( http://www.tanelpoder.com ) ----------------------------------------------------------------------------------------------SID, USERNAME , TYPE, STATISTIC , DELTA, HDELTA/SEC, ----------------------------------------------------------------------------------------------6, (CKPT) , STAT, physical read total bytes , 16384, 3.28k, 6, (CKPT) , STAT, physical write total bytes , 32768, 6.55k, 6, (CKPT) , STAT, cell physical IO interconnect bytes , 49152, 9.83k, 20, SYS , STAT, physical read total bytes , 29360128, 5.87M, 20, SYS , STAT, cell physical IO interconnect bytes , 29360128, 5.87M, 20, SYS , STAT, physical read bytes , 29360128, 5.87M, 139, SOE , STAT, physical read total bytes , 1835008, 367k, 139, SOE , STAT, cell physical IO interconnect bytes , 1835008, 367k, 139, SOE , STAT, physical read bytes , 1835008, 367k, -- End of snap 1, end=2010-03-01 12:00:35, seconds=5 • You can use the same trick with any performance counter • • IOPS – @snappiops CPU – @snapcpu www.enkitec.com 31
  • 32. Snapper v3 – Write output to a tracefile • Example 4: • SQL> @snapper ash,trace 30 999999 all • Uses DBMS_SYSTEM.KSDWRT() for writing to the tracefile • In above example, a Snapper snapshot is written to a tracefile every 30 seconds (and 999999 times in a row unless you cancel) • You can run tail -f in OS for realtime Snapper output monitoring • “all” option instead of a SID stands for all sessions in the database • Note that gathering V$SESSTAT stats for a lot of sessions frequently is CPUexpensive • That’s why the “all” option disables V$SESSTAT gathering in Snapper v3.0 by default • You can still enable it by adding the gather=… option to collect the stats you want (read the script header for documentation) www.enkitec.com 32
  • 33. Snapper v3 – Advanced Performance Counters • Over 600 V$SESSTAT performance counters in Oracle 11.2 • One separate set for each session! • Where are the performance counters documented? • Oracle Database Reference – “Statistics Descriptions” • http://download.oracle.com/docs/cd/E14072_01/server.112/e10820/stats002.htm • Note that the above URL may change when Oracle releases new docs • tech.E2SN: • http://tech.e2sn.com/oracle/performance/reference • I’ll be updating this one over time… www.enkitec.com 33
  • 34. Case study – Bad index build performance - 1 • An index build was taking too long time • • • • Function based index build on a busy table Build, not re-build Ran with ONLINE option Executed in parallel • The parallel slaves were doing the full table scan • But they were waiting for db file sequential read for over 80% of their time • Why would be the parallel slaves (which did a full table scan) be doing single block reads so much? www.enkitec.com 34
  • 35. Case study – Bad index build performance - 2 --------------------------------------------------------------------------------Total single block IO requests -- SID, TYPE, STATISTIC , DELTA, HDELTA/SEC = total IO requests – --------------------------------------------------------------------------------3768, STAT, session logical reads , total multi block requests = 11522, 677.76 246 – 51 = 195 3768, STAT, physical read total IO requests , 4188, 246.35 3768, STAT, physical read total multi block requests, 877, 51.59 3768, STAT, physical read total bytes , 73924608, 4.35M 3768, STAT, consistent gets , 11559, 679.94 physical reads is a misleading 3768, STAT, consistent gets from cache , 11556, 679.76 name – it’s really the number 3768, STAT, consistent gets - examination 36.18 of blocks, read via PIOs 615, 3768, STAT, physical reads , 8988, 528.71 3768, STAT, physical reads cache , 8988, 528.71 3768, STAT, physical read IO requests , 4197, 246.88 3768, STAT, physical read bytes , 73637888, 4.33M 3768, STAT, physical reads cache prefetch , 4752, 279.53 single block reads due 3768, STAT, table scan rows gotten , 28079, 1.65k chained / migrated rows! 3768, STAT, table scan blocks gotten , 7399, 435.24 3768, STAT, table fetch continued row , 3335, 196.18 3768, STAT, PX local messages sent , 192, 11.29 3768, WAIT, db file sequential read , 14393221, 846.66ms 3768, WAIT, db file scattered read , 1040277, 61.19ms www.enkitec.com 35
  • 36. Snapper v3 - Summary • Oracle Session Snapper is a powerful ad-hoc session-level performance diagnosis tool which does not require any installation or database changes! • Features: • ASH style session activity sampling • Reports top SQL, top Waits, etc • Very useful for drilling down to details when the plain wait interface and SQL trace do not give enough details • Takes snapshots of V$ views (V$SESSTAT, etc) and reports deltas • Report all stats of some sessions (like the advanced diagnosis example) • Report some stats of all sessions (like the redo or IO example) • Flexible! www.enkitec.com 36
  • 37. Beyond Oracle’s instrumentation • V$ views, ASH, SQL trace etc will tell you what Oracle thinks is happening • They all are based on Oracle’s built-in instrumentation… • …Which isn’t measuring everything and may have bugs • If Oracle’s instrumentation lies, all tools on top of that lie www.enkitec.com 37
  • 38. Oracle troubleshooting “drilldown” sequence 1. Which sessions, what SQL, wait or not? • • V$SESSION, ASH, SQL Trace, Snapper Where is the response time spent? 2. Which performance counters increase? • • V$SESSTAT, Snapper What kind of work Oracle reports to be doing internally? 3. Which Oracle kernel functions are executed • • pstack, DTrace, os_watcher Exactly what work is Oracle doing internally? www.enkitec.com 38
  • 39. Case study – ASSM bug - 1 1. DW on Oracle 10.1.0.3 a few years ago… 2. Inserts in ETL process occasionally very slow • The wait interface showed log file sync as the main wait event! • Why would plain INSERT statements wait for log file sync??? 3. Perhaps some recursive (autonomous) transactions committing? • • • There were recursive calls because of triggers, but… …I ran Snapper on the session – user commits was not increasing! (…and triggers running in the context of parent transaction can’t commit anyway) 4. I went through the stats which did increment in V$SESSTAT • Incrementing (or decrementing) stats show what kind of operations Oracle is doing (and how many of them) www.enkitec.com 39
  • 40. Case study – ASSM bug – 2 --------------------------------------------------------------------------------- SID, TYPE, STATISTIC , DELTA, HDELTA/S -------------------------------------------------------------------------------319, STAT, recursive calls , 208, 69.33 319, STAT, session logical reads , 4002, 1.33k 319, STAT, db block gets , 3359, 1.12k 86 transaction rollbacks3359, 319, STAT, db block gets from cache , 1.12k 319, STAT, consistent gets , 643, 214.33 per second, but no 319, STAT, consistent gets from cache , 643, 214.33 user rollbacks!!! 319, STAT, consistent gets - examination , 531, 177 319, STAT, db block changes , 2503, 834.33 319, STAT, redo synch writes , 257, 85.67 319, STAT, redo entries , 1266, 422 319, STAT, redo size , 401184, 133.73k 319, STAT, redo ordering marks , 213, 71 319, STAT, undo change vector size , 122376, 40.79k 319, STAT, rollback changes - undo records applied , 257, 85.67 319, STAT, transaction rollbacks , 257, 85.67 319, STAT, commit txn count during cleanout , 3, 1 319, STAT, active txn count during cleanout , 271, 90.33 319, STAT, cleanout - number of ktugct calls , 268, 89.33 319, STAT, execute count , 208, 69.33 319, WAIT, log file sync , 2344749, 781.58ms 319, WAIT, db file sequential read , 28394, 9.46ms -- End of snap 1 www.enkitec.com 40
  • 41. Case study – ASSM bug - 3 • Metric definitions from “Statistics Descriptions” @ Reference Guide: • transaction rollbacks • Number of transactions being successfully rolled back • user rollbacks • Number of times users manually issue the ROLLBACK statement or an error occurs during a user's transactions • Time for a search in Metalink: • I searched for “transaction rollbacks user rollbacks log file sync” • ASSM Bug # 4664513 Slow Insert - Waiting For 'log File Sync' - High 'transaction Rollback' Stat ( Base bug# 4288876 ) • ASSM space manager failed to find free space in a block thought to be empty enough and had to roll back its internal transaction • Rollbacks also wait for log file sync!!! www.enkitec.com 41
  • 42. Case study – ASSM bug - 4 • Long term solution was to patch the database • Short term workaround was to rebuild the fact table indexes to FREELIST managed tablespaces • We started from the latest partitions only as these were where the most inserts were done • Note that even though this time the V$SESSTAT stats gave us a good match in Metalink, I wanted to be sure: • And I looked into the ultimate (but microscopic) source of information • The process stack! • Remember, Oracle is just a program, written in C, so whatever it is doing, it must be doing it so because of some C function in its kernel www.enkitec.com 42
  • 43. Case study – ASSM bug - 5 $ pstack 26490 26490: oracleXYZ ffffffff7c9a5288 ffffffff7c9a071c 0000000102f78238 0000000100afece0 0000000100aff7a0 0000000100c19198 0000000100aff75c 00000001003d6c4c 0000000100e86fd0 0000000100e84680 0000000100a261c8 00000001009f8728 00000001009bfb88 0000000101ec4984 0000000101e8ea64 000000010067dbe0 000000010067e160 0000000100678bb8 00000001006770b4 0000000101e8f890 semsys – sleep and wake Read Metalink note# 175982.1 for more info about Oracle kernel modules and functions (DESCRIPTION=(LOCAL=YES)(ADDRESS=(PROTOCOL=beq))) up when someone posts semsys (4, 12440007, semaphore us via a ffffffff7ffdd78c, 1, ffffffff7ffdd778) semtimedop (12440007, ffffffff7ffdd78c,kslwait is used for voluntarily going 1, ffffffff7ffdd778, 1 to sleep waiting for someone to sskgpwwait (ffffffff7ffdd910, f423f, fa000, 0, ffffffff7ffdd91 wake us up. Event 0x64 was log file ksliwat (10506aae0, 87f323ce8, 0, 0, 0, 10506adf8) + 2c0 sync in kslwaitns (64, 1, 121, 202cc9, d76, 0) + v$event_name in that version 20 kskthbwt (64, 1, 121, 202cc9, d76, 0) + 98 kslwait (64, 121, 202cc9, 7e7, 908, 0) + 5c kcrf_commit_force is kcrf_commit_force (380016a10, 380016000, 10506e8e8, 3800169b0, actually used for sync’ing kcbchg1 (100e84, 100e89000, dc7c614667b50, 10506ae10, fc00, 10 both commits and kcbchg (ffffffff7ffde490, 800000000, a0dd00, 100000000, 1, 100 rollbacks! ktucmt (874a769f0, ffffffff7b9d1ea8, 0, 0, 0, 3) + 5a8 ktuabt (1, 2, 1, 1, 874a769f0, 105000) + 448 ktcrab (874a769f0, 0, 200000, Kernel Transaction ffff) + 128 2, 10506adf8, Undo Abort transaction kdisdelete (0, 1131, 104c00, 10506a, ffffffff7ffdef20, 0) + 44 kdisnew_bseg_srch_cbk (ffffffff7ffe2368, ffffffff7ffe0950, 280 Kernel Transaction Space ktspfpblk (ffffffff7ffe0520, ffffffff7ffe2378, 3, ffffffff7b9d scan BitMap Block – this ktspfsrch (5, 3b45ba10, 0, ffffffff7ffe0520, ffffffff7ffe02a8, function was also ktspscan_bmb (9, 9, ffffffff7ffe0520, 2, 19, 10) + b8 mentioned in the ktspgsp_cbk (0, ec11411, fff7, 1, 380000, 1) + 174 Metalink note kdisnew (101e8d, 1fe8, ffffffff7ffe2368, 101e8d000, 2, fffffff www.enkitec.com 43
  • 44. Case study – ASSM bug - 6 0000000101e91aec kdisnewle (ffffffff7b9d7fd8, 3b447592, ffffffff7bb7a9b8, fffff 0000000101eb1d00 kdisle (b5, 0, 55, 0, 2, ffffffff7ffe6dc0) + 1500 0000000101de2ca8 kdiins0 (b5, 0, 1fe8, ffffffff7fff33b8, ffffffff7ffe6dc0, 0) + kdi = Kernel Data Index 0000000101e2ca40 kdiins (831cdef10, 0, 0, ffffffff7fff33b8, 2000000000000, ff) management 0000000101cbe2cc kauxsin (105068000, 10506f, 105000, 105068860, 105068, 0) + 88 0000000102388d8c insidx (1, 0, 0, 0, 0, 0) + 2ec 0000000102385660 insrow (8678f63c8, ffffffff7fff5e40, 40000681, ffffffff7bb6eea 0000000102384910 insdrv (4f, 40000681, 105068860, 10000, ffffffff7fff6460, 4000 00000001023839fc inscovexe (40000681, 1c01, 1050683c0,insert a row 4000, 7b9aebd88, fffffff 0000000102395710 insExecStmtExecIniEngine (867818710, 8678f63c8, ffffffff7fff76 0000000102384148 insexe (105074, 7f1, 2e5, 10506aae0, 105070a14, ffffffff7ba19e 0000000101acf090 opiexe (e, ffffffff7bc68ee8, ffffffff7fff6fb0, 0, 1, ffffffff7 0000000101ad7be8 opipls (1, 20, ffffffff7bc60210, ffffffff7bb6dce0, 2, ffffffff 00000001002d0058 opiodr (6, 10506ae10, 10434cfb0, Oracle Program Interface 10506a, 105000, 104000) + 598 00000001002d4ec0 rpidrus (ffffffff7fff8810, 105067f18,execute cursor 86f5cb288, 86 – 105068860, 0000000102f615e4 skgmstack (ffffffff7fff8a38, ffffffff7f87cf7f, ffffffff7fff897 00000001002d504c rpidru (ffffffff7fff9130, 10422b000, 10422a918, 104229598, 410 00000001002d4808 rpiswu2 (0, 104556000, ffffffff7fff8b78, 2, 104556418, fffffff Recursive Program Interface - set ...some functions snipped... up a recursive call. This is 00000001002cc174 opidrv (0, 4, 10506a, 105071450, 0, 3c) + 354 essentially what a “PL/SQL 00000001002c9828 sou2o (ffffffff7fffe6a8, 3c, 4, ffffffff7fffe688, 104aa6000, 1 context switch” 0, means – a 00000001002a7b34 main (2, ffffffff7fffe788, ffffffff7fffe7a0, also 0, 100000000) recursive call. 00000001002a7a7c _start (0, 0, 0, 0, 0, 0) + 17c www.enkitec.com 44
  • 45. MOATS v1.0 - Overview • MOATS stands for the Mother Of All Tuning Scripts :-) • • • • • • While Snapper is an ad-hoc, “no footprint”, simple troubleshooting utility… …MOATS requires installation of a PL/SQL package and optionally tables MOATS is (will be) more powerful MOATS automatically displays related performance data MOATS can be used for constant performance monitoring MOATS runs on Oracle 10g+ • C’mon people, 9i is ancient ;-) • Snapper still works on 9.2 too… www.enkitec.com 45
  • 46. MOATS v1.0 – Overview • Written by: • Adrian Billington – a PL/SQL guru (http://www.oracle-developer.net) • And me – an Oracle performance geek • Downloadable from: http://tech.e2sn.com/oracle-scripts-and-tools • The 1st goal is to write a decent TOP utility for Oracle • Which should run inside Oracle of course – I mean sqlplus! • Coming in v2.0: • Persist session activity samples – Yet-another-ASH clone based on V$SESSION / X$KSUSE (but better ;-) • Persistent V$LATCHHOLDER data • Graphical visualization with PerfSheet www.enkitec.com 46
  • 47. MOATS v1.0 – Oracle Top output SQL> set arraysize 72 SQL> select * from table(moats.top); MOATS: The Mother Of All Tuning Scripts v1.0 by Tanel Poder & Adrian Billington http://www.e2sn.com & http://www.oracle-developer.net + INSTANCE SUMMARY -----------------------------------------------------------------------------------------+ | Instance: SOL112 | Execs/s: 29.6 | sParse/s: 9.7 | LIOs/s: 4390.1 | Read MB/s: 1.2 | | Cur Time: 01-Mar 09:38:44 | Calls/s: 20.5 | hParse/s: 4.9 | PhyRD/s: 11.0 | Write MB/s: 0.3 | | History: 0h 1m 17s | Commits/s: 0.4 | ccHits/s: 25.8 | PhyWR/s: 3.7 | Redo MB/s: 0.0 | +------------------------------------------------------------------------------------------------------------+ + TOP SQL_ID (child#) -----+ TOP SESSIONS ---------+ | 100% | 3jbwa65aqmkvm (0) | 30,28,154,142,14 | | 40% | (0) | | | 20% | 13sp89mx21tab (0) | 32 | | 20% | cq8hzxwd7mk8d (0) | 143 | | | | +--------------------------------------------------+ + TOP WAITS ------------------------+ WAIT CLASS --+ | 80% | direct path write temp | User I/O | | 20% | log file parallel write | System I/O | | 20% | db file sequential read | User I/O | | 20% | control file parallel write| System I/O | | 20% | direct path read | User I/O | +--------------------------------------------------+ + TOP SQL_ID -- PLAN_HASH --- SQL TEXT ----------------------------------------------------------------------+ 3jbwa65aqmkvm 2645209246 SELECT O.ORDER_ID, LINE_ITEM_ID, PRODUCT_ID, UNIT_PRICE, QUANTITY, ORDER_MODE, O RDER_STATUS, ORDER_TOTAL, SALES_REP_ID, PROMOTION_ID, C.CUSTOMER_ID, CUST_FIRST_ 13sp89mx21tab 644658511 SELECT MOATS_ASH_OT( SYSTIMESTAMP, SADDR, SID, SERIAL#, AUDSID, PADDR, USER#, US ERNAME, COMMAND, OWNERID, TADDR, LOCKWAIT, STATUS, SERVER, SCHEMA#, SCHEMANAME, cq8hzxwd7mk8d 415205717 SELECT VALUE FROM NLS_DATABASE_PARAMETERS WHERE PARAMETER = 'NLS_NCHAR_CHARACTER SET' www.enkitec.com 47
  • 48. MOATS v1.0 - Architecture • It’s running in plain old SQLPLUS ! • You heard right, no Perl, Python, Java etc • Moats.top() is a PL/SQL pipelined function • Returning 72 rows at a time, then sleeping, returning more rows, etc • SQLPLUS default arraysize is 15, so use SET ARRAYSIZE 72 first • We’ve even created a view on top of the pipelined function: • CREATE OR REPLACE VIEW top AS SELECT * FROM TABLE(moats.top) • So you can just log on via sqlplus and run: • SELECT * FROM top; www.enkitec.com 48
  • 49. LatchProf and LatchProfX v2.0 • Lath Holder Profiler • Troubleshoot latch contention by measuring who holds the latch the most • Note that you should troubleshoot latch contention only when you see significant waiting for latches! • By significant I mean a significant part of your query response time • Some latch contention in (highly concurrent) systems is fine (and healthy) • Version 2.0 gives 2 major improvements: • Report SQL_ID (or hash_value in 9i) of the statements causing latches to be held • A package for collecting and storing latch holder data over time • Just like ASH, but not for active sessions, but for “active” latches www.enkitec.com 49
  • 50. LatchProf 2.0 Syntax and example • Syntax: • @latchprof <what_columns> <sid> <latch_name> <samples> • @latchprofx <what_columns> <sid> <latch_name> <samples> • Look inside the scripts for full reference • Example • Show top SID and SQL_ID holding a latch (break down by name) SQL> @latchprof sid,name,sqlid % % 100000 -- LatchProf 2.01 by Tanel Poder ( http://www.tanelpoder.com ) SID ---143 32 143 32 132 32 130 NAME --------------------cache buffers chains shared pool simulator lru latch shared pool row cache objects shared pool redo writing SQLID Held Gets Held % Held ms Avg hold ms ------------- ----- ----- ------- -------- ----------bt4txmkqf7u89 1586 1468 1.59 19.984 .014 529 529 .53 6.665 .013 bt4txmkqf7u89 89 89 .09 1.121 .013 cumzymmfh1uvr 50 50 .05 .630 .013 1 1 .00 .013 .013 0000000000000 1 1 .00 .013 .013 1 1 .00 .013 .013 www.enkitec.com 50
  • 51. A little detour to hangs, systemstate dumps (if we have time) • Interpreting hanganalyze dump • $ grep LEAF tracefile.trc • LEAF – leaf node in the hang chain • Fix (or kill) the leaf and the hang goes away • NLEAF – Not a Leaf • LEAF_NW – leaf NoWait (on CPU) • V$WAIT_CHAINS in 11g • RAC aware, “free” – no Diagnostics Pack licenses needed • Query V$ view or if you can’t log in even as SYSDBA then: • $ sqlplus –prelim “/as sysdba” • SQL> ORADEBUG DIRECT_ACCESS select * from x$ksdhng_chains • Systemstate dump explorer – it’s very simple! ;-) • ssexplorer.sh <tracefile> • Open the output with a fast browser (preferrably Chrome) as systemstate dumps are large. In some cases pre-filtering is needed to reduce dump size! www.enkitec.com 51
  • 52. A set of random little (but useful) scripts • @pvalid <parameter_name> • Shows valid values of a multioption parameter • Uses X$KSPVLD_VALUES -- 10g+ • V$PARAMETER_VALID_VALUES does not show undocumented params • @hint <name> • Shows which hints are available from which database version • Uses V$SQL_HINT – 11g+ • @lt <type> • Shows the descriptions of enqueue lock types (like TX,TM,KO, etc) • Shows what these enqueues ID1, ID2 values mean! • V$LOCK_TYPE --10g+ www.enkitec.com 52
  • 54. Getting execution plans • How to not get an execution plan • Forget about the EXPLAIN PLAN FOR command * 1. 2. It does not peek bind variable values It assumes all bind variables are VARCHAR2 – This causes implicit datatype conversions to be added to the plan – And this may cause the explained plan to be different from the real plan 3. It uses current optimizer stats and current session’s optimizer environment – • …these may be different from the stats and environment used at the time of the problem SQL plan compilation Read the plan directly from the child cursor instead • • • V$SQL_PLAN (v9.2+) DBMS_XPLAN.DISPLAY_CURSOR (v10.1+) uses also V$SQL_PLAN Or grep for STAT# lines in a SQL trace file www.enkitec.com 54
  • 55. Cases where we still may need to use the old explain plan • Estimating DDL execution plans • EXPLAIN PLAN FOR CREATE TABLE AS SELECT … • However the limitations mentioned in previous slide still apply • EXPLAIN PLAN FOR ALTER INDEX REBUILD … • Testing DML plans in production • Did I just say that?! ;-) • Do it it you want to spice up your work life • Or perhaps even get a new job ;-) • But if you really do need to do it for whatever reason, then you can still see the real plan without actually running the DML… www.enkitec.com 55
  • 56. Testing in production is a bad idea! SQL> set transaction read only; Transaction set. WARNING! This trick does not work if you are connected as SYS, as for SYS this command doesn’t do anything, so your DML would actually run! SQL> delete t where owner not in (select username from all_users); delete t where owner not in (select username from all_users) * ERROR at line 1: ORA-01456: may not perform insert/delete/update operation inside a READ ONLY transaction SQL> select * from table(dbms_xplan.display_cursor); ---------------------------------------------------------------------------------| Id | Operation | Name | Rows | Bytes | Cost (%CPU)| Time | ---------------------------------------------------------------------------------| 0 | DELETE STATEMENT | | | | 1636 (100)| | | 1 | DELETE | T | | | | | |* 2 | FILTER | | | | | | | 3 | TABLE ACCESS FULL | T | 299K| 8781K| 1631 (1)| 00:00:20 | | 4 | NESTED LOOPS | | 1 | 26 | 5 (0)| 00:00:01 | | 5 | NESTED LOOPS | | 1 | 23 | 4 (0)| 00:00:01 | |* 6 | TABLE ACCESS FULL | USER$ | 1 | 20 | 3 (0)| 00:00:01 | | 7 | TABLE ACCESS CLUSTER| TS$ | 1 | 3 | 1 (0)| 00:00:01 | |* 8 | INDEX UNIQUE SCAN | I_TS# | 1 | | 0 (0)| | | 9 | TABLE ACCESS CLUSTER | TS$ | 1 | 3 | 1 (0)| 00:00:01 | |* 10 | INDEX UNIQUE SCAN | I_TS# | 1 | | 0 (0)| | ---------------------------------------------------------------------------------- www.enkitec.com 56
  • 57. Viewing the parameters used for plan compilation • Optimizer environment is stored inside every child cursor • V$SQL • optimizer_env RAW(839) • optimizer_env_hash_value NUMBER • V$SQL_OPTIMIZER_ENV • V$SES_OPTIMIZER_ENV • V$SYS_OPTIMIZER_ENV • Scripts to query the underlying X$ tables • @sqlopt <hash_value> <child#> <%parameter%> • @sesopt <sid> <%parameter%> • @sysopt <%parameter%> www.enkitec.com 57
  • 58. Using optimizer_features_enable for troubleshooting • Very useful for reverting back to “old” behavior after upgrade • At session / application level • With ALTER SESSION • Or at SQL statement level • Using OPTIMIZER_FEATURES_ENABLE(’<version>’) hint • But also very useful for troubleshooting SQL issues after upgrade – easy way to narrow down some issues • The first things I check when some SQL runs badly after upgrade 1. 2. The execution plan (obviously) The differences in (undocumented) optimizer parameters – – Using sqlopt.sql for a specific SQL (need to run it on both old and new db) Or a script which gives me the optimizer parameter changes between any Oracle database release (see next slide) www.enkitec.com 58
  • 59. Compare optimizer_features_enable impact • Create the opt_param_matrix table • SQL> @tools/optimizer/optimizer_features_matrix.sql • Report parameter differences with @cofep.sql SQL> @cofep.sql 10.2.0.4 11.1.0.7 Compare Optimizer_Features_Enable Parameter differences for values 10.2.0.4 and 11.1.0.7 PARAMETER ---------------------------------------_bloom_folding_enabled _bloom_pruning_enabled _first_k_rows_dynamic_proration _nlj_batching_enabled _optimizer_adaptive_cursor_sharing _optimizer_enable_density_improvements _optimizer_enable_extended_stats _optimizer_extend_jppd_view_types _optimizer_extended_cursor_sharing_rel _optimizer_extended_stats_usage_control ... '10.2.0.4' ---------FALSE FALSE FALSE 0 FALSE FALSE FALSE FALSE NONE 255 www.enkitec.com '11.1.0.7' ---------TRUE TRUE TRUE 1 TRUE TRUE TRUE TRUE SIMPLE 224 59
  • 60. Reading execution plans – on one slide • Execution plan is a tree • Tree of row source operators (which are internally just C functions) • Root of the tree is where all “matching” rows are pulled from the leaves • Root is the execution plan line with ID=0 (top line in the plan output) • For SELECT STATEMENT the root operation passes rows to OPI Fetch which sends the rows back to client • For DML, the root operation will modify the rows returned to it from branches under it • Tree hierarchy • Every row source in the tree can get input only from its direct children • CBO can push predicates deeper towards the leaves of the tree • Data access starts from the first leaf operation of the tree * • Joins can join only two child row sources together at a time www.enkitec.com 60
  • 61. Flexible DBMS_XPLAN.DISPLAY_CURSOR alternatives • XM (eXplain from Memory) scripts • @xmsh <hash_value> <child#> • eXplain from Memory with Statistics by hash_value) • @xmsi <sqlid> <child#> • eXplain from Memory with Statistics by SQL ID) • @xms • eXplain from Memory with statistics – last SQL executed in current session) • They use V$SQL_PLAN% views • • • • just like DBMS_XPLAN.DISPLAY_CURSOR does They work from Oracle 9.2 They report better detail than DBMS_XPLAN.DISPLAY_CURSOR does DML example – report consistent gets vs current gets www.enkitec.com 61
  • 62. Profiling execution plans - 1 • Just like you can profile which SQLs take most of the application response time, you can profile which SQL execution plan lines take most of a SQL statement response time • alter session set statistics_level = all • Or _rowsource_execution_statistics = true • Works since 9.2 • gather_plan_statistics hint • Works from 10.2 • SQL_TRACE enables plan profiling too – for newly parsed cursors! • You can verify it by looking into the sqlstat_enabled compilation environment parameter (using @sqlopt.sql) www.enkitec.com 62
  • 63. Profiling execution plans - 2 • The V$SQL_PLAN_STATISTICS[_ALL] views are updated at the end of the call (fetch for example) • If the statement is already overrunning its time, you can cancel it with CTRL+C, resource manager or even kill the session (but not the process) • And the statistics up to the query cancellation will be loaded to V$SQL_PLAN_STATISTICS • Since 11g, ASH samples current execution plan line info too! • _rowsource_profiling_statistics = true by default • Populates new columns in V$ACTIVE_SESSION_HISTORY: • SQL_PLAN_LINE_ID – corresponds to the ID in V$SQL_PLAN • SQL_PLAN_OPERATION – for example: TABLE ACCESS • SQL_PLAN_OPTIONS – for example: FULL www.enkitec.com 63
  • 64. Profiling execution plans - 3 • Starting from 10g, the rowsource function elapsed times are sampled (not every row source call is timed) • The sampled times are extrapolated and accounted to the rowsource which was active during the sample • This may skew the profile stats in some cases • You can set the _rowsource_statistics_sampfreq lower for test run • Must be power of 2 (default is 128) • Note that the CPU usage goes much higher (especially with NL joins) -------------------------------------------------------------------------------------------------| Id | Operation | Name | Starts | E-Rows | A-Rows | A-Time | -------------------------------------------------------------------------------------------------| 0 | SELECT STATEMENT | | 1 | | 1 |00:00:01.10 | | 1 | SORT AGGREGATE | | 1 | 1 | 1 |00:00:01.10 | | 2 | VIEW | DBA_SOURCE | 1 | 589K| 624K|00:00:03.58 | | 3 | UNION-ALL | | 1 | | 624K|00:00:03.02 | |* 4 | FILTER | | 1 | | 624K|00:00:01.91 | |* 5 | HASH JOIN | | 1 | 589K| 624K|00:00:01.09 | |* 6 | HASH JOIN | | 1 | 6446 | 6899 |00:00:00.04 | | 7 | INDEX FULL SCAN | I_USER2 | 1 | 100 | 101 |00:00:00.01 | |* 8 | HASH JOIN | | 1 | 6446 | 6899 |00:00:00.03 | www.enkitec.com 64
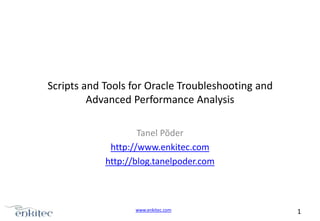
  • 65. Visualizing execution plan profiles • Challenge • The elapsed time figures reported by SQL plan profiling are cumulative • They include time spent: • In the execution plan line (rowsource) itself • All child rowsources “under” it in the execution plan tree • It’s not convenient to manually calculate the real non-cumulative runtimes • Especially for large plans • PlanViz - http://tech.e2sn.com/apps/planviz/ • Free online execution plan hierarchy and response time profile visualizer • Parses DBMS_XPLAN.DISPLAY(_CURSOR) output • Calculates the non-cumulative A-Time values • Visualizes the plan profile for quick drilldown www.enkitec.com 65
  • 66. PlanViz The right side height of the box shows the individual row source’s elapsed time The left side height shows the cumulative elapsed time of the row source (and its children) www.enkitec.com 66
  • 67. Reading PlanViz plan output - 1 The #5 hash join (light green) itself takes 1/3 of total execution time of the plan. The #5 hash join and all its children/grandchi ldren (#6,7,8,9,10) take over 50% of total response time www.enkitec.com 67
  • 68. Reading PlanViz plan output- 2 The #6 hash join (light green) itself takes 1/4 of total execution time of the plan. The #6 hash join and all its children/grandchi ldren take over 50% of total response time www.enkitec.com 68
  • 69. Reading PlanViz plan output – 3 (continued) • Color row sources by time spent in them Select color by Time Color meanings – it’s a range •Red is the “most” time of this plan •Blue – “least” of time •And colors in between represent time amounts in between “most” and “least” This is useful for easy visual spotting of things of interest, but to get exact values, you still need to look at the numbers! www.enkitec.com 69
  • 70. Reading PlanViz plan output – 4 (continued) • Color row sources by number of rows they return to parent Select color by Rows Color meanings – it’s a range •Red is the “most” of rows in this plan •Blue – “least” rows •And colors in between represent time amounts in between “most” and “least” This is useful for easy visual spotting of things of interest, but to get exact values, you still need to look at the numbers! www.enkitec.com 70
  • 71. @descx.sql @descxx.sql A better describe command • @desc • Shows basic optimizer statistics (also column low/high values) SQL> @desc obj$ Col# ---1 2 3 4 5 6 7 8 9 10 11 12 13 14 15 16 17 18 19 20 21 Column Name ------------OBJ# DATAOBJ# OWNER# NAME NAMESPACE SUBNAME TYPE# CTIME MTIME STIME STATUS REMOTEOWNER LINKNAME FLAGS OID$ SPARE1 SPARE2 SPARE3 SPARE4 SPARE5 SPARE6 Null? Type NUM_DISTINCT DENSITY NUM_NULLS NUM_BUCKETS ---------- ---------------- ------------ ---------- ---------- ----------NOT NULL NUMBER(,) 74760 .000013376 0 1 NUMBER(,) 9657 .000103552 65059 1 NOT NULL NUMBER(,) 35 6.6338E-06 0 28 NOT NULL VARCHAR2(30) 44960 .000040124 0 254 NOT NULL NUMBER(,) 21 6.6338E-06 0 15 VARCHAR2(30) 577 .00205538 73440 254 NOT NULL NUMBER(,) 46 6.6338E-06 0 33 NOT NULL DATE(7) 2671 .001430615 0 254 NOT NULL DATE(7) 2702 .001455604 0 254 NOT NULL DATE(7) 2776 .001432665 0 254 NOT NULL NUMBER(,) 2 6.6338E-06 0 1 VARCHAR2(30) 0 0 74760 0 VARCHAR2(128) 0 0 74760 0 NUMBER(,) 10 6.6338E-06 0 9 RAW(16) 3268 .000305998 71492 1 NUMBER(,) 2 .5 0 1 NUMBER(,) 11 .090909091 0 1 NUMBER(,) 35 6.6338E-06 0 28 VARCHAR2(1000) 0 0 74760 0 VARCHAR2(1000) 0 0 74760 0 DATE(7) 0 0 74760 0 www.enkitec.com 71
  • 72. See also @xp, @xph, @xpa scripts (SQL Monitoring) Parallel Execution slave communication • @tq • Shows how many rows PX slaves have consumed from communications buffers (Table Queues) in different parallel execution plan phases (TQ_IDs) SQL> @tq Show PX Table Queue statistics from last Parallel Execution in this session... TQ_ID (DFO,SET) SERVER_TYPE NUM_ROWS BYTES WAITS TIMEOUTS PROCESS INSTANCE DFO_NUMBER TQ_ID ---------- ------------- ---------- ---------- ------- ---------- -------- ---------- ---------- -----:TQ10000 Produced 376 1289 0 0 QC 1 1 0 Consumed 94 399 6 3 P007 1 Consumed 94 399 5 1 P005 1 Consumed 94 399 4 0 P004 1 Consumed 94 399 6 1 P006 1 :TQ10001 Produced Consumed Consumed Consumed Consumed 376 94 94 94 94 2562 1189 1189 1189 1189 0 3 5 4 6 0 0 1 0 1 QC P007 P005 P004 P006 1 1 1 1 1 1 1 :TQ10002 Produced Produced Produced Produced Consumed Consumed ... 6968 7956 9172 3884 6995 6995 132404 150304 171052 72856 131654 131654 3 8 2 8 4 4 2 2 0 1 1 1 P007 P006 P005 P004 P002 P000 1 1 1 1 1 1 1 2 www.enkitec.com 72
  • 73. Visualization Tools for Performance Analysis www.enkitec.com 73
  • 74. PerfSheet v3.0 - Introduction • Problem: • Visualize (performance) data • Do it easily… • Not manually! • The manual cycle: • SELECT -> SPOOL -> FIX -> LOAD TO EXCEL -> FIX -> CREATE CHART • Solution: • • • • • PerfSheet Automates the manual cycle above Nothing more You still need to write the queries (if the existing ones in there aren’t enough) PerfSheet (now v3.0) greatly speeds up graphical data analysis work! www.enkitec.com 74
  • 75. PerfSheet v3.0 - Demo SELECT -> FETCH -> LOAD TO EXCEL -> VISUALIZE www.enkitec.com 75
  • 76. PerfSheet v3.0 - Architecture • Requires Excel 2002+ • Does not work on the MacOS Office (No VBA support in Excel 2008) • Uses MS ADODB • Oracle (instant) client drivers must be installed and available • No need for manual ODBC data source setup • No need for TNSNAMES.ORA or naming configuration! • When you select a query and hit “Show me!” then PerfSheet will: 1. 2. 3. Go to Queries Tab and get the SQL text corresponding to the query name you selected Log on to database you selected, run the SQL and fetch all data Create a PivotChart out of the data and visualize it as defined in the selected View (visualization rules are defined on the Views tab) www.enkitec.com 76
  • 77. PerfSheet v3.0 – Setting up your own queries 1. Go to Queries sheet 2. Add new query to the end of the list (follow other examples) 3. Go to front page, select your query in query browser and click “Show me” 4. Drag & Drop the columns you want to appropriate axis on the chart 5. Click “Save View As” and type in a view name • • View is just a way to visualize the queries data You can have multiple views per query to show the same date in a different way 6. You’re all done • You need to save the PerfSheet.xls of course www.enkitec.com 77
  • 78. “Free” AWR views in 11g • Since 11g you may query following AWR views even if you don’t have Diagnostics Pack license • DBA_HIST_SEG_STAT • DBA_HIST_SEG_STAT_OBJ • DBA_HIST_UNDOSTAT • Documented in Oracle Licensing Guide • http://download.oracle.com/docs/cd/B28359_01/license.111/b28287/options.htm#st href69 (or google for “Free AWR views”, you’ll land on my blog article) • All data dictionary views beginning with the prefix DBA_HIST_ are part of this pack, along with their underlying tables. The only exception are the views: DBA_HIST_SNAPSHOT, DBA_HIST_DATABASE_INSTANCE, DBA_HIST_SNAP_ERROR, DBA_HIST_SEG_STAT, DBA_HIST_SEG_STAT_OBJ, and DBA_HIST_UNDOSTAT. They can be used without the Diagnostic Pack license. • In 10g you’d need to stick with StatsPack level 7 • Or modify the snap() procedure to include segment stats without the execution plan snapshots (level 6) www.enkitec.com 78
  • 79. Demo - Identifying trends inside execution plans • 11g + ASH only, unfortunately • Or on Solaris 10 with Dtrace ;-) • ASH has new SQL_PLAN_LINE_ID column SQL> desc V$ACTIVE_SESSION_HISTORY Name Null? Type ------------------------------- -------- -------------1 SAMPLE_ID NUMBER 2 SAMPLE_TIME TIMESTAMP(3) 4 SESSION_ID NUMBER 5 SESSION_SERIAL# NUMBER 9 SQL_ID VARCHAR2(13) 11 SQL_CHILD_NUMBER NUMBER 17 SQL_PLAN_HASH_VALUE NUMBER 18 SQL_PLAN_LINE_ID NUMBER 19 SQL_PLAN_OPERATION VARCHAR2(30) SQL_ID, SQL_CHILD_NUMBER, SQL_PLAN_LINE_ID SQL_ID, SQL_PLAN_HASH_VALUE, 20 SQL_PLAN_OPTIONS VARCHAR2(30) identify the execution plan line if the plan is still in SQL_PLAN_LINE_ID identify the execution plan cache. Its still good to join by plan_hash_value as well to avoid cases where a new plan has been loaded under the child www.enkitec.com line in cases where the SQL has been aged out from cache (and you need to go to AWR or StatsPack) 79