Journal of Economic Perspectives—Volume 30, Number 1—Winter 2016—Pages 117–138
F ossil fuels provide substantial economic benefits, but in recent decades, a series of concerns have arisen about their environmental costs. In the United States, for example, the Clean Air Act in 1970 and 1977 addressed concerns
over the emissions of so-called conventional pollutions, notably airborne particulate
matter, by imposing fuel economy standards on vehicles and regulations to reduce
emissions from stationary sources. During the 1980s, concerns mounted about how
the combustion of fossil fuels could lead to acid rain and rising ozone levels. The
Clean Air Act Amendments of 1990 created frameworks to reduce sulfur dioxide
and nitrogen oxide from power plant emissions, as well as from the combustion
of gasoline and diesel fuels in vehicles. However, in many of the world’s largest
cities in the emerging economies around the world, the conventional forms of
air pollution from burning fossil fuels—especially particulates, sulfur oxides,
and nitrogen oxides—are still exacting a heavy toll on human health (Chay and
Will We Ever Stop Using Fossil Fuels?
■ Thomas Covert is Assistant Professor of Microeconomics, Booth School of Business, Univer-
sity of Chicago, Chicago, Illinois. Michael Greenstone is the Milton Friedman Professor in
Economics and the College and Director of the Energy Policy Institute at Chicago, both at the
University of Chicago, Chicago, Illinois. Christopher R. Knittel is William Barton Rogers
Professor of Energy Economics, Sloan School of Management, and Director of the Center for
Energy and Environmental Policy Research, all at the Massachusetts Institute of Technology,
Cambridge, Massachusetts. Greenstone and Knittel are also Research Associates, National
Bureau of Economic Research, Cambridge, Massachusetts. Their email addresses are thomas.
[email protected], [email protected], and [email protected]
† For supplementary materials such as appendices, datasets, and author disclosure statements, see the
article page at
http://dx.doi.org/10.1257/jep.30.1.117 doi=10.1257/jep.30.1.117
Thomas Covert, Michael Greenstone, and
Christopher R. Knittel
j_covert_301.indd 117 1/20/16 6:57 AM
118 Journal of Economic Perspectives
Greenstone 2003; Chen, Ebenstein, Greenstone, and Li 2013; Knittel, Miller, and
Sanders forthcoming).
By the mid-1990s, concerns about the role of fossil fuels in generating emis-
sions of carbon dioxide and other greenhouse gases gained traction. Approximately
65 percent of global greenhouse gas emissions are generated by fossil fuel combus-
tion.1 Of these emissions, coal is responsible for 45 percent, oil for 35 percent, and
natural gas for 20 percent.2 To reduce carbon dioxide emissions by enough to miti-
gate the chance of disruptive climate change in a substantial way, there would seem to
be only two possible options. One is to find ways to capture carbon from the air and
store it. T ...
Kodo Millet PPT made by Ghanshyam bairwa college of Agriculture kumher bhara...
Journal of Economic Perspectives—Volume 30, Number 1—Winter 20.docx
1. Journal of Economic Perspectives—Volume 30, Number 1—
Winter 2016—Pages 117–138
F ossil fuels provide substantial economic benefits, but in
recent decades, a series of concerns have arisen about their
environmental costs. In the United States, for example, the
Clean Air Act in 1970 and 1977 addressed concerns
over the emissions of so-called conventional pollutions, notably
airborne particulate
matter, by imposing fuel economy standards on vehicles and
regulations to reduce
emissions from stationary sources. During the 1980s, concerns
mounted about how
the combustion of fossil fuels could lead to acid rain and rising
ozone levels. The
Clean Air Act Amendments of 1990 created frameworks to
reduce sulfur dioxide
and nitrogen oxide from power plant emissions, as well as from
the combustion
of gasoline and diesel fuels in vehicles. However, in many of
the world’s largest
cities in the emerging economies around the world, the
conventional forms of
air pollution from burning fossil fuels—especially particulates,
sulfur oxides,
and nitrogen oxides—are still exacting a heavy toll on human
health (Chay and
Will We Ever Stop Using Fossil Fuels?
■ Thomas Covert is Assistant Professor of Microeconomics,
Booth School of Business, Univer-
2. sity of Chicago, Chicago, Illinois. Michael Greenstone is the
Milton Friedman Professor in
Economics and the College and Director of the Energy Policy
Institute at Chicago, both at the
University of Chicago, Chicago, Illinois. Christopher R. Knittel
is William Barton Rogers
Professor of Energy Economics, Sloan School of Management,
and Director of the Center for
Energy and Environmental Policy Research, all at the
Massachusetts Institute of Technology,
Cambridge, Massachusetts. Greenstone and Knittel are also
Research Associates, National
Bureau of Economic Research, Cambridge, Massachusetts. Their
email addresses are thomas.
[email protected], [email protected], and [email protected]
† For supplementary materials such as appendices, datasets, and
author disclosure statements, see the
article page at
http://dx.doi.org/10.1257/jep.30.1.117 doi=10.1257/jep.30.1.117
Thomas Covert, Michael Greenstone, and
Christopher R. Knittel
j_covert_301.indd 117 1/20/16 6:57 AM
118 Journal of Economic Perspectives
Greenstone 2003; Chen, Ebenstein, Greenstone, and Li 2013;
Knittel, Miller, and
Sanders forthcoming).
By the mid-1990s, concerns about the role of fossil fuels in
generating emis-
sions of carbon dioxide and other greenhouse gases gained
3. traction. Approximately
65 percent of global greenhouse gas emissions are generated by
fossil fuel combus-
tion.1 Of these emissions, coal is responsible for 45 percent, oil
for 35 percent, and
natural gas for 20 percent.2 To reduce carbon dioxide emissions
by enough to miti-
gate the chance of disruptive climate change in a substantial
way, there would seem to
be only two possible options. One is to find ways to capture
carbon from the air and
store it. To a moderate extent this can be done by expanding the
size of the world’s
forests, for example, but if carbon capture and storage is to be
done at a scale that
will more than counterbalance the burning of fossil fuels, there
would need to be very
dramatic developments in the technologies so that it could
happen at a cost-effective
industrial level. The other option for reducing emissions of
greenhouse gases is to
reduce future consumption of fossil fuels in a drastic manner.
A few developed countries have implemented policies to limit
fossil fuel
consumption through a mixture of taxes, fees, or regulation on
carbon emissions
(in the case of the European Union, some US states, Japan,
Canada, and Australia),
subsidies for energy conservation (the United States and
elsewhere), and the devel-
opment of low- or no-carbon energy resources (the United
States and elsewhere).
In these and other OECD countries, data in the annual BP
Statistical Review of
Energy show that both oil and coal consumption are down about
4. 10 percent, while
natural gas consumption (which has lower carbon emissions) is
up 10 percent from
2005 levels.3
There have been few policy responses to limit fossil fuel
consumption in
developing countries, even though many of them are
experiencing very high and
immediate costs from conventional air pollutants. Moreover,
this group of countries
has greatly expanded its use of fossil fuels in this period, with
non-OECD coal, oil,
and gas consumption up 46, 33, and 35 percent, respectively,
since 2005. As a result,
global consumption of fossil fuels rose 7.5 percent for oil, 24
percent for coal, and
20 percent for natural gas from 2005 to 2014.
Two primary market forces could moderate the need for an
activist policy
response to rising fossil fuel consumption. First, the ongoing
consumption of fossil
fuels could cause the marginal cost of extracting additional fuel
to rise to where the
marginal barrel of oil (or ton of coal or cubic meter of natural
gas) will be more
costly than clean energy technologies (for examples of this
argument, see Rutledge
1 US Environmental Protection Agency at
http://www3.epa.gov/climatechange/ghgemissions/
global.html.
2 Carbon Dioxide Information Analysis Center at
http://cdiac.ornl.gov/ftp/trends/co2_emis/
Preliminary_CO2_emissions_2012.xlsx.
5. 3 All country-level fuel consumption data in this article come
from the BP Statistical Review of World Energy
2015, available at
http://www.bp.com/en/global/corporate/energy-
economics/statistical-review-of
-world-energy.html.
j_covert_301.indd 118 1/20/16 6:57 AM
Thomas Covert, Michael Greenstone, and Christopher R. Knittel
119
2013; Murray and King 2012). We label this “the supply
theory”—that is, the world
will run out of inexpensive fossil fuels.
Second, scientific advances could improve the energy efficiency
of existing
technologies and develop newer, cheaper carbon-free
technologies (for example,
see the “McKinsey curve” in McKinsey 2009). We label this
“the demand theory”—
that is, the economy will stop demanding fossil fuels as
alternatives become more
cost-competitive. This line of thinking is appealing. After all,
who wouldn’t prefer to
consume energy on our current path and gradually switch to
cleaner technologies
as they become less expensive than fossil fuels? But the
desirability of this outcome
doesn’t assure that it will actually occur—or even that it will be
possible.
In this article, we look back at the historical record to assess the
6. power of natural
supply-side and demand-side forces (forces unrelated to future
policy intervention) to
achieve significant reductions in fossil fuel consumption. To
gain some initial perspec-
tive, consider the ratio of current proven fossil fuel reserves
divided by current annual
consumption. Proven reserves are defined as fossil fuels that are
technically and
economically recoverable at current prices, and so this ratio
represents the number
of years of current consumption that can be economically
supplied by known fossil
fuel deposits. The total amount of any category of fossil fuels
that is in the ground
and recoverable at any cost is fixed, of course, but reserves can
increase or decrease
depending on how extraction technologies and prices evolve.
Figure 1 plots reserves-to-consumption for oil, natural gas, and
coal at the global
level. The available data for oil and natural gas span 1980 to
2014; the data for coal begin
in 1994. The striking feature of this graph is how constant the
reserve-to-consumption
ratio is for both oil and natural gas. It is an empirical regularity
that, for both oil and
natural gas at any point in the last 30 years, the world has 50
years of reserves in the
ground. The corollary, obviously, is that we discover new
reserves, each year, roughly
equal to that year’s consumption. This phenomenon seems to be
independent of the
enormous variation in fossil fuel price changes over the last 30
years. Coal, on
the other hand, shows a dramatic decrease in its reserves-to-
7. production ratio, but
there remain many more years of coal reserves, at current
consumption, than for
either oil or natural gas. Furthermore, the decline in the reserve-
to-consumption
ratio for coal flattened in the early 2000s and more recently the
ratio has even ticked
upward a bit. The stability of the reserve-to-consumption ratio
provides the first piece
of evidence against the idea that the supply of or demand for
fossil fuels are likely to
“run out” in the medium term.
In the next section of the paper, we analyze the supply behavior
for fossil fuels
over the past three decades through the lenses of reserve growth
and exploration
success. The story seems clear: we should not expect the
unfettered market to lead
to rapid reductions in the supply of fossil fuels. Technical
progress in our ability to
extract new sources of fossil fuels has marched upward steadily
over time. If the
advance of technology continues, there is a nearly limitless
amount of fossil fuel
deposits—at least over the time scale that matters for climate
change—that, while
they are not yet economical to extract at current prices, could
become economical
in the future.
j_covert_301.indd 119 1/20/16 6:57 AM
120 Journal of Economic Perspectives
8. If we cannot rely on market-driven shifts in supply to reduce
our consumption
of fossil fuels, can we expect the demand for fossil fuels to fall?
In the following
section, we investigate the prospects for low-carbon alternatives
to fossil fuels to
become cost-competitive. Hydroelectric, solar, wind, and
nuclear are obvious
substitutes for fossil fuels in electric power generation.
Reducing our demand
for petroleum will also require low-carbon sources of
transportation, potentially
through the large-scale adoption of electric vehicles. We
analyze trends in produc-
tion costs for these cleaner technologies and find it implausible
that these trends
alone will sufficiently reduce fossil fuel consumption for the
world as a whole.
Thus, we are driven to the conclusion that activist and
aggressive policy choices
are necessary to drive reductions in the consumption of fossil
fuels and greenhouse
gas emissions. We end the paper with a peek into the future of
risks if we were to
continue our heavy consumption of known deposits of fossil
fuels without capturing
and sequestering the emissions. The picture is alarming.
Supply: Peak Oil, Natural Gas, and Coal?
In the aftermath of the oil price shocks of 1973–74, a number of
market
observers began to warn of ever-dwindling oil resources. A
robust debate ensued
9. with geologists and environmentalists often citing Hubbert’s
(1956) theory of “peak
oil” as the basis for the concern. President Jimmy Carter (1977)
reflected these
Figure 1
Ratio of Proven Fossil Fuel Reserves to Production
Source: BP Statistical Review of World Energy, 2015.
0
50
100
150
200
250
1980 1985 1990 1995 2000 2005 2010
P
ro
ve
n
r
es
er
ve
11. Will We Ever Stop Using Fossil Fuels? 121
concerns when he told the nation in a televised speech: “World
consumption of oil
is still going up. If it were possible to keep it rising during the
1970’s and 1980’s by
5 percent a year, as it has in the past, we could use up all the
proven reserves of oil
in the entire world by the end of the next decade.”
Economists, on the other hand, stressed the ongoing tension
between consump-
tion and technological progress. Yes, taken literally, there is a
finite amount of any
one fossil fuel. Each barrel of oil or cubic foot of natural gas
that is taken out of the
ground cannot be replaced in a relevant time scale. However,
over time we are able to
extract more fossil fuels out of the ground as technology
improves, and the ultimate
resources of planet Earth are both highly uncertain and very
large. This observation
is perhaps most closely connected with the work of Morris
Adelman (1993).
Indeed, two enormous sources of modern oil production—oil
from tar sands
and oil (as well as gas) from shale deposits—only recently were
categorized as
“reserves,” having previously not been on the radar as
economically relevant energy
sources. Though these two “unconventional” sources of
hydrocarbons currently
represent a substantial fraction of total production in the US and
Canada and
12. approximately 10 percent of world oil and gas reserves, their
economically useful
existence was driven entirely by recent technological advances.
Canadian geologists first studied the possibility of production
of oil from
bituminous sands (also referred to as tar sands or oil sands) in
the 19th century
(Atkins and MacFadyen 2008). Though the commercial potential
for this viscous
mixture of heavy oil, sand, and clay had long been recognized,
it took scientists
several decades to figure out how to economically mine the
mixture, separate out
the heavy hydrocarbons and “upgrade” them to light, sweet
crude oil. It wasn’t
until 1967 that a small-scale commercial production and
upgrading facility began
operation (10,000 barrels, hereafter “bbls,” per day) and it took
until 1999 for
Canadian energy authorities to recognize the growing number of
tar sands proj-
ects as reserves. This decision increased total Canadian oil
reserves by 130 billion
bbls and total world reserves by about 10 percent. Now, the
Canadian Association
of Petroleum Producers estimates tar sands production in 2014
was more than
2 million bbls/day.4
A similar pattern occurred in the development of oil and gas
from shale and other
low-permeability rock formations in the United States. These
resources had long been
known to contain tremendous quantities of hydrocarbons
(Shellberger, Nordhaus,
13. Trembath, and Jenkins 2012). However, their low permeability
inhibited the rate at
which oil and gas molecules could flow out of conventionally
designed vertical wells
drilled into them. In the 1980s, engineers working in the Barnett
natural gas shale
formation in Texas began experimenting with hydraulic
fracturing and horizontal
drilling as tools to solve the permeability problem. By the early
2000s, thousands of
wells had been successfully drilled and “fracked” into the
Barnett, and the technique
4 This figure includes synthetic “upgraded” crude oil as well as
raw bitumen production, according to
data from the Canadian Association of Petroleum Producers at
http://statshbnew.capp.ca/SHB/Sheet.
asp?SectionID=3&SheetID=233.
j_covert_301.indd 121 1/20/16 6:57 AM
122 Journal of Economic Perspectives
later spread to the Marcellus natural gas shale formation in
Pennsylvania and the
Bakken oil shale formation in North Dakota. As a result, US oil
and gas reserves
expanded 59 and 94 percent, respectively, between 2000 and
2014. This technology-
driven growth in reserves also caused increases in production.
In 2014, US natural gas
production was greater than ever before and oil production was
at 97 percent of the
peak reached in 1970.
14. These two technological advances are at least partially
responsible for a more
general long-term pattern of worldwide reserve growth. Figure 2
plots annual
reserve estimates in absolute terms for oil, natural gas, and
coal. The steady rise of
proven oil and natural gas reserves is striking. The average
growth rate in reserves is
2.7 percent for both oil and natural gas. In only one year did
total proven oil reserves
fall, and this year was immediately followed by a growth in
reserves of 12.2 percent
the following year. Natural gas reserves fell in only two years,
but by less than half of
1 percent in both cases. Coal reserves, on the other hand, fell
consistently through
the late 1990s to 2008 but have since shown fairly constant
positive growth.
A potential concern about the consistency of this pattern is that
individual
countries do not consistently scale back reserve estimates when
low prices cause
existing discoveries to be unprofitable. While there is no
uniform standard that all
countries use in calculating reserves, there are at least two
reasons to believe that
these data are informative about the scale of fossil fuel
resources readily available
in the future. First, securities regulators in developed countries
heavily regulate
Figure 2
Proven Reserves of Oil, Natural Gas, and Coal over Time
15. Source: BP Statistical Review of World Energy, 2015.
Note: The figure plots annual reserve estimates in absolute
terms for oil, natural gas, and coal.
0
5,000
10,000
15,000
20,000
25,000
30,000
1980 1985 1990 1995 2000 2005 2010
P
ro
ve
n
r
es
er
ve
s
(Q
u
16. ad
ri
ll
io
n
B
T
U
)
Oil
Gas
Coal
j_covert_301.indd 122 1/20/16 6:57 AM
Thomas Covert, Michael Greenstone, and Christopher R. Knittel
123
reserve estimates published by publicly traded oil and gas
companies, and these
numbers are regularly revised downward following oil price
crashes. For example,
in 1986 and 1998, when oil prices fell 46 and 30 percent,
respectively, US oil reserves
fell by 3 and 6 percent, respectively. Second, even in the
absence of truth-telling
regulation in reserve estimates (for example, in the case of oil
17. owned by national
oil companies), the country-level data in the BP Statistical
Review still shows a mean-
ingful number of downward revisions in a typical year. In the
history of oil reserve
changes in the BP Statistical Review, a full quarter of countries
report decreases in
reserve estimates in the average year. However, the converse of
this statement is
what is important for understanding how hydrocarbon reserves
may change in the
future. The BP data show that most countries seem to find
significantly more oil
(and gas) than they consume in most years.
If the past 35 years is any guide, not only should we not expect
to run out of
fossil fuels any time soon, we should not expect to have less
fossil fuels in the future
than we do now. In short, the world is likely to be awash in
fossil fuels for decades
and perhaps even centuries to come.
An alternative measure of technological progress in the
exploration and exploi-
tation of fossil fuel resources is the success rate associated with
exploring for new oil
and natural gas formations. Without technological progress in
this area, present-value
considerations will cause firms to drill lower-risk prospects
before higher-risk pros-
pects. As a result, the probability of successful exploration falls
over time as the “easy”
wells are exhausted and oil and gas prices rise to equilibrate
supply and demand.
In contrast, if technology advances and lowers exploration costs
18. and/or risks, it is
possible for the probability of successful exploration to stay
constant, or even rise over
time, independent of the path of prices.
We are unaware of any systematic data on the history of
exploration and devel-
opment costs for oil or gas, given that it is difficult to observe
private company costs
for seismic studies, drilling, and other inputs to the exploration
process. However,
the US Energy Information Administration and the data and
consulting firm IHS
do publish data on the number of successful and failed
exploration and develop-
ment wells in the United States, so it is possible to measure
changes in risk over
time. Figure 3 plots the fractions of successful exploration and
development wells
in each year from 1949 to 2014. The probability of a successful
exploratory well did
drift downward from about 20 percent in 1949 to 16 percent in
the late 1960s. But
in 1968, the highly successful Alaska North Slope field was
discovered, leading to a
near doubling in the probability of exploratory drilling success
by 1979.
Similar technological events preceded other periods of growing
drilling
success. These include the development of ultra-deep water
fields in the Gulf of
Mexico during the 1980s, hydraulic fracturing technology for
natural gas forma-
tions in the 1990s, and the same technology for oil formations
in the 2000s. By 2007,
19. 69 percent of exploratory wells yielded successful oil or gas
production. Though the
probability of successful exploration has drifted down to about
50 percent in recent
years, it is still markedly higher than in much of the history of
US fossil fuel explora-
tion. Figure 3 also shows that the fraction of successful
development wells has also
j_covert_301.indd 123 1/20/16 6:57 AM
124 Journal of Economic Perspectives
grown over time. Though these wells are drilled into formations
already known to
contain oil or gas, there is still risk that a development well
faces technical difficul-
ties and produces no output. Growth in this number is also
important, since there
have been 10 to 20 times as many development wells compared
to exploratory wells
in recent years. In the United States, at least, it appears that
technical progress has
consistently helped increase the supply of fossil fuels, in spite
of price volatility and
the exhaustion of existing fossil fuel formations.
The supply curve for fossil fuels has constantly shifted out over
large stretches
of time, both because of new discoveries (like the large-scale
development of new oil
sources or oil and gas from Alaska and from the North Sea in
the 1970s) as well as
from new techniques like deep-water drilling, hydraulic
20. fracturing, and extracting
oil from tar sands. What might be next on the horizon?
Besides measuring fossil fuel reserves, geologists also measure
fossil fuel
“resources”—that is, fossil fuel deposits that are known to exist
but are not currently
economical to extract. McGlade and Ekins (2015) summarize
reported resources
by the Federal Institute for Geosciences and Natural Resources,
the International
Energy Agency, and the Global Energy Assessment. The range
of oil resources
is from 4.2 to 6.0 trillion barrels, which is 2.8 to 4 times larger
than the existing
Figure 3
Fraction of Development and Exploratory Wells that are
Successful in the United
States
Source: US Energy Information Administration and IHS.
Notes: Development wells are drilled into formations that have
already been explored and thus are known
to contain oil or gas. Exploratory wells are drilled into
formations that have not yet been explored and
which might not contain oil or gas.
0%
10%
20%
30%
21. 40%
50%
60%
70%
80%
90%
100%
1949 1954 1959 1964 1969 1974 1979 1984 1989 1994 1999
2004 2009 2014
Exploratory wells
Development wells
j_covert_301.indd 124 1/20/16 6:57 AM
Will We Ever Stop Using Fossil Fuels? 125
reserves of roughly 1.5 trillion barrels. The range of natural gas
resources is also
immense, ranging from 28,000 trillion cubic feet to over
410,000 trillion cubic feet.
For comparison, current global reserves of natural gas are
roughly 7,000 trillion
cubic feet (according to the US Energy Information
Administration’s International
Energy Statistics).5 Finally, the estimate range for coal
22. resources is from 14,000 to
23,500 gigatons, compared to existing reserves of around 1,000
gigatons.
These existing “resources” for currently exploited fossil fuel
technologies could
potentially, if technological progress continues to advance,
allow the supply curves
for fossil fuels to continue to shift outward for quite some time.
In addition, two
notable additional resources have not yet been commercially
developed, but are
known to exist in large quantities: oil shale and methane
hydrates.
“Oil shale” is defined by the US Geological Survey as “fine-
grained sedimen-
tary rock containing organic matter that yields substantial
amounts of oil and
combustible gas upon destructive distillation” (Dyni 2006).
Despite the similarity
in nomenclature, “oil shale” is fundamentally different from the
earlier-mentioned
“shale oil” which is currently being extracted using hydraulic
fracturing techniques
in North Dakota, Texas, and Oklahoma. The production
technology for oil shale is
similar to that of oil sands. In both cases, a heavy hydrocarbon
(bitumen in the case
of oil sands and kerogen in the case of oil shale) exists in sand,
clay, or sedimen-
tary rock. Heat is used to separate the hydrocarbon from the
surrounding material.
The resulting bitumen or kerogen then goes through additional
refining steps to
become a final consumer product. Oil shale resources are
23. enormous. A US Geolog-
ical Survey report from 2006 estimates that 2.8 trillion barrels
of oil shale exist (that
is, almost 50 percent of the high-end estimate of oil resources),
and some private
estimates are much larger. If oil shale became economical in the
near future, it
could cause oil reserves to nearly triple. Because of the use of
heat in the extraction
phase and the extra steps required for refining, carbon
emissions for producing
oil from oil shale are greater than for conventional sources of
oil. Some estimates
suggest that the emissions are 21–47 percent greater per unit of
energy produced
compared to conventional sources (Brandt 2008).
Methane hydrates are a solid mixture of natural gas and water
that forms
in low-temperature and high-pressure environments, usually
beneath seafloors.
Geologists have recognized methane hydrates as a potential
source of hydrocar-
bons since the 1960s, and testing on whether the resource might
be commercially
viable dates back to the 1970s. The technology to extract
methane hydrates at a
commercial price does not currently exist, although a number of
countries are
actively pursuing technology in this area (Boswell et al. 2014).
If this technology
eventually achieves commercial success, the potential scale of
methane hydrate
resources ranges from 10,000 trillion cubic feet to more than
100,000 trillion
cubic feet, according to US Geological Survey estimates (US
24. Energy Information
5 The page of the International Energy Statistics on which this
data is found is: http://www.eia.gov/
cfapps/ipdbproject/iedindex3.cfm?tid=3&pid=3&aid=6&cid=ww
,&syid=2011&eyid=2015&unit=TCF.
j_covert_301.indd 125 1/20/16 6:57 AM
126 Journal of Economic Perspectives
Administration 2012). For comparison, current global reserves
of natural gas are
roughly 7,000 trillion cubic feet.
The status of oil shale and methane hydrates today is similar to
that of oil sands
and shale gas in the 1980s. Geologists knew of their existence,
but oil and gas compa-
nies did not yet know how to recover them in a cost-effective
manner. The remarkably
successful history of innovation in oil and gas exploration
makes it seem more than
possible that oil shale and methane hydrates will become
commercially developed.
Even without the emergence of new technology for oil shale and
methane
hydrates, the use of existing technology to develop shale gas
and shale oil resources
outside of the United States is just now starting. The US Energy
Information Admin-
istration (2013) estimates that 93 percent of shale oil and 90
percent of shale gas
25. resources exist outside of the United States. Further, these
resources represent 10
and 32 percent, respectively, of total world resources for oil and
gas. As shale tech-
nology spreads across the world, these resources are likely to
become economically
productive reserves.
The policy implications of this ongoing expansion of fossil fuel
resources are
potentially profound. Even if countries were to enact policies
that raised the cost of
fossil fuels, like a carbon tax or a cap-and-trade system for
carbon emissions, history
suggests that technology will work in the opposite direction by
reducing the costs of
extracting fossil fuels and shifting their supply curves out.
Demand: Will Low-Carbon Energy Sources Knock Fossil Fuels
Out
of the Money?
Absent large upward shifts of the supply curve for fossil fuels,
deep cuts in
fossil fuel consumption will have to come from inward shifts in
their respective
demand curves.6 In this section, we analyze the recent changes
in the relative prices
of carbon-free and fossil-fuel–based energy technologies and
characterize what
future relative prices are necessary to reduce demand for fossil
fuels in a substantial
manner. We focus on the electricity and transportation sectors,
which are major
users of fossil fuels. In the United States, for example, the
electricity sector consumes
26. over 90 percent of total coal consumption and 30 percent of
natural gas, while the
transportation sector consumes over 60 percent of total US oil
consumption.7
6 We admittedly are confounding shifts in the supply curve with
changes in the slope. That is, a shift
would represent the addition of zero-marginal-cost supplies. In
practice, the marginal cost of many of
the new resources is nonzero, implying that the supply curve
shifts, or becomes flatter, at some strictly
positive price.
7 US statistics on the end-uses of fossil fuels are readily
available at the website of the US Energy Informa-
tion Administration. For example, coal statistics are available at
from the Quarterly Coal Report at http://
www.eia.gov/coal/production/quarterly; natural gas statistics
from the “Natural Gas Consumption by
End-Use” page at
http://www.eia.gov/dnav/ng/ng_cons_sum_dcu_nus_a.htm; and
oil statistics at the
“Petroleum and Other Liquids” webpage at
http://www.eia.gov/dnav/pet/pet_cons_psup_dc_nus_
mbbl_a.htm.
j_covert_301.indd 126 1/20/16 6:57 AM
Thomas Covert, Michael Greenstone, and Christopher R. Knittel
127
Replacing Natural Gas and Coal in Electricity Generation
Solar photovoltaics, wind turbines, and nuclear fission power
plants are the
27. current leading candidates to replace coal and natural gas in
electricity genera-
tion. However, nuclear fission has already been commercially
exploited for almost
75 years. In spite of this maturity, the rate of new nuclear power
plant construction
has significantly slowed down since the 1980s, and its share of
power generation
in most countries has actually fallen over the last decade due to
decreasing cost
competitiveness (Deutch et al. 2009; in this journal, Davis
2012; see also US EIA
International Energy Statistics). Thus, we focus here on the
recent history of cost
improvements in solar photovoltaics and wind turbines.
We compare costs using levelized cost of energy estimates
across different technol-
ogies. The levelized cost of energy is the present discounted
value of costs associated
with an energy technology divided by the present discounted
value of produc-
tion—that is, it is a measure of the long-run average cost of the
energy source.8
This measure offers a way of adjusting for the fact that
renewable energy sources
and fossil fuel plants have a different profile of costs over time.
For both renewable
plants and fossil fuel plants, the single largest cost occurs in the
first year a plant
is built, representing the up-front capital cost of the plant.
However, for renew-
able technologies, the operating costs in the remaining years are
small, as there
are no fuel inputs necessary, only maintenance. In contrast,
fossil fuel technologies
28. like natural gas and coal require ongoing fuel costs. Thus, a
comparison between
the levelized cost of energy for a renewable energy technology
and a fossil fuel
technology hinges on the difference in up-front capital costs
between the two tech-
nologies relative to expected fuel costs for the fossil fuel
technology.
We report forecasts of the levelized cost of electricity
generation published
by the US Energy Information Administration during the last
two decades. For
each year in our data, these forecasts report a projected
levelized cost of energy
for coal, natural gas, nuclear, and wind for electricity
generation plants to be built
5–10 years in the future. The forecast for solar is on a similar
timeframe, but for
a specific year (usually 4–7 years in the future).9 We prefer this
set of estimates of
levelized costs of energy to others that are available for a
number of reasons: they
are produced annually; the methodology is clearly explained and
documented; a
wide range of electricity-generating technologies is compared;
and the time series
is relatively long.
8 Specifically, the levelized cost of energy cost of energy is
calculated as:
LCOE = ∑ t=0
T δ t C t ________
∑ t=0 T δ t q t
29. ,
where δ is the discount factor, T is the lifetime of a generating
technology, and C and q are the technol-
ogy’s per-period costs and production, respectively.
9 For 2007, the projection is for 2014; for 2008 through 2011, it
is for 2016; for 2012 it is for 2017; 2013
for 2018; and, 2014 for 2019. Therefore, the average across all
of these years is a six-year forecast, while
the last four years report a five-year forecast.
j_covert_301.indd 127 1/20/16 6:57 AM
128 Journal of Economic Perspectives
One could certainly argue that a longer-term cost outlook would
be more
appropriate. We focus on estimates 5–10 years out for at least
two reasons. First,
many analysts believe that it is important to reduce CO2
emissions in the next decade
to mitigate the odds of disruptive climate change. Second, while
longer-term costs
estimates might exist (although we are unaware of a reasonably
long series), they
are believed to be very imprecise.
Figure 4 plots the forecasts from the US Energy Information
Administration
for the last 18 years. Perhaps the most striking finding shown in
the figure is the
dramatic fall in the cost of solar energy during the past five
years. The 2009 forecast
for the near-term levelized cost of solar power was nearly
30. $450/MWh of electricity
generated, while the 2014 number is under $150/MWh. The
speed of these reduc-
tions appears to have subsided, but the downward trend
continues.
The decline in the costs of solar energy is indeed rapid, but it
seems plau-
sible. For example, the current cost of solar energy can be
inferred from auctions
of photovoltaic installations—in which the prices imply long-
run average cost per
megawatt-hour of electricity generated. For example, in
November 2014, Dubai’s
state utility held an auction for 100 MWs of photovoltaic power
over a 25-year period.
The lowest bid was $59.8/MWh. More generally, Bollinger and
Seel (2015) docu-
ment that utilities in the southwestern parts of the United States
are now routinely
acquiring power from new solar photovoltaic projects at prices
in the range of
$40–$50/MWh. Though these new projects receive a federal
investment tax credit
Figure 4
Levelized Cost of Energy (LCOE) Forecasts from the US
Energy Information
Administration
Source: EIA Annual Energy Outlook reports from 1997 to 2014.
0
50
33. Will We Ever Stop Using Fossil Fuels? 129
equal to 30 percent of construction cost, their implied “real”
costs are still near or
below the levelized cost of energy estimates for natural gas
generation in Figure 4.
However, these examples of highly competitive prices for solar
energy are from
specific locations that are exceptionally well-suited for
generating solar energy. In
contrast, Figure 4 reports the average forecast across locations,
including locations
where solar exposure may be limited or wind speeds may be
slow. Thus, the average
levelized cost of solar—even given that more favorable sites are
being chosen for
solar—is still twice that of natural gas in the United States.
Wind power seems close
to cost competitive with fossil fuel generation in many
locations. As with solar, it is
complicated to calculate the exact underlying costs of wind
power, due to the avail-
ability of investment and production tax credits and support
from state renewable
portfolio standards.
The levelized cost for an electricity technology is only one
dimension to be
taken into account in making comparisons. Three additional
challenges exist. First,
both the intensity of sunlight and the speed of the wind vary
tremendously across
space,10 meaning that the same solar panel or wind turbine
installed in one loca-
tion will generate vastly different amounts of electricity than if
34. it were installed in
another location. This implies that the long-run marginal cost of
solar and wind will
be upward sloping and large-scale deployment in some areas is
likely to be infeasible.
Second, solar and wind energy are inevitably intermittent,
which requires either
increases in backup generation (often supplied by natural gas
generators) or increases
in energy storage that aren’t typically reflected in the numerator
of the basic levelized
cost of energy calculation. These costs will depend upon a
variety of factors, such
as the level of penetration, the degree of variation in generation
from the renew-
able resources, and the correlation in generation across
renewable resources. While
more research on magnitude of these costs is needed, some
estimates exist; these
estimates are likely to be very site-specific since they depend
on the variability in solar
and wind availability. The bulk of this research simulates
electricity systems under
varying penetration levels of renewables assuming a specific
location. Mills and Wiser
(2010) simulate the costs of operating an electricity system
under different penetra-
tion of renewables using detailed simulated output from
Midwestern solar and wind
installations. They find that for a 10 percent penetration of solar
photovoltaic power,
intermittency can add as much as $39 per MWh, when the solar
is installed in one
location, to as little as $3 per MWh when it is installed across
25 different sites. The
35. intermittency costs of a 10 percent penetration of wind across
25 sites are simulated
to be below $2 per MWh. In contrast, Wolak (2015) suggests
that the costs of inter-
mittency in California are likely to be high because the benefits
from diversifying site
locations are small.
Finally, because the generation from solar (and wind) resources
in a given
area tend to be positively correlated, large-scale penetration of
either resource will
10 It is also possible for fossil fuel technologies to have
different localized cost of energy in different
places as a result of fuel transportation constraints. For
example, natural gas prices and coal prices vary
significantly across the United States (as shown by US Energy
Information Administration data).
j_covert_301.indd 129 1/20/16 6:57 AM
130 Journal of Economic Perspectives
inevitably reduce the value of incremental capacity additions.
The impact of this on
net demand for electricity (after netting out the supply of solar
resources) within
California has generated what is being referred to as the
California Independent
System Operator’s (CAISO) “Duck Curve,” represented in
Figure 5. The CAISO has
forecast demand for electricity, net of renewable generation, in
each year through
36. 2020, when the required amount of generation from renewables
hits 30 percent.
Figure 5 shows these forecasts for March 31. The figure
illustrates that as progres-
sively more and more renewables hit the market, net demand
will be lowest during
daytime hours and prices during those hours will obviously fall,
making additional
investments in renewables less valuable.
Intermittency and the large reductions in net demand during
peak generation
periods imply that, absent economical storage technologies,
solar and wind power
are ill-suited for baseload generation which is currently covered
by coal, natural gas,
nuclear, and hydroelectric power.
The levelized costs for fossil fuel technologies presented above
also ignore
externalities. How much would pricing the externalities
associated with carbon
Figure 5
California ISO’s “Duck Curve”
(Net load–March 31)
Source: Figure 2 from “Fast Facts” published by California ISO,
available at: https://www.caiso.com/
Documents/FlexibleResourcesHelpRenewables_FastFacts.pdf.
Notes: This graph shows net electricity demand (load), across
the hours of the day on March 31, as California
approaches penetration of 30 percent renewables by 2020.
Because the renewables will predominately be
solar, and solar generation peaks during the day, net demand
will continue to fall during the day.
38. 2 0 1 3 (actual)
Hour
2020
2016
2015
2012
(actual)
2019
2018
ramp need
~13,000 MW
in three hours
overgeneration
risk
3am
j_covert_301.indd 130 1/20/16 6:57 AM
Thomas Covert, Michael Greenstone, and Christopher R. Knittel
131
dioxide emissions change these conclusions? Based on
Greenstone, Kopits, and
Wolverton (2013), the US government applies a social cost of
carbon of $43 per
39. metric ton of carbon dioxide in 2015 dollars. Using this value,
the carbon dioxide
externality for the typical natural gas plant is $20 per MWh,
while the externality for
the typical coal plant is $40 per MWh. But the US Energy
Information Administra-
tion forecasts that the gap between average levelized costs for
solar and natural gas
will still be about $50 per MWh in the near-term.
Replacing Oil Usage in Motor Vehicles
While there are many substitutes for fossil fuels in electricity
generation, the pri-
mary path for moving away from them in the transportation
sector is the use of battery
powered electric vehicles, which in turn requires several
technology breakthroughs to
occur. First, even if oil prices were at $100 per barrel, the price
of batteries that store
the energy necessary to power these vehicles needs to decrease
by a factor of three.
Second, the time needed for these batteries to charge must be
shortened. Third, the
electricity that is fueling these cars will need to have
sufficiently lower carbon content
than petroleum. Otherwise, we could transition from oil-based
transportation with
moderately high carbon emissions to coal-fired-electricity-based
transportation
with even higher carbon emissions. As noted in Graff Zivin,
Kotchen, and Mansur
(2014), effective carbon emissions from electric vehicles that
are powered by the exist-
ing US power plant fleet are generally higher than emissions
from high-efficiency
40. gasoline-powered vehicles. Only 12 percent of fossil-fueled
power plants have low
enough carbon emissions that electric vehicles powered by them
would have lower
emissions than a Toyota Prius.
The large-scale adoption of electric vehicles, instead of
petroleum-based
internal combustion engine vehicles, seems likely to require all
three of these
events. To date, none of them have happened. The previous
subsection discussed
the prospects for greening the electrical grid. Refueling times,
as well as the absence
of an abundant refueling infrastructure, remain challenges. First
we will explore the
necessary innovation in batteries.
What is the magnitude of the necessary improvement in storage
technologies?
Here, we describe some back-of-the-envelope calculations that
provide a sense of the
present discounted value of operating an internal combustion
engine, compared
with the present discounted cost of operating an electric
vehicle. The bottom line
from these calculations is that truly dramatic improvements in
battery technology
are necessary to bring these technologies into cost parity.
We want to compare the operating costs of an electric vehicle to
an internal
combustion engine. We assume a 3,000-pound vehicle. (For
comparison, the
2015 Honda Accord has four doors and a four-cylinder engine,
weighs about
41. 3,200 pounds, and gets a combined-fuel economy of 33 miles
per gallon.11) We
11 The official fuel economy rating is 31 miles per gallon,
while the user-reported fuel economy is
33.8 miles per gallon. See the US Department of Energy website
at https://www.fueleconomy.gov/feg/
PowerSearch.do?action=noform&path=7&year=2015&make=Ho
nda&model=Accord&srchtyp=ymm.
j_covert_301.indd 131 1/20/16 6:57 AM
132 Journal of Economic Perspectives
assume both the electric car and the internal combustion engine
car are driven
15,000 miles per year, and we use a discount rate of 5 percent.
For the internal combustion engine, we assume that it presently
gets
30 miles per gallon. For the electric vehicle, we consider a
battery size for a
range of 250 miles, which of course is still shorter than driving
range of most
current internal combustion vehicles. We use a price for
purchasing electricity of
12.2 cents per kWh, which is consistent with the average US
retail price in 2014.
The electric vehicle is assumed to consume 0.3 kilowatt-hours
electricity per mile.
Finally, because internal combustion engines tend to be more
costly than electric
motors, we “credit” electric vehicles by $1,000 (Peterson and
Michalek 2013).
42. Current battery costs for an electric vehicle are roughly $325
per kWh. This esti-
mate is consistent with the cost of Tesla’s Powerwall home
battery, which retails for a
price of $350 per kWh for the 10 kWh model (and does not
include the price of an
inverter for use in the home). This cost estimate may be lower
than an average battery
cost. For example, Tesla charges $3,000 for an extra 5 kWhs of
battery capacity in
its Model S, which is $600 per extra kWh; however, this
incremental price may also
include some level of price discrimination on the part of Tesla.
In a 2014 “EV Every-
where Grand Challenge” study, the US Department of Energy
finds that the current
battery cost is $325 per kWh.12 At a battery cost of $325 per
kWh, the price of oil would
need to exceed $350 per barrel before the electric vehicle was
cheaper to operate.13
During 2015, the average price of oil was approximately
$49 per barrel. At present,
the costs of batteries make large-scale penetration of electric
vehicles unlikely.
How is this comparison between the operating costs of an
internal combus-
tion engine and an electric vehicle likely to evolve into the
future? In these kinds
of comparisons, a common mistake is to compare future costs of
an electric vehicle
with current costs of an internal combustion engine. But this is
the wrong test.
Future electric vehicles will be competing against future
combustion engine vehi-
43. cles, not current ones. There will be technological progress in
all areas, not only for
low-carbon technologies.
The historical record suggests that we should expect persistent
innovation
in the efficiency of combustion engine vehicles, just as it
suggests that there will
be continued innovation in the extraction of fossil fuels. For the
internal combus-
tion engine, we assume that the fuel economy grows at 2 percent
per year, which is
consistent with Knittel (2011).
As a basis for estimating the future price trajectory of batteries,
Nykvist and
Nilsson (2015) survey 85 peer-reviewed estimates of current
and future battery costs
published since 2008. They also report battery cost estimates
for the Nissan Leaf,
12 A presentation connected to the study gives a range of $325–
500 per kWh. http://energy.gov/sites/
prod/files/2014/03/f8/5_howell_b.pdf.
13 To connect the price of gasoline to the price of oil, we
regress the log of historic gasoline prices on
the log of oil prices to capture the nonlinear relationship
between gasoline and oil prices. We use data
from the US Energy Information Administration from April
1993 to July 2015. The estimated intercept is
−1.57; the slope is 0.6046. The R 2 is 0.98. The general
conclusions are unchanged if we instead assume
a linear relationship between gasoline and oil prices.
j_covert_301.indd 132 1/20/16 6:57 AM
44. Will We Ever Stop Using Fossil Fuels? 133
Tesla S, and other electric vehicles. They find large reductions
in battery costs over
the past 10 years. However, their data also suggest battery costs
are predicted to level
off between $150 to $300 per kWh over the next 15 years. The
same US Department
of Energy (2014) “EV Everywhere” presentation discussed
above defines a “target”
battery cost of $125 per kWh by 2022.
We can extend the calculation above for a variety of oil-price–
battery-cost pairs
by calculating the indifference price of oil for a given battery
cost. Figure 6 plots this
relationship across battery costs of 0 to $400 per kWh. For this
graph, we compare
the technologies in 2020 allowing for the efficiency of internal
combustion engine
vehicles to increase by 2 percent per year. Even at the US
Department of Energy
target price for 2020, oil prices would have to rise to $115 per
barrel for electric
Figure 6
Break-even Oil and Battery Costs
Notes: This graph plots the relationship between oil prices and
battery costs such that the present dis-
counted value of owning and operating an internal combustion
engine vehicle equals the present
discounted value of owning and operating an electric vehicle
assuming the year is 2020. We assume the
45. vehicle is driven 15,000 miles per year. We use the average
retail price of electricity of 12.2 cents per
kWh to charge the electric vehicle. We estimate the relationship
between oil prices and gasoline prices
using monthly data from 1993 to 2015 and assume a log–log
relationship. We size the battery such that
the electric vehicle has a range of 250 miles, assuming
electricity consumption of 0.3 kWh per mile. The
cost of the electric vehicle is reduced by $1,000 to reflect the
lower costs associated with electric motors
relative to the internal combustion engine vehicle. The fuel
economy of internal combustion engines is
assumed to grow at an annual rate of 2 percent, consistent with
Knittel (2011).
0
100
200
300
400
500
600
700
800
0 50 100 150 200 250 300 350 400 450
P
46. ri
ce
o
f
o
il
i
n
2
02
0
($
/
b
b
l)
Cost of batteries in 2020 ($/KWh)
Equal costs, Electric and Internal Combustion Engine Vehicles
(EVs and ICEs)
DOE target cost of batteries
in 2020: $125
Break-even price of oil: $115
47. December 2020 WTI
oil futures price: $55
Break-even cost of
batteries: $64
EVs are cheaper than ICEs
ICEs are cheaper than EVs
DOE estimated current price of
batteries: $325
Break-even price of oil in 2020:
$420
Price of 10-kWh Tesla
Powerwall: $350
Break-even price of
oil in 2020: $470
0
100
200
300
400
500
48. 600
700
800
0 50 100 150 200 250 300 350 400 450
P
ri
ce
o
f
o
il
i
n
2
02
0
($
/
b
b
l)
Cost of batteries in 2020 ($/KWh)
49. Equal costs, Electric and Internal Combustion Engine Vehicles
(EVs and ICEs)
DOE target cost of batteries
in 2020: $125
Break-even price of oil: $115
December 2020 WTI
oil futures price: $55
Break-even cost of
batteries: $64
EVs are cheaper than ICEs
ICEs are cheaper than EVs
DOE estimated current price of
batteries: $325
Break-even price of oil in 2020:
$420
Price of 10-kWh Tesla
Powerwall: $350
Break-even price of
oil in 2020: $470
j_covert_301.indd 133 1/20/16 6:57 AM
50. 134 Journal of Economic Perspectives
vehicles to be cost-competitive with internal combustion
engines under the assump-
tions discussed above. If battery costs remain at $325 per kWh,
oil prices would have
to exceed $420 per barrel. For comparison, the current
December 2020 oil futures
price using the West Texas Intermediate benchmark (observed
on December 18,
2015) was $55/barrel, requiring a battery cost that would fall to
$64 per kWh.
These basic calculations make it clear that at least for the next
decade or two,
electric vehicles face an uphill battle. Not only are large
continuing decreases in
the price of batteries necessary, but oil prices would have to
increase by more than
financial markets currently predict.
Other barriers to widespread electric vehicle adoption are not
reflected in these
calculations. First, the estimates are built on a battery with a
range of 250 miles,
which for some drivers would not be enough. Second, we
assume that there is no
disutility associated with longer recharging times of electric
vehicles relative to
fueling times for internal combustion engines. Finally, oil
prices are endogenous, so
substantial penetration of electric vehicles would reduce
demand for oil. Provided
that the supply curve for oil is upward sloping (as it is in almost
all markets), this
51. drop in demand would translate into lower oil prices, making
gasoline vehicles
more attractive.
How does this comparison change if we include the social cost
of carbon dioxide
emissions? Assume that 20 pounds of carbon dioxide is emitted
into the atmosphere
for every gallon of gasoline burned. (Most of the weight of the
carbon dioxide arises
when the car emissions of carbon atoms in the gasoline combine
with oxygen in the air,
which is why a gallon of gasoline weighing about 6 pounds can
produce 20 pounds of
carbon dioxide.) As we noted above, a battery price of
$125 kWh implies $115/barrel
of oil as a break-even price for an internal combustion engine.
If we account for the
social cost of carbon and make the extreme assumption that
electricity for the electric
vehicle is carbon free, the break-even price for oil falls to $90
per barrel.
Our emphasis in this section has been on the scope for battery
technologies to
unseat oil in transportation as well as solar and wind resources
as noncarbon methods
of generating electricity. There are other noncarbon alternatives
for producing
energy. In some parts of the world, including Africa and South
America, some propor-
tion of the rising demand for electricity might be met by
hydroelectric power. Certain
regions may have possibilities for electricity generated by
geothermal energy or ocean
thermal gradients. We mentioned earlier that we were setting
52. aside any discussion
of nuclear power in this paper, given the high and rapidly rising
costs of nuclear
power generation in recent decades. We are generally
supportive of research and
development into all of these other noncarbon methods of
generating electricity.
However, the International Energy Administration Agency
(2015) projects that fossil
fuels will account for 79 percent of total energy supply in 2040
under the current,
business-as-usual policies, which already takes into account
some rise in these alterna-
tive noncarbon energy production technologies. In the medium-
run of the next few
decades, none of these alternatives seem to have the potential
based on their produc-
tion costs (that is, without government policies to raise the
costs of carbon emissions)
to reduce the use of fossil fuels dramatically below these
projections.
j_covert_301.indd 134 1/20/16 6:57 AM
Thomas Covert, Michael Greenstone, and Christopher R. Knittel
135
Discussion
Our conclusion is that in the absence of substantial greenhouse
gas policies,
the US and the global economy are unlikely to stop relying on
fossil fuels as the
primary source of energy. The physical supply of fossil fuels is
53. highly unlikely to run
out, especially if future technological change makes major new
sources like oil shale
and methane hydrates commercially viable. Alternative sources
of clean energy like
solar and wind power, which can be used both to generate
electricity and to fuel
electric vehicles, have seen substantial progress in reducing
costs, but at least in the
short- and middle-term, they are unlikely to play a major role in
base-load electrical
capacity or in replacing petroleum-fueled internal combustion
engines. Thus, the
current, business-as-usual combination of markets and policies
doesn’t seem likely
to diminish greenhouse gases on their own.
What are the consequences of a continued reliance on fossil
fuels? We
conducted some back-of-the-envelope calculations of the
potential warming asso-
ciated with using all available fossil fuels. This requires
estimates of total reserves
and resources of each fossil fuel, carbon conversion factors,
estimates of historical
emissions, and a model to convert carbon dioxide emissions into
temperature
changes. It is important to note that this exercise is based on
high levels of green-
house gas emissions for many decades beyond 2100. For
example, our calculations
are based on total carbon emissions ranging from 12,744 to
17,407 gigatons of CO2.
For comparison, the business-as-usual scenario from IPCC
(2013) has cumulative
emissions of 6,180 gigatons of CO2 between 2012 and 2100.
54. The calculations are
described in detail in a web appendix.14 Our headline finding is
that the combus-
tion of currently known fossil fuels would increase global
average temperatures by
10°F to 15°F, depending on the choice of carbon conversion
factors and model.
Such scenarios imply difficult-to-imagine change in the planet
and dramatic threats
to human well-being in many parts of the world. Further, these
estimates do not
account for advances in fossil fuel extraction techniques that
could make other
deposits economically accessible; for example, the use of oil
shale and methane
hydrate deposits would add another 1.5°F to 6.2°F of warming.
Research on the
economic consequences of such changes in temperatures is an
important area that
is rapidly advancing (for example, Deschênes and Greenstone
2011).
What are the prospects for avoiding this dystopian future? At a
high level, there
are two market failures—greenhouse gas emissions are not
priced adequately, and
basic or appropriable research and development is too often
underfunded—
and the corresponding solutions of pricing emissions and
subsidizing basic
research and development are easy to identify. However, the
politics of imple-
menting such policies are complex, particularly because energy
consumption is
projected to grow the most in low- and middle-income countries
during the coming
55. 14 This appendix is available with this paper at http://e-jep.org.
Alternatively, see the following link
for details on these calculations:
https://epic.uchicago.edu/sites/default/files/Calculating%20the
%20
Temperature%20Potential%20of%20Fossil%20Fuels.pdf.
j_covert_301.indd 135 1/20/16 6:57 AM
136 Journal of Economic Perspectives
decades, and thus the majority of emissions cuts would need to
take place in those
countries. Without direct compensation, global emissions cuts
will require the
poorer countries to use and pay for more expensive energy
sources. The last sev-
eral decades have seen limited global progress in tackling these
policy problems.
The Conference of Parties (COP21) climate conference in Paris
in December
2015 has set out the broad outlines of what could constitute a
dramatic change
in global climate policy. Whether this high-level voluntary
agreement leads to the
climate policies necessary to correct the market failures related
to greenhouse gases
around the globe will be determined in the coming years and
decades. Ultimately,
their enactment would greatly reduce the probability that the
world will have to
contend with disruptive climate change. The alternative is to
56. hope that the fickle
finger of fate will point the way to low-carbon energy sources
that rapidly become
cheaper than the abundant fossil fuels on their own. But hope is
too infrequently a
successful strategy.
References
Adelman, Morris A. 1993. The Economics of Petro-
leum Supply: Papers by M. A. Adelman, 1962–1993.
MIT Press.
Atkins, Frank J., and Alan J. MacFadyen. 2008.
“A Resource Whose Time Has Come? The Alberta
Oil Sands as an Economic Resource.” Energy
Journal 29(special issue): 77–98.
Bolinger, Brian, and Joachim Seel. 2015.
“Utility-Scale Solar 2014: An Empirical Analysis of
Project Cost, Performance, and Pricing Trends in
the United States.” Lawrence Berkeley National
Laboratory report LBNL-1000917.
Boswell, Ray, Koji Yamamoto, Sung-Rock Lee,
Timothy Collett, Pushpendra Kumar, and Scott
Dallimore. 2014. “Methane Hydrates.” Chap. 8 in
Future Energy, 2nd edition. Elsevier.
BP. 2015. BP Statistical Review of World Energy
2015. Available at: http://www.bp.com/en/
global/corporate/energy-economics/statistical
-review-of-world-energy.html.
Brandt, Adam R. 2008. “Converting Oil Shale
to Liquid Fuels: Energy Inputs and Greenhouse
57. Gas Emissions of the Shell in Situ Conversion
Process.” Environmental Science and Technology
42(19): 7489–95.
Carbon Dioxide Information Analysis Center.
No date. http://cdiac.ornl.gov/ftp/trends/co2
_emis/Preliminary_CO2_emissions_2012.xlsx.
Carter, Jimmy. 1977. “Address to the Nation on
Energy.” April 18. The American Presidency Project.
http://www.presidency.ucsb.edu/ws/index
.php?pid=7369.
Chay, Kenneth Y., and Michael Greenstone.
2003. “The Impact of Air Pollution on Infant
Mortality: Evidence from Geographic Variation
in Pollution Shocks Induced by a Recession.”
Quarterly Journal of Economics 118(3): 1121–67.
Chen, Yuyu, Avraham Ebenstein, Michael
Greenstone, and Hongbin Li. 2013. “Evidence on
the Impact of Sustained Exposure to Air Pollu-
tion on Life Expectancy from China’s Huai River
Policy.” Proceedings of the National Academy of Sciences
110(32): 12936–41.
Davis, Lucas W. 2012. “Prospects for Nuclear
Power.” Journal of Economic Perspectives 26(1): 49–66.
Deschênes, Olivier, and Michael Greenstone.
2011. “Climate Change, Mortality, and Adaptation:
Evidence from Annual Fluctuations in Weather
in the US.” American Economic Journal: Applied
Economics 3(4): 152–85.
j_covert_301.indd 136 1/20/16 6:57 AM
58. Will We Ever Stop Using Fossil Fuels? 137
Deutch, John M., Charles W. Forsberg, Andrew
C. Kadak, Mujid S. Kazimi, Ernest J. Moniz, and
John E. Parsons. 2009. Update of the MIT 2003 Future
of Nuclear Power. An Interdisciplinary MIT Study.
http://web.mit.edu/nuclearpower/pdf/nuclear
power-update2009.pdf.
Dyni, John R. 2006. “Geology and Resources of
Some World Oil-Shale Deposits.” USGS Scientific
Investigations Report 2005-5294. http://pubs.usgs.
gov/sir/2005/5294/pdf/sir5294_508.pdf.
Graff Zivin, Joshua S., Matthew J. Kotchen,
and Erin T. Mansur. 2014. “Spatial and Temporal
Heterogeneity of Marginal Emissions: Implications
for Electric Cars and Other Electricity-Shifting Poli-
cies.” Journal of Economic Behavior and Organization
107(Part A): 248–68.
Greenstone, Michael, Elizabeth Kopits, and
Ann Wolverton. 2013. “Developing a Social Cost
of Carbon for US Regulatory Analysis: A Method-
ology and Interpretation.” Review of Environmental
Economics and Policy 7(1): 23–46.
Hubbert, M. King. 1956. “Nuclear Energy and
the Fossil Fuels.” Publication no. 95. Shell Devel-
opment Company, Exploration Production and
Research Division. http://www.hubbertpeak.com/
hubbert/1956/1956.pdf.
59. Intergovernmental Panel on Climate Change
(IPCC). 2013. “Summary for Policymakers.” In:
Climate Change 2013: The Physical Science Basis,
edited by T. F. Stocker et al. Contribution of
Working Group I to the Fifth Assessment Report
of the Intergovernmental Panel on Climate
Change. Cambridge University Press.
International Energy Agency. 2015. World Energy
Outlook 2015. http://www.worldenergyoutlook.org/
weo2015/.
Knittel, Christopher R. 2011. “Automobiles
on Steroids: Product Attribute Trade-offs and
Technological Progress in the Automobile Sector.”
American Economic Review 101(7): 3368–99.
Knittel, Christopher R., Douglas L. Miller,
and Nicholas J. Sanders. Forthcoming. “Caution,
Drivers! Children Present: Traffic, Pollution, and
Infant Health.” Review of Economics and Statistics.
McGlade, Christophe, and Paul Ekins. 2015.
“The Geographical Distribution of Fossil Fuels
Unused When Limiting Global Warming to 2°C.”
Nature 517( January 8): 187–90.
McKinsey & Company. 2009. Pathways to a
Low-Carbon Economy. http://www.mckinsey.com/
client_service/sustainability/latest_thinking/
pathways_to_a_low_carbon_economy.
Mills Andrew, and Ryan Wiser. 2010. “Impli-
cations of Wide-Area Geographic Diversity
for Short-Term Variability of Solar Power.”
LBNL-3884E, Lawrence Berkeley National Labora-
60. tory, Berkeley, California.
Murray, James, and David King. 2012. “Climate
Policy: Oil’s Tipping Point Has Passed.” Nature
481( January 26): 433–35.
Nykvist, Björn and Måns Nilsson. 2015. “Rapidly
Falling Costs of Battery Packs for Electric Vehicles.”
Nature Climate Change 5: 329–332.
Peterson, Scott B., and Jeremy J. Michalek.
2013. “Cost-Effectiveness of Plug-in Hybrid
Electric Vehicle Battery Capacity and Charging
Infrastructure Investment for Reducing US Gaso-
line Consumption.” Energy Policy 52: 429–38.
Rutledge, David B. 2013. “Projections for
Ultimate World Coal Production from Produc-
tion Histories Through 2012.” Presentation to
the 125th Anniversary Annual Meeting and Expo
of the Geological Society of America, Annual
Meeting, Denver, CO, October 2013.
Shellberger, Michael, Ted Nordhaus, Alex
Trembath, and Jesse Jenkins. 2012. “Where the
Shale Gas Revolution Came From.” Technical
Report, The Breakthrough Institute, May.
US Department of Energy. 2014. “EV Every-
where Grand Challenge.” DOE/EE-1024. http://
energy.gov/sites/prod/files/2014/02/f8/
eveverywhere_road_to_success.pdf.
US Energy Information Administration (EIA).
2012. “Potential of Gas Hydrates is Great, But Prac-
tical Development is Far Off.” November 7. http://
61. www.eia.gov/todayinenergy/detail.cfm?id=8690.
US Energy Information Administration (EIA).
2013. Technically Recoverable Shale Oil and Shale Gas
Resources: An Assessment of 137 Shale Formations in
41 Countries Outside the United States. June. http://
www.eia.gov/analysis/studies/worldshalegas/pdf/
fullreport.pdf.
US Energy Information Administration (EIA).
No date. “International Energy Statistics.” Database.
http://www.eia.gov/cfapps/ipdbproject/IED
Index3.cfm.
US Environmental Protection Agency. No date.
Global Greenhouse Gas Emissions Data. http://
www3.epa.gov/climatechange/ghgemissions/
global.html.
Wolak, Frank. 2015. “Mean versus Standard
Deviation Trade-offs in Wind and Solar Energy
Investments: The Case of California.” Unpublished
paper, Stanford University.
j_covert_301.indd 137 1/20/16 6:57 AM
138 Journal of Economic Perspectives
j_covert_301.indd 138 1/20/16 6:57 AM
Copyright of Journal of Economic Perspectives is the property
of American Economic
62. Association and its content may not be copied or emailed to
multiple sites or posted to a
listserv without the copyright holder's express written
permission. However, users may print,
download, or email articles for individual use.
Will We Ever Stop Using Fossil Fuels?Supply: Peak Oil,
Natural Gas, and Coal?Demand: Will Low-Carbon Energy
Sources Knock Fossil Fuels Out of the Money?Replacing
Natural Gas and Coal in Electricity GenerationReplacing Oil
Usage in Motor VehiclesDiscussionREFERENCES
Bulletin
of the
Atomic
Scientists
IT IS 6 MINUTES TO MIDNIGHT
®
Interview
Stanford Ovshinsky: Pursuing
solar electricity at a cost equal
to or lower than that of coal
electricity
Abstract
The inventor and industrialistÑwhose materials-science
discoveries more than a half-century ago and sub-
sequent inventions led to broad advances in photovoltaics,
batteries, displays, and computer memoryÑ
describes his new efforts to develop cheaper and more efficient
photovoltaic technology. Ovshinsky offers
63. his perspective on institutional roadblocks to clean-energy
technologies and characterizes the successful
Photo: Douglas Elbinger.
Bulletin of the Atomic Scientists
67(3) 1–7
! The Author(s) 2011
Reprints and permissions:
sagepub.co.uk/journalsPermissions.nav
DOI: 10.1177/0096340211406877
http://thebulletin.sagepub.com
influence of the fossil-fuel lobby in Washington. He asserts that
he has established proof of principle for a
photovoltaic production plantÑone that could be built nowÑthat
is capable of building enough panels in a
year to generate a gigawatt rather than megawatts of solar
electricity and thus allow solar to compete eco-
nomically with electricity from fossil fuels. He says that in
building photovoltaics and related renewable-
energy infrastructure, America can again become the Òmachine
shop for the world.Ó
Keywords
batteries, climate change, coal, electric cars, photovoltaics,
renewable energy
T
hroughout the latter half of the
twentieth century, the largely self-
64. taught materials scientist Stanford
Ovshinsky was a technological and
industrial pioneer. In 1955, he trans-
formed the then-obscure field of Òamor-
phous materialsÓÑmaterials lacking an
ordered crystal structureÑby discover-
ing new kinds of semiconductors,
including thin-film amorphous silicon
for photovoltaic solar panels. (The field
took on the moniker ÒOvonics,Ó short for
ÒOvshinsky Electronics.Ó) Later, at his
company, Energy Conversion Devices,
he created a system for mass-manufac-
turing photovoltaic panels by depositing
these silicon semiconductors on a thin
metal sheet in a roll-to-roll process like
newspaper printing, a major step for-
ward. Other discoveries led to the
nickel metal hydride battery, which
enabled the electric and hybrid vehicle
industry, as well as certain types of com-
puter memory and liquid crystal dis-
plays (LCDs) that are in common
usage, as in thin-film TVs.
Along the way, Ovshinsky acquired an
appreciation of institutional roadblocks
to advanced energy technologies.
In 1992, a consortium consisting of the
US government and the big three auto
companiesÑGeneral Motors, Ford,
and ChryslerÑselected his nickel-metal-
hydride battery technology over 60
competitors to replace the heavier lead-
acid batteries for future electric cars.
65. The new battery technology, now a
mainstay of hybrids from Toyota,
Ford, Honda, and other automakers,
first appeared in the second-generation
EV1ÑGMÕs electric carÑand increased
the EV1Õs range to 140 miles. But although
GM bought a majority stake in the com-
pany, Ovonic Battery, the tide soon chan-
ged. The oil lobby killed CaliforniaÕs
zero-emissions vehicle requirement that
would have helped create markets for
electric and hybrid vehicles. And GM lit-
erally scrapped its EV1 fleet and sold its
share of Ovonic Battery to Texaco (now
part of Chevron), which was fighting
the California mandate, resulting in
Ovshinsky being kicked off the Ovonic
board.
Now, at 88, Ovshinsky is gearing up
again with visions of establishing a new
era in photovoltaic industrialization at the
scale needed to combat climate change. He
left Energy Conversion Devices in 2007
and now says he has mapped a new
approach to photovoltaic thin-film pro-
duction that speeds up the manufacturing
process by two orders of magnitude while
significantly increasing the efficiency of
the resulting materials. He asserts that
these basic advances could allow factories
to make enough solar panels in a year to
produce at least one gigawatt of electricity
annuallyÑroughly the scale of a nuclear
power plantÑat the price of coal.
66. BAS: You founded Energy
Conversion Devices a half-century ago
2 Bulletin of the Atomic Scientists 67(3)
to deploy Òcreative science to solve soci-
etal problems.Ó Did you imagine then
that in 2011, solar power would satisfy
barely one-tenth of one percent (0.1 per-
cent) of total US electricity?
Ovshinsky: I couldnÕt have given you
a figure. But with my late wife, IrisÑwho
started the company with me on January
1, 1960Ñwe knew that there were forces
that we had to face and struggles we
had to go through to achieve change,
and that we were in it for the long haul.
A lot of people think that change is
accomplished overnight. But a struggle
is always going on prior to and after
change. I knew that we had to be able
to prove everything along the way to
even get a chance to get to the table.
That is the reason that we always made
products to prove our suppositions.
BAS: Has the main roadblock been
inadequate technology or a failure of
policy to advance renewable electricity
on a large scale?
Ovshinsky: Solving problems in sci-
67. ence and technology is always part of the
process. But the real problem is what
happens after you overcome the technol-
ogy barriers. The very biggest barrier in
the United States is that there is no
energy policy that allows for new
approaches. Progress is blocked all the
time by the oil, automobile, coal, and util-
ity industries. These are special interests
that feel very challenged and seek to
postpone change as long as possible.
That is why IÕve sometimes had to
go to Japan and Korea to achieve success,
by licensing technologies to companies
like Sharp and Samsung for making solar
cells and thin-film LCD screens, which,
of course, was a huge profit center for
both countries. These countries knew
they needed to change to become com-
petitive. They understood that new
science and technology was an absolute
requirement, just as China does now.
The United States says it doesnÕt pick
winners or losers, but it is quite evident
from our fundamental lack of progress in
the area in energy that they certainly pick
losers because they do not understand
how to have a culture where innovation
can triumph.
BAS: What policy changes are
needed, besides the big one: a tax or
other price on carbon emissions, a ver-
sion of which the House passed last year
68. but the Senate killed?
Ovshinsky: A progressive energy
policy has to be based on the reality
of the need for success. This can
only be accomplished by means of
putting a price on carbon emissions
and by investing in infrastructure.
Infrastructure is not only roads and
bridges, but we need high-speed rail
and intelligent power grids that can
flexibly accept the variable inputs of
solar and wind power. Wind can be
very helpful in providing electricity
at night. Such infrastructure will accel-
erate the growth of renewable power
and I believe very firmly that hydro-
genÑborn in the Big Bang, the sun is
made of it, giving us the photons that
reach our photovoltaics and provide
electricityÑis the basic clean fuel for
transportation. With solar and hydro-
gen, there are no wars over oil, mini-
mizing the CO2 dramatically.
BAS: You donÕt think President
Obama can get these things done? HeÕs
not going to bring about much change?
Ovshinsky: IÕm so sad, because I
like the guy. Last year we both got
honorary degrees from the University
of Michigan. He gave a great talk. And
while he was going out, he said to me:
ÒKeep at it. Thank you. Keep at it.Ó
69. Interview 3
He has great potential to keep learning
and certainly tries to get the best
advice. He has an exceptional scientist
in [Energy Secretary] Steven Chu, and
I know that there are some great
people working in the Department of
Energy. LetÕs hope that they will be
able to succeed in this feverish time.
The real problem is that the public
seems not to believe in climate
change or appreciate the need to
escape from oil and the terrible prob-
lems associated with it, and part of the
reason is the anti-scientific campaigns
going on. In this respect, America is
endangered and losing its leadership
in the world. Because without an
industrial base that is based on new
science and technology, we can
expect continuing problems that
endanger our country and its future.
Does anyone really expect that
Congress will ever support renewables?
Current policy doesnÕt really support
anything new besides the possibility of
fuel out of enzymes [to make ethanol
from cellulosic plant waste]. It is what I
would call the postponement of the
future. So I donÕt see any possibility in
the present Congress, or any possibility
of Obama having any kind of real energy
70. policy that he can seriously institute.
BAS: Can new technology somehow
succeed when policy is tilted toward the
status quo?
Ovshinsky: Nothing changes with-
out struggle. As a child, I believed in a
Òcan-doÓ America. Today I believe that
bringing about fundamental change that
can help make the world a better place
and re-industrialize America requires
that we lead. We have to be able to
show that there are fundamental
answers, as in the past where invention
and leadership showed that we can have
telephones, telegraphs, railroads, auto-
mobiles, electricity, and aviation. We
can again become the machine shop for
the world, where our youth can have
new kinds of jobs that new science can
provide and so that the educational
system can integrate new knowledge
that will be helpful to our students for
their future.
As for me, I would like to show that
we are able to have a fundamental
answer that would allow us to achieve
a more peaceful, a less dangerous, and
a better and more equitable world for
everyone. For the sun provides energy
for everyone on earth, but so far, only
the advanced countries have made any
kind of attempt to use it properly.
71. Innovation is an absolute necessity for
fundamental change and that is why I
am doing what IÕm doing.
BAS: Can you explain your new asser-
tion about what you have achieved in terms
of photovoltaic panel manufacturing?
Ovshinsky: I can show now that we
can achieve solar energy, with good
profit, at a cost less than that of burning
of fossil fuel. That is a revolutionary
statement, and it canÕt be done over-
night, but it can and will be done. The
plant would be an ordinary-sized plant
of 150,000 square feet which would put
out a photovoltaic product of one giga-
watt per year. Unless we start making a
gigawatt in many plants, the cost of pho-
tovoltaics will never get down to the
cost of coalÑ which is what global soci-
ety needs.
This can be done with proper support
in no more than several years. The cost
of the production machine will be a few
pennies per watt, $350 million at the
most. IÕve proven in the past that the
first machine always costs more than
the subsequent ones. When you go into
4 Bulletin of the Atomic Scientists 67(3)
a high enough volume production, all
72. costs come down in the steepest decline
that you can think of. And you want to
build as many machines as possible in
every city in every country.
BAS: How does this approach differ
from what you were actually producing
in roll-to-roll production at Energy
Conversion Devices? Are you planning
to publish anything on the specifics?
WhatÕs the next step?
Ovshinsky: I have shown that I can
speed the rate of deposition of the pho-
tovoltaic materials by a factor of 100, as
well as increase the conversion efficien-
cies [of the finished product] to the
levels required for gigawatt production.
And this is all a start. Our platform per-
mits you to go much higher with time.
Take these together and you can have
electricity at pennies per kilowatt hour,
competitive with coal. Energy
Conversion Devices produces wonder-
ful products and has wonderfully tal-
ented people, but they cannot produce
cheap enough to be competitive to burn-
ing coal.
BAS: Your new goals are quite
ambitious.
Ovshinsky: Just like everybody
laughed at my 30 megawatt machine at
Energy Conversion Devices. Those
machines were a great success at a
73. time when people were only making sev-
eral megawatts. Now people will have
the same objections to the single-plant
gigawatt approach. But I built many
machines when I was head of the com-
pany, proving the principles of what I
wanted to prove.
I came from the shop floor, I love sci-
ence and technology and I am commit-
ted to building a gigawatt-plus in one
single photovoltaic production plant.
What I have done all my life is to actually
show that what others think canÕt be
done can be done. I can be evaluated
by what IÕve accomplished. We are
ready to go to the next stage now,
where the proof of principle we
achieved becomes the basis of building
the new plants all over the world. And
therefore, answering the problems that
our global economy and the future
needsÑto minimize CO2, build new
industries, rebuild America so that it is
the Òcan-doÓ country again, and take
away oil as the major cause of war. The
Japanese nuclear accident emphasizes
the value of using solar energy.
So I am ready to go to the next step, of
development of the product itself, and in
parallel, doing the design and proof
work for the manufacturing plant.
In other words, accelerate to build
plants as soon as possible.
74. BAS: Meanwhile, the utility-scale
solar power plants moving forward in
this country arenÕt photovoltaic but
Òsolar thermal,Ó capturing solar energy
to boil water and drive turbines. Some
15 gigawatts of solar-thermal plants are
proposed in California. ThatÕs what the
Energy Department has started support-
ing in terms of loan guarantees. WhatÕs
your take on these Energy Department
investments?
Ovshinsky: I think [solar thermal]
has a place in the energy strategy.
What they are doing is very good,
because nobody is doing anything else.
ItÕs a way of addressing the problem
right now. And I am all for it and for
the people who are doing it. But it is
not a universal solution. It is a solution
for special areas. I think, obviously, that
my approach is the way to go because it
is very low cost, and you donÕt need des-
erts and running water and other things
that the solar-thermal companies donÕt
Interview 5
like to talk about. And you can place our
thin-film products by the side of high-
ways or railroad tracks, on houses and
other buildings and, of course, in des-
erts. So I am all for what they are
75. doing, but the complete solution is
elsewhere.
BAS: The other main problem with
solar power is, of course, the need to
store power for when itÕs cloudy, and at
night.
Ovshinsky: Storage is very impor-
tant. When you solve a very fundamen-
tal problem, it puts the pressure on the
next problem. So then storage becomes
really an instant problem. I came up with
some approaches such as storing hydro-
gen safely and reversibly in a solid.
Using hydrogen as a storage medium
and energy carrier, we can drive auto-
mobiles without any pollution whatso-
ever and, at the same time, start
utilizing hydrogen storage in a solid
that could lead to a possible approach
for power-grid storage. I also believe
that wind is very important, in part
because it performs at night and can be
used in tandem with solar.
BAS: Hydrogen storage is a further-
off solution. What near-term power-
grid storage solution would most feasibly
allow variable solar power to make up
larger fractions of electricity in the
near term? Is there another materials-
science solution such as giant batteries,
or an information-technology oneÑthat
is, allowing utilities to manage demand
preciselyÑto match the variable
76. outputs?
Ovshinsky: Energy and information
are the twin pillars of our global econ-
omy. To me, information has always
been encoded energy. A key approach
to storage is to have flexible grid con-
trols to adjust demand, or to direct
excess power to distributed storage
sites at homes and offices, possibly
including the batteries in electric cars.
Existing approaches such as hydro
pumped storage and compressed air
are very useful, but limited, and will con-
tinue to play a role in the future. But it is
the unexpected giant steps that have
provided our present science and tech-
nology and we must continue to seek
more giant steps.
BAS: What countries do you consider
advanced in this arena and what policies
should the United States and others
emulate?
Ovshinsky: It is obvious that there is
much desire by China now to answer
their societal needs by not only relying
on old technology, but seeking to actu-
ally implement a well-thought-out scien-
tific and technological planning policy
that is based upon innovation.
As of now, China is the only major
country in the world that has a well-
77. thought-out plan in terms of renewables.
Of course, the smaller countries like
Denmark, and others, are also building
new renewable industries and providing
jobs for young people. But planning in
the United States is considered socialist.
For example, we cancel high-speed
trains. China builds high-speed trains.
In the United States, Obama is trying to
do that, but the governor of Florida says,
ÒNo, I wonÕt even take the money.Ó
In ChinaÕs case, they have many equiva-
lents of a free-enterprise system by
virtue of the fact that they do have com-
petition, between provinces, between
cities, but most importantly, they intelli-
gently plan and implement to build their
country! This is a very important point,
for they are very proud to be able to do
that. I asked one person who spoke per-
fect English why he gave up a very good
6 Bulletin of the Atomic Scientists 67(3)
job in Silicon Valley to come back to
China, and he said something that we
must all say: ÒI wanted to build my
country.Ó
IÕve always said such things when
asked. But I would also add that we
must consider what is happening in the
entire globe and it is part of our respon-
sibilities to assure that science and tech-
78. nology benefit the entire globe so that
people can live together in peace. And I
would like to produce what our country
and the entire global society needs to live
the kind of life that humanity requires.
BAS: China is already shipping half of
the worldÕs photovoltaics. Will they soon
be shipping the latest Ovshinsky product?
Ovshinsky: China has a big problem,
as does the rest of the world. They pres-
ently do not have a culture of innova-
tion. But China can offer very much in
manufacturing and can lower the cost so
that it is difficult for others to compete.
They know that that isnÕt enough; they
need innovation. As Chinese Premier
Wen Jiabao recently said, he was ÒsadÓ
that China remains primarily a
Òmanufacturing countryÓ rather than a
Òstrong creative or innovation country.Ó
Since IÕve been an inventor and scien-
tist and technologist all my life, I owe it
to any country in need to uphold the
principles that I started out with to
serve society, and that means not only
your own country, but the world.
It works out this way: One goes where
he is wanted; itÕs not enough that he is
needed. So our problem, and the worldÕs
problem, is that we need to develop a
culture that grows innovation. I am still
a journeyman looking for work that
gives life meaning and value. I believe
79. all countries have the possibility for
innovation, but unfortunately, there
must be a culture that nurtures it.
BAS: While we wait for coal-priced
solar, why not follow the German example
and force utilities to buy renewable power
at high rates, creating markets for solar
and thereby driving economies of scale?
Ovshinsky: What IÕm saying is that
we donÕt need that if we do gigawatt-
scale solar. Save the [subsidy] money,
use it where itÕs needed more. Germany
did what was right under the circum-
stances. The Germans know that the
government has to step in to show that
it represents the people and not just the
utilities. IsnÕt that what governments are
supposed to be for? But you have to have
a technology that you have thought
through and a society that understands
its needs.
BAS: What steps can be taken so that
construction of zero-emissions build-
ingsÑsuch as the new National
Renewable Energy Laboratory research
support facility in ColoradoÑis more
common, rather than so exceptional?
Ovshinsky: IÕm afraid that it is excep-
tional, knowing what the forces are, and
the initial costs to do that, even though
itÕs obvious that one should be doing it. I
applaud the NREL leadership and its
80. committed, talented scientists and tech-
nologists for taking the lead in this,
showing what can and should be done.
BAS: You are 88 years old. Thinking
about retirement?
Ovshinsky: I know this is contrary to
what you read in the books: that mathe-
maticians canÕt go beyond their 31st
birthday, and scientists are done by
about the time they are 40. Hell, I have
more than 400 patents and 15 pending
out there right now, and going for
more. As long as I know I can do it, it is
my civic responsibility to do it because
of the character of the problems.
Somebody has got to do it.
Interview 7
Copyright of Bulletin of the Atomic Scientists is the property of
Bulletin of the Atomic Scientists and its
content may not be copied or emailed to multiple sites or posted
to a listserv without the copyright holder's
express written permission. However, users may print,
download, or email articles for individual use.
34 B u l l e t i n o f t h e Ato m i c S c i e n t i S t S N O
81. V E M B E R / D EC E M B E R 2 0 0 8
hat may be one of
the most important de-
bates of the 21st centu-
ry has been taking place
just below the threshold
of public perception. This debate con-
cerns how much longer it will be before
world oil production starts to fall, forc-
ing a transition to other sources of ener-
gy and probably a simpler lifestyle.
From time to time, a spike in gasoline
prices or an election forces aspects of this
debate to the public’s attention, and var-
ious solutions—more drilling, more wind
turbines, more biofuels—are proposed .
Most of these solutions fail to grapple
with the real issue—that world oil pro-
duction, according to the Internation-
al Energy Agency (IEA), has been essen-
tially flat for several years and will soon
steadily and irreversibly decline. Few
want to hear this message for it will mean
the rapid and dramatic decline in the
world’s standard of living. In many of the
underdeveloped megacities in Africa and
Asia supplies of kerosene and propane
for cooking already are in short supply
or are becoming unaffordable. Sputter-
ing hydroelectric stations affected by
droughts and unaffordable $100-per-bar-
rel oil are resulting in electricity short-
82. ages and failing water and sanitation
systems. For many, the peaking of the
world’s oil supply will raise issues not
just of living standards but of survival.
For the last 40 years, the United States,
which has been largely insulated from
the early tremors of oil depletion, has im-
ported all the oil its population has need-
ed with large trade deficits and the sale of
U.S. Treasury bills to foreign countries.
Real trouble, however, is not far away, ac-
cording to peak oil theory. Sales of U.S.-
made automobiles are in free fall due to
$4-per-gallon gasoline, and the U.S. air-
line industry is contracting rapidly.
The declining availability of oil prod-
ucts will mean steadily increasing prices
for nearly everything else. As prices rise,
the use of gasoline-powered automobiles,
boats, all-terrain vehicles, and RVs will
wane. Gradually, more and more people
could be priced out of using their person-
al vehicles as freely as they do now.
Before we get too far ahead of our-
selves, let’s go back in history to un-
derstand where the idea of such a
potentially dire future arose.
If you don’t believe in the theory of
evolution, then you are likely to believe
that oil is abiotic and is constantly being
formed and pushed up for our use from
83. somewhere deep in the earth. For the
rest of us, however, fossil fuels are un-
derstood to be composed of organic mat-
ter from organisms that lived hundreds of
millions of years ago, which was buried
and pushed deep underground by geolog-
ical forces. Over the eons, that material
was converted into oil, coal, and natural
gas by high temperature and pressure.
Peak oil starts with not only the question
of how much fossil fuels were formed but
also how much can realistically be ex-
tracted from beneath Earth’s surface.
Hydrocarbons within the earth come
in many forms, ranging from the desir-
able light, low-sulfur crude oils to heavy
oils, tar sands, kerogen (sort of a “pre-
oil” substance found in prodigious quan-
tities inside shale), and finally natural gas
and coal. Fossil fuels are also found in a
wide variety of locations. Some are found
on land, some deep beneath the sea, and
some below polar ice. Much of the debate
over the future of world oil production
stems from a failure to appreciate that all
oil is not created equal. Unfortunately,
most of the high-quality, cheap, and easy-
to-extract oil has already been consumed.
From the very beginning of the oil age,
some 150 years ago, experts have pre-
dicted that it was about to run out. Until
50 years ago, such predictions were idle
speculation, as most of the world had not
84. been fully prospected and no one had a
clear idea about how much oil existed.
The first real insight was gained in 1956,
when Shell Oil geologist M. King Hub-
bert calculated that U.S. oil production in
the lower 48 states would peak in 1970.
Hubbert, of course, had the benefit of
studying a region that, by that time, had
been fully explored so that major new oil
finds were unlikely.
The heart of Hubbert’s theory is the
observation that the rate of oil produc-
tion from a well or a field generally fol-
lows a bell-shaped curve and reaches
peak production after about half of the
oil has been extracted.
When U.S. oil production actually did
peak when Hubbert predicted and the
country’s demand for oil continued to
rise, the United States could no longer
control world oil prices as it had done
for many previous years. Power shifted
to OPEC, the Mideast oil cartel, which
had substantial oil, little domestic con-
sumption, and the ability to control pro-
duction and thereby prices.
In 1973, the world learned a new lesson
about oil, which haunts us to this day,
when OPEC exercised its power over the
global oil market to enforce an embargo
on Israel’s supporters in the Yom Kippur
War. U.S. imports of Arab oil dropped
within two weeks from 1.2 million bar-
85. rels per day to 19,000. The United States
experienced nationwide gasoline short-
ages and the quadrupling of gasoline
prices. Shortages also developed during
the early days of the Iran-Iraq War, when
supplies of oil were reduced.
Later, however, in the 1980s and 1990s
oil experienced its golden years. New
IN REVIEW
Peak oil
By tOM whipplE
W
Vol. 64, No. 5, pp. 34-37
DOI: 10.2968/064005011
N O V E M B E R / D EC E M B E R 2 0 0 8 B u l l e t i n o
f t h e Ato m i c S c i e n t i S t S 35
discoveries in Alaska, the North Sea,
Mexico, and off the coasts of Africa and
Brazil led to a surfeit of oil. Crude prices
stayed around $20 a barrel and supplies
were plentiful. World oil consumption
grew rapidly from 58 million barrels per
day in 1980 to 76 million in 2000. While
the Soviet Union may have been done
in by cheap oil in the late 1980s (oil was
selling so cheaply that it was below the
Soviets’ cost of production), in the Unit-
86. ed States, plans for oil conservation and
efficiency that were formulated dur-
ing the oil shocks of the 1970s went by
the wayside, and the country went on
an oil binge that lasted for the next 25
years. Consumption increased and reli-
ance on imported oil (and the countries
that exert control over supply and thus
price) increased as well. Today, nearly
70 percent of oil consumed daily in the
United States is imported.
Warning bells began to sound again
when an article by two respected
European geologists, Colin Campbell and
Jean Laherrère, appeared in the March
1998 issue of Scientific American indicat-
ing that the world was rapidly consum-
ing its known oil reserves. Crude oil was
being pumped out of the ground much
faster than new oil was being discovered.
The authors predicted oil peaking global-
ly within 10 years.
The article’s publication marks the be-
ginning of the peak oil debates that con-
tinue to this day. Most criticism of peak
oil has centered on the idea that increas-
ing oil prices would bring forth new sup-
plies from unconventional sources, such
as the Alberta tar sands, long considered
too expensive to extract and process into
usable oil. Many have pointed to devel-
oping technologies such as horizon-
tal drilling, 3-D seismology, and oil field
87. flooding, which peak oil critics believe
will bring so much new oil to market that
prices will fall, providing plentiful sup-
ply for at least another 30 –40 years. The
U.S. National Geodetic Survey contrib-
uted to this belief by releasing a report
that estimated another trillion barrels of
conventional oil were waiting to be dis-
covered and produced.
But an important part of this debate,
often left out by such projections, is that
oil these days is not always the black stuff
that comes up from a well. Although tra-
ditional petroleum constitutes the bulk
of what is called oil, there are also liquids
that are extracted from natural gas, heavy
oil that is extracted from tar sands, and
biofuels that are produced by distilling
sugars from plants and processing plant
oils. While conventional crude oil and
the liquids that condense out of the natu-
ral gas that comes out of the ground with
the crude currently amount to about 74
million barrels per day, total oil produc-
tion, which is also known as “all liquids,”
amounts to 86 million.
For six years after Campbell and Laher-
rère’s article not much happened. Oil pro-
duction (of all liquids) climbed to about
80 million barrels per day in 2000 and
then slipped back a couple of million bar-
rels due to an economic downturn. Some
thought they were witnessing the peak of
88. world oil production in 2000, but this was
not the case. After 2003, when oil produc-
tion surged, peak oil doubters ridiculed
those who had called the peak in 2000.
With the end of the recession in 2003,
world oil production and prices began
to climb rapidly. The inflation-adjusted
price of oil had been steady at $20–$25
per barrel since the mid-1980s and had
reached a low of $15 per barrel in 1998.
From 2002, when oil was $26 per barrel,
oil began a steady upward surge in both
production and price. Crude went from
an average of $30 per barrel in 2002 to a
high of $147 in July 2007. World oil pro-
duction (all liquids) climbed from 76 Al
l
A
N
B
u
R
C
h
36 B u l l e t i n o f t h e Ato m i c S c i e n t i S t S N O
V E M B E R / D EC E M B E R 2 0 0 8
million barrels per day in 2002 to about
89. 86 million in 2008.
By 2004, surging prices and consump-
tion brought the issue of peak oil to wider
attention. Blogs and websites on the sub-
ject began to proliferate (many blogs fo-
cusing on peak oil date from that year).
New books foretold a very bleak future
for the world without oil. Some were so
apocalyptic in their pronouncements that
their authors and peak oil adherents were
labeled “doomers.”
This development moved the peak oil
debate in a slightly different direction as
the so-called doomers argued with the
“techno-fixers,” those who believe that
there are many alternate sources of en-
ergy, including nuclear, solar, wind,
wave, and biofuel. For the doubters, peak
oil is simply another item to be added
to the list of possible, but improbable,
dangers—cataclysmic comet strikes,
thermonuclear war, and a super virus—
that people should worry about, but not
too much. Somewhere in all this uproar ,
which mostly took place online, the real
issue of peak oil got lost. The question
asked by peak oil is simply whether the
world can produce enough new oil each
year to keep up with falling production
at older fields.
Peak oil is the last thing anyone really
wants to hear or think about because
it illustrates how humanity has blown
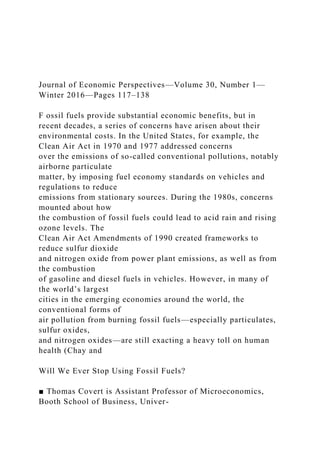
![sity of Chicago, Chicago, Illinois. Michael Greenstone is the
Milton Friedman Professor in
Economics and the College and Director of the Energy Policy
Institute at Chicago, both at the
University of Chicago, Chicago, Illinois. Christopher R. Knittel
is William Barton Rogers
Professor of Energy Economics, Sloan School of Management,
and Director of the Center for
Energy and Environmental Policy Research, all at the
Massachusetts Institute of Technology,
Cambridge, Massachusetts. Greenstone and Knittel are also
Research Associates, National
Bureau of Economic Research, Cambridge, Massachusetts. Their
email addresses are thomas.
[email protected], [email protected], and [email protected]
† For supplementary materials such as appendices, datasets, and
author disclosure statements, see the
article page at
http://dx.doi.org/10.1257/jep.30.1.117 doi=10.1257/jep.30.1.117
Thomas Covert, Michael Greenstone, and
Christopher R. Knittel
j_covert_301.indd 117 1/20/16 6:57 AM
118 Journal of Economic Perspectives
Greenstone 2003; Chen, Ebenstein, Greenstone, and Li 2013;
Knittel, Miller, and
Sanders forthcoming).
By the mid-1990s, concerns about the role of fossil fuels in
generating emis-
sions of carbon dioxide and other greenhouse gases gained](data:image/gif;base64,R0lGODlhAQABAIAAAAAAAP///yH5BAEAAAAALAAAAAABAAEAAAIBRAA7)