Meandering - On the design process of visualizations
•
1 j'aime•1,281 vues

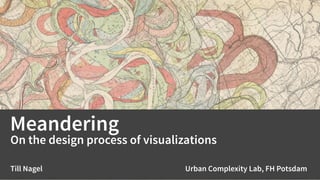
Slides for my talk at Data Viz Meetup in Berlin. http://www.meetup.com/Data-Visualization-Berlin/events/225253942/ In this talk I presented some thoughts on my design process, and used the metaphor of a meandering river to illustrate the back and forth in creating data visualizations.

Recommandé
Recommandé
Contenu connexe
Tendances
Tendances (11)
Plus de Till Nagel
Plus de Till Nagel (20)
Dernier
Dernier (20)
Meandering - On the design process of visualizations
- 1. Meandering On the design process of visualizations Till Nagel Urban Complexity Lab, FH Potsdam
- 4. DamienNewman
- 8. Foreign Domestics A comparison of national and international carriers in domestic flight routes
- 25. Touching Transport Different perspectives into Singapore’s public transit system
- 26. LIVE Singapore!
- 27. LIVE Singapore!
- 28. Bus network in Singapore
- 33. AM peak PM peak
- 49. Map View
- 50. Map View
- 51. Map View
- 88. Map View
- 90. Conclusion
- 95. Thank you. Till Nagel twitter: @tillnm DataVis Talks Berlin 21 Sep 2015