Image Sensors Market - The U.S. Industry Analysis Market Share, Trends And Forecast, 2011 - 2017
•
1 j'aime•1,553 vues

[59 Pages Report] The report also covers the strategies followed by U.S. Image Sensor Market players. The report presents detailed analysis and forecast for the U.S. image sensors market Read More : http://www.transparencymarketresearch.com/image-sensors-market-us.html

Recommandé
Recommandé
Contenu connexe
Dernier
Dernier (20)
En vedette
En vedette (20)
Image Sensors Market - The U.S. Industry Analysis Market Share, Trends And Forecast, 2011 - 2017
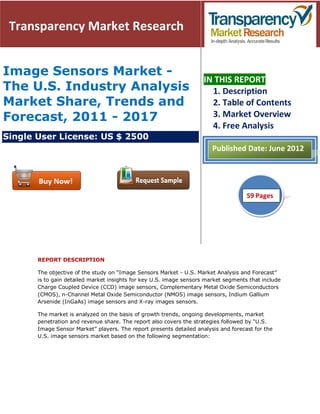
- 1. Transparency Market Research Image Sensors Market - IN THIS REPORT The U.S. Industry Analysis 1. Description Market Share, Trends and 2. Table of Contents Forecast, 2011 - 2017 3. Market Overview 4. Free Analysis Single User License: US $ 2500 Published Date: June 2012 59 51 Pages REPORT DESCRIPTION The objective of the study on “Image Sensors Market - U.S. Market Analysis and Forecast” is to gain detailed market insights for key U.S. image sensors market segments that include Charge Coupled Device (CCD) image sensors, Complementary Metal Oxide Semiconductors (CMOS), n-Channel Metal Oxide Semiconductor (NMOS) image sensors, Indium Gallium Arsenide (InGaAs) image sensors and X-ray images sensors. The market is analyzed on the basis of growth trends, ongoing developments, market penetration and revenue share. The report also covers the strategies followed by “U.S. Image Sensor Market” players. The report presents detailed analysis and forecast for the U.S. image sensors market based on the following segmentation:
- 2. Types CCD Image Sensors Linear Image Sensors CMOS Image Sensors NMOS Image Sensors INGAAS Image Sensors X-ray Image Sensors Applications Portable Applications Medical Applications Toys and Astronomy Machine Vision Systems Document Scanning Automotive Applications Others Reasons to purchase this report Leading industry opinion keeps you abreast of latest news and trends Forward-looking outlook on a category, market or issue affecting the industry Latest six year forecast assesses how the market is predicted to develop Make more informed business decisions from insightful and in-depth analysis of the micro markets Market shares of major players by segment provides clear view of competition prevailing in each sub segment of the market Obtain sales forecast for the period 2012 to 2017 for all the major markets The image sensors are primarily categorized as CCD image sensors (area image sensor), linear image sensors and X-ray image sensors. The linear image sensor segmented is subdivided into CMOS image sensors, NMOS image sensors and InGaAs image sensors. The linear image sensor is the largest segment; accounting for about 84.2% of the U.S. images sensor market in 2011, largely due to CMOS image sensors, which accounts for more than 90% of the linear image sensor market in the same year. Browse: Image Sensors Market The CMOS (Complementary Metal Oxide Semiconductors) image sensors segment dominates the U.S. linear image sensor market with more than 90% share. The cost of manufacturing CMOS-based image sensors is much cheaper than other competing technologies in the market. This low cost image sensor will have a good market in the industrial segment. The explosive growth and rapid development of CMOS image sensors are driven by the mobile phone market. Mobile devices with CMOS image sensors are expected to grow rapidly in the next 2
- 3. to 3 years in the U.S. market. This trend is expected to drive the growth of the emerging CMOS sensor markets of Latin America, India, Russia, and China. The growth in image sensor market is driven by low cost CMOS (Complementary Metal Oxide Semiconductors) based image sensor technology. The use of CMOS in image sensor technology helps in providing better quality images as compared to CCD (Charge Coupled Device) technology. The cost of manufacturing CMOS-based image sensors is much cheaper than other competing technologies in the market. This low cost image sensor will have a good market in the industrial segment. The applications of image sensor devices in the consumer market are driving the U.S. image sensor market. Image sensor devices with CMOS technology are better than the other competitive technologies in the market. With advancement in technology, consumers are shifting towards modularization and the use of advanced devices with image sensor enabled applications. Browse: US Image Sensors Market Portable applications accounts for the largest share of the U.S. image sensors applications followed by toys astronomy. With growing safety and security standards, a large number of automobile manufacturers are upgrading their vehicles, which is expected to drive the image sensors market. Low-priced and efficient design capabilities of image sensors make them ideal for automotive applications. Mobile handsets are the leading application for CMOS sensors, representing more than 75% of the total CMOS shipments in 2011. The use of CCD technology will shrink from 14% in 2011 to just 1.3% by 2017.
- 4. Growing popularity of smartphones in the U.S. region is expected to increase the market prospects for image sensors in the near future. Significant opportunities in the image sensor market are expected over the next few years. With the increase in the use of image sensor devices in biometrics, medical, and film cameras in accordance with vehicle driver assistance systems, security and surveillance devices are expected to have a substantial market in the future. The image sensor market in the U.S. is growing rapidly with a large number of competitors on the scene. Global players are forcing local players to manufacture new products as the market is growing rapidly. This is causing an add on advantage for good manufacturing practices for the U.S. image sensor market with the increase in market share in terms of quality of the image sensor products. Browse: http://www.transparencymarketresearch.com/image- sensors-market-us.html There are about 23 major sensor types used in a range of sub-systems and instruments for increasing number of end markets across the world. Image sensors now hold a commendable position in the global sensors market with variety of applications for a large number of end use segments.
- 5. TABLE OF CONTENTS CHAPTER 1 INTRODUCTION 1.1 SCOPE OF THE REPORT 1.2 KEY TAKEAWAYS 1.3 METHODOLOGY CHAPTER 2 EXECUTIVE SUMMARY 2.1 OVERVIEW 2.2 SEGMENT REVIEW 2.3 APPLICATION MARKET REVIEW 2.4 PRICING ANALYSIS CHAPTER 3 U.S. IMAGE SENSORS MARKET OVERVIEW 3.1 MARKET DYNAMICS 3.1.1 MARKET TRENDS 3.1.2 DRIVERS 3.1.2.1 Low cost of CMOS image sensors to drive the U.S. market 3.1.2.2 Growth in consumer market for image sensor devices 3.1.2.3 Growth and rapid development of CMOS image sensors 3.1.2.4 Power efficient CMOS image sensor devices 3.1.2.5 Growth in multimedia enabled devices in the U.S. market 3.1.3 RESTRAINTS 3.1.3.1 Image quality plays an important role in Image Sensor market 3.1.3.2 Labor cost depends upon the device manufacturing cost 3.1.3.3 Environmental factors 3.1.4 OPPORTUNITIES 3.1.4.1 Adoption of 3G with video supportive mobile phones
- 6. 3.1.4.2 Growth in countrywide distribution of image sensors 3.1.4.3 Focus on new product development 3.2 PRICING TRENDS 3.3 IMAGE SENSOR MARKET BY END USE 3.3.1 TELECOM MARKETS 3.3.2 COMPUTERS 3.3.3 CONSUMER MARKETS 3.3.4 AUTOMOTIVE 3.3.5 INDUSTRIAL 3.3.6 MILITARY AND AEROSPACE CHAPTER 4 IMAGE SENSORS MARKET, 2011 – 2017 4.1 TYPES OF IMAGE SENSORS 4.1.1 CCD IMAGE SENSORS MARKET SIZE AND FORECAST, 2011 – 2017 4.1.2 LINEAR IMAGE SENSORS MARKET SIZE AND FORECAST, 2011 – 2017 4.1.2.1 CMOS image sensor market size and forecast, 2011 – 2017 4.1.2.1.1 Passive-pixel sensors (PPS) 4.1.2.1.2 Active-pixel sensors(APSs) 4.1.2.2 NMOS image sensor market size and forecast, 2011 – 2017 4.1.2.3 InGaAs image sensor market size and forecast, 2011 – 2017 4.1.3 X-RAY IMAGE SENSOR MARKET SIZE AND FORECAST, 2011 – 2017 4.2 NEW TECHNOLOGY IN IMAGE SENSOR MARKET - BACKSIDE ILLUMINATION 4.2.1 DRIVERS 4.2.1.1 Both side layers can be designed and optimized independently 4.2.1.2 Better sensitivity 4.2.1.3 Improved sensitivity and noise reduction 4.2.2 RESTRAINTS
- 7. 4.2.2.1 Pixel size scaling is limited 4.2.2.2 Increasing the amount of light attracts noise 4.2.3 OPPORTUNITIES 4.2.3.1 Speed and dynamic range of image sensor technology 4.2.3.2 Improved shutter efficiency 4.2.3.3 Research on for better image sensor technology CHAPTER 5 IMAGE SENSORS MARKET BY APPLICATIONS 5.1 PORTABLE APPLICATIONS MARKET SIZE AND FORECAST 2011 – 2017 5.2 MEDICAL APPLICATIONS MARKET SIZE AND FORECAST 2011 – 2017 5.2.1 SENSORS FOR X-RAY 5.2.2 MEDICAL RADIOGRAPHY 5.2.3 SPECIMEN RADIOGRAPHY 5.2.4 DENTAL RADIOGRAPHY 5.2.5 BIOMETRIC IDENTIFICATION 5.3 TOYS AND ASTRONOMY MARKET SIZE AND FORECAST 2011 – 2017 5.3.1 LOTTERY READING DEVICES 5.3.2 SPACE SCIENCE 5.3.3 GROUND-BASED ASTRONOMY 5.3.4 EARTH OBSERVATION 5.4 MACHINE VISION SYSTEMS MARKET SIZE AND FORECAST 2011 – 2017 5.4.1 2D BAR CODE READER 5.4.2 MULTIFUNCTION COPIER/PRINTER 5.4.3 BANKING BILLS 5.4.4 FINGER PRINT READER 5.5 DOCUMENT SCANNING MARKET SIZE AND FORECAST 2011 – 2017 5.5.1 TEST MARKER READER
- 8. 5.5.2 LARGE FORMAT SCANNER 5.5.3 BUSINESS CARD READER 5.5.4 CHECK READER 5.5.5 ELECTRONICS WHITE BOARD 5.6 AUTOMOTIVE APPLICATIONS MARKET SIZE AND FORECAST 2011 – 2017 5.6.1 GAMMA RAY SENSORS 5.6.2 SURVEILLANCE 5.7 OTHER APPLICATIONS MARKET SIZE AND FORECAST 2011 – 2017 CHAPTER 6 COMPETITIVE SCENARIO 6.1 MARKET LEADERS 6.1.1 GLOBAL IMAGE SENSOR MARKET SHARES OF MAJOR PLAYERS 2011 6.1.2 U.S. IMAGE SENSOR MARKET SHARES OF MAJOR PLAYERS 2011 6.2 RECENT TECHNOLOGICAL DEVELOPMENTS 6.3 LEADING PLAYERS IN THE U.S. REGION 6.3.1 OMNIVISION TECHNOLOGIES INC. 6.3.1.1 Company overview 6.3.1.2 Financial overview 6.3.1.3 Major products and services 6.3.1.4 Top competitors 6.3.2 MICRON TECHNOLOGY INC. 6.3.2.1 Company Overview 6.3.2.2 Revenue analysis 6.3.3 SHARP MICROELECTRONICS OF THE AMERICAS 6.3.3.1 Company overview 6.3.4 DALSA CORPORATION (CANADA) 6.3.4.1 Company overview
- 9. 6.3.4.2 Major products and services 6.3.4.3 Top competitors CHAPTER 7 RECOMMENDATIONS Browse: http://www.transparencymarketresearch.com/image- sensors-market-us.html LIST OF FIGURES FIG. 1 U.S. IMAGE SENSORS PRICING TREND BY TYPE FIG. 2 COMPOSITION OF U.S. INDUSTRIAL IMAGE SENSOR MARKET FIG. 3 U.S. CCD IMAGE SENSORS MARKET REVENUE AND SHIPMENT FORECAST 2011 – 2017 FIG. 4 U.S. CMOS IMAGE SENSORS MARKET REVENUE AND SHIPMENT FORECAST 2011 – 2017 FIG. 5 U.S. NMOS IMAGE SENSORS MARKET REVENUE AND SHIPMENT FORECAST 2011 – 2017 FIG. 6 U.S. INGAAS IMAGE SENSORS MARKET REVENUE AND SHIPMENT FORECAST 2011 – 2017 FIG. 7 U.S. X-RAY IMAGE SENSORS MARKET REVENUE AND SHIPMENT FORECAST 2011 – 2017 FIG. 8 U.S. IMAGE SENSOR PORTABLE APPLICATION REVENUE AND SHIPMENT FORECAST 2011 – 2017 FIG. 9 U.S. IMAGE SENSOR MEDICAL APPLICATION REVENUE AND SHIPMENT FORECAST 2011 – 2017 FIG. 10 U.S. IMAGE SENSOR APPLICATION IN MEDICAL DOMAIN FIG. 11 U.S. IMAGE SENSOR APPLICATION IN BIOMETRIC FIG. 12 U.S. IMAGE SENSOR TOYS AND ASTRONOMY APPLICATION REVENUE AND SHIPMENT FORECAST 2011 – 2017 FIG. 13 U.S. IMAGE SENSOR APPLICATION IN TOYS AND ASTRONOMY
- 10. FIG. 14 U.S. IMAGE SENSOR MACHINE VISION SYSTEMS APPLICATION REVENUE AND SHIPMENT FORECAST 2011 – 2017 FIG. 15 U.S. IMAGE SENSOR APPLICATION IN TOYS AND ASTRONOMY FIG. 16 U.S. IMAGE SENSOR DOCUMENT SCANNING APPLICATION REVENUE AND SHIPMENT FORECAST 2011 – 2017 FIG. 17 U.S. IMAGE SENSOR APPLICATION IN TOYS AND ASTRONOMY FIG. 18 U.S. IMAGE SENSOR AUTOMOTIVE APPLICATION REVENUE AND SHIPMENT FORECAST 2011 – 2017 FIG. 19 U.S. IMAGE SENSOR AUTOMOTIVE APPLICATION REVENUE AND SHIPMENT FORECAST 2011 – 2017 FIG. 20 GLOBAL IMAGE SENSORS REVENUET SHARE OF MAJOR PLAYERS 2011 (%) FIG. 21 U.S. IMAGE SENSORS REVENUE SHARE OF MAJOR PLAYERS 2011 (%) Browse: http://www.transparencymarketresearch.com/image- sensors-market-us.html LIST OF TABLES TABLE 1 COMPARISION OF CCD AND CMOS TECHNOLOGIES IN IMAGE SENSORS TABLE 2 U.S. IMAGE SENSORS MARKET REVENUE, BY TYPE 2011 – 2017 (USD MILLION) TABLE 3 U.S. IMAGE SENSORS SHIPMENT, BY TYPE 2011 – 2017 (MILLION UNITS) TABLE 4 U.S. LINEAR IMAGE SENSORS MARKET REVENUE, BY TYPE 2011 – 2017 (USD MILLION) TABLE 5 U.S. LINEAR IMAGE SENSORS SHIPMENT, BY TYPE 2011 – 2017 (MILLION UNITS) TABLE 6 U.S. IMAGE SENSORS REVENUE, BY APPLICATIONS 2011 – 2017 (USD MILLION) TABLE 7 U.S. IMAGE SENSORS SHIPMENT, BY APPLICATIONS 2011 - 2017 (MILLION UNITS) About Us: Transparency Market Research is a market intelligence company providing global business information reports and services. Our exclusive blend of quantitative forecasting and trends analysis provides forward-looking insight for thousands of decision makers. We are privileged with highly experienced team of Analysts, Researchers and Consultants, who use proprietary data sources and various tools and techniques to gather, and analyze
- 11. information. Our business offerings represent the latest and the most reliable information indispensable for businesses to sustain a competitive edge. Contact: Transparency Market Research 90 State Street, Suite 700, Albany NY - 12207 United States Tel: +1-518-618-1030 Email: sales@transparencymarketresearch.com Website: http://www.transparencymarketresearch.com/ Find us on: