Dr. Jay Famiglietti - 21st Century Water Security and Implications for Animal Agriculture
•Télécharger en tant que PPTX, PDF•
2 j'aime•770 vues

21st Century Water Security and Implications for Animal Agriculture - Dr. Jay Famiglietti, Associate Professor at University of California, Irvine and Senior Water Scientist at the NASA Jet Propulsion Laboratory, from the 2015 NIAA Annual Conference titled 'Water and the Future of Animal Agriculture', March 23 - March 26, 2015, Indianapolis, IN, USA. More presentations at http://www.trufflemedia.com/agmedia/conference/2015_niaa_water_future_animal_ag

Recommandé
Recommandé
Contenu connexe
Tendances
Tendances (20)
En vedette
En vedette (20)
Similaire à Dr. Jay Famiglietti - 21st Century Water Security and Implications for Animal Agriculture
Similaire à Dr. Jay Famiglietti - 21st Century Water Security and Implications for Animal Agriculture (20)
Plus de John Blue
Plus de John Blue (20)
Dernier
Dernier (20)
Dr. Jay Famiglietti - 21st Century Water Security and Implications for Animal Agriculture
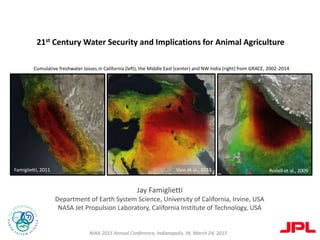
- 1. Jay Famiglietti Department of Earth System Science, University of California, Irvine, USA NASA Jet Propulsion Laboratory, California Institute of Technology, USA Cumulative freshwater losses in California (left), the Middle East (center) and NW India (right) from GRACE, 2002-2014 21st Century Water Security and Implications for Animal Agriculture NIAA 2015 Annual Conference, Indianapolis, IN, March 24, 2015 Famiglietti, 2011 Voss et al., 2013 Rodell et al., 2009
- 2. True confessions of a hydrologic scientist... I wanted to be a veterinarian
- 3. Overview • Who am I and why do I care? • Some key examples of the importance of water to animal agriculture • What our research and the best science is telling us about freshwater availability, water cycle change and global change • How will the industry respond in the future?
- 4. Who am I and why do I care? • I am a hydrologist, a professor and a research scientist • My students and I have been working for 3 decades on - Using satellites to track how freshwater availability is changing around the world - Developing advanced computer models to predict how it may change in the future - Communicating our findings to elected officials, water managers, industry and the general public • I care because the findings are eye-opening and not really fully appreciated; and water management has a long way to go to adjust
- 5. Importance of water to animal agriculture • Water to grow feed • Water for processing and packaging • Water associated with energy needs • Climate change and changing hydrologic extremes of flooding and drought • Animal waste and water quality issues
- 6. NASA Gravity Recovery and Climate Experiment (GRACE) • Launched in 2002 • Functions like a ‘scale in the sky’ that can weigh the monthly increases or decreases in water storage in large (>200,000 km2) regions with an accuracy of 1.5 cm
- 7. NASA GRACE Follow-On (GRACE-FO) Launch on schedule for August 2017 Similar resolution as GRACE
- 8. • The difference between two GRACE global gravity fields yields a time-variable component. • The main contributors to time variations in the gravity field are changes in water storage in the ocean, the atmosphere and on land. • Why? Because water is REALLY HEAVY! • Consequently, the GRACE time-variable signal on land is dominated by changes in terrestrial water storage, i.e. GRACE monitors changes in all of the water stored on land, the change in total water storage (all of the snow, surface waters, soil moisture and groundwater), at monthly and longer timescales • Given the extremely high precision of GRACE, the resulting errors are ~1.5 cm for monthly storage anomalies at the 150,000 km2 scale (~2.25 km3 ) Estimating water storage changes with GRACE Colorado River Basin, Changes in Total Water Storage (2005-2013) Castle et al., 2014
- 9. Animation by NASA GSFC and JPL
- 10. Change in total water storage in the Sacramento-San Joaquin River basins from GRACE 2002-2014 2006 2009 2013 Time series and images computed from NASA JPL Mascons solutions by Felix Landerer
- 11. Characterizing California drought with GRACE and Total Water Storage Deficit Actual monthly water storage variations ‘Normal’ range of monthly water storage variations Differences from ‘normal’ dry conditions 2002 2004 2006 2008 2010 2012 2014 -40-2002040 Date TWSAnomalies(cu.km) 2002 2004 2006 2008 2010 2012 2014 -40-2002040 Date Climatology(cu.km) 2002 2004 2006 2008 2010 2012 2014 -50-40-30-20-100 Date WaterStorageDeficit(cukm) drought begins drought ends size of Total Water Storage Deficit peak Total Water Storage Deficit is 42 km3 in 2014
- 12. Importance of groundwater worldwide • Groundwater accounts for as much as 33% of water withdrawals worldwide • Over 2 billion people rely on groundwater as their primary water source • Half or more of irrigation water is supplied by groundwater • Groundwater provides the key ‘strategic reserve’ for water supply during prolonged periods of drought Ironically, groundwater is poorly managed and monitored in many regions around the world, so that global water security is at far greater risk than is currently acknowledged.
- 13. STotal = SSnow + SSurface Water + SSoil Moisture + SGroundwater SGroundwater STotal - SSnow - SSurface Water - SSoil Moisture Remove this (Ssnow+ SSurface Water + SSoil Moisture) from STotal… To isolate this (SGroundwater ) STotal surface water Estimating groundwater storage changes with GRACE
- 14. Sacramento River Basin San Joaquin River Basin Tulare Lake Basin California’s Central Valley • Is one of the most productive agricultural regions in the world • Produces more than 250 different crops worth $17 billion per year (2002), or 8% of the food produced in the U. S. by value • Accounts for 1/6 of irrigated land in the U.S. • Supplies 1/5 of the demand for groundwater in the U.S. • Is the second most pumped aquifer in the U. S. •Groundwater depletion and subisdence have been documented there for decades (e.g. Faunt, 2009) Central Valley (blue) River Basin boundary Central Valley Groundwater depletion in California’s Central Valley, October, 2003-March, 2009
- 15. SGroundwater STotal - SSnow - SSurface Water - SSoil Moisture Estimating groundwater storage changes in California’s Central Valley with GRACE STotal (GRACE) Ssnow(Corrected SNODAS) SSurface Water (CA DWR) SSoil Moisture (GLDAS)
- 16. Estimating groundwater storage changes in California’s Central Valley with GRACE
- 17. Central Valley groundwater depletion from GRACE( 2003-2013) Surface water allocations and groundwater use are closely connected California’s system of aqueducts for surface water redistribution
- 18. Cumulative groundwater depletion in California’s Central Valley from USGS and GRACE
- 19. Total water storage anomalies Estimating groundwater storage changes with GRACE Colorado River Basin (2005-2013) GW SW Castle et al., 2014 Surface and ground water storage anomalies
- 20. Water storage changes in the United States from GRACE (2002-2014) Trend map courtesy of Felix Landerer, NASA JPL
- 21. Famiglietti et al., 2011 ~3 km3/yr Voss et al., 2013 ~13 km3/yr Rodell et al., 2009 ~18 km3/yr Bourzac, 2013; after Rodell et al., 2009; Famiglietti et al. 2011; Voss et al., 2013
- 22. Animation credit Jay Famiglietti, Jason Craig, Eric de Jong, Felix Landerer, JT Reager, Mike Stetson, NASA JPL Rodell et al., 2009 Voss et al., 2013
- 23. Trends in Freshwater Availabilty from the NASA GRACE Mission 2002-2014 Antarctic ice sheet melting Patagonia glaciers melting Alaska glaciers melting Greenland ice sheet melting Southeastern U.S. drought NW Australia groundwater depletion Orinoco and Amazon floods India/Bangladesh groundwater depletion Indian monsoon Central Valley groundwater depletion Middle East groundwater depletion North China Plain groundwater depletion High Plains Aquifer groundwater depletion Upper Midwest U.S. flooding North Africa groundwater depletion High latitude precipitation increase Caspina/Aral Seas shrinking Southern Africa groundwater depletion Mekong drought Brazil drought Peru glaciers melting Guarani Aquifer groundwater depletion Congo droughtColombia glaciers melting West Africa floods Okavango floods Ukraine drought mm H2O yr -1
- 24. Trends in Freshwater Availabilty from the NASA GRACE Mission, 2002- 2014 ? ? ?
- 26. How should the industry respond/is it responding • Message #1: The water cycle and water availability are changing. Water availability will become progressively more strained, while increasing extremes like flooding and drought threaten both animal exposure and supply chains • Message #2: Everybody loves food so don’t feel like you’re a target. We need to change the conversation from urban vs ag; farmer vs fish; economic growth vs environment, to ‘how much water does society want to allocate to produce food;’ or to “how can we produce the best/most using the least amount of water” • Message #3: Clearly animal agriculture uses tons of water and generates considerable waste disposal problems. No need to shy away from that because we need to eat and grow food. Rather, take ownership, clearly articulate the issues, and become industry leaders and stewards: “How can we raise the best product while having the smallest environmental impact
- 27. @JayFamiglietti http://newswatch.nationalgeographic.com/author/jfamigli/ Last Call at the Oasis Can We End the Global Water Crisis, http://youtube.com The Global Groundwater Crisis, Oct 29, 2014 November 16, 2014, ‘Depleting the Water’ Resources for communication (links at http://jayfamiglietti.com)