
Recommandé
Contenu connexe
Tendances
Tendances (16)
En vedette
Similaire à Al Fried Llc Custom Analytics Report Mdca (2711 Exempt) 062409
Similaire à Al Fried Llc Custom Analytics Report Mdca (2711 Exempt) 062409 (20)
Plus de ttgoods
Al Fried Llc Custom Analytics Report Mdca (2711 Exempt) 062409
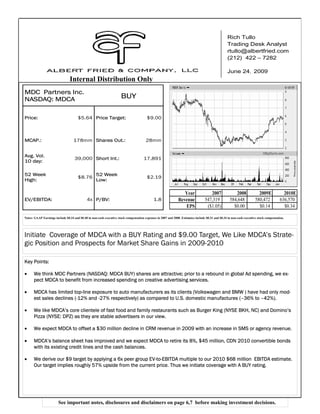
- 1. Rich Tullo Trading Desk Analyst rtullo@albertfried.com (212) 422 – 7282 June 24, 2009 Internal Distribution Only MDC Partners Inc. NASDAQ: MDCA BUY Price: $5.64 Price Target: $9.00 Stock Chart MCAP.: 178mm Shares Out.: 28mm Avg. Vol. 39,000 Short Int.: 17,891 10 day: 52 Week 52 Week $8.76 $2.19 High: Low: Year 2007 2008 2009E 2010E EV/EBITDA: 4x P/BV: 1.8 Revenue 547,319 584,648 580,472 636,570 EPS ($1.05) $0.00 $0.14 $0.34 Notes: GAAP Earnings include $0.34 and $0.48 in non-cash executive stock compensation expenses in 2007 and 2008. Estimates include $0.31 and $0.34 in non-cash executive stock compensation. Initiate Coverage of MDCA with a BUY Rating and $9.00 Target, We Like MDCA’s Strate- gic Position and Prospects for Market Share Gains in 2009-2010 Key Points: • We think MDC Partners (NASDAQ: MDCA BUY) shares are attractive; prior to a rebound in global Ad spending, we ex- pect MDCA to benefit from increased spending on creative advertising services. • MDCA has limited top-line exposure to auto manufacturers as its clients (Volkswagen and BMW ) have had only mod- est sales declines (-12% and -27% respectively) as compared to U.S. domestic manufactures (–36% to –42%). • We like MDCA’s core clientele of fast food and family restaurants such as Burger King (NYSE BKH, NC) and Domino’s Pizza (NYSE: DPZ) as they are stable advertisers in our view. • We expect MDCA to offset a $30 million decline in CRM revenue in 2009 with an increase in SMS or agency revenue. • MDCA’s balance sheet has improved and we expect MDCA to retire its 8%, $45 million, CDN 2010 convertible bonds with its existing credit lines and the cash balances. • We derive our $9 target by applying a 6x peer group EV-to-EBITDA multiple to our 2010 $68 million EBITDA estimate. Our target implies roughly 57% upside from the current price. Thus we initiate coverage with A BUY rating. See important notes, disclosures and disclaimers on page 6,7 before making investment decisions.
- 2. Company Overview: MDC Partners, Inc. is and advertising industry holding company. MDCA, through its subsidiaries, provides marketing . communications services primarily in the United States, Canada, Europe, Jamaica, and Philippines. It operates through three segments: Strategic Marketing Services, Customer Relationship Management, and Specialized Communication Services. MDC Partners also offers advertising, retail and event marketing, and consumer promotion services. The company was formerly known as MDC Corporation, Inc. and changed its name to MDC Partners, Inc. in January 2004. MDC Partners, Inc. was founded in 1980 and is headquartered in Toronto, Canada. MDCA benefits more from the growth in Internet and interactive advertising, compared with its peer group, since roughly 40% of the com- pany’s business is in digital innovation and direct response. Since 2005, MDCA’s advertising revenue expanded roughly 42%, compared with 30% for the peer group and 47% for Internet advertising, because MDCA’s agencies are industry thought leaders and delivered suc- cessful interactive ad campaigns. Specifically, MDCA’s two largest agency holdings, Crispen Porter and Bogusky (CP+B) agency and Kirshenbaum Bond and Partners (KBP) have won agency awards and more importantly high profile clients. In 2008, CP+B began work on the Microsoft (NASD: MSFT, NC) and Best Buy (NYSE; BBY, NC) campaigns and KBP began work on Wendy’s (NYSE: WEN,NC). We think CP+B’s strength is selling to the 18-30 year-old age demographic (also know as the millennial generation) and KBP strong suit is selling to mature tech-savvy customers. MDCA’s largest Auto manufacturing client, Volkswagen, just surpassed Ford in global market share: We think MDCA’s SMS sales visibility is strong versus the holding company peer group with exposure to the Big Three US Auto manufactures. MDCA benefits from Volks- wagen’s strategic goals and its commitment to maintain ad spending. Currently, Volkswagen sells about 700,000 vehicles in the US and plans to increase US sales to 1.3 million units by offering fuel efficient clean-diesel cars made in Europe, the US and Brazil. In contrast, to U.S. automakers (which have cut ad spending by roughly 50%) Volkswagen plans maintain its current level of ad spending according to comments made by Volkswagen’s marketing manager Tim Ellis. In May, Volkswagen sales were down just 12% versus lower sales at the Big Three and Toyota which where down 33% and 41% respectively (according to Auto Data) and we credit Volkswagen performance to investment in advertising. MDCA will benefit, in our view, from consumer electronics in 2009 : We expect MDCA to benefit from the new Microsoft Windows (NASDAQ: MSFT) 7.0 launch in 3Q:09: The aforementioned CP+B is also the agency of record for Microsoft’s Windows products. CP+B was hired by Microsoft to help rebuild its brand to counter Apple’s (NASD: AAPL) aggressive negative advertising. We think MSFT contrib- uted $15 million or about 2.5% to MSFT’s top line in 2008. We expect MSFT will increase ad spending in the run-up to it’s its windows launch and offset weakness MDCA might incur owing to a recessionary economy. As CP+B is Best Buy’s creative Ad Agency we think the company will benefit from increasing competition between Wal-Mart and Best Buy and the surge in new consumer electronics such as smart phones and LED TV’s. As ad rates remain challenged we expect MDCA’s fast food clients to maintain advertising budgets: MDCA’s revenue is weighted to fast- food and family restaurants -owing to its strength with millennials. MDCA’s clients include; Burger King (NYSE: BKC), Wendy’s (NYSE: WEN,NC), Dominoes Pizza (NYSE: DPZ, NC) , Arby’s (is division of NYSE:WEN, NC), International House of Pancakes (NYSE:IHOP,NC), PF Changs (NYSE: PFC, NC), Churches Chicken and Subway (in Canada). We think, fast service restaurants benefit as budget conscious con- sumers switched from higher priced restaurants. The restaurant business is highly competitive and advertising intensive. As ad rates across all media have plummeted; restaurant ad budget have stayed the same or increased as advertisers can buy more media impres- sions per dollar. As MDCA’s margins improve ; we expect MDCA to pay down debt. Owing to its acquisition strategy from (2001 to 2006) MDCA has large non-cash expenses therefore GAAP earnings in our view is not the best measure of MDCA’s income. We use EBITDA (defined as Earnings before interest , taxes, depreciation minority interest) and as MDCA’s EBITDA expanded to $41 million in 2008 from $31 million in 2007 cash on its balance sheet has expanded to $46 million at the end of 1Q:09. Thus the $45 million in MDCA 8% convertible notes coming due in 2010 are not a great risk, in our opinion as, MDCA has ample liquidity. Risks to Thesis: MDCA through its Accent CRM division operates call centers for Sprint. Sprint had been losing market share and inves- tors became concerned about MDCA’s CRM franchise. Ironically as Sprint has improved its service offering high touch customer com- plaints have declined. Thus the need for CRM services has diminished. As a result we expect CRM revenues to decline about $35 million in 2009. While we think our estimates are realistic MDCA failure to offset CRM revenue with SMS sales could result in down-side to our estimates. Estimates and Target: Despite a decline in CRM revenue, we expect only a modest decline in MDCA’s top-line (to $580 million in 2009 from $584 in 2008). As MDCA cuts cost we expect EBITDA to grow roughly 15% to $53 million in 2009 (from $46 million in 2008) and a modest gain in EPS to $0.14. As the global economic outlook improves in 2010, we expect MDCA’s top-line to expand 10%, EBITDA to expand 28% to $68 million and EPS to nearly double to $0.34. We value MDCA by using the ratio of EV-to-EBITDA. We think the overhang related to MDCA’s CRM franchise creates an opportunity to BUY MDCA shares at a discount to its peers. MDCA’s current $5.70 price level implies an EV/EBITDA multiple of roughly 4x which is a significant discount to the 6x peer group multiple. To derive our $9 target, we apply a 6X multiple to our $68 million 2010 EBITDA esti- mate. We argue MDCA deserves a least a peer group multiple as MDCA is a industry thought leader with exposure to growing clients and with almost 60% upside to our target we think investors should BUY MDCA shares.
- 3. Table 1. MDC PARTNERS INCOME STATEMENT (All figures in $000s except where noted) 2007 A Mar. A Jun.A Sep. A Dec.A 2008 A Mar. A Jun. E Sep. E Dec. E 2009E Mar. E Jun. E Sep. E Dec. E 2010E Revenue $547,319 $143,344 $158,275 $126,738 $156,291 $584,648 $126,738 $145,613 $133,075 $175,046 $580,472 $145,115 $152,602 $159,956 $178,897 $636,570 Operating Expenses Cost of services sold 351,851 97,591 104,012 85,879 104,663 392,145 85,879 99,017 90,491 122,532 397,919 100,129 105,296 108,770 121,650 435,845 Office and general expenses 143,207 35,849 37,480 31,152 33,274 137,755 31,152 31,775 30,341 31,508 124,776 32,506 33,878 31,991 31,486 129,861 Depreciation and amortization 29,246 10,088 8,708 7,593 8,015 34,404 7,593 7,274 7,020 6,986 28,873 6,898 6,898 6,898 6,898 27,592 Other charges (recoveries) Goodwill and intangible impairment Total Operating Expenses 524,304 143,528 150,200 124,624 145,952 564,304 124,624 138,066 127,852 161,026 551,568 139,533 146,071 147,659 160,034 593,298 Operating Profit 23,015 (184) 8,075 2,114 10,339 20,344 2,114 7,547 5,223 14,020 28,904 5,582 6,531 12,297 18,863 43,273 Operating margin % 4.2% -0.1% 5.1% 1.7% 6.6% 3.5% 1.7% 5.2% 3.9% 8.0% 5.0% 3.8% 4.3% 7.7% 10.5% 6.8% Other Income (Expenses) Gain on sale of assets, settlement of long-term debt 3,065 (14) (14) Other income and foreign exchange gain, (loss) (7,192) 3,603 (527) 2,629 7,552 13,257 2,629 (200) (200) (200) 2,029 (200) (200) (200) (200) (800) Interest expense (13,672) (3,889) (3,413) (3,633) (4,064) (14,998) (3,761) (3,761) (3,761) (3,761) (15,044) (4,305) (4,305) (4,305) (4,305) (17,220) Interest income 1,726 206 173 203 1161 1743 203 203 203 203 812 300 300 300 300 1200 Total Other Income (Expenses) (16,073) (80) (3,767) (801) 4,635 (12) (929) (3,758) (3,758) (3,758) (12,203) (4,205) (4,205) (4,205) (4,205) (16,820) Income from continuing operations before taxes 6,942 (264) 4,308 1,313 14,974 20,332 1,185 3,789 1,465 10,262 16,701 1,377 2,326 8,092 14,658 26,453 b/f taxes, equity in affiliates and minority interests Income taxes 5,620 (825) 3,943 615 (1,336) 2,397 615 1,515 586 4,105 6,821 (551) (930) (3237) (5863) (10581) Income from continuing operations 1,322 561 365 698 16,310 17,935 570 2,273 879 6,157 9,879 826 1,396 4,855 8,795 15,872 b/f equity in affiliates and minority interests Equity in earnings of non-consolidated affiliates 165 140 81 93 100 349 93 100 100 100 393 100 100 100 100 400 Minority interests in income of consolidated subsidiaries (20,565) (2,094) (2,869) (382) (2,791) (8,136) - (8,047) (8,660) (9,387) (10,951) (37,045) Income (loss) from continuing operations (19,078) (1,393) (2,504) 409 13,635 10,148 663 2,273 879 6,157 9,972 926 1,496 4,955 8,895 16,272 Net income margin % -3.5% -1.0% -1.6% 0.3% 8.7% 1.7% 0.5% 1.6% 0.7% 3.5% 1.7% 0.6% 1.0% 3.1% 5.0% 2.6% Income (loss) from discontinued operations (7,277) (252) (9,763) (10,015) (252) (500) (500) (500) (1752) (500) (500) (500) (500) ($2,000) Net income attributed to non-controlling interests (382) (1186) (979) (1680) (4228) (662) (738) (1199) (1724) (4324) % Income from Continuing opes -4% -8% -8% -8% -8% -8% -8% -8% -8% -8% Net Income (Loss) (26,355) (1,253) (2,504) 157 3,872 133 29 588 (600) 3,976 3,993 (236) 258 3,256 6,670 9,948 Earnings (Loss) Per Common Share: Basic Continuing operations (0.76) (0.05) (0.09) 0.02 0.51 0.38 0.01 0.09 0.04 0.25 0.39 0.04 0.06 0.20 0.36 0.66 Discontinued operations and changes in accounting (0.29) (0.08) (0.07) (0) (0.21) (0.37) (0) Net loss ($1.05) ($0.13) ($0.16) $0.01 $0.30 $0.01 $0.00 $0.02 ($0.02) $0.16 $0.16 ($0.01) $0.01 $0.13 $0.27 $0.40 Diluted Continuing operations (0.76) (0.05) (0.09) 0.02 0.50 0.38 0.01 0.09 0.04 0.25 0.40 (0.01) 0.01 0.13 0.27 0.40 Discontinued operations and non-controlling (0.01) (0.36) (0.37) (0.01) (0.07) (0.06) (0.11) (0.26) 0.00 (0.00) (0.02) (0.04) (0.06) Net Income (loss) per share ($1.05) ($0.05) ($0.09) $0.01 $0.14 $0.00 $0.00 $0.02 ($0.02) $0.14 $0.14 ($0.01) $0.01 $0.11 $0.23 $0.34 Weighted Average Number of Common Shares Outstanding: Basic 25,001 26,800 26,800 27,116 26,800 26,800 26,800 24,800 24,800 24,800 24,800 24,800 24,800 24,800 24,800 24,800 Diluted 25,001 26,800 26,800 27,116 27,116 26,958 27,116 27,116 29,116 29,116 28,116 29,116 29,116 29,116 29,116 29,116 MDC share of Ebitda (TTM) 31,696 33,908 41,770 43,694 46,612 46,612 48,127 47,848 49,787 53,549 53,549 56,542 56,098 63,330 68,541 68,541 EV 352,556 362,073 337,477 339,979 317,677 273,411 251,852 277,710 312,899 296,345 254,463 192,449 264,546 408,740 676,906 297,006 EV/EBITDA 11.1 10.7 8.1 7.8 5.9 5.9 5.2 5.8 6.3 4.8 4.8 3.4 4.7 6.5 4.3 4.3 (Earnings before intrest,taxes, depreciation and amortization less minority intrest) Other per Share Ebitda Per Share (diluted) $2.09 $0.37 $0.63 $0.36 $0.68 $2.03 $0.36 $0.55 $0.42 $0.72 $2.05 $0.28 $0.32 $0.51 $0.74 $1.86 MDC Share of Ebitda (basic) $1.27 $0.29 $0.52 $0.34 $0.58 $1.74 $0.35 $0.55 $0.45 $0.78 $2.16 $0.50 $0.53 $0.75 $0.99 $2.76 MDCA Share of Ebitda (per share diluted) $1.27 $0.29 $0.52 $0.34 $0.57 $1.73 $0.34 $0.50 $0.39 $0.66 $1.90 $0.42 $0.45 $0.64 $0.84 $2.35 Percentage of Sales Gross Margin % 35.7% 33.3% 34.3% 32.2% 36.0% 32.9% 32.2% 32.0% 32.0% 30.0% 31.4% 31.0% 31.0% 32.0% 32.0% 31.5% Ebit margin % NM NM -1.9% 2.5% 5.9% 2.2% 2.3% 1.8% 1.8% 2.0% 2.0% 0.9% 1.5% 5.1% 8.2% 4.2% Ebitda Margin % 9.5% 6.9% 10.6% 7.7% 11.7% 9.4% 7.7% 10.2% 9.2% 12.0% 10.0% 5.7% 6.0% 9.4% 12.0% 8.5% Net Income Margin % NM NM NM 0.3% 8.7% NM 0.5% 1.6% 0.7% 3.5% 1.7% 0.6% 1.0% 3.1% 5.0% 2.6% YOY Performance Measures Gross Margin 11% 16% -4% -17% -13% -2% -14% -14% 4% 6% -5% 10% 2% 20% 9% 10% Operating profit 73% NM 56% NM NM NM NM -7% 147% 36% 42% 164% -13% 135% 35% 50% Ebitda NM 326% 46% -23% NM 5% -2% -12% 26% 14% 6% -15% -38% 22% 3% -6% Net Income 29% -84% -3% -106% -291% -153% -148% -191% 115% -55% NM 40% -34% 464% 44% 63% Source:Albert Fried andCompany LLC and Company Reports
- 4. Table 2. MDC PARTNERS BALANCE SHEET (All figures in $000s except where noted) 2006 Mar. Jun. Sep. 2007 Mar. A Jun. A Sep. A 2008 Mar. A 2009E 2010E 2011E ASSETS CURRENT ASSETS Cash and cash equivalents 6,591 4,786 9,359 7,089 10,410 5,749 18,510 17,483 41,331 46,247 47,864 20,394 12,338 Accounts receivable, net 125,744 126,023 143,733 148,124 135,260 145,749 148,468 136,623 106,954 116,219 111,323 113,362 125,263 Expenditures billable to clients 28,077 42,310 19,655 14,167 19,409 29,001 28,781 25,384 16,949 18,380 17,796 18,864 19,996 Prepaid expenses 4,816 8,361 8,635 7,609 5,937 6,707 6,159 6,400 5,240 5,668 5,668 5,668 5,668 Other Current Assets 1,248 1,446 3913 2005 2422 2504 2441 2419 5270 5145 5,145 5,145 5,145 Total current assets 166,476 182,926 185,295 178,994 173,438 189,710 204,359 188,309 175,744 191,659 187,797 163,433 168,410 Fixed assets 44,425 44,536 42,594 46,428 47,440 47,591 48,018 45,451 44,021 40,798 42,921 45,418 43,822 Investment in affiliates 2,058 2,015 861 394 1,434 1,657 1,748 1,871 1,593 1,692 1,692 1,692 1,692 Goodwill 203,693 199,381 207,924 219,709 217,726 224,240 227,772 227,294 238,214 237,270 237,270 237,270 237,270 Other intangible assets 48,933 47,696 49,955 40,132 55,399 51,010 47,566 44,347 46,852 43,257 43,257 43,257 43,257 Deferred tax assets 13,332 13,505 13,563 14,493 9,175 10,182 8,331 6,952 11,926 11,321 12,224 12,224 12,224 Other assets 14,584 14,334 17,704 16,938 16,086 15,300 14,877 14,491 10,889 10,088 10,209 10,209 10,209 Total Assets 493,501 504,393 517,896 517,088 520,698 539,690 552,671 528,715 529,239 536,085 535,370 513,503 516,884 CURRENT LIABILITIES Revolving credit facility 45,000 78,350 Accounts payable 90,588 68,753 97,224 68,172 65,839 58,756 76,895 64,662 75,360 66,353 72,349 78,860 82,015 Accounts payable turns 3.4 3.3 5.6 4.9 6.6 6.0 5.0 5.9 5.0 5.0 7.9 8.5 8.4 Accrued and other liabilities 75,315 63,057 62,853 68,229 74,668 64,532 77,176 63,594 55,338 58,985 53,866 53,866 53,866 Advanced billings 51,804 73,576 52,039 47,339 50,988 74,519 70,227 68,852 50,053 56,663 50,053 50,053 50,053 Current portion of longterm debt 1,177 1,129 704 1,777 1,796 1,855 1,896 1,599 1,546 1,519 1,519 - Deferred acquisition consideration 2,721 2037 1359 320 2511 2223 2442 2413 5538 3436 3,436 3,436 3,436 Total current liabilities 271,515 287,436 214,179 185,837 195,802 201,885 228,636 201,120 187,835 186,956 177,787 182,779 185,934 Longterm debt 5,754 5658 62,162 79,258 115,662 115,927 115,856 115,063 133,305 132,872 131,872 131,872 111,872 Revolving credit facility 22,215 25,631 1,901 18,561 6,801 10,302 9,701 19,567 19,567 19,567 19,567 Convertible notes 38,613 38,975 42,238 45,235 45,395 43,838 44,131 42,285 36,946 35,677 38,424 (0) (0) Other liabilities 5,512 5,488 6,239 7,068 8,267 8,624 8,779 8,878 6,949 8,914 9,909 9,909 9,909 Deferred tax 1,140 1136 1148 5282 819 530 552 596 4,700 4,589 5,284 5,284 6284 Total liabilities 322,534 338,693 348,181 348,311 367,846 389,365 404,755 378,244 379,436 388,575 382,843 349,411 333,566 COMMITMENTS AND CONTINGENCIES SHAREHOLDERS EQUITY Minority interests 46,553 47,370 48,125 48,093 24,919 25,940 25,893 26,063 22,622 57,037 56,683 58,300 58,299 Total shareholders equity 124,414 118,330 121,590 120,684 127,933 124,385 122,023 124,408 127,181 90,473 95,843 105,791 125,019 Total liabilities and shareholders equity 493,501 504,393 517,896 517,088 520,698 539,690 552,671 528,715 529,239 536,085 535,370 513,503 516,884 Book value per share $10.09 $10.60 $10.71 $10.37 $9.90 $9.87 $10.35 $9.48 $9.06 $9.42 $9.06 $8.00 $8.12 Cash Per Share $0.28 $0.20 $0.39 $0.29 $0.42 $0.21 $0.69 $0.64 $1.53 $1.71 $1.70 $0.70 $0.42 Shares 23,875 24,275 24,275 24,800 25,001 26,800 26,800 27,116 26,958 27,116 28,116 29,116 29,116 Current ratio 0.61 0.64 0.87 0.96 0.89 0.94 0.89 0.94 0.94 1.03 1.06 # 0.89 # 0.91 Acid test ratio 0.59 0.60 0.81 0.91 0.84 0.89 0.86 0.89 0.88 0.97 1.00 # 0.83 # 0.85 Long Term Debt to Capital 22.6% 23.2% 43.9% 48.2% 52.8% 55.4% 54.3% 54.0% 55.5% 57.2% 56.7% # 49.6% # 43.5% Total Debt 95,454 124,646 105,104 126,270 162,853 161,620 161,883 158,947 171,797 170,068 171,815 131,872 111,872 Longterm Debt 44,367 44,633 126,615 150,124 162,958 178,326 166,788 167,650 179,952 188,116 189,863 151,439 131,439 Leverage Ratio 0.8 3.5 2.3 2.7 3.3 3.2 3.0 2.8 2.4 2.2 1.8 # 1.5 # 2.1 Debt Ratio 0.43 0.51 0.46 0.51 0.56 0.57 0.57 0.56 0.57 0.65 0.64 # 0.55 # 0.47 EBITDA-to-interst coverage ratio 3.5 0.9 4.3 3.6 4.4 2.7 5.2 2.8 4.1 2.7 4.1 # 3.4 # 7.8 Days sales outstanding 99.8 128.3 100.6 98.6 92.6 90.7 104.3 89.1 75.6 82.7 83.0 64.4 86.0 Accounts payable days 107.4 109.5 65.7 74.2 55.1 60.7 73.0 61.5 73.0 73.0 46.3 # 43.0 # 43.4 Return on invested capital (ROIC) 4.5% 2.6% 4.9% 3.4% 6.2% 4.7% 5.5% 5.7% 5.5% 6.6% 8.4% 13.7% 17.8% ROAE NM NM NM NM NM NM NM NM NM NM 3.6% # 9.9% # 16.7% ROAA NM NM NM NM NM NM NM NM NM NM 0.8% # 1.9% # 3.7% Source:Albert Fried andCompany LLC and Company Reports
- 5. Table 3. MDC PARTNERS STATEMENT OF CASH FLOWS (All figures in $000s except where noted) 2007 Mar. A Jun. A Sep. A Dec 2008 Mar. A 2009E 2010E 2011E CASH FLOWS FROM OPERATING ACTIVITIES Net Income/loss (26,355) (3,394) (4,470) 3,250 4,747 133 411 9,972 16,272 28,080 Income (loss) from non-controlling interests (7,277) 2,001 (5,841) 0 (6,175) (10,015) (382) (4,228) (4,324) (6,852) Net income (loss) attributable to MDC Partners Inc. (19,078) (1,393) 1,371 3,250 6,920 10,148 29 5,745 11,948 21,228 Loss from discontinued operations (252) (1,752) (2,000) (2,000) Income (loss) attributable to MDC Partners Inc. from continuing 281 7,497 13,948 23,228 Adjustments to reconcile net income (loss) Depreciation 14,638 6,046 2,288 4,270 4,155 16,759 4,017 17,317 15,176 13,416 Amortization of intangibles 14,608 4,042 6,406 3,275 3,922 17,645 3,576 14,169 12,416 10,976 Stock-based compensation 9,088 1,759 1,699 1,595 8,490 13,543 1,686 8,700 9,000 10,000 Goodwill and intagible impairment charges 0 0 Amortization and write-off of deferred finance charges 2,330 346 342 348 312 1,348 318 318 318 318 Deferred income taxes 5,253 577 1,423 (2,960) (960) 490 (298) (300) (300) Gain (loss) on disposal of assets and long-term debt (1,691) 3 110 29 142 Earnings of non consolidated affiliates (165) (140) (81) (69) (59) (349) (93) (584) (400) (400) Foreign exchange and other 7,278 (4,117) 1,055 (2,565) (8,940) (14,567) (1,999) (1,999) (1,999) (1,999) Minority interest and other 3,754 725 205 (49) (2,165) (1,284) 2,126 2,311 2,500 2,500 Changes in non-cash working capital 0 Accounts recievable (12,712) (10,681) (2,694) 11,809 27,882 26,316 (9,259) (4,369) (2,038) (11,901) Expenditures billable to clients 8,635 (9,592) 217 3,400 8,129 2,154 (1,431) (11,961) (1,068) (1,132) Prepaid expenses and other current assets (1,160) (851) 596 (221) 2,113 1,637 (256) (684) 0 0 Accounts payable, acrruals and other liabilities (25,083) (20,289) 30,084 (25,823) 4,283 (11,745) (5,138) (3,011) 6,511 3,154 Advance billings (1,662) 23,420 (4,395) (1,375) (17,492) 158 6,610 - Cash flow from continuing operations 4,033 (10,725) 48,398 (622) 23,894 60,945 928 29,607 26,472 34,444 Discountinued operations 99 275 (69) 93 (3,798) (3,499) (368) (2,000) (2,000) (3,000) Net cash provided by operating activities 4,132 (10,450) 33,605 (529) 34,820 57,446 560 27,607 24,472 31,444 Cash flows from investing activities Capital expenditures (20,072) (4,223) (4,416) (2,083) (3,673) (14,395) (830) (5,000) (5,000) (5,000) Acquisitions, net of cash (47,648) (5,737) (4,295) (623) (25,186) (35,841) (3,352) (8,000) (7,000) (14,500) Proceeds from asset sales 8,270 136 93 210 (197) 242 2 Other investments (1,464) (109) (5) 244 (215) (85) Distributions from non-consolidated affiliates 68 (260) 632 440 59 395 Discontinued operations 0 (547) (547) Net cash used in investing activities (60,914) (9,933) (8,555) (2,512) (29,186) (50,186) (4,121) (24,110) (12,000) (19,500) Cash flow from financing activities Increase (decrease) in bank indebtedness (4,910) Payments under old credit facility (45,000) Proceeds from new credit facility 1,901 16,660 (11,760) 3,501 (601) 7,800 9,866 Proceeds from term loan 111,500 0 18,500 18,500 Repayment of long-term debt (5,843) (200) (243) (1,169) (272) (1,884) (635) (1,000) (39,943) (20,000) Deferred financing costs (3,946) 0 0 Issuance of share capital 4,893 0 Proceeds from stock subscription recievable 3 (2) (1) 13 13 Purchase of treasury shares (769) (874) (2) (20) (10) (906) (320) (320) Proceeds from note payable 3,250 0 Discontinued operations (147) 0 0 Net cash provided by finacing activities 60,929 15,586 (12,002) 2,310 17,616 23,510 8,924 (1,307) (39,943) (20,000) Effect of exchange rate on cash (328) 136 (287) (296) 598 151 (447) (573) 0 Net increase (decrease) in cash 3,819 (4,661) 12,761 (1,027) 23,848 30,921 4,916 1,617 (27,471) (8,056) Cash and cash equivalents, beginning of period 6,591 10,410 5,749 18,510 17,483 10,410 41,331 46,247 47,864 20,394 0 Cash and cash equivalaents, end of period 10,410 5,749 18,510 17,483 41,331 41,331 46,247 47,864 20,394 12,338 Free cash flow (FCF) (15,940) (14,673) 29,189 (2,612) 31,147 43,051 (270) 22,607 19,472 26,444 Cash per share $0.42 $0.21 $0.69 $0.64 $1.52 $1.53 $1.71 $1.70 $0.70 $0.42 Operating cash flow per share $0.17 ($0.39) $1.25 ($0.02) $1.28 $2.13 $0.02 $0.98 $0.84 $1.08 Free cash flow per share (FCF) ($0.64) ($0.55) $1.09 ($0.10) $1.15 $1.60 ($0.01) $0.80 $0.67 $0.91 Simple cash flow per share ($0.69) $0.09 ($0.01) $0.32 $0.34 $0.75 $0.26 $1.30 $1.33 $1.63 Yield to FCF NM NM NM NM 27.3% 15.2% -0.1% 7.7% 6.4% 8.6% Simple cash yield NM 1.1% -0.1% 3.8% 4.0% 7.1% 2.5% 12.3% 12.7% 15.5% Source:Albert Fried andCompany LLC and Company Reports
- 6. Price Chart June 24, 2009 BUY Target:$9 PX: $5.64
- 7. Research at Albert Fried & Company LLC © Copyright 2009 IMPORTANT DISCLOSURES The Albert Fried & Company LLC Equity Research rating system consists of BUY, MARKET PERFORM and SELL recommendations. NC, denotes “Not Covered”. BUY suggests capital appreciation of at least 30% from initiation of coverage over the next 12 months, while MARKET PER- FORM denotes that a stock is not likely to provide similar gains over a 12-month period and SELL suggests a price decline of 30% over the next 12-month period . As of 01/01/09, Albert Fried & Company LLC provides research on 2 companies, of which 1 (50%) are rated BUY and 0 (0%) are rated Market Perform and are rated SELL 1 (50%) . Of the BUYS, Albert Fried & Company, LLC has received investment banking income from 0 companies (0%). Of the BUY 0 (0%) trade above and 0 (0%) trade below our price targets. Of the MARKET PERFORM, 0 (0%) trade above and 0 (0%) trade below our price targets. Of the SELL. 0 (0%) trade above and 1(100%) trade below our price targets. Any estimates or forecasts may not be met. This report contains forward-looking statements, which involve risks and uncertainties. Actual results may differ materially from the projections described in the forward-looking statements. The material contained in this report is for informational purposes only and is not a solicitation, or an offer or recommendation, to buy or sell securities mentioned. Neither Albert Fried & Company LLC nor any person involved in the preparation of this publication accepts any liability or responsibility for the accuracy or completeness of this publication and none of them makes any representation or warranty in relation thereto. Recipients of this report should conduct their own investigation, confirmation and analysis of the information contained in this publication. Much of the company-specific data and information in this report was obtained directly from the company’s SEC filings, reputable news wires or the company’s manage- ment. No recipient should act on the basis of any matter contained in this publication without considering and, if necessary, taking appropri- ate legal, financial, and other professional advice upon the recipient’s own particular circumstances. Investors are advised to undertake their own investigation of the merits of investing in the Companies profiled in this report. Information contained herein is based on sources we believe to be reliable but we do not guarantee their accuracy. Prices and opinions concerning the composition of market sectors included in this report reflect the judgments as of this date and are subject to change without notice. Reprints of Albert Fried & Company LLC reports are prohibited without permission. The research analyst (Richard R Tullo) certifies on May 29, 2009 that this report accurately reflects his/her personal views about the subject securities and issuers and that none of the research analyst's compensation was, is or will be directly or indirectly related to the analyst's specific recommendations or views contained in this research report. Occasionally, Albert Fried & Company LLC may receive a fee, directly or indirectly, at the time of an underwriting for an individual company already under research coverage, for which the covering analyst will not be compensated. Albert Fried & Company LLC, or persons associated with it may own securities of the issues described herein and may make purchases or sales while this report is in circulation. Albert Fried & Company LLC, policy does not allow any analyst to own shares in any company he/she covers. No employee or household member thereof, serves as an officer or director of a covered company. Albert Fried & Company LLC does not make a market in any securities contained in this report. Additional information is available upon request. OTHER IMPORTANT DISCLOSURES Communications Under FINRA Rule 2711 the term research report does not include: A) communications that are limited to the following i) discussions of broad-based indices; ii) commentaries on economic, political or market conditions iv) statistical summaries of multiple companies' financial data, including listings of current ratings; V) recommendations regarding increasing or decreasing holdings in particular industries or sectors; (B) the following communications, even if they include an analysis of an individual equity security and information reasonably sufficient upon which to base an investment decision: (i) any communication distributed to fewer than 15 persons