1. Wealth Management Research 13 June 2011
UBS Weekly Guide
More turbulence ahead
We see the potential for additional near term choppiness Mike Ryan, CFA, Chief Investment Strategist
amid another heavy economic release calendar, mike.ryan@ubs.com
appearances by several senior Fed officials including
Chairman Bernanke and the ongoing stalemate over
funding for another bailout for Greece. Contents Page
However, with sentiment toward risk assets having Feature article 1
turned decidedly negative and bonds outperforming Buy the “favorite five” currencies on dollar 5
stocks over the past month and a half, equity markets rallies
appear oversold. In the absence of materially weaker
Our Best Ideas at a Glance 6
than expected economic data releases and/or additional
fallout from the Eurozone, equity markets appear poised Review/Preview of the Financial Markets 7
for something of a modest relief rally this week. Earnings Calendar 8
Any sustained recovery in equity markets will still require Key Economic Indicators 9
confirmation that: (1) the economic recovery remains on
Strategy and Performance 10
track; (2) the earnings impact from the soft patch will be
both modest and transitory; and (3) the policy mix is still Reports of Note Published in the Last Week 11
supportive of growth and risk taking.
Choppy and sloppy
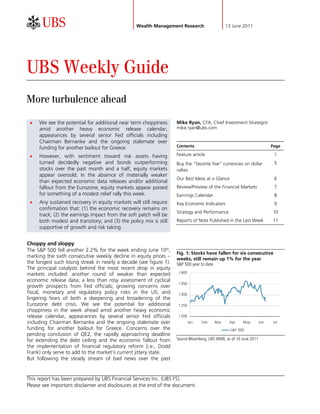
The S&P 500 fell another 2.2% for the week ending June 10th,
Fig. 1: Stocks have fallen for six consecutive
marking the sixth consecutive weekly decline in equity prices –
weeks, still remain up 1% for the year
the longest such losing streak in nearly a decade (see figure 1). S&P 500 year to date
The principal catalysts behind the most recent drop in equity
1400
markets included: another round of weaker than expected
economic release data; a less than rosy assessment of cyclical
1350
growth prospects from Fed officials; growing concerns over
fiscal, monetary and regulatory policy risks in the US; and 1300
lingering fears of both a deepening and broadening of the
Eurozone debt crisis. We see the potential for additional 1250
choppiness in the week ahead amid another heavy economic
release calendar, appearances by several senior Fed officials 1200
including Chairman Bernanke and the ongoing stalemate over Jan Feb Mar Apr May Jun Jul
funding for another bailout for Greece. Concerns over the S&P 500
pending conclusion of QE2, the rapidly approaching deadline
for extending the debt ceiling and the economic fallout from Source:Bloomberg, UBS WMR, as of 10 June 2011
the implementation of financial regulatory reform (i.e., Dodd
Frank) only serve to add to the market’s current jittery state.
But following the steady stream of bad news over the past
This report has been prepared by UBS Financial Services Inc. (UBS FS).
Please see important disclaimer and disclosures at the end of the document.
2. UBS Weekly Guide
several weeks, markets are now better positioned to weather
both softer economic data and persistent policy uncertainties.
As our chief equity strategist, Jeremy Zirin, points out, the
equity risk premium (stocks earnings yield less the real bond
yield) stands near levels not seen since the middle of last Fig. 2: The equity risk premium stands at its
summer – the last time an economic soft patch unnerved highest level since last summer
Equity risk premium — earnings yield less the real bond yield
financial markets (see figure 2). While the size of the equity risk
premium alone should not be used as a market timing tool, it 10%
does offer insight into both the relative return prospects across 8%
asset classes as well as potentially oversold market conditions.
With sentiment toward risk assets having turned decidedly sour, 6%
and bonds sharply outperforming stocks over the past month 4%
and a half, equity markets are overdue for a rebound. So in the
absence of materially weaker than expected economic data 2%
releases and/or additional fallout from the Eurozone, equity 0%
markets appear poised for something of a modest relief rally 1985 1990 1995 200 200 2010
this week. ERP - earnings yield less real bond yield
Proof points Source:Bloomberg, UBS WMR, as of 10 June 2011
Still, any sustained recovery in equity markets (and risk assets in
general) will hinge upon more than just the absence of bad
news. Market participants will require confirmation or “proof
points” that: (1) the economic recovery remains on track; (2)
the earnings impact from the soft patch will be both modest
and transitory; and (3) the policy mix is still supportive of
growth and risk taking. But this will likely take some time. The
effects of the earthquake and associated tsunami in Japan on
the global supply chain will continue to negatively impact the
Fig. 3: Companies have been able to consistently
economic data for some weeks. Our economics team recently
beat consensus forecasts over the last two years
reduced growth estimates for the second quarter to reflect the Percentage of S&P 500 companies beating consensus earnings
fallout from Japan. Although oil prices have pulled back from estimates
their recent cyclical highs, it will take a while before this begins
12%
to ease pressures upon the consumer. Keep in mind also that
the tightening of monetary policy by emerging market central 10%
bankers has begun to impact economic activity more tangibly.
8%
While we view this as a healthy transition towards a more
sustainable pace of growth, signs of a slowdown in the 6%
developing world are likely to be greeted cautiously in the near
term when coupled with the structural challenges confronting 4%
developed nations. 2%
The most important factor for equity markets remains the 0%
outlook for corporate profits. Keep in mind that earnings have 2Q09 3Q09 4Q09 1Q10 2Q10 3Q10 4Q10 1Q11
been the one consistent bright spot in what has been an
Source:Factset, UBS WMR, as of 10 June 2011
otherwise sluggish and uneven recovery process. Through a
combination of aggressive cost cutting and moderate revenue
growth, companies have been able to consistently beat analyst
estimates for each of the past eight quarters (see figure 3). But
the prospects for continued above consensus profits are more
limited with analysts having recently ratcheted up earnings
estimates. Although we remain confident in our forecast for
$100 in earnings for the S&P 500 for 2011 and $108 for 2012,
the risks are have become increasingly symmetrical. In the lull
between Q1 and Q2 earnings seasons, there may well be a
number of cuts in analyst estimates as companies offer more
conservative guidance. This will likely keep markets volatile until
Q2 earnings season actually gets underway and corporate CFOs
Wealth Management Research 13 June 2011 2
3. UBS Weekly Guide
offer validation that the supportive profit picture remains intact.
No stick, no carrot
Turning our attention finally to the monetary policy outlook, Fig. 4: Tactical deviations across asset classes
many view the Fed as being caught “between a rock and a hard Deviations from benchmark (9-12 month time horizon)
place.” Because while additional stimulus could well provoke a
further acceleration in price pressures globally, a premature Equity
tightening of policy would almost certainly weigh more heavily
upon a domestic economy already working its way through a Fixed Income
pretty rough soft patch. But after reflecting a bit upon Fed
Chairman Bernanke recent appearance at the International Cash
Monetary Conference in Atlanta, Georgia and the release of the
Commodities
Beige Book, it struck us that the Fed’s current policy dilemma
has less to do with “rocks and hard places” and more to do ––– –– – n + ++ +++
with “sticks and carrots.” Underweight Overweight
Source:UBS WMR, as of 12 June 2011
The Fed must try to move toward a more normalized policy Note: Deviation from Benchmark Labels: + = moderate
stance over time – but will have to do so without adding to the overweight, ++ = overweight, +++ = strong over-weight, n =
already stiff economic headwinds. This means that while there neutral, - = moderate underweight, -- = underweight, --- = strong
is unlikely to be a “QE3” in the offing, Fed officials will still underweight, n.a. = not applicable.
need to take a decidedly deliberate and pragmatic approach to For the interpretation of the suggested tactical deviations from
both shrinking a bloated balance sheet and raising interest benchmark, please see the most recent Investment Strategy Guide.
rates. This offers something of a “mixed bag” for risk assets
and reinforces the notion that the recent bout of choppy
market conditions will persist for the near term. We still have a
preference for both equity and credit (see figure 4). However,
periods of underperformance are to be expected in the near
term as the economy negotiates through the current soft patch.
Comfort level
In his prepared remarks in Atlanta, Chairman Bernanke once
again expressed his frustration with the pace of the economic
recovery. While the Chairman cited the severe supply chain
disruptions associated with the earthquake in Japan as the
primary catalyst behind the most recent slowing of growth, he
continued to focus upon the sluggish pace of job creation as
Fig. 5: May’s employment report was
the biggest intermediate challenge to the economy. These
disappointing
concerns have certainly been validated by both the increase in
US non-farm payrolls
weekly unemployment claims and the disappointing payroll
report for May (see figure 5). Although the recent increase in 600
inflation has also been something of a concern for 400
policymakers, there is little evidence that price pressures are 200
0
becoming more broadly-based and/or deeply entrenched. Since
(200)
much of the increase in inflation is linked to higher food and
(400)
energy prices, recent signs of a moderation in commodity prices (600)
suggest that inflationary risks will ease. (800)
(1000)
This is where the “stick” part comes in. With employment 2000 2002 2004 2006 2008 2010 2012
growth running well below what is typically seen at this part of
US non-farm payrolls
the business cycle, the Fed has little incentive to go out and
raise interest rates anytime soon. Bernanke emphasized that Source: Bloomberg, UBS WMR, as of 10 June 2011
until and unless job creation strengthens materially, the Fed will
need to retain an accommodative policy approach. At the same
time, fears that the Fed may be feeding into a global
inflationary trend should begin to abate. Bernanke went to
great lengths in his formal remarks to dismiss the notion that
Fed policy is behind the inflation surge in emerging markets,
citing instead the demand-driven surge in commodity prices. So
as overall price pressures begin to moderate along with food
Wealth Management Research 13 June 2011 3
4. UBS Weekly Guide
and energy costs – partly as a result of the economic soft patch
– any pressure on the Fed to “reign in” policy will ease as well.
This offers policymakers a great deal of latitude to maintain the
current easy policy conditions for an extended period of time.
While our economics team is still calling for an initial rate hike
during the first quarter of 2012, it well may be that the Fed
remains sidelined even longer.
But what Chairman Bernanke didn’t say in Atlanta may be every
bit as important as what he did say. With QE2 drawing to a
close at the end of this month, there has been a fair amount of
speculation over whether or not the Fed will initiate some new
purchase program to help both bolster the economy and
support risk assets. Evidence that the economy has decelerated
during the current quarter – coupled with the recent pullback in
equity markets – has only served to reinforce this view in some
quarters. While Bernanke noted that the Fed would continue its
existing policy of reinvesting principal payments from maturing
securities to maintain the Fed’s balance sheet at current levels,
he offered no indication that a new phase of monetary stimulus
was anywhere in the works. He pointed out that monetary
policy cannot be a “panacea” – suggesting that QE3 isn’t on
the table given the current set of macro, market and liquidity
conditions. In short, market participants will need to find a
comfort level that the current policy mix will be adequate to
promote a gradual improvement in cyclical conditions and
adequate support for risk assets because there don’t appear to
be any more carrots in the offing either.
Wealth Management Research 13 June 2011 4
5. UBS Weekly Guide
Buy the “favorite five” currencies on dollar rallies
While our forecasts project that the worth looking beyond the
US dollar will again rally against traditional main currencies, yet for
many of the major currencies, we many investors emerging markets
think the Greenback will likely lose can be too volatile or have too few
purchasing power over the long investment opportunities to justify
term. In the short term an end to a major portfolio allocation. We
the Federal Reserve’s additional believe the Canadian dollar,
quantitative easing, decent US GDP Australian dollar, Swedish krona,
growth in the second half of 2011 Norwegian krone and the Swiss
and persistent concern about the franc are attractive from a long-
structural integrity of the Eurozone term economic perspective. The
could help the dollar. However, the NOK and CAD show a strong
long term fiscal burdens and correlation to oil prices coupled Katherine Klingensmith,
continued problems in real estate with strong domestic economies, Strategist
market are among some of the while the AUD is linked to demand
Constantin Vayenas,
major challenges to the US. The from China, coal and base metals.
Analyst
other main currencies – the euro, The franc (CHF) does well in times
Japanese yen and British pound all of financial and economic stress,
also face troubles with government and Switzerland offers a strong
debt and low growth. domestic economy. Sweden (SEK)
has resource constraints so is quick
We think short term rallies in the to see inflation and higher interest
US dollar should be used to rates; additionally, the currency is
diversify dollar-based portfolios. linked to a healthy domestic stock
The dollar is currently weak, market. All of these countries have
making these and many other strong public balance sheets and
currencies expensive for US export bases. Australia offers the
investors. We do, however, highest interest rates, which has
suggest adding fundamentally been one reason for its especially
sound international investments as sharp appreciation over the past
opportunities arise. We think it is year.
Fig. 1: Favorite five very strong versus four big curencies Fig. 2: Favorite five seeing faster growth recovery
USD, EUR, GBP, JPY vs. CHF, NOK, SEK, AUD, CAD real exchange rates USD, EUR, GBP, JPY vs. CHF, NOK, SEK, AUD, CAD GDP growth
130 Real effective exchange rate GDP growth
6%
125
120 4%
115
2%
110
105 0%
100
-2%
95
90 -4%
85 -6%
80
Jan-00 Jan-02 Jan-04 Jan-06 Jan-08 Jan-10 -8%
Apr-01 Apr-03 Apr-05 Apr-07 Apr-09 Apr-11
AVG G4 AVG F5 AVG G4 AVG Fav 5
Source: Thomson Reuters, UBS WMR, as of 1 June 2011 Source: Thomson Reuters, UBS WMR, as of 1 June 2011
Wealth Management Research 13 June 2011 5
6. UBS Weekly Guide
Our Best Ideas at a Glance
The following list represents investment strategy recommendations that we believe will provide attractive
opportunities over the next 9-12 months.
Asset Classes Preference for Equities over Bonds
Currencies Preference for British Pound (GBP) and minor currencies, in particular the Swedish Krona
(SEK), the Norwegian Krona (NOK), the Canadian dollar (CAD), as well as selected Asian
emerging market currencies.
Equities International markets
Select Emerging Market equities, especially China, Brazil and Taiwan
UK equities
Within US equities
Information Technology: in particular hardware and equipment, semis
Consumer Staples: in particular companies with emerging markets exposure, especially
within household products, personal care and beverages
Healthcare: in particular drug distributors
Within Financials: insurers
Within Industrials: mid/late cycle end market capital goods companies
Within Materials: chemicals and industrial gas
Within Energy: oilfield services
Within Consumer Discretionary: auto suppliers, restaurants, lodging
Within Telecom: wireless towers & data centers
Preference for Growth over Value stocks
Fixed Income Within US dollar Fixed Income
High Yield Corporate bonds
Investment Grade BBB-rated Corporate bonds
Commodities We see upside potential for crude oil, gold, platinum, selected base metals and agricultural
commodities.
Wealth Management Research 13 June 2011 6
7. UBS Weekly Guide
Review/Preview of the Financial Markets
Review In the past week, the US trade quarter-over-quarter Non-mortgage consumer
6 June – 10 balance for April grabbed a lot annualized for the second credit continued to rise in
June of attention, as it narrowed quarter of 2011, but highlight April, although it was still
significantly from revised USD the upside risk to that forecast. driven by government-led
46.8 billion (bn) to USD student loans. This
43.7bn. While export growth Other US economic data notwithstanding, the apparent
remained solid at 1.3% releases were generally stabilization bodes well for a
month-over-month (m/m), dismissive of a deeper or more less fragile consumer sector.
imports fell by 0.4% m/m due prolonged growth soft patch.
to Japan-related supply Consumer sentiment
disruptions. At face value, the The Beige Book, with indicators continued to send
information from Federal
narrowing implies a boost to mixed signals, with the
Reserve business contacts
2Q11 real Gross Domestic compiled through 27 May, IBD/TIPP economic optimism
Product (GDP) growth of showed a less pronounced index rising in early June week
about 2 percetange points at deceleration in real activity versus early May. However,
an annual rate. However, than the May Institute for the daily Rasmussen index and
slower imports imply less Supply Management (ISM) monthly Conference Board
inventory accumulation as well surveys and labor market have not rebounded yet from
as weaker consumption. report suggested. The reported their drops in March/April.
Additionally, import growth stated that “economic activity
will likely pick up again by generally continued to expand Thomas Berner, CFA, Economist
June, as supply disruptions are since the last report, though a
already fading. We, therefore, few districts indicated some
keep our current real GDP deceleration.” This was only a
growth forecast of 2.5% marginally weaker tone than
the prior Beige Book.
Preview The week ahead should offer Whether the inflation with the growth message of
13 June – 17 some relief in the data moderation will be an the national ISM index. The
June regarding price pressures from important driver for a rebound Philly Fed prints a bit weaker at
the past surge in the price of in consumer sentiment remains 3.9 in May. However, also here
oil. Producer and consumer to be seen. We expect it to be we don’t expect much change
prices were likely depressed by and forecast further and forecast a level of 4 in
falling energy prices in May. improvement in the University June. While we think that the
We expect the Producer Price of Michigan consumer Japan-related supply
Index (PPI) for finished goods sentiment index from 74.3 in disruptions will be transitory,
to rise a moderate 0.1% m/m, May to preliminary 75 in June. June manufacturing climate
with core PPI a stronger but In our view, and improvement data will possibly not reflect
still moderate 0.2%. In similar in consumer and/or business that yet.
fashion, the Consumer Price sentiment will be crucial to
Index (CPI) will likely flat, but support our view of a The Conference Board index of
core CPI up 0.2% m/m in May. temporary growth soft patch in leading indicators will likely
In both cases, the moderation the first half of 2011. rise 0.5% m/m in May. Given
in monthly increases should the current debate
not suffice to reverse earlier The timely Empire State and sourrounding the depth and
upward trends in y/y rates. the Philly Fed manufacturing length of the current growth
That said, we expect these climate indexes will likely show slowdown, the leading
uptrends to be moderate due little change in June. We indicators will likely get more
to still ample resource slack in forecast 11 for the Empire attention than usual.
the economy. index, after 11.9 in May. At
this level it is roughly consistent Thomas Berner, CFA, Economist
Wealth Management Research 13 June 2011 7
8. UBS Weekly Guide
Earnings Calendar
The Earnings Calendar provides publicly announced reporting dates and times of companies covered by Wealth
Management Research Americas. Reporting dates and times are subject to change by the reporting companies.
Analyst
WMR-A Covering Contact
Date Ticker Company Reporting Period Time (EST) Analyst Information
Q4 2011 Earnings
Darden Alexandra 212-713-
14-JUN-2011 DRI Release Unspecified
Restaurants, Inc. Mahoney 2825
(Projected)
Q1 2012 Earnings Alexandra 212-713-
14-JUN-2011 BBY Best Buy Co., Inc. 8:00am
Release Mahoney 2825
Amerigo Q1 2011 Earnings 212-713-
14-JUN-2011 ARG Before Market Andrew Sutphin
Resources Ltd. Release 3646
May 2011 Sales
212-713-
15-JUN-2011 PGR Progressive Corp and Revenue After Market Michael Dion
3825
Release
Q2 2011 Earnings
Alexandra 212-713-
16-JUN-2011 CCL Carnival Corp. Release Unspecified
Mahoney 2825
(Projected)
Q1 2011 Earnings 212-713-
18-JUN-2011 KR Kroger 10:00 am Sally Dessloch
Release 9667
Wealth Management Research 13 June 2011 8
9. UBS Weekly Guide
Key Economic Indicators
Date Indicator Time (EST) Unit Consensus UBS Est. Previous
Retail Sales (May) -0.4% -0.8% 0.5%
14-Jun-11 8:30 AM m/m
Retail Sales excluding Autos (May) 0.3% -0.2% 0.2%
14-Jun-11 8:30 AM m/m
Producer Price Index (PPI, May) 0.0% 0.1% 0.8%
14-Jun-11 8:30 AM m/m
Core PPI excl. Food & Energy (May) 0.2% 0.2% 0.3%
14-Jun-11 8:30 AM m/m
Business Inventories (Apr) 1.0% 0.8% 1.1%
14-Jun-11 10:00 AM m/m
Consumer Price Index (CPI, May) 0.1% 0.0% 0.4%
15-Jun-11 8:30 AM m/m
Core CPI (May) 0.2% 0.2% 0.2%
15-Jun-11 8:30 AM m/m
Empire State (Jun) 13.0 11.0 11.9
15-Jun-11 8:30 AM index
Industrial Production (May) 0.3% 0.0% 0.0%
15-Jun-11 9:15 AM m/m
Capacity Utilization (May) 77.0% 76.8% 76.9%
15-Jun-11 9:15 P AM
Housing Market Index (Jun) 16 16 16
15-Jun-11 10:00 AM index
Jobless Claims (Jun 4) 419 k 420 k 427 k
16-Jun-11 8:30 AM level
Housing Starts (May) 540 k 570 k 523 k
16-Jun-11 8:30 AM level
Current Account Balance (Q1) -$126.0 bil -$125.5 bil -$113.3 bil
16-Jun-11 8:30 AM level
Philadelphia Fed (Jun) 7.0 4.0 3.9
16-Jun-11 10:00 AM index
U. of Michigan Sentiment (June) 74.5 76 74.3
17-Jun-11 9:55 AM index
Leading Indicators (May) 0.2% 0.5% -0.3%
17-Jun-11 10:00 AM m/m
Source: Bloomberg & UBS estimates, as of 10 June 2011.
In developing the WMR quarterly forecasts, WMR economists worked in collaboration with economists employed by UBS Investment
Research (INV). All remaining forecasts were developed by economists employed by INV. INV is published by UBS Investment Bank. Forecasts
and estimates are current only as of the date of this publication and may change without notice.
m/m = month-over-month, q/q = quarter-over-quarter, k = thousand, bn = billion, y/y = year-over-year, mn = million
Wealth Management Research 13 June 2011 9
10. UBS Weekly Guide
Asset Class Strategy & Performance Equity Region Strategy & Performance
Extended Market Returns Strategy* Market Returns
Asset
MTD YTD 2010
Allocation
Strategy* MTD YTD 2010 US Equity n -4.4% 3.5% 16.9%
US Equity + -4.4% 3.5% 16.9% S&P 500 n.a. -4.1% 3.4% 15.1%
Non-US
— -2.6% 3.8% 9.4% DJIA n.a. -3.5% 5.9% 14.1%
Developed Equity
Emerging Market Nasdaq n.a. -5.3% 1.6% 18.0%
+ -2.1% 0.5% 19.2%
Equity
EMU** — -1.8% 11.2% -3.4%
US Fixed Income — 0.2% 3.2% 6.5%
Non-US Fixed UK + -2.5% 6.0% 8.8%
—— 0.9% 6.1% 4.9%
Income Japan — -1.9% -7.9% 15.6%
Cash (USD) + 0.0% 0.1% 0.1% n.a. n.a.
Other Developed — n.a.
Commodities n 0.1% 2.7% 16.8%
Total return indices in USD: Russell 3500, MSCI EAFE & Canada, MSCI Emerging
++ -2.1% 0.5% 19.2%
Emerging Markets, BarCap US Aggregate, BarCap Global Aggregate ex-USD, Markets
Citigroup 3-month T-bill, DJ UBS Total return indices in USD: S&P 500, DJIA, Russell 3500, MSCI for non-US.
Price return indices in USD: Nasdaq
US Equity Sector Strategy & Performance
Equity Size, Style Strategy & Performance
Sector Market Returns
Strategy* Weekly Style Market Returns
MTD YTD 2010
Strategy* MTD YTD 2010
Cons. Discr. — -2.2% -4.7% 3.5% 27.7%
Cons. Staples ++ -1.0% -3.1% 7.2% 14.1% Large-Cap Value — -4.2% 3.6% 15.5%
Energy — -0.4% -2.9% 10.2% 20.5%
Large-Cap
Financials n -2.6% -5.8% -6.1% 12.1% ++ -4.2% 3.8% 16.7%
Growth
Healthcare + -0.3% -1.8% 13.1% 2.9%
Industrials n -2.2% -5.0% 3.3% 26.7% Mid-Cap n -5.0% 4.9% 25.5%
IT +++ -3.2% -5.2% -0.6% 10.2% Small-Cap n -6.5% 1.6% 26.9%
Materials n -1.3% -4.2% -0.5% 22.2%
REITs — -4.8% 8.6% 27.9%
Telecom —— -2.7% -4.4% 3.7% 19.0%
Utilities —— -0.7% -2.0% 7.0% 5.5% Total return indices in USD: Russell
Total return indices in USD: S&P 500 sector indices Regional Indicators
US Dollar Fixed Income Strategy & Performance 2011 Consensus S&P 500 EPS USD 100
Strategy* Market Returns 2011 UBS WMR S&P 500 EPS USD 100
MTD YTD 2010 2012 Consensus S&P 500 EPS USD 113
Treasuries — 0.3% 2.9% 5.9%
2012 UBS WMR S&P 500 EPS USD 108
TIPS — 0.4% 5.5% 6.3%
Agencies — 0.1% 2.1% 4.7% UBS WMR 2011 year-end S&P 500 target 1410
Inv. Grade Corporates + -0.1% 4.1% 9.5% Price to earnings+ 12.4x
High Yield Corporates + -0.7% 5.2% 15.1%
Price to book value+ 2.2x
Preferred Securities + -0.7% 4.9% 13.7%
Mortgages — 0.4% 3.2% 5.7% +Consensus 12-month forward estimates, as of 10 June 2011.
Emerging Markets n 0.6% 4.2% 12.5% Total return performance as of close of business on 9 June 2011.
Municipals n.a. 0.5% 4.8% 2.3%
Total return indices in USD: BAS / Merrill Lynch Please note these important color designations:
Indicates +/- change in most
Bond Regions Strategy & Performance + –
recent update
Strategy* Market Returns
*Please see the scale in the Appendix and the most recent Investment
MTD YTD 2010 Strategy Guide for an interpretation of the tactical deviations and an
US + 0.2% 3.2% 6.5% explanation of the corresponding benchmark allocation. **EMU = European
EMU** n 0.9% 9.0% -4.5% Monetary Union and is comprised of European countries that have adopted
UK + -0.6% 7.5% 4.6% the Euro as their currency.
Japan —— 1.7% 1.5% 17.5%
Other + n.a. n.a. n.a.
Total return indices in USD: Barclays Capital
Wealth Management Research 13 June 2011 10
11. UBS Weekly Guide
Reports of Note Published in the Last Week
Friday, 10 June Asia Pacific economics: New Zealand dollar - patience will be rewarded
Soaring global food prices and improving terms of trade have helped turn New Zealand's
trade balance into surplus, a structural shift which is likely to keep buoying the New
Zealand dollar (NZD). Healthy fiscal conditions also offer underlying support. Any
setbacks in the value of the NZD should provide buying opportunities, unless global
optimism weakens drastically.
Thursday, 9 June Global economy: ECB signals rate increase
As we have been expecting, the European Central Bank (ECB) has left its refinancing rate
unchanged. Mr. Trichet described monetary policy as accommodative and used the
terms "strong vigilance," which supports our call for a rate increase on July 7.
Wednesday, 8 June UK equities: Fair value or fantasy?
UK revenue growth expectations barely match UK inflation; analysts are cautious and
appear to follow regional macro outlooks. Likewise margins are not forecast to improve
significantly over current levels - we stress test these assumptions. Ex-financials and
materials UK equities remain good value. Commodity price forecasts matter more to the
UK market than GDP estimates.
Wednesday, 8 June Asia ex Japan currencies: High inflation drives Asian currency appreciation
Inflation in Asia is likely to remain uncomfortably high. With further advances in
commodity prices and narrowing spare capacity, inflation pressure in the region is set to
broaden. To counter-balance mounting price pressures, we expect Asian central banks to
keep up their currency appreciation. The Chinese Yuan Renminbi and Malaysian Ringgit
offer defensive investors an attractive return profile, with moderate levels of volatility. For
investors with greater tolerance for currency volatility, the Korean Won and Indonesian
Rupiah are our best picks on a total return basis.
Wednesday, 8 June UBS research focus: Inflation - The next wave takes shape
In The Decade Ahead, 6 February 2011, we concluded that US inflation will likely
accelerate during the decade. We build on this discussion by assessing inflation risk from
a global perspective. We shed light on how inflation arises and what its associated costs
and mechanisms are, as well as discuss relevant scenarios for future price developments
and derive investment recommendations from these.
Wednesday, 8 June US economics: Weak May data likely temporary
The objective of this report is to review the technical conditions of the more established,
actively traded domestic Exchange-Traded Funds (ETFs) that track an underlying index or
aim to represent a particular sector or industry. We then correlate this report with our
broader macro market and sector analyses. In this review, we provide updates on various
technical indicators including 10-week and 30-week moving averages, intermediate-term
trends and important technical support and resistance levels. We try to identify potential
trading/investment opportunities and downside risks in various key domestic markets.
The following are technical commentaries, and not necessarily Buy or Sell
recommendations. Note: All last sale prices are as of 03 June 2011.
Tuesday, 7 June Emerging Market Economics: Egypt’s Deteriorating Finances
Even though spreads on Egypt’s sovereign bonds have widened markedly, we would
advise investors to avoid buying them at this point. We expect the Egyptian pound to
come under depreciation pressure, and would avoid investing in Egyptian money market
instruments. We expect the valuation discount of Egyptian equities to widen and the
market to trade at a substantial discount to the MSCI Emerging Markets index over a
prolonged period of time.
Wealth Management Research 13 June 2011 11
12. UBS Weekly Guide
Tuesday, 7 June Valuation Report: Mind the gap
Corporate bonds generated positive total returns in May as the strong rally in Treasuries
bolstered performance of both investment grade and high yield bonds. As we have
discussed in the past, we believe that at current low yields, the directionality of credit
spreads is largely a function of interest rates, with credit spreads unlikely to tighten
further until there is a backup in rates. Accordingly, credit spreads widened a touch in
recent weeks – a move that we see driven by exceedingly low yields, rather than any
deterioration in fundamentals.
Monday, 6 June US Equities Utilities: Monthly – Macro Rotation
Utilities have powered higher, outperforming the S&P 500 by almost 300 basis points in
the last month driven by falling treasury yields and a rotation into defensive sectors. The
good returns have been driven by better sentiment, not higher earnings expectations.
However, going forward, we believe this outperformance is unsustainable as the
economic recovery proves durable and bond yields reverse their decline. We increasingly
see better value in the unregulated power generators.
Monday, 6 June Dividend Ruler Stock List: June Update
The 10-year treasury bond yield has rapidly declined to under 3.00% from 3.75% in early
February. Lower bond yields increase the relative attractiveness of dividend paying stocks.
With the S&P 500 dividend yield at 2.0%, the current 1.06% yield differential between
bonds and stocks is lower than 97% of monthly observations over the past 30 years. Our
recent US sector strategy changes—increasing allocations to Consumer Staples and
Healthcare—enhances the attractiveness of our dividend ruler stocks list. Consumer
Staples and Health Care represent over one-third of our list due to their healthy
combination of current dividend yield and historical dividend growth and consistency.
Monday, 6 June Arab countries in transition: The demographics of MENA
One of the fundamental drivers of change in societies – demographics – will continue to
make its impact felt in North Africa and the Middle East (MENA) for years to come. A
process towards greater political pluralism is under way, but will take time, and a wide
range of outcomes is likely. The prospect of reform and growth should attract investment
in the medium term, but the region faces hurdles, including structural weaknesses and
skills shortages.
To access these reports please contact your Financial Advisor or access the reports via online services.
Wealth Management Research 13 June 2011 12
13. UBS Weekly Guide
Appendix
Scale for tactical deviation charts – Performance and Strategy tables
Symbol Description/Definition
moderate overweight vs. moderate underweight vs. Neutral, i.e. on
+ – n
benchmark benchmark benchmark
++ overweight vs. benchmark –– underweight vs. benchmark n/a not applicable
strong underweight vs.
+++ strong overweight vs. benchmark –––
benchmark
The overweight and underweight recommendations represent tactical deviations that can be applied to any appropriate benchmark
portfolio allocation. They reflect WMR’s short- to medium-term assessment of market opportunities and risks in the respective asset
classes and market segments. The benchmark allocation is not specified here. Please see the most recent Investment Strategy Guide for
definitions/explanations of benchmark allocation. They should be chosen in line with the risk profile of the investor. Note that the
Regional Equity and Bond Strategy is provided on an unhedged basis (i.e., it is assumed that investors carry the underlying currency risk
of such investments). Thus, the deviations from the benchmark reflect our views of the underlying equity and bond markets in
combination with our assessment of the associated currencies.
Source: UBS WMR, All market performance data is from Bloomberg data as of date listed on top of this document, using representative
indices and is provided for information only.
Wealth Management Research 13 June 2011 13
14. UBS Weekly Guide
Disclaimer
In certain countries UBS AG is referred to as UBS SA. This publication is for our clients’ information only and is not intended as an offer, or a
solicitation of an offer, to buy or sell any investment or other specific product. It does not constitute a personal recommendation or take into
account the particular investment objectives, financial situation and needs of any specific recipient. We recommend that recipients take financial
and/or tax advice as to the implications of investing in any of the products mentioned herein. We do not provide tax advice. The analysis
contained herein is based on numerous assumptions. Different assumptions could result in materially different results. Other than disclosures
relating to UBS AG, its subsidiaries and affiliates, all information expressed in this document were obtained from sources believed to be reliable
and in good faith, but no representation or warranty, express or implied, is made as to its accuracy or completeness. All information and
opinions are current only as of the date of this report, and are subject to change without notice. This publication is not intended to be a
complete statement or summary of the securities, markets or developments referred to in the report.
Opinions may differ or be contrary to those expressed by other business areas or groups of UBS AG, its subsidiaries and affiliates. UBS Wealth
Management Research (UBS WMR) is written by Wealth Management & Swiss Bank and Wealth Management Americas. UBS Investment
Research is written by UBS Investment Bank. The research process of UBS WMR is independent of UBS Investment Research. As a consequence
research methodologies applied and assumptions made by UBS WMR and UBS Investment Research may differ, for example, in terms of
investment horizon, model assumptions, and valuation methods. Therefore investment recommendations independently provided by the two
UBS research organizations can be different.
The analyst(s) responsible for the preparation of this report may interact with trading desk personnel, sales personnel and other constituencies
for the purpose of gathering, synthesizing and interpreting market information. The compensation of the analyst(s) who prepared this report is
determined exclusively by research management and senior management (not including investment banking). Analyst compensation is not
based on investment banking revenues, however, compensation may relate to the revenues of UBS as a whole, of which investment banking,
sales and trading are a part.
At any time UBS AG, its subsidiaries and affiliates (or employees thereof) may make investment decisions that are inconsistent with the opinions
expressed in this publication, may have a long or short positions in or act as principal or agent in, the securities (or derivatives thereof) of an
issuer identified in this publication, or provide advisory or other services to the issuer or to a company connected with an issuer. Some
investments may not be readily realizable since the market in the securities is illiquid and therefore valuing the investment and identifying the
risk to which you are exposed may be difficult to quantify. UBS relies on information barriers to control the flow of information contained in one
or more areas within UBS, into other areas, units, groups or affiliates of UBS. Some investments may be subject to sudden and large falls in
value and on realization you may receive back less than you invested or may be required to pay more. Changes in foreign currency exchange
rates may have an adverse effect on the price, value or income of an investment. Past performance of an investment is not a guide to its future
performance. Additional information will be made available upon request.
All Rights Reserved. This document may not be reproduced or copies circulated without prior written authority of UBS or a subsidiary of UBS.
UBS expressly prohibits the distribution and transfer of this document to third parties for any reason. UBS will not be liable for any claims or
lawsuits from any third parties arising from the use or distribution of this document. This report is for distribution only under such circumstances
as may be permitted by applicable law. The securities described herein may not be eligible for sale in all jurisdictions or to all categories of
investors.
Australia: Distributed by UBS Wealth Management Australia Ltd (Holder of Australian Financial Services License No. 231127), Chifley Tower, 2
Chifley Square, Sydney, New South Wales, NSW 2000. Bahamas: This publication is distributed to private clients of UBS (Bahamas) Ltd and is
not intended for distribution to persons designated as a Bahamian citizen or resident under the Bahamas Exchange Control Regulations.
Canada: In Canada, this publication is distributed to clients of UBS Wealth Management Canada by UBS Investment Management Canada Inc..
Dubai: Research is issued by UBS AG Dubai Branch within the DIFC, is intended for professional clients only and is not for onward distribution
within the United Arab Emirates. France: This publication is distributed by UBS (France) S.A., French “société anonyme” with share capital of €
125.726.944, 69, boulevard Haussmann F-75008 Paris, R.C.S. Paris B 421 255 670, to its clients and prospects. UBS (France) S.A. is a provider of
investment services duly authorized according to the terms of the “Code Monétaire et Financier,” regulated by French banking and financial
authorities as the “Banque de France” and the “Autorité des Marchés Financiers.” Germany: The issuer under German Law is UBS Deutschland
AG, Stephanstrasse 14-16, 60313 Frankfurt am Main. UBS Deutschland AG is authorized and regulated by the “Bundesanstalt für
Finanzdienstleistungsaufsicht.“ Hong Kong: This publication is distributed to clients of UBS AG Hong Kong Branch by UBS AG Hong Kong
Branch, a licensed bank under the Hong Kong Banking Ordinance and a registered institution under the Securities and Futures Ordinance.
Indonesia: This research or publication is not intended and not prepared for purposes of public offering of securities under the Indonesian
Capital Market Law and its implementing regulations. Securities mentioned in this material have not been, and will not be, registered under the
Indonesian Capital Market Law and regulations. Italy: This publication is distributed to the clients of UBS (Italia) S.p.A., via del vecchio
politecnico 3 - Milano, an Italian bank duly authorized by Bank of Italy to the provision of financial services and supervised by “Consob” and
Bank of Italy. Jersey: UBS AG, Jersey Branch is regulated by the Jersey Financial Services Commission to carry on investment business and trust
company business under the Financial Services (Jersey) Law 1998 (as amended) and to carry on banking business under the Banking Business
(Jersey) Law 1991 (as amended). Luxembourg/Austria: This publication is not intended to constitute a public offer under Luxembourg/Austrian
law, but might be made available for information purposes to clients of UBS (Luxembourg) S.A./UBS (Luxembourg) S.A. Niederlassung
Österreich, a regulated bank under the supervision of the “Commission de Surveillance du Secteur Financier” (CSSF), to which this publication
has not been submitted for approval. Singapore: Please contact UBS AG Singapore branch, an exempt financial adviser under the Singapore
Financial Advisers Act (Cap. 110) and a wholesale bank licensed under the Singapore Banking Act (Cap. 19) regulated by the Monetary
Authority of Singapore, in respect of any matters arising from, or in connection with, the analysis or report. Spain: This publication is distributed
Wealth Management Research 13 June 2011 14