Reciprocal symmetry plots in Countercurrent Chromatography
•
0 j'aime•787 vues

This document provides instructions for representing chromatographic data using reciprocal symmetry (ReS) and reciprocal symmetry scaling (ReSS). It explains how to calculate partition coefficients (K) from chromatograms and plot the data in ReS or ReSS format. Guidelines are given for selecting the midline position and adjusting the x-axis to fit the data appropriately. Examples show how these techniques can be used to compare chromatographic methods and solvent systems.

Recommandé
Recommandé
Contenu connexe
En vedette
En vedette (11)
Similaire à Reciprocal symmetry plots in Countercurrent Chromatography
Similaire à Reciprocal symmetry plots in Countercurrent Chromatography (20)
Plus de Center for Natural Product Technologies
Plus de Center for Natural Product Technologies (7)
Dernier
Dernier (20)
Reciprocal symmetry plots in Countercurrent Chromatography
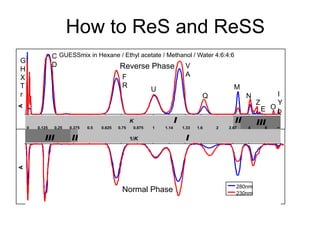
- 1. How to ReS and ReSS A 280nm 230nm A K 0 0.125 0.25 0.375 0.5 0.625 0.75 0.875 1 1.14 1.33 1.6 2 2.67 4 8 ∞ IIII II IIIII I1/K GUESSmix in Hexane / Ethyl acetate / Methanol / Water 4:6:4:6 Reverse Phase Normal Phase G H X T r C D F R U V A Q M N Z E O I Y b
- 2. Traditional Chromatogram HEMWat +2 0 0 25 50 75 100 125 150 175 200 225 250 275 300 325 350mL A 280nm 230nm 120 mL HSCCC (CCC-1000) 1 mL/min, 1,200 rpm fraction collection 3 mL/tube Elution Extrusion Method
- 3. How to represent the partition coefficient K on the chromatograph? 0 0 50 100 150 200 250 300 350mL A 0 10 20 30 40 50 60 70 80 90 100 280nm 230nm K 0 ≥ K ≤ infinity K = (VR-VM)/VS
- 4. Reciprocal Symmetry Chose a midline “M” . To the left of “M” à 0 ≥ K ≤ M To the right of “M” à M ≥ K ≤ infinity To graph it: Chose “1” as midline To the left of 1 à x = K To the right of 1 à x = 2-(1/K)
- 5. Reciprocal Symmetry Plot 0 5 10 0 0.1 0.2 0.3 0.4 0.5 0.6 0.7 0.8 0.9 1 1.1 1.2 1.3 1.4 1.5 1.6 1.7 1.8 1.9 2 X = K Kvalues x = 2- 1/K (0.25,0.25) (1.75,4) ReS Excel plot Reciprocal Symmetry K’(1) adjusted values
- 6. ReS x-axis adjusted plot Reciprocal Symmetry Plot 0 5 10 0 0.1 0.2 0.3 0.4 0.5 0.6 0.7 0.8 0.9 1 1.25 2 2.5 10 8 K Kvalues 5 Reciprocal Symmetry K axis K = 1/(2-x)
- 7. Reciprocal Symmetry Chose a midline “M” . To the left of “M” à 0 ≥ K ≤ M To the right of “M” à M ≥ K ≤ infinity To graph it: Chose “M” as midline To the left of “M” à x = K To the right of “M” à x = 2(M)-(M2/K)
- 8. ReSS Excel Plot Reciprocal Symmetry Plot 0 10 20 30 0 1 2 3 4 5 6 7 8 X = K Kvalues x = 8 – (16/K) (1,1) (7,16) Reciprocal Symmetry K’ adjusted values M = 4
- 9. ReSS x-axis adjusted plot K = 16/(8-x) Reciprocal Symmetry Plot 0 10 20 30 0 1 2 3 4 8 K Kvalues (1,1) (16,16) 5.33 8 16 Reciprocal Symmetry K axis
- 10. Chromatograms! HEMWat +2 0 0 0.25 0.5 0.75 1 1.25 1.5 1.75 2K'(1) A 280nm 230nm 0 0 0.25 0.5 0.75 1 1.33 2 4 ∞K'(1) A
- 11. ReSS HEMWat +2 0 0 0.25 0.5 0.75 1 1.25 1.5 1.75 2 2.25 2.5 2.75 3 3.25 3.5 3.75 4K'(2) A 280nm 230nm 0 0 0.5 1 1.5 2 2.67 4 8 ∞K'(2) A
- 12. HEMWat +2 0 25 50 75 100 125 150 175 200 225 250 275 300 325 350mL A 280nm 230nm 0 0.25 0.5 0.75 1 1.33 2 4 ∞K'(1) A 0 0.5 1 1.5 2 2.67 4 8 ∞K'(2) A T H X r D Y b I OZ M E N A V U F R G Q C
- 13. How to decide where to put “M”? What looks nice. HEMWat 0 -0.01 0 0.5 1 1.5 2 2.5 3 3.5 4K'(2) A 280nm 230nm HEMWat 0 0 0 0.25 0.5 0.75 1 1.25 1.5 1.75 2K'(1) A 280nm 230nm
- 14. M should represent volume midline: Same number of data points on each side of the midline 0 0 0.125 0.25 0.375 0.5 0.625 0.75 0.875 1 1.125 1.25 1.375 1.5 1.625 1.75 1.875 2 A 0 0 0.25 0.5 0.75 1 1.25 1.5 1.75 2 2.25 2.5 2.75 3 3.25 3.5 3.75 4KD A 280nm 230nm G Mix H/EtOAc/MeOH/Water 4:6:4:6 0 0 0.5 1 1.5 2 2.5 3 3.5 4 4.5 5 5.5 6K' (3) A 280nm 230nm
- 15. How to ReS/ReSS What you need: • UV-vis trace for EECCC chromatogram • Time trace for EECCC chromatogram • Mobile phase volumeà VM = void volume • The total time of run à Vrun • Column Volume à VM
- 16. • Equations: • K = (VR-VM)/(VC-VM) before Vee • K = Vcm/(Vcm+VC-VR) after Vee • ReS x = K’(1) 1 = midline x = K for 0 < K < 1 x = 2-(1/K) for 1 < K < infinity • ReSS x = K’(2) 2 = midline x = K for 0 < K < 2 x = 4-(4/K) for 2 < K < infinity • ReSS x = K’(<M) M = any number as a midline x = K for 0 < K < M x = 2M-(M2/K) for M < K < infinity
- 17. • Excel Sheet set up: • A – “Elapsed time” in 20 second intervals A2 = date • B – 280nm • C – 230nm • D – mL & min • E – tube (3 mL/tube) • F – VM F2 • Vcm F4 [F8-F10] • Vee F6 [F8-F10+F2] • ` Vrun F8 • VC F10 • G – K Vm < K < Vee [ROUND((D___-F$2)/(F$10-F$2),4)] Vee < K < Vrun [ROUND(F$4/((F$4+F$10)-D___),4)] • H – K’(1) 0 < K < 1 [ROUND((D___-F$2)/(F$10-F$2),4)] 1 < K < infinity [ROUND(2-1/G____,4)] • I – K’(2) 0 < K < 2 [ROUND((D____-F$2)/(F$10-F$2),4)] 2 < K < infinity [ROUND(4-4/G____,4)]
- 18. Notes With this set-up you can fool around with VM and Vrun to fit the chromatogram nicely into the plot. • Columns G, H, and I require you to manually put the two different equations in for the proper intervals. • Put K values into the plot, for x > midline, once you have it in powerpoint.
- 19. Applications Instrument comparison Solvent system family mapping Experiment time and separation Reversed-phase / normal phase plot Fractogram ReSS plot
- 20. GUESSmix in hexane / ethyl acetate / methanol / water 4:6:4:6 0 0.25 0.5 0.75 1 1.25 1.5 1.75 2 2.29 2.67 3.2 4 5.33 8 16 ¥K'(2) A 0 0.25 0.5 0.75 1 1.25 1.5 1.75 2 2.29 2.67 3.2 4 5.33 8 16 ¥K'(2) A 280nm 230nm J-type centrifuge 120 mL Fast Centrifugal Partition Chromatography (FCPC) 200 mL 220 mg 440 mg G H X T r C D F R U V A Q M N Z E O I Y b
- 21. HEMWat +3 VCM = 313 mL 0 0.25 0.5 0.75 1 1.25 1.5 1.75 2 2.29 2.67 3.2 4 5.33 8 16 ∞ KD A 280nm 230nm I II III r C F U V M Q N Z E O b HEMWat +3 VCM = 254.5 mL 0 0.25 0.5 0.75 1 1.25 1.5 1.75 2 2.29 2.67 3.2 4 5.33 8 16 ∞KD A HEMWat +3 VCM = 228 mL 0 0.25 0.5 0.75 1 1.25 1.5 1.75 2 2.29 2.67 3.2 4 5.33 8 16 ∞ KD A HEMWat +3 VCM = 162 mL 0 0.25 0.5 0.75 1 1.25 1.5 1.75 2 2.29 2.67 3.2 4 5.33 8 16 ∞KD A I II III I II III I II III a b c d MS
- 22. GUESSmix in hexane /ethyl acetate / methanol / water 4:6:4:6 0 25 50 75 100 125 150 175 200 225 250 275 300 325 350 375 400 425 mL A 280nm 230nm r C F U V M Q N Z E O b I II III run time = 7.2 hours 0 25 50 75 100 125 150 175 200 225 250 275 300 325 350 375 400 425 mL A I II III run time = 6.3 hours Experiment time and separation behavior
- 23. 0 25 50 75 100 125 150 175 200 225 250 275 300 325 350 375 400 425 mL A I II III run time = 4.8 hours 0 25 50 75 100 125 150 175 200 225 250 275 300 325 350 375 400 425 mL A I II III run time = 5.8 hours Experiment time and separation behavior
- 24. A 280nm 230nm A K 0 0.125 0.25 0.375 0.5 0.625 0.75 0.875 1 1.14 1.33 1.6 2 2.67 4 8 ∞ IIII II IIIII I1/K Reversed Phase Normal Phase G H X T r C D F R U V A Q M N Z E O I Y b
- 25. KD intervals 0 ≤ KD < 0.0625 0.0625 ≤ KD < 0.125 0.125 ≤ KD < 0.25 0.25 ≤ KD < 0.5 0.5 ≤ KD < 1 1 ≤ KD < 2 2 ≤ KD < 4 4 ≤ KD < 8 8 ≤ KD < 16 16 ≤ KD < 32 32 ≤ KD < ∞ HEMWat 0 rXHTG DR CF QUA V N ME Z O I Yb DEMWat 0 rXHT G D C FUV A RQ ZMN E OI Yb GUESS Mix in DEMWat 5:5:5:5 0 0.25 0.5 0.75 1 1.33 2 4 ∞K'(1) A HEMWat 0 0 0.25 0.5 0.75 1 1.33 2 4 ∞K'(1) A 280nm 230nm O I Yb Z E M NA VU F DRX H T G r C Q I X H T r G D C F U V A R Q ZMNE OIYb
- 26. Alpinia combined fraction in hexane / tert-butylmethylether / methanol / water 5:5:5:5 0 0.25 0.5 0.75 1 1.33 2 4 ¥K'(1) A Alpinia DCM extract in hexane / ethyl acetate / methanol / water 5:5:5:5 0 0.25 0.5 0.75 1 1.33 2 4 ¥K'(1) A 0 5 10 15 mg 280nm 230nm mg OH O OO HO OO O OH O O OH O
- 27. 0 0.5 1 1.5 2 2.5 3 3.5 4 4.57 5.33 6.4 8 10.67 16 32 ¥ Oplopanax crude extract in hexane / DCM / methanol / water 7:3:7:3 hexane / ethyl acetate 8:2 hexane / ethyl acetate 7:3 ReS 40 60 80 100 120 140 0 0.25 0.5 0.75 1.33 2 4 ¥K'(1) 40 60 80 100 120 140 0 0.5 1 1.5 2.67 4 8 ¥K'(2) 40 60 80 100 120 140 0 0.5 1 1.5 2 2.5 3.6 4.5 6 9 18 ¥K'(3) 40 60 80 100 120 140 0 1 2 3 5.33 8 16 ¥K'(4) tube tube tubetube ReSS
- 28. References Reciprocal Symmetry Plots as a New Representation of Countercurrent Chromatograms. G.F. Pauli, J.B. Friesen US 8175817 B2 awarded 05/08/2012. http://www.google.com/patents/US8175817 Friesen, J. B.; Pauli, G. F., Reciprocal symmetry plots as a representation of countercurrent chromatograms. Analytical Chemistry 2007, 79, 2320-2324 Friesen, J. B.; Pauli, G. F., Rational development of solvent system families in counter-current chromatography. Journal of Chromatography A 2007, 1151, 51-59. Friesen, J. B.; Pauli, G. F., Performance characteristics of countercurrent separation in analysis of natural products of agricultural significance. Journal of Agricultural and Food Chemistry 2008, 56, 19-28. Friesen, J. B.; Pauli, G. F., GUESSmix-guided optimization of elution-extrusion counter-current separations. Journal of Chromatography A 2009, 1216, 4225-4231.