SlideShare une entreprise Scribd logo
1  sur  10
COMPLEXOMETRIC TITRATION
Complexometry is the type of volumetric analysis involving the
formation of complexes which are slightly ionized in solution, like
weak electrolyte and sparingly soluble salt.
 Here metal ion solutions are titrated against solutions of polydentate
ligands.
PRINCIPLE:
 EDTA is the most commonly used polydentate ligand
 EDTA  Ethylenediaminetetraacetic acid
 Its salt is preferred because of its adequate solubility in aqueous solutions.
 EDTA forms stable, water-soluble, 1:1 complexes with most of the
polyvalent metal ions.
 It has 6 donoratoms  two nitrogen and four oxygen atoms of the
four carboxylic groups
 The complex ion has a cage-like structure in which the metal ion iis
so well surrounded by the donorgroups that it remains almost
completely isolated from the solvent molecules
 As a result the complex ion is highly stable.
 EDTA is a tetraprotic acid , denoted as H4Y
 The dissociation constants for the COOHgroups:
1. K1=1.0*10-2
2. K2=2.15*10-3
3. K3=6.2*10-7
4. K4=5.5*10-11
 From these dissociation constants,, it can be easily shown that at
pH>12, most of the EDTA exists as the tetra anion, Y4-
 Around pH 8  predominant species is HY3-
 Around pH 5  predominant species is H2Y2-
 Titration between Mn+ and EDTA:
Mn+ + H2Y2-  MY(n-4)+ + 2H+
Mn+ + HY3-  MY(n-4)+ + H+
 The protons liberated in these reactions would considerably alter the
pH of the solution and would thus cause the back reaction, i.e., the
dissociation of the metal-EDTA complex.
 This is prevented by adding an excess of an innocuous buffer to the
titration system.
INDICATORS FOR EDTATITRATIONS:
 Several organic dyes are used as indicators for EDTA titrations which
forms complexes with metal ions which are intensely coloured.
 The most widely used indicator is Eriochrome Black T.
 EDTA is denoted by, H3In
 Indicator exhibit different colours in various pH ranges.
 At pH less than 6  H2In- (red)
 At pH 7 or above  HIn2- (blue)
 More alkaline  In3- (orange)
EDTA titration:
During an EDTA titration two complexes are formed
i) Metal-EDTA complex
ii) Metal ion-indicator complex
 Suitable amount of indicator is added to the solution of Metal ions in the
titration flask.
 The two species react together to form a metal ion-indicator complex.
 If metal ion is bivalent M2+ , the complex formed in aqueous solution
would be MIn- (red).
 A buffer solution of appropriate pH is added to the titration flask.
 Standard solution of sodium salt of EDTA in the burette is added to
metal ion-indicator complex to form metal-EDTA complex.
 Because, Metal ion –indicator complex is less stable than the metal-
EDTA complex.
 Thus a change in colour from red to blue marks the approach of end
point.
 EDTA combines with metal ions in the ratio of 1:1
 Irrespective of their valencies to form almost exactly the same type of
complexes.
 The stability of EDTA complexes depends considerably on pH and
 It makes the EDTA titrations adequately selective.
 Eg: Around pH-1 divalent ions doesn’tform complexes with EDTA, but
only the trivalent ions do.
 Cd2+, Zn2+ forms more complex than Mg2+.
 In pH-7 EBT doesn’tform complex with Mg2+ thus the former cations
forms complexes easily with EDTA.
MASKING OF IONS:
 Selectivity is provided by the masking of interfering cations.
 Eg: Mg2+ and Ca2+ can be titrated in the presence of interfering ions such
as Co2+, Cu2+, Ni2+ and Pd by adding cyanide ions to the reaction mixture
as the MaskingAgent.
 The later ions forms stable cyanide complexes such as [M(CN)4]2-
 Demasking agent:reagent released the metal ion from a masking
reagent.
TYPES OF TITRATIONS:
 Direct titration
 Back titration
 Displacement method
BACK TITRATION DIRECT TITRATION
APPLICATIONS:
 Complexometric titration is widely used in the medical industry
because of the micro litre size sample involved. The method is
efficient in research related to the biological cell.
 Ability to titrate the amount of ions available in a living cell.
 Ability to introduce ions into a cell in case of deficiencies.
 Complexometric titration involves the treatment of complex ions
such as magnesium, calcium, copper, iron, nickel, lead and zinc
with EDTA as the complexing agent.
 Complexometric titration is an efficient method for determining
the level of hardness of water.
COLORIMETRY AND SPECTROPHOTOMETRY
Both the techniques are falls under the broad classification of photometry
which involves in the measurement of absorption and emission of the
radiation.
RANGE:
Colorimetry : visible range (4000-8000A)
Spectrophotometry: UV visible range (2000-8000A)
PRINCIPLE:
 It is based on Beer-lambert’slaw.
 It states that the amount of light absorbed by a color solution is
directly proportional to concentration of the solution and length
of a light path through the solution.
Where,
A = absorbance/optical density of solution
C = concentration of solution
Log I0/It = A = εcl
l = path length ε = absorption coefficient
BEER’S LAW:
This law states that the amount of light absorbed is directly
proportional to the concentration of the solute in the solution.
Log I0/It = kc
Where,
K = absorption coefficient
C = concentration of the solution
I0 = intensity of incident light
It = intensity of transmitted light
LAMBERT’S LAW:
This law states that the amount of light absorbed is directly
proportional to the length and thickness of the solution under analysis.
Log I0/It = kt
Where,
t = thickness/length of the absorbing medium (solution)
APPLICATIONS
 Detection of concentration of substances.
 Detection of impurities.
 Structure elucidation of organic compounds.
 Monitoring dissolved oxygen content in freshwater and marine
ecosystems.
 Characterization of proteins.
 Detection of functional groups.
 Molecular weight determination of compounds.
 Determination of pk value of an indicator
 Determination of molar composition of complexes
 Determination of instability constants
QUANTITATIVE ANALYSIS:
 In order to prepare calibration curves, a series of solution, each with the
known concentration, are prepared.
 The colorimeter or spectrophotometeris set at that wavelength where the
absorption is maximum.
 After this these absorbanceof each solution is measured and then plotted
against be concentration of the solution to get a calibration curve.
 If absorbanceis measured at a wavelength as used for the calibration
curve of an unknown solution, then concentration of the unknown
solution can be measured from the calibration curve by seeing the value
of concentration against the absorbanceof the solution.
 Colorimetric analysis is generally used whenever the sample is coloured.
Eg: dichromate, permanganate, cupricion and ferric ion.
STRUCTURE OF INORGANIC COMPOUNDS:
 Absorption spectralstudies have revealed that deep blue colour of
ferric thiocyanate is due to the presence of FeCNS2+ ions.
STRUCTURE OFF INORGANIC COMPLEXES:
 Spectrophotometryhas been used to distinguish between cis and
trans isomers of a complex.
 Equilibrium between the octahedral, tetrahedral, squareplanar, and
the five coordinate configurations have been studied by absorption
spectroscopy.
 The geometrical isomers of transition complexes can be easily
distinguished from their visible spectra.
 Eg: cis isomer of [Co(en)2F2]NO3 is violet whereas the trans isomer
is green
DETERMINATION OF MOLECULAR WEIGHT:
 When a compound reacts with a reagent to form a derivative
having a characteristic absorptionin another wavelength region,
the molar absorptivity ε of the derivative is almost the same as that
of a reagent.
 For example, amine picrates  max absorption= 380nm having
ε = 13,400 which is same as that of picric acid.
 Thus, one can determine the molecular weight of given amine
picrate by dissolving its known amount in a known volume of
solvent and then its absorbanceis measured at 380nm.
 Then on applying BEER’S LAW, we get
A = act where, a = absorptivity ; c = concentration
 Molecular weight can be calculated by applying the following
relation:
A DOUBLE BEAM UV-VISIBLE ABSORPTION SPECTROMETER
INSTRUMENTATION
If you pass white light through a coloured substance, some of the light gets absorbed.
A solution containing hydrated copper(II) ions, for example, looks pale blue because the
solution absorbs light from the red end of the spectrum. The remaining wavelengths in the
light combine in the eye and brain to give the appearance of cyan (pale blue).
ε = a × molecular weight
 Some colourless substances also absorb light - but in the ultra-violet region.
Since we can't see UV light, we don't notice this absorption.
 Different substances absorb different wavelengths of light, and this can be
used to help to identify the substance - the presence of particular metal ions,
for example, or of particular functional groups in organic compounds.
 The amount of absorption is also dependent on the concentration of the
substance if it is in solution. Measurement of the amount of absorption can be
used to find concentrations of very dilute solutions.
 An absorption spectrometer measures the way that the light absorbed by a
compound varies across the UV and visible spectrum.
A simple double beam spectrometer
The light source
 A light source which gives the entire visible spectrum plus the near ultra-violet
covering the range from about 200 nm to about 800 nm. (This extends slightly into
the near infra-red as well.)
 A combination of two lamp is used - a deuterium lamp for the UV part of the
spectrum, and a tungsten / halogen lamp for the visible part.
 The combined output of these two bulbs is focussed on to a diffraction grating.
The diffraction grating and the slit
 A prism splits light into its component colours. A diffraction grating does the same job,
The arrows show the way the various wavelengths of the light are sent off in different
directions. The slit only allows light of a very narrow range of wavelengths through into the
rest of the spectrometer. By gradually rotating the diffraction grating, you can allow light
from the whole spectrum (a tiny part of the range at a time) through into the rest of the
instrument.
The rotating discs:
Each disc is made up of a number of different segments.
The light coming from the diffraction grating and slit will hit the rotating disc and one of
three things can happen.
 If it hits the transparent section, it will go straight through and pass through the
cell containing the sample. It is then bounced by a mirror onto a second
rotating disc. This disc is rotating such that when the light arrives from the first
disc, it meets the mirrored section of the second disc. That bounces it onto the
detector.
 It is following the red path in the diagram:

 If the original beam of light from the slit hits the mirrored section of the first
rotating disc, it is bounced down along the green path. After the mirror, it
but more efficiently.
passes through a reference cell (more about that later). Finally the light gets to
the second disc which is rotating in such a way that it meets the transparent
section. It goes straight through to the detector.
1. If the light meets the first disc at the black section, it is blocked - and for a very short
while no light passes through the spectrometer. This just allows the computer to make
allowance for any current generated by the detector in the absence of any light.
The sample and reference cells:
 These are small rectangular glass or quartz containers. They are often designed so that
the light beam travels a distance of 1 cm through the contents.
 The sample cell contains a solution of the substance you are testing - usually very
dilute. The solvent is chosen so that it doesn't absorb any significant amount of light
in the wavelength range we are interested in (200 - 800 nm).
 The reference cell just contains the pure solvent.
The detector and computer
 The detector converts the incoming light into a current. The higher the current, then
greater is the intensity of the light.
 For each wavelength of light passing through the spectrometer, the intensity of the
light passing through the reference cell is measured. This is usually referred to as Io -
that's I for Intensity.
 The intensity of the light passing through the sample cell is also measured for that
wavelength - given the symbol, I.
 If I is less than Io, then obviously the sample has absorbed some of the light. A simple
bit of maths is then done in the computer to convert this into something called
the absorbance of the sample - given the symbol, A.
 For reasons which will become clearer when we do a bit of theory on another page,
the relationship between A and the two intensities is given by:
 On most of the diagrams you will come across, the absorbance ranges from 0 to 1, but
it can go higher than that.
 An absorbance of 0 at some wavelength means that no light of that particular
wavelength has been absorbed. The intensities of the sample and reference beam are
both the same, so the ratio Io/I is 1. Log10 of 1 is zero.
 An absorbance of 1 happens when 90% of the light at that wavelength has been
absorbed - which means that the intensity is 10% of what it would otherwise be.
 In that case, Io/I is 100/I0 (=10) and log10 of 10 is 1.
The chart recorder
Chart recorders usually plot absorbance against wavelength. The output might look like this:
This particular substance has what are known as absorbance peaks at 255 and 395 nm. How
these arise and how they are interpreted are discussed on another page.

Contenu connexe

Tendances

PA-I Complexometric titration.(HRB)
PA-I Complexometric titration.(HRB)PA-I Complexometric titration.(HRB)
PA-I Complexometric titration.(HRB)Harshadaa bafna
 
Precipitation titrations
Precipitation titrationsPrecipitation titrations
Precipitation titrationsSuresh Selvaraj
 
Precepitation titration mohrs method
Precepitation titration mohrs methodPrecepitation titration mohrs method
Precepitation titration mohrs methodHemn Gardy
 
Iodimetry & iodometry
Iodimetry & iodometryIodimetry & iodometry
Iodimetry & iodometryRenjithaJR1
 
Types of complexometric titration
Types of complexometric titrationTypes of complexometric titration
Types of complexometric titrationRenjithaJR1
 
Complexometric Titration
Complexometric TitrationComplexometric Titration
Complexometric TitrationRabia Aziz
 
Complexometric titration-ppt
Complexometric titration-pptComplexometric titration-ppt
Complexometric titration-pptwadhava gurumeet
 
Theories of acid base indicators
Theories of acid base indicatorsTheories of acid base indicators
Theories of acid base indicatorsSapan Shah
 
Complexometric titration.pptx
Complexometric titration.pptxComplexometric titration.pptx
Complexometric titration.pptxSKarthigaSVCP
 
Gravimetric Analysis
Gravimetric AnalysisGravimetric Analysis
Gravimetric AnalysisAyush Koul
 
Diazotization TITRATION FOR PG NOTES VERY USEFUL
Diazotization TITRATION FOR  PG NOTES VERY USEFUL Diazotization TITRATION FOR  PG NOTES VERY USEFUL
Diazotization TITRATION FOR PG NOTES VERY USEFUL prakash64742
 
Theory of Indicators/choice of indicator/acid base indicator
Theory of Indicators/choice of indicator/acid base indicatorTheory of Indicators/choice of indicator/acid base indicator
Theory of Indicators/choice of indicator/acid base indicatorrangusha75
 
Redox titration.pptx
Redox titration.pptxRedox titration.pptx
Redox titration.pptxpooja shinde
 

Tendances (20)

PA-I Complexometric titration.(HRB)
PA-I Complexometric titration.(HRB)PA-I Complexometric titration.(HRB)
PA-I Complexometric titration.(HRB)
 
Complexometric titration
Complexometric titrationComplexometric titration
Complexometric titration
 
Precipitation titrations
Precipitation titrationsPrecipitation titrations
Precipitation titrations
 
Precepitation titration mohrs method
Precepitation titration mohrs methodPrecepitation titration mohrs method
Precepitation titration mohrs method
 
Acid base indicator
Acid base indicatorAcid base indicator
Acid base indicator
 
Redox titration
Redox titrationRedox titration
Redox titration
 
Iodimetry & iodometry
Iodimetry & iodometryIodimetry & iodometry
Iodimetry & iodometry
 
Types of complexometric titration
Types of complexometric titrationTypes of complexometric titration
Types of complexometric titration
 
Complexometric Titration
Complexometric TitrationComplexometric Titration
Complexometric Titration
 
Complexometric titration-ppt
Complexometric titration-pptComplexometric titration-ppt
Complexometric titration-ppt
 
Theories of acid base indicators
Theories of acid base indicatorsTheories of acid base indicators
Theories of acid base indicators
 
Complexometric titration.pptx
Complexometric titration.pptxComplexometric titration.pptx
Complexometric titration.pptx
 
Iodometry & Iodimetry
Iodometry & IodimetryIodometry & Iodimetry
Iodometry & Iodimetry
 
PA- I Gravemetry.(HRB)
PA- I Gravemetry.(HRB) PA- I Gravemetry.(HRB)
PA- I Gravemetry.(HRB)
 
Gravimetric Analysis
Gravimetric AnalysisGravimetric Analysis
Gravimetric Analysis
 
Diazotization TITRATION FOR PG NOTES VERY USEFUL
Diazotization TITRATION FOR  PG NOTES VERY USEFUL Diazotization TITRATION FOR  PG NOTES VERY USEFUL
Diazotization TITRATION FOR PG NOTES VERY USEFUL
 
Theory of Indicators/choice of indicator/acid base indicator
Theory of Indicators/choice of indicator/acid base indicatorTheory of Indicators/choice of indicator/acid base indicator
Theory of Indicators/choice of indicator/acid base indicator
 
Redox titration.pptx
Redox titration.pptxRedox titration.pptx
Redox titration.pptx
 
Precipitation titration
Precipitation titrationPrecipitation titration
Precipitation titration
 
Titrimetric analysis
Titrimetric analysisTitrimetric analysis
Titrimetric analysis
 

Similaire à complexometric titration , colorimetry and spectrophotometry

synthesis and characterization of hydrazone ligand and their metal complexes
synthesis and characterization of hydrazone ligand and their metal complexessynthesis and characterization of hydrazone ligand and their metal complexes
synthesis and characterization of hydrazone ligand and their metal complexesMUBASHIRA M
 
Applications of Edta Titration - Kshetra K L
Applications of Edta Titration - Kshetra K LApplications of Edta Titration - Kshetra K L
Applications of Edta Titration - Kshetra K LBebeto G
 
COMPLEXOMETRIC TITRATION.pptx
COMPLEXOMETRIC TITRATION.pptxCOMPLEXOMETRIC TITRATION.pptx
COMPLEXOMETRIC TITRATION.pptxShoaibAhmedAnsari
 
Jobs and mole-ratio method.pdf
Jobs and mole-ratio method.pdfJobs and mole-ratio method.pdf
Jobs and mole-ratio method.pdftanveercdr
 
7.complexometric titrations
7.complexometric titrations7.complexometric titrations
7.complexometric titrationsNikithaGopalpet
 
Fac/Mer Isomerism in Fe(II) Complexes
Fac/Mer Isomerism in Fe(II) ComplexesFac/Mer Isomerism in Fe(II) Complexes
Fac/Mer Isomerism in Fe(II) ComplexesRafia Aslam
 
CHEMISTRY INTERNAL ASSESMENT| CHEM IA
CHEMISTRY INTERNAL ASSESMENT| CHEM IA CHEMISTRY INTERNAL ASSESMENT| CHEM IA
CHEMISTRY INTERNAL ASSESMENT| CHEM IA ZainAhmed119
 
Application of complexometric, aquametric & amperometric titrations
Application of complexometric, aquametric & amperometric titrationsApplication of complexometric, aquametric & amperometric titrations
Application of complexometric, aquametric & amperometric titrationsKamruzzaman Siam
 
Mass Spectrometry Ionization Techniques
Mass Spectrometry Ionization TechniquesMass Spectrometry Ionization Techniques
Mass Spectrometry Ionization TechniquesReyaz007
 
Absorption and emission spectroscopy
Absorption and emission spectroscopyAbsorption and emission spectroscopy
Absorption and emission spectroscopyushaSanmugaraj
 
Flame emission spectroscopy
Flame emission spectroscopyFlame emission spectroscopy
Flame emission spectroscopymohamed abusalih
 
Structure elucidation of steroids
Structure elucidation of steroidsStructure elucidation of steroids
Structure elucidation of steroidsSidratal Muntaha
 
complexometric titration for b.pharm students
complexometric titration for b.pharm studentscomplexometric titration for b.pharm students
complexometric titration for b.pharm studentsLaxmidharSahoo11
 
Synthesiscoordinationcompounds
SynthesiscoordinationcompoundsSynthesiscoordinationcompounds
SynthesiscoordinationcompoundsLuisEduardo621
 
End point detection in complexometric titration
End point detection in complexometric titrationEnd point detection in complexometric titration
End point detection in complexometric titrationRenjithaJR1
 

Similaire à complexometric titration , colorimetry and spectrophotometry (20)

synthesis and characterization of hydrazone ligand and their metal complexes
synthesis and characterization of hydrazone ligand and their metal complexessynthesis and characterization of hydrazone ligand and their metal complexes
synthesis and characterization of hydrazone ligand and their metal complexes
 
Applications of Edta Titration - Kshetra K L
Applications of Edta Titration - Kshetra K LApplications of Edta Titration - Kshetra K L
Applications of Edta Titration - Kshetra K L
 
COMPLEXOMETRIC TITRATION.pptx
COMPLEXOMETRIC TITRATION.pptxCOMPLEXOMETRIC TITRATION.pptx
COMPLEXOMETRIC TITRATION.pptx
 
Jobs and mole-ratio method.pdf
Jobs and mole-ratio method.pdfJobs and mole-ratio method.pdf
Jobs and mole-ratio method.pdf
 
7.complexometric titrations
7.complexometric titrations7.complexometric titrations
7.complexometric titrations
 
Fac/Mer Isomerism in Fe(II) Complexes
Fac/Mer Isomerism in Fe(II) ComplexesFac/Mer Isomerism in Fe(II) Complexes
Fac/Mer Isomerism in Fe(II) Complexes
 
Complexometric Titration1.pdf
Complexometric Titration1.pdfComplexometric Titration1.pdf
Complexometric Titration1.pdf
 
UV visible Spectroscopy
UV visible SpectroscopyUV visible Spectroscopy
UV visible Spectroscopy
 
CHEMISTRY INTERNAL ASSESMENT| CHEM IA
CHEMISTRY INTERNAL ASSESMENT| CHEM IA CHEMISTRY INTERNAL ASSESMENT| CHEM IA
CHEMISTRY INTERNAL ASSESMENT| CHEM IA
 
Uv absorption spectroscopy
Uv absorption spectroscopyUv absorption spectroscopy
Uv absorption spectroscopy
 
Application of complexometric, aquametric & amperometric titrations
Application of complexometric, aquametric & amperometric titrationsApplication of complexometric, aquametric & amperometric titrations
Application of complexometric, aquametric & amperometric titrations
 
Mass Spectrometry Ionization Techniques
Mass Spectrometry Ionization TechniquesMass Spectrometry Ionization Techniques
Mass Spectrometry Ionization Techniques
 
Absorption and emission spectroscopy
Absorption and emission spectroscopyAbsorption and emission spectroscopy
Absorption and emission spectroscopy
 
Flame emission spectroscopy
Flame emission spectroscopyFlame emission spectroscopy
Flame emission spectroscopy
 
Ir spectroscopy ii
Ir spectroscopy  iiIr spectroscopy  ii
Ir spectroscopy ii
 
Structure elucidation of steroids
Structure elucidation of steroidsStructure elucidation of steroids
Structure elucidation of steroids
 
complexometric titration for b.pharm students
complexometric titration for b.pharm studentscomplexometric titration for b.pharm students
complexometric titration for b.pharm students
 
Synthesiscoordinationcompounds
SynthesiscoordinationcompoundsSynthesiscoordinationcompounds
Synthesiscoordinationcompounds
 
Complexation titration (1) (1)
Complexation titration (1) (1)Complexation titration (1) (1)
Complexation titration (1) (1)
 
End point detection in complexometric titration
End point detection in complexometric titrationEnd point detection in complexometric titration
End point detection in complexometric titration
 

Plus de ushaSanmugaraj

Lanthanide oxidation..
Lanthanide oxidation..Lanthanide oxidation..
Lanthanide oxidation..ushaSanmugaraj
 
Lanthanide contraction
Lanthanide contractionLanthanide contraction
Lanthanide contractionushaSanmugaraj
 
Flame spray syntheis.....
Flame spray syntheis.....Flame spray syntheis.....
Flame spray syntheis.....ushaSanmugaraj
 
Favorskki and benzillic acid rearrangement
Favorskki  and benzillic acid rearrangementFavorskki  and benzillic acid rearrangement
Favorskki and benzillic acid rearrangementushaSanmugaraj
 
Coodination chemistry
Coodination chemistry Coodination chemistry
Coodination chemistry ushaSanmugaraj
 
UV visible spectroscopy ( electronic spectroscopy)
UV visible spectroscopy ( electronic spectroscopy)UV visible spectroscopy ( electronic spectroscopy)
UV visible spectroscopy ( electronic spectroscopy)ushaSanmugaraj
 
favorskki rearrangement, Benzil benzilic acid rearrangement
favorskki rearrangement, Benzil benzilic acid rearrangementfavorskki rearrangement, Benzil benzilic acid rearrangement
favorskki rearrangement, Benzil benzilic acid rearrangementushaSanmugaraj
 
Nephelometry and turbidimetry
Nephelometry and turbidimetryNephelometry and turbidimetry
Nephelometry and turbidimetryushaSanmugaraj
 
Differential scanning calorimetry
Differential scanning calorimetryDifferential scanning calorimetry
Differential scanning calorimetryushaSanmugaraj
 
Chromatography( HPLC, ion exchange chromatography, Gas chromatography)
Chromatography( HPLC, ion exchange chromatography, Gas chromatography)Chromatography( HPLC, ion exchange chromatography, Gas chromatography)
Chromatography( HPLC, ion exchange chromatography, Gas chromatography)ushaSanmugaraj
 

Plus de ushaSanmugaraj (14)

Lanthanide oxidation..
Lanthanide oxidation..Lanthanide oxidation..
Lanthanide oxidation..
 
Lanthanide contraction
Lanthanide contractionLanthanide contraction
Lanthanide contraction
 
Html
Html Html
Html
 
Flame spray syntheis.....
Flame spray syntheis.....Flame spray syntheis.....
Flame spray syntheis.....
 
Favorskki and benzillic acid rearrangement
Favorskki  and benzillic acid rearrangementFavorskki  and benzillic acid rearrangement
Favorskki and benzillic acid rearrangement
 
Platon
PlatonPlaton
Platon
 
Coodination chemistry
Coodination chemistry Coodination chemistry
Coodination chemistry
 
UV visible spectroscopy ( electronic spectroscopy)
UV visible spectroscopy ( electronic spectroscopy)UV visible spectroscopy ( electronic spectroscopy)
UV visible spectroscopy ( electronic spectroscopy)
 
favorskki rearrangement, Benzil benzilic acid rearrangement
favorskki rearrangement, Benzil benzilic acid rearrangementfavorskki rearrangement, Benzil benzilic acid rearrangement
favorskki rearrangement, Benzil benzilic acid rearrangement
 
Silver nanoparticles
Silver nanoparticles Silver nanoparticles
Silver nanoparticles
 
Nephelometry and turbidimetry
Nephelometry and turbidimetryNephelometry and turbidimetry
Nephelometry and turbidimetry
 
Fluorimetry
FluorimetryFluorimetry
Fluorimetry
 
Differential scanning calorimetry
Differential scanning calorimetryDifferential scanning calorimetry
Differential scanning calorimetry
 
Chromatography( HPLC, ion exchange chromatography, Gas chromatography)
Chromatography( HPLC, ion exchange chromatography, Gas chromatography)Chromatography( HPLC, ion exchange chromatography, Gas chromatography)
Chromatography( HPLC, ion exchange chromatography, Gas chromatography)
 

Dernier

Green chemistry and Sustainable development.pptx
Green chemistry  and Sustainable development.pptxGreen chemistry  and Sustainable development.pptx
Green chemistry and Sustainable development.pptxRajatChauhan518211
 
Discovery of an Accretion Streamer and a Slow Wide-angle Outflow around FUOri...
Discovery of an Accretion Streamer and a Slow Wide-angle Outflow around FUOri...Discovery of an Accretion Streamer and a Slow Wide-angle Outflow around FUOri...
Discovery of an Accretion Streamer and a Slow Wide-angle Outflow around FUOri...Sérgio Sacani
 
Animal Communication- Auditory and Visual.pptx
Animal Communication- Auditory and Visual.pptxAnimal Communication- Auditory and Visual.pptx
Animal Communication- Auditory and Visual.pptxUmerFayaz5
 
GBSN - Biochemistry (Unit 1)
GBSN - Biochemistry (Unit 1)GBSN - Biochemistry (Unit 1)
GBSN - Biochemistry (Unit 1)Areesha Ahmad
 
Botany 4th semester series (krishna).pdf
Botany 4th semester series (krishna).pdfBotany 4th semester series (krishna).pdf
Botany 4th semester series (krishna).pdfSumit Kumar yadav
 
9654467111 Call Girls In Raj Nagar Delhi Short 1500 Night 6000
9654467111 Call Girls In Raj Nagar Delhi Short 1500 Night 60009654467111 Call Girls In Raj Nagar Delhi Short 1500 Night 6000
9654467111 Call Girls In Raj Nagar Delhi Short 1500 Night 6000Sapana Sha
 
Raman spectroscopy.pptx M Pharm, M Sc, Advanced Spectral Analysis
Raman spectroscopy.pptx M Pharm, M Sc, Advanced Spectral AnalysisRaman spectroscopy.pptx M Pharm, M Sc, Advanced Spectral Analysis
Raman spectroscopy.pptx M Pharm, M Sc, Advanced Spectral AnalysisDiwakar Mishra
 
Natural Polymer Based Nanomaterials
Natural Polymer Based NanomaterialsNatural Polymer Based Nanomaterials
Natural Polymer Based NanomaterialsAArockiyaNisha
 
Unlocking the Potential: Deep dive into ocean of Ceramic Magnets.pptx
Unlocking  the Potential: Deep dive into ocean of Ceramic Magnets.pptxUnlocking  the Potential: Deep dive into ocean of Ceramic Magnets.pptx
Unlocking the Potential: Deep dive into ocean of Ceramic Magnets.pptxanandsmhk
 
GBSN - Microbiology (Unit 1)
GBSN - Microbiology (Unit 1)GBSN - Microbiology (Unit 1)
GBSN - Microbiology (Unit 1)Areesha Ahmad
 
Pests of cotton_Borer_Pests_Binomics_Dr.UPR.pdf
Pests of cotton_Borer_Pests_Binomics_Dr.UPR.pdfPests of cotton_Borer_Pests_Binomics_Dr.UPR.pdf
Pests of cotton_Borer_Pests_Binomics_Dr.UPR.pdfPirithiRaju
 
Zoology 4th semester series (krishna).pdf
Zoology 4th semester series (krishna).pdfZoology 4th semester series (krishna).pdf
Zoology 4th semester series (krishna).pdfSumit Kumar yadav
 
Recombinant DNA technology (Immunological screening)
Recombinant DNA technology (Immunological screening)Recombinant DNA technology (Immunological screening)
Recombinant DNA technology (Immunological screening)PraveenaKalaiselvan1
 
Labelling Requirements and Label Claims for Dietary Supplements and Recommend...
Labelling Requirements and Label Claims for Dietary Supplements and Recommend...Labelling Requirements and Label Claims for Dietary Supplements and Recommend...
Labelling Requirements and Label Claims for Dietary Supplements and Recommend...Lokesh Kothari
 
Lucknow 💋 Russian Call Girls Lucknow Finest Escorts Service 8923113531 Availa...
Lucknow 💋 Russian Call Girls Lucknow Finest Escorts Service 8923113531 Availa...Lucknow 💋 Russian Call Girls Lucknow Finest Escorts Service 8923113531 Availa...
Lucknow 💋 Russian Call Girls Lucknow Finest Escorts Service 8923113531 Availa...anilsa9823
 
Spermiogenesis or Spermateleosis or metamorphosis of spermatid
Spermiogenesis or Spermateleosis or metamorphosis of spermatidSpermiogenesis or Spermateleosis or metamorphosis of spermatid
Spermiogenesis or Spermateleosis or metamorphosis of spermatidSarthak Sekhar Mondal
 
Stunning ➥8448380779▻ Call Girls In Panchshil Enclave Delhi NCR
Stunning ➥8448380779▻ Call Girls In Panchshil Enclave Delhi NCRStunning ➥8448380779▻ Call Girls In Panchshil Enclave Delhi NCR
Stunning ➥8448380779▻ Call Girls In Panchshil Enclave Delhi NCRDelhi Call girls
 

Dernier (20)

Green chemistry and Sustainable development.pptx
Green chemistry  and Sustainable development.pptxGreen chemistry  and Sustainable development.pptx
Green chemistry and Sustainable development.pptx
 
Discovery of an Accretion Streamer and a Slow Wide-angle Outflow around FUOri...
Discovery of an Accretion Streamer and a Slow Wide-angle Outflow around FUOri...Discovery of an Accretion Streamer and a Slow Wide-angle Outflow around FUOri...
Discovery of an Accretion Streamer and a Slow Wide-angle Outflow around FUOri...
 
Animal Communication- Auditory and Visual.pptx
Animal Communication- Auditory and Visual.pptxAnimal Communication- Auditory and Visual.pptx
Animal Communication- Auditory and Visual.pptx
 
GBSN - Biochemistry (Unit 1)
GBSN - Biochemistry (Unit 1)GBSN - Biochemistry (Unit 1)
GBSN - Biochemistry (Unit 1)
 
Botany 4th semester series (krishna).pdf
Botany 4th semester series (krishna).pdfBotany 4th semester series (krishna).pdf
Botany 4th semester series (krishna).pdf
 
Engler and Prantl system of classification in plant taxonomy
Engler and Prantl system of classification in plant taxonomyEngler and Prantl system of classification in plant taxonomy
Engler and Prantl system of classification in plant taxonomy
 
9654467111 Call Girls In Raj Nagar Delhi Short 1500 Night 6000
9654467111 Call Girls In Raj Nagar Delhi Short 1500 Night 60009654467111 Call Girls In Raj Nagar Delhi Short 1500 Night 6000
9654467111 Call Girls In Raj Nagar Delhi Short 1500 Night 6000
 
Raman spectroscopy.pptx M Pharm, M Sc, Advanced Spectral Analysis
Raman spectroscopy.pptx M Pharm, M Sc, Advanced Spectral AnalysisRaman spectroscopy.pptx M Pharm, M Sc, Advanced Spectral Analysis
Raman spectroscopy.pptx M Pharm, M Sc, Advanced Spectral Analysis
 
Natural Polymer Based Nanomaterials
Natural Polymer Based NanomaterialsNatural Polymer Based Nanomaterials
Natural Polymer Based Nanomaterials
 
Unlocking the Potential: Deep dive into ocean of Ceramic Magnets.pptx
Unlocking  the Potential: Deep dive into ocean of Ceramic Magnets.pptxUnlocking  the Potential: Deep dive into ocean of Ceramic Magnets.pptx
Unlocking the Potential: Deep dive into ocean of Ceramic Magnets.pptx
 
GBSN - Microbiology (Unit 1)
GBSN - Microbiology (Unit 1)GBSN - Microbiology (Unit 1)
GBSN - Microbiology (Unit 1)
 
Pests of cotton_Borer_Pests_Binomics_Dr.UPR.pdf
Pests of cotton_Borer_Pests_Binomics_Dr.UPR.pdfPests of cotton_Borer_Pests_Binomics_Dr.UPR.pdf
Pests of cotton_Borer_Pests_Binomics_Dr.UPR.pdf
 
Zoology 4th semester series (krishna).pdf
Zoology 4th semester series (krishna).pdfZoology 4th semester series (krishna).pdf
Zoology 4th semester series (krishna).pdf
 
Recombinant DNA technology (Immunological screening)
Recombinant DNA technology (Immunological screening)Recombinant DNA technology (Immunological screening)
Recombinant DNA technology (Immunological screening)
 
The Philosophy of Science
The Philosophy of ScienceThe Philosophy of Science
The Philosophy of Science
 
Labelling Requirements and Label Claims for Dietary Supplements and Recommend...
Labelling Requirements and Label Claims for Dietary Supplements and Recommend...Labelling Requirements and Label Claims for Dietary Supplements and Recommend...
Labelling Requirements and Label Claims for Dietary Supplements and Recommend...
 
Lucknow 💋 Russian Call Girls Lucknow Finest Escorts Service 8923113531 Availa...
Lucknow 💋 Russian Call Girls Lucknow Finest Escorts Service 8923113531 Availa...Lucknow 💋 Russian Call Girls Lucknow Finest Escorts Service 8923113531 Availa...
Lucknow 💋 Russian Call Girls Lucknow Finest Escorts Service 8923113531 Availa...
 
Spermiogenesis or Spermateleosis or metamorphosis of spermatid
Spermiogenesis or Spermateleosis or metamorphosis of spermatidSpermiogenesis or Spermateleosis or metamorphosis of spermatid
Spermiogenesis or Spermateleosis or metamorphosis of spermatid
 
CELL -Structural and Functional unit of life.pdf
CELL -Structural and Functional unit of life.pdfCELL -Structural and Functional unit of life.pdf
CELL -Structural and Functional unit of life.pdf
 
Stunning ➥8448380779▻ Call Girls In Panchshil Enclave Delhi NCR
Stunning ➥8448380779▻ Call Girls In Panchshil Enclave Delhi NCRStunning ➥8448380779▻ Call Girls In Panchshil Enclave Delhi NCR
Stunning ➥8448380779▻ Call Girls In Panchshil Enclave Delhi NCR
 

complexometric titration , colorimetry and spectrophotometry

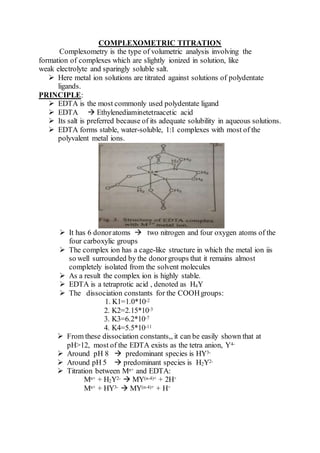
  • 1. COMPLEXOMETRIC TITRATION Complexometry is the type of volumetric analysis involving the formation of complexes which are slightly ionized in solution, like weak electrolyte and sparingly soluble salt.  Here metal ion solutions are titrated against solutions of polydentate ligands. PRINCIPLE:  EDTA is the most commonly used polydentate ligand  EDTA  Ethylenediaminetetraacetic acid  Its salt is preferred because of its adequate solubility in aqueous solutions.  EDTA forms stable, water-soluble, 1:1 complexes with most of the polyvalent metal ions.  It has 6 donoratoms  two nitrogen and four oxygen atoms of the four carboxylic groups  The complex ion has a cage-like structure in which the metal ion iis so well surrounded by the donorgroups that it remains almost completely isolated from the solvent molecules  As a result the complex ion is highly stable.  EDTA is a tetraprotic acid , denoted as H4Y  The dissociation constants for the COOHgroups: 1. K1=1.0*10-2 2. K2=2.15*10-3 3. K3=6.2*10-7 4. K4=5.5*10-11  From these dissociation constants,, it can be easily shown that at pH>12, most of the EDTA exists as the tetra anion, Y4-  Around pH 8  predominant species is HY3-  Around pH 5  predominant species is H2Y2-  Titration between Mn+ and EDTA: Mn+ + H2Y2-  MY(n-4)+ + 2H+ Mn+ + HY3-  MY(n-4)+ + H+
  • 2.  The protons liberated in these reactions would considerably alter the pH of the solution and would thus cause the back reaction, i.e., the dissociation of the metal-EDTA complex.  This is prevented by adding an excess of an innocuous buffer to the titration system. INDICATORS FOR EDTATITRATIONS:  Several organic dyes are used as indicators for EDTA titrations which forms complexes with metal ions which are intensely coloured.  The most widely used indicator is Eriochrome Black T.  EDTA is denoted by, H3In  Indicator exhibit different colours in various pH ranges.  At pH less than 6  H2In- (red)  At pH 7 or above  HIn2- (blue)  More alkaline  In3- (orange) EDTA titration: During an EDTA titration two complexes are formed i) Metal-EDTA complex ii) Metal ion-indicator complex  Suitable amount of indicator is added to the solution of Metal ions in the titration flask.  The two species react together to form a metal ion-indicator complex.  If metal ion is bivalent M2+ , the complex formed in aqueous solution would be MIn- (red).  A buffer solution of appropriate pH is added to the titration flask.  Standard solution of sodium salt of EDTA in the burette is added to metal ion-indicator complex to form metal-EDTA complex.  Because, Metal ion –indicator complex is less stable than the metal- EDTA complex.
  • 3.  Thus a change in colour from red to blue marks the approach of end point.  EDTA combines with metal ions in the ratio of 1:1  Irrespective of their valencies to form almost exactly the same type of complexes.  The stability of EDTA complexes depends considerably on pH and  It makes the EDTA titrations adequately selective.  Eg: Around pH-1 divalent ions doesn’tform complexes with EDTA, but only the trivalent ions do.  Cd2+, Zn2+ forms more complex than Mg2+.  In pH-7 EBT doesn’tform complex with Mg2+ thus the former cations forms complexes easily with EDTA. MASKING OF IONS:  Selectivity is provided by the masking of interfering cations.  Eg: Mg2+ and Ca2+ can be titrated in the presence of interfering ions such as Co2+, Cu2+, Ni2+ and Pd by adding cyanide ions to the reaction mixture as the MaskingAgent.  The later ions forms stable cyanide complexes such as [M(CN)4]2-  Demasking agent:reagent released the metal ion from a masking reagent. TYPES OF TITRATIONS:  Direct titration  Back titration  Displacement method BACK TITRATION DIRECT TITRATION
  • 4. APPLICATIONS:  Complexometric titration is widely used in the medical industry because of the micro litre size sample involved. The method is efficient in research related to the biological cell.  Ability to titrate the amount of ions available in a living cell.  Ability to introduce ions into a cell in case of deficiencies.  Complexometric titration involves the treatment of complex ions such as magnesium, calcium, copper, iron, nickel, lead and zinc with EDTA as the complexing agent.  Complexometric titration is an efficient method for determining the level of hardness of water. COLORIMETRY AND SPECTROPHOTOMETRY Both the techniques are falls under the broad classification of photometry which involves in the measurement of absorption and emission of the radiation. RANGE: Colorimetry : visible range (4000-8000A) Spectrophotometry: UV visible range (2000-8000A) PRINCIPLE:  It is based on Beer-lambert’slaw.  It states that the amount of light absorbed by a color solution is directly proportional to concentration of the solution and length of a light path through the solution. Where, A = absorbance/optical density of solution C = concentration of solution Log I0/It = A = εcl
  • 5. l = path length ε = absorption coefficient BEER’S LAW: This law states that the amount of light absorbed is directly proportional to the concentration of the solute in the solution. Log I0/It = kc Where, K = absorption coefficient C = concentration of the solution I0 = intensity of incident light It = intensity of transmitted light LAMBERT’S LAW: This law states that the amount of light absorbed is directly proportional to the length and thickness of the solution under analysis. Log I0/It = kt Where, t = thickness/length of the absorbing medium (solution) APPLICATIONS  Detection of concentration of substances.  Detection of impurities.  Structure elucidation of organic compounds.  Monitoring dissolved oxygen content in freshwater and marine ecosystems.  Characterization of proteins.  Detection of functional groups.  Molecular weight determination of compounds.  Determination of pk value of an indicator  Determination of molar composition of complexes  Determination of instability constants QUANTITATIVE ANALYSIS:  In order to prepare calibration curves, a series of solution, each with the known concentration, are prepared.  The colorimeter or spectrophotometeris set at that wavelength where the absorption is maximum.  After this these absorbanceof each solution is measured and then plotted against be concentration of the solution to get a calibration curve.  If absorbanceis measured at a wavelength as used for the calibration curve of an unknown solution, then concentration of the unknown solution can be measured from the calibration curve by seeing the value of concentration against the absorbanceof the solution.  Colorimetric analysis is generally used whenever the sample is coloured.
  • 6. Eg: dichromate, permanganate, cupricion and ferric ion. STRUCTURE OF INORGANIC COMPOUNDS:  Absorption spectralstudies have revealed that deep blue colour of ferric thiocyanate is due to the presence of FeCNS2+ ions. STRUCTURE OFF INORGANIC COMPLEXES:  Spectrophotometryhas been used to distinguish between cis and trans isomers of a complex.  Equilibrium between the octahedral, tetrahedral, squareplanar, and the five coordinate configurations have been studied by absorption spectroscopy.  The geometrical isomers of transition complexes can be easily distinguished from their visible spectra.  Eg: cis isomer of [Co(en)2F2]NO3 is violet whereas the trans isomer is green DETERMINATION OF MOLECULAR WEIGHT:  When a compound reacts with a reagent to form a derivative having a characteristic absorptionin another wavelength region, the molar absorptivity ε of the derivative is almost the same as that of a reagent.  For example, amine picrates  max absorption= 380nm having ε = 13,400 which is same as that of picric acid.  Thus, one can determine the molecular weight of given amine picrate by dissolving its known amount in a known volume of solvent and then its absorbanceis measured at 380nm.  Then on applying BEER’S LAW, we get A = act where, a = absorptivity ; c = concentration  Molecular weight can be calculated by applying the following relation: A DOUBLE BEAM UV-VISIBLE ABSORPTION SPECTROMETER INSTRUMENTATION If you pass white light through a coloured substance, some of the light gets absorbed. A solution containing hydrated copper(II) ions, for example, looks pale blue because the solution absorbs light from the red end of the spectrum. The remaining wavelengths in the light combine in the eye and brain to give the appearance of cyan (pale blue). ε = a × molecular weight
  • 7.  Some colourless substances also absorb light - but in the ultra-violet region. Since we can't see UV light, we don't notice this absorption.  Different substances absorb different wavelengths of light, and this can be used to help to identify the substance - the presence of particular metal ions, for example, or of particular functional groups in organic compounds.  The amount of absorption is also dependent on the concentration of the substance if it is in solution. Measurement of the amount of absorption can be used to find concentrations of very dilute solutions.  An absorption spectrometer measures the way that the light absorbed by a compound varies across the UV and visible spectrum. A simple double beam spectrometer The light source  A light source which gives the entire visible spectrum plus the near ultra-violet covering the range from about 200 nm to about 800 nm. (This extends slightly into the near infra-red as well.)  A combination of two lamp is used - a deuterium lamp for the UV part of the spectrum, and a tungsten / halogen lamp for the visible part.  The combined output of these two bulbs is focussed on to a diffraction grating. The diffraction grating and the slit  A prism splits light into its component colours. A diffraction grating does the same job,
  • 8. The arrows show the way the various wavelengths of the light are sent off in different directions. The slit only allows light of a very narrow range of wavelengths through into the rest of the spectrometer. By gradually rotating the diffraction grating, you can allow light from the whole spectrum (a tiny part of the range at a time) through into the rest of the instrument. The rotating discs: Each disc is made up of a number of different segments. The light coming from the diffraction grating and slit will hit the rotating disc and one of three things can happen.  If it hits the transparent section, it will go straight through and pass through the cell containing the sample. It is then bounced by a mirror onto a second rotating disc. This disc is rotating such that when the light arrives from the first disc, it meets the mirrored section of the second disc. That bounces it onto the detector.  It is following the red path in the diagram:   If the original beam of light from the slit hits the mirrored section of the first rotating disc, it is bounced down along the green path. After the mirror, it but more efficiently.
  • 9. passes through a reference cell (more about that later). Finally the light gets to the second disc which is rotating in such a way that it meets the transparent section. It goes straight through to the detector. 1. If the light meets the first disc at the black section, it is blocked - and for a very short while no light passes through the spectrometer. This just allows the computer to make allowance for any current generated by the detector in the absence of any light. The sample and reference cells:  These are small rectangular glass or quartz containers. They are often designed so that the light beam travels a distance of 1 cm through the contents.  The sample cell contains a solution of the substance you are testing - usually very dilute. The solvent is chosen so that it doesn't absorb any significant amount of light in the wavelength range we are interested in (200 - 800 nm).  The reference cell just contains the pure solvent. The detector and computer  The detector converts the incoming light into a current. The higher the current, then greater is the intensity of the light.  For each wavelength of light passing through the spectrometer, the intensity of the light passing through the reference cell is measured. This is usually referred to as Io - that's I for Intensity.  The intensity of the light passing through the sample cell is also measured for that wavelength - given the symbol, I.  If I is less than Io, then obviously the sample has absorbed some of the light. A simple bit of maths is then done in the computer to convert this into something called the absorbance of the sample - given the symbol, A.  For reasons which will become clearer when we do a bit of theory on another page, the relationship between A and the two intensities is given by:  On most of the diagrams you will come across, the absorbance ranges from 0 to 1, but it can go higher than that.  An absorbance of 0 at some wavelength means that no light of that particular wavelength has been absorbed. The intensities of the sample and reference beam are both the same, so the ratio Io/I is 1. Log10 of 1 is zero.
  • 10.  An absorbance of 1 happens when 90% of the light at that wavelength has been absorbed - which means that the intensity is 10% of what it would otherwise be.  In that case, Io/I is 100/I0 (=10) and log10 of 10 is 1. The chart recorder Chart recorders usually plot absorbance against wavelength. The output might look like this: This particular substance has what are known as absorbance peaks at 255 and 395 nm. How these arise and how they are interpreted are discussed on another page.