Automating Google Workspace (GWS) & more with Apps Script
Oracle business intelligence enterprise edition 11g
1. Oracle Business Intelligence Enterprise Edition 11g
Index:
1. BI Installation
2. Basic BI performance Tuning.
3. BI Component Scale up.
4. OBIEE Patch.
5. Basic BI server Operation
6. BI Slow!!
7. Performance Monitoring.
8. Basic Problem in BI faces with Solution
a. Xmlpserver page not coming in BI server.
b. Unable to create a system user connection to BI Server while running user
population queries" Presentation Server Fails To Start.
c. Executing any Scheduled Report Job errors.
d. Particular OPMNCTL fail to start. Restart particular OPMNCTL.
e. Unable to get file lock, will retry in Weblogic.
9. Create a Sample Report generation.
10. Create a file based report generation.
11. Mail Server Setup in BI server.
12.Mail Confirmation after complete a job.
13.Garbage Collect
1. BI Installation
Step1. Create Database
Step2: Create Repository
Step3: Install BI server
RCU CREATE STEP:
Download:
Download from below link:
http://www.oracle.com/technetwork/middleware/bi-enterprise-edition/downloads/index.html
2. Set Hostname of DB server to hosts file:
Extract zip file:
hostname
20. Installation Completed.
After Installation we will get 4 URLS:
Weblogic Console
http://hostname:7001/console
http://hostIP:7001/console
Oracle Enterprise Manager
http://hostname:7001/em
http://hostIP:7001/em
Business Intelligence Analytics Enterprise Edition
http://hostname:9704/analytics
http://hostIP:9704/analytics
21. Business Intelligence Publisher
http://hostname:9704/xmlpserver
http://hostIP:9704/xmlpserver
Part 2: Performance Tuning
Basic BI performance Tuning. ( Heap Size, Data source , Max stuck Thread)
Increase Heap Size:
Login to WLS console (http://host_name:7001/console)
Navigate to Servers->bi_server1->Server Start ->> Arguments
-Dserver.group=obi -Xms8192m -Xmx8192m -XX:PermSize=512m -XX:MaxPermSize=1024m
Restart application services also BI server and test the issue.
Increase Connection Pool
22. Navigate to Services Data Sources Select Any Data Source Connection Pools
change
the values of Maximum Capacity
Increase Stuck Thread Max Time: from 600 to 1200
Navigate to Server bi_server1 Tuning Stuck Thread Max Time:
23. Part 3: BI component Scale UP
1. Create a shared location
2. Create three directory in shared drive for a. repository , b. catalog and c. Globalcache
In our environment we create shared drive /u01/Shared drive then we create below
Three directories which path is below
a. Repository : /u01/Shared/repository
b. Catalog : /u01/Shared/catalog
c. Global Cache: /u01/Shared/Globalcache
3. Now we enter the EM and then move Business Intelligence then coreapplication and configure
the below things
24. 4. Click Apply button then repository release will change
** Here upload repository not working then restart all the apply changes then we get the latest
repository .rpd file and move this file to shared directory.
5. Then copy the catalog folder from below location
/u01/app/oracle/product/middleware/instances/instance1/bifoundation/OracleBIPresentationS
ervicesComponent/coreapplication_obips1
25. To desktop and move this folder to shared catalog folder
/u01/Shared/catalog
6. Restart to apply all recent changes
7. Now scale out the BI server increase the number of BI server, BI JAVA Host and presentation
server
8.
9. Stop and start the opmnctl then we get desire results
26. Step 4: OBIEE Patch deployment
==============================
Interim Patch for Bug: 22472013
==============================
Date: Sat Jan 9 15:47:20 2016
---------------------------------
Platform Patch for : Solaris86-64
Product Patched : ORACLE BUSINESS INTELLIGENCE ENTERPRISE EDITION
Product Version : 11.1.1.9.0
Auto Enabled : No
This document describes how to install the interim patch for
bug # 22472013. It includes the following sections:
Section 1, "Prerequisites"
Section 2, "Pre-Installation Instructions"
Section 3, "Installation Instructions"
Section 4, "Post-Installation Instructions"
Section 5, "Deinstallation Instructions"
Section 6, "Post Deinstallation Instructions"
Section 7, "Bugs Fixed by This Patch"
1 Prerequisites
27. ----------------
Ensure that you meet the following requirements before you install or
deinstall the patch:
1. Before applying the non-mandatory patches, ensure that you have the
exact symptoms described in the bug.
2. Review and download the latest version of OPatch 11.1.x via Bug 6880880.
(OPatch version 11.1.0.8.2 or higher)
a. Oracle recommends that all customers be on the latest version of OPatch.
Review the My Oracle Support note 224346.1, and follow the instructions
to update to the latest version if needed. Click the following link to
view the note:
Note 224346.1 - Opatch - Where Can I Find the Latest Version of Opatch?
https://support.oracle.com/CSP/main/article?cmd=show&type=NOT&id=224346.1
b. For FMW Opatch usage, refer to the document at:
http://download.oracle.com/docs/cd/E21764_01/doc.1111/e16793/opatch.htm
3. Verify the OUI Inventory.
OPatch needs access to a valid OUI inventory to apply patches.
Validate the OUI inventory with the following commands:
$ opatch lsinventory [-jre $ORACLE_HOME/jdk/jre]
If the command errors out, contact Oracle Support and work to validate
and verify the inventory setup before proceeding.
4. Confirm the executables appear in your system PATH.
The patching process will use the unzip and the OPatch executables. After
setting the ORACLE_HOME environment, confirm if the following executables
exist, before proceeding to the next step:
- which opatch
- which unzip
If either of these executables do not show in the PATH, correct the
problem before proceeding.
5. Create a location for storing the unzipped patch. This location
will be referred to later in the document as PATCH_TOP.
NOTE: On WINDOWS, the prefrred location is the drive root directory.
For example, "C:PATCH_TOP" and avoid choosing locations like,
"C:Documents and SettingsusernamePATCH_TOP".
28. This is necessary due to the 256 characters limitation on windows
platform.
2 Pre-Installation Instructions
-------------------------------
1. Ensure that patch for bug is applied before you proceed.
2. Backup the Oracle BI System, including the following files/directories:
ORACLE_HOME/bifoundation/server directory
ORACLE_INSTANCE/bifoundation/OracleBIServerComponent/coreapplication_obis1/repository
ORACLE_BI_HOME/bifoundation/jee/mapviewer.ear/web.war/WEB_INF/conf/mapViewerConfi
g.xml
Note that the location of the Oracle BI Home directory depends on where
Oracle BI was originally installed. For Linux, AIX, or Solaris, it is
usually prod_mwhome/Oracle_BI1
3. Stop the BI System (in the following order):
For BI system components:
$ cd prod_mwhome/instances/<instance>/bin
$ ./opmnctl stopall
For WebLogic Managed Server(s):
$ cd prod_mwhome/user_projects/domains/<domain_name>/bin
$ ./stopManagedWebLogic.sh bi_server1
For WebLogic Administration Server:
$ cd prod_mwhome/user_projects/domains/<domain_name>/bin
$ ./stopWebLogic.sh
3 Installation Instructions
---------------------------
1. Unzip the patch zip file into the PATCH_TOP
where PATCH_TOP is usually prod_mwhome/Oracle_BI1/.
$ unzip -d PATCH_TOP p22472013_111190_Solaris86-64.zip
2. Set the environment variables.
29. For example,
$ setenv ORACLE_HOME prod_mwhome/OracleBI1
$ setenv PATH $ORACLE_HOME/bin:$PATH
$ setenv JAVA_HOME $ORACLE_HOME/jdk
$ setenv PATH $JAVA_HOME/bin:$PATH
$ setenv PATH $ORACLE_HOME/OPatch:$PATH
OPatch Location:
/u02/app/oracle/product/middleware/Oracle_BI1/OPatch
export ORACLE_HOME=/u02/app/oracle/product/middleware/Oracle_BI1
export PATH=$ORACLE_HOME/bin:$PATH
export JAVA_HOME=$ORACLE_HOME/jdk
export PATH=$JAVA_HOME/bin:$PATH
export PATH=$ORACLE_HOME/OPatch:$PATH
3. Set your current directory to the directory where the patch extracted.
$ cd PATCH_TOP/22472013
4. Run OPatch to apply the patch and verify the patch is installed.
Enter this path $ opatch apply
:/u02/app/oracle/product/middleware/Oracle_BI1/OPatch$ ./opatch apply
/u02/app/oracle/product/middleware/Patch/22382217
A message "Opatch Succeeded" will be displayed.
$ opatch lsinventory
oracle@ucb-dc-obi-1:/u02/app/oracle/product/middleware/Oracle_BI1/OPatch$ ./opatch
lsinventory
Oracle Interim Patch Installer version 11.1.0.10.3
Copyright (c) 2013, Oracle Corporation. All rights reserved.
Oracle Home : /u02/app/oracle/product/middleware/Oracle_BI1
Central Inventory : /u02/app/oracle/oraInventory
from : /u02/app/oracle/product/middleware/Oracle_BI1/oraInst.loc
OPatch version : 11.1.0.10.3
OUI version : 11.1.0.11.0
31. Confirm that the patch is listed.
4 Post-Installation Instructions
---------------------------------
Start the services.
For Weblogic Administration Server and the Managed Server(s),
$ ./startWebLogic.sh
$ ./startManagedWebLogic.sh bi_server1
For BI system components,
$ ./opmnctl startall
5 Deinstallation Instructions
------------------------------
If you experience any problems after installing this patch, remove the patch as
follows:
1. Make sure to follow the same Prerequisites or pre-install steps (if any)
when deinstalling a patch.
This includes setting up any environment variables like ORACLE_HOME and
verifying the OUI inventory before deinstalling.
2. Change to the directory where the patch was unzipped.
$ cd PATCH_TOP/22472013
3. Run OPatch to deinstall the patch.
$ opatch rollback -id 22472013
6 Post Deinstallation Instructions
-----------------------------------
Start the services.
For Weblogic Administration Server and the Managed Server(s),
$ ./startWebLogic.sh
$ ./startManagedWebLogic.sh bi_server1
For BI system components,
32. $ ./opmnctl startall
7 Bugs Fixed by This Patch
--------------------------
The following are the bugs fixed by this patch:
10406798: UNABLE TO COPY DATA FROM 11G TABLE OR PIVOT TABLE LIKE IN 10G
17567877: UNABLE TO SAVE A FILTER IN SHARED FOLDERS - OK BUTTON GOES GREY
18427388: PM: PPT, PDF AND EXCEL WORD WRAP SETTINGS NEED MORE WORK.
18683000: IE11: REQUALIFY CHECK BOX NOT SHOWN IN LIST FORMAT DESIGNER PAGE
19186226: DTEID:20484371: CAMPAIGN EXECUTION GOES TO ERROR EXIST STATUS
20055522: Fix for Bug 20055522
20089721: QA: ALTA: NOTHING HAPPENS WHEN ONE OF THE VISUALIZATION IS SELECTED
20096851: QA:ALTA: QUALIFIER ICON SHOULD BE USED FOR LINE AND TIME LINE SERIES
GRAPH
20122355: QA:ALTA: THE SPACE BETWEEN THE MENU ITEMS SHOULD BE CONSISTENT.
20124586: QA: ALTA: THE TEXT FIELD BORDER IS MISSING IN THE EDIT COMPOUND LAYOUT
20128580: QA:ACTION LINKS DOES'NT HIGHLIGHT FOR HM & OTHER VIEWS WITHIN ALTA
SKIN / STYLE.
20177100: ALTA: TRACKING FOR MAP VIEW DISPLAY ISSUES ON ALTA
20195554: LAYOUT WIDTH OF THE GAUGES ARE MOVED FAR WHEN EXPORTING TO
PDF/EXCEL
20227917: DIAGNOSTIC IMPROVMENT TO IDENTIFY SYSMAN TIMEOUT ISSUE
20237404: QA:ALTA: IN TRELLIS SECTION FORMAT WINDOW SOME OF THE TEXT IS CUT OFF.
20237512: QA: ALTA: THE FORMAT VALUES WINDOW IS NOT CLEAR, IT IS ALL OVERLAPPED
20237618: QA: ALTA: THE COLUMN NAME JUST DISAPPERS WHEN DRAGGING AND
DROPPING IS DONE
20257619: OBI POPUP BLOCKER CHECK IS CAUSING ACTION LINKS TO NOT WORK IN THE BI
MOBILE APP
20308347: DTEID:23164261:IE:JS ERROR FOR TERRITORY QUOTA GRAPH
20315076: NLS:BIDI:ALTA CAN'T WORK IN BIDI ENV
20315555: NLS:BIDI:ALTA:ARROW DIRECTION IS WRONG IN POP UP MENU LIST
20324030: REST API ANALYTICS USAGE METRIC VALUE DOES NOT CONSIDER USER LOGINS
VIA OHS URL
20348633: CLICKING REFRESH LINK NEEDS TO ADD OBIS_REFRESH_CACHE=1 IN LOGICAL
SQL.
20425541: QA:FIREFOX: DOWN ARROW SHOULD DISPLAY FOR THE DROP DOWN LIST
20460870: ALTA: IE9 ONLY,THERE IS A H-SCROLLBAR ON THE BOTTOM OF "NEW
CALCULATED ITEM" DLG
20485729: ALTA: ACTION LINK DIALOGS HAVE SOME NONE ALTA ICONS
20493229: METADATA CACHE SHOULD CONSIDER MSG_VERSION_ID SESSION VARIABLE
20525487: UNABLE TO MIGRATE TENANT/USERS CATALOG OBJECTS FROM ONE OBIEE
SERVER TO ANOTHER
20554987: APPLY OTF UPGRADE REGARDLESS OF CATALOG LOCK BY BIPS
20564809: CANNOT DRAG "TERRITORY" FIELD TO GRAPH PROMPTS OF THIS REPORTS
20564854: CHANGING DASHBOARD PROMPT'S VALUES DOESN'T AFFECT THE ANALYSIS
20572841: REL10: FIX OF 20034420 IS NOT COMPLETE
33. 20604616: EXPORT TO EXCEL 2007 IS PRODUCING A DIFFERENT OUTCOME IN BP
11.1.1.7.140527
20673811: Fix for Bug 20673811
20693847: REL8 TRACKING BUG TO FIX NPE DURING SYSMAN COMMIT
20860040: REL11: DROP DOWN MENU ARROW IS NOT INLINE WITH THE FIELD
20925844: NLS:THE BRAZIL LOCALIZED CURRENCY TAG LOC:PT-BR SHOULD MAP TO R$
20926955: ASSERTION ERROR "PROJECT/WEBREPORT/DRILLDOWNUTILS. IS THWON ON
DRILLING ON CHART
20976792: ODBC DRIVER ERROR MESSAGES TRUNCATED
20992309: QA:ALTA:EDIT MODE TOGGLE ICON DOESN'T FIT ON THE TOOLBAR WITHOUT
OVERFLOWING
20992786: REPORTS EMBEDDED VIA ADFBI: CONTENT RETURN SHOWS JS ERROR ON IOS
DEVICE
21114277: ALIASES SHOULD WORK IN WSIL/WSDL FILES
21123699: DIAGNOSE BI LINK FOR DASHBOARD REPORTS
21237741: BI INTERACTIONS NOT OPENING IN NEW WINDOW AFTER PB UPDATE
21294224: QA:ALTA:PAGE REPORT LINKS FONT IS NOT UNIFORM AND DIFFERENT FROM
SKYROS SKIN
21296151: QA: SA SEARCH:ALTA: SEARCH BOX IS ROLLING OVER CLEAR ICON IN 9.1
21339152: THE ALTA CHART STYLES IN ANSWERS DOESN'T MATCH ALTA SPEC
21364429: WRITELISTFILESASYNC NOT RETURNING ANY RESPONSE
21576219: FORMATTING DASHBOARD ANALYSIS DOES NOT WORK AFTER UPGRADING TO
OBIEE 11.1.1.9
21745479: QA:RGRN: FILTER VIEWS ARE GETTING WRAPPED WHEN EXPORTED TO PDF IN
9.3
21766161: Fix for Bug 21766161
21811332: TURN CONTENT SECURITY POLICY HEADER OFF BY DEFAULT FOR REL10
21888129: OTBIE V3 BI_SERVER STARTS UP WITH XML PARSIN EXCEPTION IN
BI_SERVER1.OUT
21911881: Fix for Bug 21911881
22262037: TRACKING BUG FOR BIFNDN CHANGES FOR 7X RELEASE FOR BASE BUG 20919700
-----------------------------------------------------------------------------
DISCLAIMER:
This interim patch has only undergone basic unit testing, and has not been
through a complete test cycle generally followed for a production patch set.
Though the fixes in this document rectifies the bug, Oracle Corporation will
not be responsible for other issues that may arise due to these fixes.
Oracle Corporation recommends to later upgrade to the next production patch
set, when available. Applying this patch could overwrite other interim
patches applied since the last patch set. Customers need to make a request
to Oracle Support for a patch that includes those fixes, as well as inform
Oracle Support about all the patches installed when a Service Request is
opened. Please download, test, and provide feedback as soon as possible
to assist in the timely resolution of this problem.
34. Copyright (c) 2016, Oracle and/or its affiliates. All rights reserved.
-----------------------------------------------------------------------------
5. Basic BI server Operation
BI Server Component Stop process
Move this directory and run below command
cd /u02/app/oracle/product/middleware/instances/instance1/bin
./opmnctl status
./opmnctl stopall
BI Server Stop process
Move this directory and run below command
cd
/u02/app/oracle/product/middleware/user_projects/domains/bifoundation_domain/bin
./stopManagedWebLogic.sh bi_server1
Or you can stop BI server from BI console
BI Admin Server Stop process
Move this directory and run below command
cd
/u02/app/oracle/product/middleware/user_projects/domains/bifoundation_domain/bin
./stopWeblogic.sh
Or you can stop Admin server from BI console
35. Node manager up /Down Step
Move this directory and run below command
cd /u02/app/oracle/product/middleware/wlserver_10.3/server/bin
nohup ./startNodeManager.sh &
To Stop the Node Manager Kill the process
Find the process id use this command: ps -ef | grep java
Check any specific processed details use below command:
pargs "process id"
To Start BI server follow below Step
First UP Admin server
cd
/u02/app/oracle/product/middleware/user_projects/domains/bifoundation_domain/bin
nohup ./startWebLogic.sh &
BI Server Component Start process
Move this directory and run below command
cd /u02/app/oracle/product/middleware/instances/instance1/bin
./opmnctl status
./opmnctl startall
Then start Node Manager
Start BI server process
36. Before start BI server you must up node manager and check the BI server Machine
should be reachable
cd
/u02/app/oracle/product/middleware/user_projects/domains/bifoundation_domain/bin
or go to the GUI and startup bi_server1
nohup ./startManagedWebLogic.sh bi_server1 &
Used port check command
netstat -a | grep 5556
netstat -a | grep 7001
netstat -a | grep 9704
6. Why BI Slow!!
Usually the performance problems in an OBIEE environment are first detected because
users complain that the application reporting is too slow, or at least slower than before.
In this situation, as administrator of the system, you should not guess about what might be
the reason. Your experience will be a great asset for you to quickly determine the most
probable cause of the problem, but it’s important to test empirically your assumptions.
There are four broad areas where the culprit might be.
1 OBIEE layer
2 Database layer
3 Hardware layer
4 Network layer
OBIEE can slow any of the layers, if anyone complains BI slow; you should look after all
four layers and conclude the decision.
** First job is to find out a problematic report, where user complains about this.
Check OBIEE layer.
37. Login the xmlpserver, open the problematic report and find out the total time it’s taken, if it
is Ok, then report query has no problem. One thing must check don’t forget to un-check the
use BI Presentation cache!
And uncheck Enable Data Caching
Check Database layer.
Specify the any report, where users complain its respond very slow.
First find out what’s query is running behind this report, take this query from BI server and
run this query database end and counts what time is taken.
If this query output come in your expected time and also check other the database
performance. If this ok check number of session in database for BI user, memory of DB
server
Hardware and Network Layer
Either as discarding OBIEE as the root cause of the problem or as a side effect of it, you
should check that the available hardware is enough for the demands of the OBIEE
application. This should have been assessed during the infrastructure sizing phase, but as
38. your environment grows in users and complexity is usually a good idea to have a look to
make sure that it stills holds on.
Memory
The memory of the system is going to be used basically for the server’s JVM and also for the
OBIEE components such the BI Server or the Presentation Server. Depending on the total
memory of your system, you can configure the JVM parameters to try to get the most of
your memory. We will see how to do this in the next section.
When the system runs out of memory, it will start moving the pages to disk, causing
performance problems. The easiest way to check if you still have enough free memory is to
execute a top and check that the free + cached is still enough to avoid pagination.
As you can see in the above screenshot, the both Java processes are the two JVM machines
(Admin server and Managed server bi_server1, while the sawserver is the process for the
presentation server).
39. One way to make sure if your system is doing heavy use of pagination is to use the vmstat
command and check for the swap in and out parameters.
If these two are close to 0 values means that so far you still have some memory to use.
CPU
Normally the CPU consumption for an OBIEE environment should be pretty low. If you see
your consolidated CPU cores working at >95% then probably the system is trying to page
out to disk as a result of insufficient memory. You can check again using the Top command
that will default order the process by CPU consumption and look for the processes that are
using the most of your CPU cores.
Another documented reason for abnormal CPU consumption are faulty devices. It might be
worthy to check the output of the dmesg command and forward it to your systems team if
you find repeating messages about faults on some devices.
Network
Often overlooked, your problem might be within the network layer itself. At the end, no
matter how fast your database or server is behaving if the network can’t transmit those
results fast enough to the users.
As with the CPUs the network interfaces should be quite relaxed, so one quick check is to
run some network monitor program, like iftop to check what processes are using the most
of the network interfaces.
40. Also you can use IPTraf to monitor a particular network interface to see if the total traffic is
the expected one. In this case we can’t see information about the individual connections but
we have more statistics about the traffic that goes across the interface.
So hopefully after reviewing the above areas you’ll have identified the root causes of your
problem and eventually fix it.
41. 7. Performance Monitoring.
All the changes described above should be applied one at a time and in a very controlled
way. As a matter of fact, you need to monitor the performance and the stability of your
system after any change.
There are many ways to monitor OBIEE performance, but normally you will use a
combination of log files and built in monitoring tools available in Enterprise Manager like
the Performance Summary monitor.
To access this tool you have to log in to the Enterprise Manager and right click your
bi_serverX under the WebLogic domain section. Once you are there, some metrics will be
selected by default but you should go straight ahead to the Metric Selector to spice things a
little bit.
The combination that I should use normally to have an eye to the performance and stability
of the system is the following:
42. CPU Usage (%)
It should be pretty low at all times, but if you see spikes or a continuous high usage of the
CPU is a good idea to go to your OS and check what is going on.
Heap Usage (%)
This metric is useful to check that we are not running out of memory on our JVMs. If you
see that the heap usage is touching your maximum heap consistently this is an indicator
that you should increase the memory of the JVM you still have memory available in your
system. If you don’t have, you might think about scaling out your environment horizontally.
Active Sessions
The active sessions is there to provide context for the rest of the metrics. As the number of
sessions goes up, you should expect more utilization of the whole system
Request Processing (ms)
This is an interesting metric that gives an overall idea of how good is the performance of
your environment. As per my experience, I have noticed that when users complains about
the system being “slow” this metric is usually pretty high, the order of several thousand ms.
It’s important here to notice that this metric is averaged for all the applications deployed in
that server, and this might be misleading.
For example, you might have your analytics working smoothly under <100 ms but maybe
some crazy BI Publisher reports going on and generating thousand pages PDF files. In this
case, you response time for BI Publisher will be way higher than for analytics, but the
average of both will still be quite low, at least nothing that will turn your head. My
recommendation in environments where there are more than one application used heavily
is to add the response time metric of each application (or at least have a look at the table
available below the graphs).
43. If your analytics application is consistently having a very high response time (>1000ms)
you should check if there long queries running by checking the Manage Sessions link in the
administration section of OBIEE. If this is the case, you can cancel the queries from there.
In any case, stopping and starting the application from the deployments section of the
WebLogic console will usually solve the problem, but this should be considered as your last
resort because it will end the sessions and running reports of your users.
Request (per minute)
The request per minute is somehow related to the processing time. Basically when the
response time is high, the number of requests per minute will decrease as the system will
be able to process less request in the same time.
What we are looking here is for high values. A sudden plunge on this metric normally is
associated with a higher system load at that particular time. If it does not recover, will
mean a performance decrease.
For this metric we should also do the same as for the Processing Time above, and in case of
having not only analytics application running in our server, add the related target based
metrics for each application.
In addition to the performance summary monitor it can be useful in some case to check the
status of the server threads.
All the work that is processed by the WebLogic server is carried out by threads, these
threads are created and disposed depending of the current system load and the
configuration of our server. Once a thread is created it will be in standby status until a work
manager assigns some work to it. At this point of time the thread will be considered active
until it finishes the job.
44. A thread that is been running for long time will be tagged as a Hogging thread, and
eventually (after the StuckThreadTime that we discussed above) it will marked as Stuck.
The server failsafe configuration can be set up to restart automatically the WebLogic if
there are many stuck threads, or you can bypass this behavior by changing the
configuration of your Work Manager with the ignore stuck threads parameter.
So, before we reach this point, is normally a good idea to check the threads status when we
are experiencing performance issues.
You can monitor the threads of the system from the WebLogic Console. Navigate to your
server and then select the Threads tab under the Monitoring Tab.
In the above screenshot I highlighted the areas that should get your attention. The main
indicator of troubles is the “Health” column, which is related to the overall server Health
indicator. If you see warning here (or worse) and this is related to the threads, then you’ll
see how several of your threads are in the Stuck and Hogger status.
Normally in these case there is no much to do other than restart the server. But the edge of
coming here and check it first is that you can click that “Dump Thread Stacks” button at the
top of the screen to get a stack trace of all your threads, so you’ll see what they were doing
to become stuck.
45. Another way to look at the thread information on graphical way is to use the Monitoring
Dashboard available out of the box with the WebLogic console.
The interface is quite powerful, allowing you to create your own views with a rich set of
metrics, which expose for example the Thread pool information, JVM metrics and even host
OS metrics.
(Just remember to press the play button on top left or you won’t get any results! :P)
Garbage Collector
8. Basic Problem in BI faces with Solution
a. Xmlpserver page not coming in BI server
STEP 1:
Stop the opmnctl component
46. STEP 2:
rename users.atr to users_bak.atr
/u01/app/MwHome/instances/instance1/bifoundation/OracleBIPresentationServicesComponent
/coreapplication_obips2/catalog/SampleAppLite/root/system/security/users.atr
rename users.atr to users_bak.atr
/u01/app/MwHome/instances/instance1/bifoundation/OracleBIPresentationServicesComponent
/coreapplication_obips1/catalog/SampleAppLite/root/system/security/users.atr
STEP 3:
Start the opmnctl componenet
STEP 4:
Try to different browser
B. Unable to create a system user connection to BI Server while running user
population queries" Presentation Server Fails To Start
After configuring Windows Services for the OBIEE 11g (11.1.1.5) AdminServer and
BI_Server, the Presentation Server does not start. However, the Presentation Server starts
fine if the AdminServer and BI Managed Server are started via the console or via the Start
BI Services menu.
The repository (rpd) and presentation server catalog (webcat) may also have changed.
After enabling full catalog logging, the following errors are displayed in the Presentation
Server (sawlog.log) logs:
[2011-08-24T11:44:18.000-07:00] [OBIPS] [ERROR:32] []
[saw.security.odbcuserpopulationimpl.getbisystemconnection] [ecid: ] [tid: ] Unable to create
a system user connection to BI Server while running user population queries
Odbc driver returned an error (SQLDriverConnectW).
State: HY000. Code: 10058. [NQODBC] [SQL_STATE: HY000] [nQSError: 10058] A general
error has occurred.
[nQSError: 73006] Cannot obtain Oracle BI Servers from either the primary Cluster Controller
(host.domain) or the secondary Cluster Controller () specified for the clustered DSN.
48. Configure Weblogic AdminServer and BI Managed Servers as Windows services.
Upload new RPD/catalog.
CAUSE
For an undetermined reason, the BISystemUser (trusted user) is corrupted or locked.
SOLUTION
Log into Weblogic Admin Console and change the BISystemUser password.
Click on security realms > myreams > user and group
BISystemUser > Passwords
3. Change password in EM:
Weblogic Domain > right click on bifoundation_domain > Security > Credentials >
oracle.bi.system > system.user > Edit > change the password
49. Shutdown the Admin server, down the entire component in OPMCTL and down
Nodemanger and UP everything again.
C. All Scheduled Jobs Error FAILED_TO_SEND_TO_JOB_QUEUE With null:
java.lang.NullPointerException
BI Publisher (formerly XML Publisher) - Version 11.1.1.5.0 to 11.1.1.7.x [Release
11.1]
Information in this document applies to any platform.
SYMPTOMS
Executing any Scheduled Report Job errors with:
::FAILED_TO_SEND_TO_JOB_QUEUE.::[INSTANCE_ID=slc00qku.us.oracle.com.13627
30515401] [JOB_ID=1004]::
null::
java.lang.NullPointerException
at oracle.xdo.enterpriseScheduler.SchedulerJob.execute(SchedulerJob.java:127)
at oracle.xdo.service.scheduling.impl.quartz.QuartzJob.execute(QuartzJob.java:24)
at org.quartz.core.JobRunShell.run(JobRunShell.java:202)
at
org.quartz.simpl.SimpleThreadPool$WorkerThread.run(SimpleThreadPool.java:534
)
NOTE: The Scheduler Diagnostics fails for JMS Properties
CHANGES
The BISystemUser was deleted and recreated.
50. CAUSE
The Scheduler works with the JMS Messaging service which is controlled by the
BISystemUser.
This user would have been automatically configured at the time of installation.
If this user isn't configured correctly the JMS won't work.
SOLUTION:
1. The BISystemUser needs to be registered as the JMS user:
a. Log into the Weblogic Server Console.
b. Go to Services > Messaging > JMS Modules > BipJmsResource > Security > Policies.
2. The password registered for the BISystemUser in WLS Console > Security Realms
> myrealm > Users and Groups
must MATCH the password for this user in WLS EM Credentials:
a. Log into the WLS Enterprise Manager and in the left frame, go to WebLogic
Domain > bifoundation_domain.
b. Then in the middle frame, select the WebLogic Domain drop down and go to
Security > Credentials.
c. Then expand oracle.bi.system, select system.user and click Edit.
d. Enter the matching password.
3. In the BIP Application, go to Administration > Scheduler Configuration.
Please change the BISystemUser password in Admin console and EM console and
restart the Managed Server and OPMCTL component.
D. Particular OPMNCTL fail to start. Restart particular OPMNCTL.
bash-4.1$ ./opmnctl status
51. Processes in Instance: instance1
---------------------------------+--------------------+---------+---------
ias-component | process-type | pid | status
---------------------------------+--------------------+---------+---------
coreapplication_obips2 | OracleBIPresentat~ | 28389 | Alive
coreapplication_obijh2 | OracleBIJavaHostC~ | 28388 | Alive
coreapplication_obis2 | OracleBIServerCom~ | 28386 | Alive
coreapplication_obiccs1 | OracleBIClusterCo~ | 28387 | Alive
coreapplication_obisch1 | OracleBIScheduler~ | 28385 | Alive
coreapplication_obijh1 | OracleBIJavaHostC~ | 28382 | Alive
coreapplication_obips1 | OracleBIPresentat~ | 28384 | Alive
coreapplication_obis1 | OracleBIServerCom~ | 28383 | Alive
./opmnctl status
./opmnctl stopproc ias-component=coreapplication_obisch1
./opmnctl status
./opmnctl stopall
Start any specific Component
./opmnctl startproc ias-component=coreapplication_obisch1
Stop any specific Component
./opmnctl stopproc ias-component=coreapplication_obisch1
E. Unable to get file lock, will retry in Weblogic.
o> <Management> <BEA-141281> <unable to get file lock, will retry ...>
<Apr 9, 2014 2:14:30 PM BDT> <Info> <Management> <BEA-141281>
<unable to get file lock, will retry ...>
<unable to get file lock, will retry ...>
<unable to get file lock, will retry ...>
Solution:
Enter this location
/u01/app/oracle/product/middleware/user_projects/domains/ucb_flex/servers/AdminServer/tmp
52. And
Remove: rm AdminServer.lok
9. Create a Sample Report generation.
i) Prepare SQL Query
ii) Create Data Model
iii) Create Template
Login to the BI Publisher using User Name and Password.
Click New-> Data Model
53. Click SQL Query then Write the SQL Query.
For Search Parameter , Click (+) Sign and enter parameter name then save.
54. Click Data tab
1) Press view Button
2) Press Save As Sample Data
3) Save Data.
4) For Create Template Data, Press Export Button and Save XML File.
55. Template Create:
1) Open Doc File.
2) Click BI Publisher Tab
3) Click Sample XML button and load Saved XML File.
4) Click Field Button then Put the field value as per the template Requirement.
5) After Finished save .rtf file.
6) Click Create Template in the BI Publisher
58. 10.Create a file based report generation.
Click File Bursting and enter the following code,
SELECT 'All' "KEY",
'CRLRGCRPT' TEMPLATE,
'en-US' LOCALE,
'pdf' OUTPUT_FORMAT,
'FILE' DEL_CHANNEL,
'/u01/ReportFile/soft/'||'All' PARAMETER1,
to_char((select max(LOAD_DATE) GEN_DT from ucbstg.ucb_load_history
),'ddmmrrrr')||'_CRMDCIBFIFTY_'||'All'||'.pdf' PARAMETER2,
to_char((select max(LOAD_DATE) GEN_DT from
ucbstg.ucb_load_history),'ddmmrrrr')||'_CRMDCIBFIFTY_'||'All'||'.pdf OUTPUT_NAME
FROM dual
59. 1) On Template Upload Page Click, Properties Tab and then check the Enable Bursting.
2)Save.
62. 11. Mail Server Setup in BI server.
Login the xmlpserver:
http://IP:9704/xmlpserver/
Click Highlighted Administrator button. Then click EMAIL Button
63. Now Add server you organization EMAIL server IP and port
12. Mail Confirmation after complete a job.
In catalog we show all created report, specify a report
Then Click in notification button
Name IP Port
64. Then click Notify By and put email Address then click submit button
Then provide report name
65. Check Job history
After completed the job you will get mail notification.
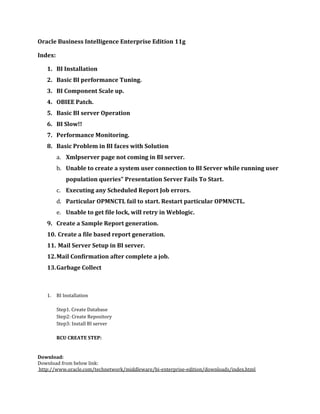
13. Garbage Collect
Garbage collection (GC) is a form of automatic memory management. The garbage
collector, or just collector, attempts to reclaim garbage, or memory occupied by objects that
are no longer in use by the program, by default Weblogic server automatic do garbage
collect, but you can collect manually to increase Heap Free Current to boost OBIEE
performance.
Select bi_server1 monitoring performance Garbage Collect