Dividend Policy and Dividend Decision Theories.pptx
Fin361 c03
1. 42
3. RATIO ANALYSIS
Objectives: After reading this chapter, you will be able to
1. Construct simple financial statements of a firm.
2. Use ratio analysis in the working capital management.
3.1 Balance Sheet Model of a Firm
Business firms require money to run their operations. The investors provide this money,
or capital. This is mutually beneficial to the firms and to the investors. The investors get a
reasonable return on their investment, and the firms get the badly needed capital.
Primarily, the firms employ two forms of capital: the debt capital and the equity capital.
The firms acquire the capital from two types of investors; the bondholders provide the
debt capital and the stockholders the equity capital. From the perspective of the investors,
the risk of these investments is different, the bonds being the safer investment relative to
the stocks. Similarly, the firms bear more risk when they issue bonds, because the firms
must pay interest on the bonds when it is due.
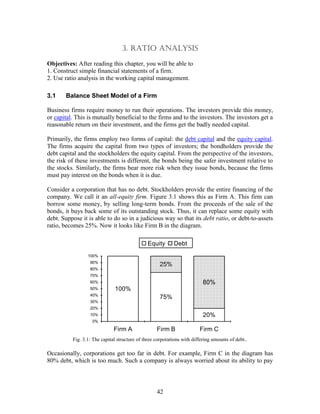
Consider a corporation that has no debt. Stockholders provide the entire financing of the
company. We call it an all-equity firm. Figure 3.1 shows this as Firm A. This firm can
borrow some money, by selling long-term bonds. From the proceeds of the sale of the
bonds, it buys back some of its outstanding stock. Thus, it can replace some equity with
debt. Suppose it is able to do so in a judicious way so that its debt ratio, or debt-to-assets
ratio, becomes 25%. Now it looks like Firm B in the diagram.
0%
10%
20%
30%
40%
50%
60%
70%
80%
90%
100%
Firm A Firm B Firm C
75%
20%
25%
80%
100%
Equity Debt
Fig. 3.1: The capital structure of three corporations with differing amounts of debt..
Occasionally, corporations get too far in debt. For example, Firm C in the diagram has
80% debt, which is too much. Such a company is always worried about its ability to pay
2. Working Capital Management 3. Ratio Analysis
_____________________________________________________________________________
43
interest to the bondholders. If it is unable to pay interest on time, the bondholders can
force it into bankruptcy. It is the possibility of bankruptcy that makes it a risky company.
Figure 3.1 shows the relative amounts of money invested by the two types of investors,
the stockholders, and the bondholders. Their stakes in the company are represented by the
two areas, white and gray. We know that the company should employ the debt and the
equity in proper proportions. Too much debt can lead to financial failure of a company.
The capital is invested in the assets of the firms. If the debt capital is B, and the equity
capital S, then the total capital of the company is B + S. This must also be equal to the
total value of the company, V,
V = B + S (3.1)
Now we may look at the financial condition of a company from a different angle. This
time we look at its balance sheet. The balance sheet of a company lists its assets and
liabilities at a particular time. For example, we may be looking at the balance sheet of a
company as of December 31, 1998. The stockholders equity, or just equity, by definition,
is
Stockholders Equity = Assets − Liabilities (3.2)
When a corporation is set up, it clearly spells out the rights and expectations of both types
of investors. The bondholders are lending their money to the corporation at a certain rate
of interest. They expect to receive their interest on time, along with the final payment of
the bonds when they mature. The stockholders cannot demand dividends from the firm.
The stockholders, even though they are owners of the firm, have limited liability in case
the company gets into serious financial or legal difficulties. They are also the holders of a
call option on the assets of the firm, with an exercise price equal to the face value of the
bonds of a company. In case of liquidation, they receive whatever the company is left
with after all other creditors are satisfied. In this sense, they are the last ones in line to
receive the benefits from the company. This concept leads us to equation (3.2). We may
rewrite this equation as
Assets = Liabilities + Equity (3.3)
This is exactly the same as (3.1). The above equation may also be represented by a pie
chart, with two pieces belonging to the stockholders and bondholders. The total value of
the assets of the firm is simply the whole pie, the sum of liabilities and equity.
What makes up the assets of a firm? First, the obvious physical ones: buildings and lands;
factories and warehouses; machinery and equipment; inventories of merchandise and
finished goods. Second, we consider the financial assets: money in checking accounts and
marketable securities; the money it expects to receive from its customers. The less
obvious assets include the expertise of its managers, the quality of its products, and the
reputation of its brand name.
3. Working Capital Management 3. Ratio Analysis
_____________________________________________________________________________
44
The liabilities of a firm include the money it has borrowed from bondholders, and other
lenders. It also includes the money it owes to its suppliers, or any other unpaid bills.
Accountants spend a considerable amount of effort in classifying and measuring the
assets and liabilities of a corporation.
Assets Liabilities and
Equity
Current
Assets
Current
Liabilities
Long-term
Assets
Long-term
Liabilities
and Equity
Fig. 3.2. A snapshot of the corporation's financial condition on a given date
One way to classify the assets and liabilities is whether they are long-term, or short-term.
The distinction between long-term and short-term is rather arbitrary. Generally, the assets
that are going to last for more than a year are considered to be long-term assets.
Similarly, long-term liabilities are due after more than a year. Based on this
differentiation, we may slice the balance sheet into four quadrants, as indicated in the
following diagram. Again, it is just an aid in visualizing the capital structure of a
corporation, with the added dimension of time.
Assets Liabilities and Equity
Current Assets
Cash
Marketable Securities
Accounts Receivable
Inventories
Current Liabilities
Accounts Payable
Accruals
Notes Payable
Long-term Assets
Plant and Equipment
Less Accumulated
Depreciation
= Net Plant and Equipment
Long-term Liabilities
Long-term bonds
Owners' Equity
Common Stock
Preferred Stock
Retained Earnings
Total Assets Total Liabilities and Equity
Fig. 3.3: A more detailed picture of assets and liabilities
Figure 3.3 shows the financial condition of a company in terms of its assets and
liabilities, but classifies them whether they are short-term or long-term.
4. Working Capital Management 3. Ratio Analysis
_____________________________________________________________________________
45
Next, we fill out additional details in the picture. We may do so by looking at the assets
and liabilities more closely. In the above table, the assets are listed in order of their
accounting liquidity, that is, the ease with which the assets can be converted into cash.
Cash is the lifeblood of a corporation. If a company does not have enough cash on hand
to pay its workers on time, or its suppliers, it can run into serious problems. This can lead
to a liquidity crisis, otherwise known as a cash crunch. Careful management of the cash
position of a company is one of the basic problems in the working capital management.
Let us revisit equation (3.3) to develop another important concept, namely the cash
equation. Let us write
Assets = Liabilities + Equity (3.3)
as follows:
Cash + Current assets (except cash) + Fixed assets
= Short-term liabilities + Long-term debt + Equity
Rearranging terms, we find
Cash = Short-term liabilities + Long-term debt + Equity − Fixed assets
− Current assets (except cash) (3.4)
The above equation isolates cash as one factor, and the other financial parameters that
cash depends upon. By examining the above equation, we notice, for example, increasing
long-term debt and equity will increase the cash position of a company. Further,
increasing the fixed assets, or the net working capital (except cash) will decrease the cash
position of a company.
3.2 Net Working Capital
By definition, the net working capital of a company is the difference between the current
assets and the current liabilities of a firm:
Net working capital = Current assets – Current liabilities (4.1)
The changes in current assets and current liabilities will create a change in the net
working capital of a company. We also recall that the four main items in the current
assets of a firm are: (1) cash (3) accounts receivable
(2) marketable securities (4) inventories
The three principal items in the current liabilities are:
(1) accounts payable, (2) accrued wages, taxes, and other accrued expenses,
(3) notes payable.
Any change in these seven items will lead to a change in the net working capital of a
corporation.
5. Working Capital Management 3. Ratio Analysis
_____________________________________________________________________________
46
3.3 Ratio Analysis
It is possible to look at the financial health of a corporation by looking at some of its key
financial ratios. Ratio analysis can also be used as a diagnostic tool to find the sources of
financial trouble at a company.
The ratios may be divided into these types:
1. Liquidity ratios focus on the availability of cash for operations.
2. Asset management ratios evaluate the efficient utilization of the resources.
3. Debt management ratios keep track of debt to be within reasonable bounds, and keep
the debt level at its optimal level.
4. Profitability ratios measure the degree of accounting profits.
5. Market value ratios help investors discriminate between overvalued and undervalued
securities while making investment decisions.
Let us review these ratios and their significance.
Liquidity Ratios:
First we look at the liquidity ratios of a company. These ratios focus on the availability of
cash to manage the day-to-day operations of the company. In particular, we define the
current ratio as
Current ratio =
Total current assets
Total current liabilities
(3.5)
The current ratio of a company gives us a quick way to look at its current assets and
current liabilities. They should be nearly equal to one another. Next, we look at a more
stringent ratio that gives us the cash position of the firm more accurately by removing the
value of the inventories from the current assets. This gives us the quick ratio, or the acid
test ratio, as follows:
Quick, or Acid Test, ratio =
Current assets inventories
Current liabilities
(3.6)
Asset Management Ratios:
The asset management ratios evaluate the efficiency of use of the principal assets of a
company, such as its inventory.
Inventory Turnover =
Cost of goods sold
Inventories (average) (3.7)
6. Working Capital Management 3. Ratio Analysis
_____________________________________________________________________________
47
This ratio measures the efficient use of inventories. A firm should have a high turnover
ratio, which is managed through a small amount of inventories. This means that a firm
should have a small inventory and try to sell it as quickly as possible. Unfortunately, a
small inventory also means lower sales.
Closely related to the inventory management is the management of receivables. A
company should have a small amount invested in the receivables. That is, the company
should try to sell the goods for cash. To measure the efficiency of this operation, we
define the Days Sales Outstanding as
Days sales outstanding =
Receivables
Sales per day
(3.8)
A broader measure of the efficiency of use of assets is the fixed assets turnover. This
ratio is defined as follows.
Fixed assets turnover =
Annual sales
Net fixed assets (average)
(3.9)
Some corporations have a huge investment in fixed assets, plant and equipment. This is
the case of electric utilities or real estate investment trusts, for instance. Other
corporations, such as software development companies, may have a rather small
investment in equipment. It is proper to compare firms with one another that are in the
same line of business.
A broader measure of asset utilization is the following ratio
Total assets turnover =
Annual sales
Total assets (average)
(3.10)
This ratio looks at the aggregate assets of a company and measures the way the company
utilizes them.
Debt Management Ratios:
The corporations borrow money to do their business because debt capital is cheaper than
the equity capital. On the other hand, excessive amount of debt can create problems for
the company. To see the debt level of a company, we define its debt ratio, or leverage
ratio as follows
Debt ratio =
Total debt
Total assets
(3.11)
Of course, the companies must maintain their debt at an optimal level.
Another ratio that looks at the ability of a company to pay its interest when due is its
interest coverage ratio, or times interest earned. This is defined as
7. Working Capital Management 3. Ratio Analysis
_____________________________________________________________________________
48
Interest coverage =
EBIT
Interest charges
(3.12)
If this ratio is 4, then for each dollar of interest due, the company has $4 available. This is
a fairly safe ratio, and the probability of default is quite low.
Profitability Ratios:
The next set of ratios measure the ability of a company to generate profits. These ratios
are of interest to investors who would like to invest in the most profitable companies
around. The first ratio is the net profit margin, defined as
Net profit margin =
Net income
Total operating revenue
(3.13)
In this ratio, net income is defined to be the income after taxes, available to the
stockholders of the company.
The next ratio looks at the profitability from the point of view of the management of a
firm. In this case, the denominator is EBIT, meaning earnings before interest and taxes. If
the EBIT is too small, then the financial managers at a corporation will have difficulty in
paying the interest on time. We define gross profit margin as follows:
Gross profit margin =
EBIT
Total operating revenue
(3.14)
Another ratio that the investors like to review is net return on assets. We may define it as
Net return on assets =
Net income
Total average assets
(3.15)
The similar ratio that the management wants to review is gross return on assets, defined
as follows
Gross return on assets =
EBIT
Total average assets
(3.16)
The stockholders are particularly interested in the following three ratios. First, return on
common equity, that measures the return to the stockholders on stockholders' investment
in the company. This is defined as
Return on common equity =
Net income to stokholders
Average common equity
(3.17)
Second, is the dividend payout ratio. This represents the fraction of money paid to the
stockholders out of the income after taxed. We may define it as
8. Working Capital Management 3. Ratio Analysis
_____________________________________________________________________________
49
Dividend payout ratio =
Total cash dividends
Net income
(3.18)
The dividend payout ratio is important to the management as well. They cannot afford to
pay large dividends when the company needs the money to finance new profitable
projects. The growth of a company depends upon the retention rate, that is, the money
that is not paid out as dividends. We define the third quantity, the sustainable growth rate
as
Sustainable growth rate = ROE Retention ratio (3.19)
where ROE stands for the return on equity for a firm.
Market Value:
From an investor's point of view, it is important to see the difference between the market
value of the stock of a company, and its accounting value, or book value. To get a
perspective on this difference, we define the Market/Book ratio as
Market/Book ratio =
Market price/share
Book value/share
(3.21)
Investors, hunting for bargains, like to see this ratio as small as possible. We complete
our list by including two more ratios, defined as follows:
P-E ratio =
Market price/share
Earnings/share
(3.22)
and
Dividend yield =
Dividend per share
Market price per share
(3.23)
3.4 Sources of Information
Internet is by far the best source of information. There are many sources of information
on the Internet. The information is quite reliable, current, and accurate. If you cannot find
it on the Internet, there are still several print media to fall back on. The information about
Microsoft was taken from the Internet. You may want to check the following sources:
Internet
http://cbs.marketwatch.com
http://www.yahoo.com
http://www.google.com
Print
The Wall Street Journal
The New York Times
Standard and Poors
9. Working Capital Management 3. Ratio Analysis
_____________________________________________________________________________
50
Microsoft Profile, January 1, 2001
One Microsoft Way
Redmond, WA 98052 Tel: (452) 882-8080, Fax: (425) 936-7329
Website - http://www.microsoft.com
Company Calendar
Earnings report announcement: January 15, 2001
Profile
Microsoft Corporation, incorporated in 1981, develops, manufactures, licenses and supports a wide range
of software products for a multitude of computing devices. Microsoft software includes scalable operating
systems for servers, personal computers (PCs) and intelligent devices, server applications for client/server
environments, knowledge worker productivity applications, and software development tools. The
Company's online efforts include the MSN network of Internet products and services and alliances with
companies involved with broadband access and various forms of digital interactivity. Microsoft also
licenses consumer software programs, sells hardware devices, provides consulting services, trains and
certifies system integrators, and researches and develops advanced technologies for future software
products.
The Company is divided into three main areas: the Business Divisions, the Sales, Marketing and Support
Group, and the Operations Group. The Business Divisions work in close partnership in order to create
powerful software services and solutions built around the Internet, Windows and new devices. The product
segments, based on these business divisions, are the Windows Platforms segment, the Business
Productivity Applications and Developer segment, and the Consumer and other segment. The Sales,
Marketing and Support Group is responsible for building long-term business relationships with original
equipment manufacturers (OEMs), enterprises, small and medium-sized businesses, application developers,
educational institutions and consumers. Enterprises are offered tailored license programs, enterprise-wide
support, consulting services and other specialized services. The Operations Group is responsible for
managing business operations and overall business planning. This includes the process of manufacturing
and delivering finished goods and licenses, corporate functions such as finance, administration, human
resources and legal.
Windows Platforms
The Windows Platforms segment is responsible for the development of PC and server platforms, including
the Microsoft Windows and Windows 2000 operating systems. The segment is also responsible for
developing the Microsoft Internet Explorer browsing software and Microsoft Windows Media
Technologies. Specific products of the Windows Platforms segment include the Windows Millennium
Edition (Me) operating system, Windows 2000 Professional operating system, Windows NT Workstation
and Windows 2000 Server, Advanced Server and Datacenter Server. Other products in this segment include
Windows NT Server, other servers (Microsoft Proxy Server, Microsoft SNA Server and Microsoft Systems
Management Server), and Windows Media Technologies.
Productivity Applications and Developer
The Productivity Applications and Developer segment has two primary divisions, the Business Productivity
Group and the Developer Group. The Business Productivity Division delivers integrated business
productivity solutions for the knowledge worker, including the Office family of products, other desktop
applications, server applications and the Windows CE operating system for productivity appliances.
Specific products include the Microsoft Office (Microsoft Word, Microsoft Excel, Microsoft Outlook,
Microsoft PowerPoint, Microsoft Access, etc), other desktop application products (such as Microsoft
Project, Microsoft Visio and Microsoft Publisher), server applications (Microsoft BackOffice family of
servers), Microsoft Exchange Server, Windows CE and bCentral.
10. Working Capital Management 3. Ratio Analysis
_____________________________________________________________________________
51
The Developer Group provides software development tools and distributed application platforms to
developers of Windows-based applications and Internet applications. These products and services empower
independent software developers, corporate developers, solutions developers and Webmasters to create a
broad spectrum of applications. Microsoft Windows Distributed interNet Applications (DNA) Architecture
is the application development model for the Windows platform. Specific products include Developer
Tools (Microsoft Visual C++, Microsoft Visual Basic, Microsoft Visual InterDev), Microsoft Visual J++,
and Microsoft Visual Studio, and the Microsoft SQL Server.
Consumer
The Consumer Group supplies services and content to consumers over the Internet including MSN Internet
Access, WebTV Internet Service, MSN Portal and vertical properties, and develops software and hardware
products that are designed to meet the needs of consumers in the home environment. MSN Internet Access
provides dial-up Internet access, free Web-based e-mail through MSN Hotmail and Microsoft MSN
Messenger Service. WebTV Networks is an online service that enables consumers to experience the
Internet through their televisions via set-top terminals based on WebTV technologies. The MSN Portal
business provides services on the Internet, encompassing the home page as well as the vertical services, and
includes the Microsoft CarPoint online automotive service, Microsoft HomeAdvisor online real estate
service, Expedia, Inc., MSNBC, Microsoft Passport and TransPoint.
Major product categories include learning, productivity, entertainment and hardware peripherals. Learning
titles include Microsoft Encarta multimedia encyclopedia and Microsoft Bookshelf CD-ROM reference
library. Microsoft's productivity offerings include Microsoft Works, Microsoft Money and the Works Suite.
The Company offers a line of entertainment products from classical software games to online games
(Microsoft Internet Gaming Zone), simulations, sport products and strategy games. These products include
the Microsoft Flight Simulator, Combat Flight Simulator, Age of Empires, Monster Truck Madness racing
simulation, Microsoft Baseball, Microsoft Links and other sports and action titles. Hardware peripherals
include the Microsoft Mouse, Microsoft IntelliMouse, Microsoft Natural Keyboard and Microsoft
SideWinder game controllers.
Microsoft Press
Microsoft Press offers comprehensive learning and training resources to help new users, power users and
professionals get the most from Microsoft technology through books, CDs, self-paced training kits and
videos that are created to accommodate different learning styles and preferences. Microsoft Press books are
authored by professional and technical writers, Microsoft employees and independent authors. Books are
marketed by independent sales representatives and by Microsoft Press sales personnel. Internationally,
Microsoft Press has numerous agreements with publishers for the worldwide distribution of its books.
Microsoft Press has granted a publisher in England the right to distribute English language versions of its
books in all countries except the United States, Canada, Latin America and certain Asian countries.
The Company's sales and marketing group seeks to build long-term relationships with customers of
Microsoft products. The OEM sales group includes the sales force that works with original equipment
manufacturers that preinstall Microsoft software on their PCs. In addition to the OEM channel, Microsoft
has three major geographic sales and marketing organizations: the South Pacific and Americas, Europe,
Middle East and Africa, and Asia. The Company's customers include consumers, small and medium-sized
organizations, enterprises, dotcoms, educational institutions, ISPs, application developers and OEMs. Most
consumers of Microsoft products are individuals in businesses, government agencies, educational
institutions and at home.
Microsoft's most significant competitors include IBM, Sun Microsystems, Oracle and AOL.
11. Working Capital Management 3. Ratio Analysis
_____________________________________________________________________________
52
Microsoft Profile, January 1, 2001
Ratios & Statistics
Ratios Company Industry S&P 500
P/E Ratio (TTM) 27.81 28.93 32.46
P/E High - Last 5 Yrs. 86.12 85.56 48.25
P/E Low - Last 5 Yrs. 32.43 27.35 17.13
Beta 1.80 1.71 1.00
Price to Sales (TTM) 11.67 17.04 5.48
Price to Book (MRQ) 5.77 13.25 7.84
Price to Tangible Book (MRQ) 5.77 16.20 11.63
Price to Cash Flow (TTM) 26.07 28.65 25.43
Price to Free Cash Flow (TTM) 20.86 45.99 45.81
% Owned Institutions 41.01 38.20 57.72
Dividends Company Industry S&P 500
Dividend Yield 0.00 0.27 1.60
Dividend Yield - 5 Year Avg. 0.00 0.02 1.26
Dividend 5 Year Growth Rate - ( 10.39) 8.87
Payout Ratio 0.00 0.21 24.73
Growth Rates (%) Company Industry S&P 500
Revenue (MRQ) vs Qtr 1 Yr. Ago 7.73 37.28 22.83
Revenue (TTM) vs TTM 1 Yr Ago 16.25 40.76 22.34
Revenue - 5 Yr. Growth Rate 30.46 43.19 19.73
EPS (MRQ) vs Qtr. 1 Yr. Ago 17.72 34.94 31.16
EPS (TTM) vs TTM 1 Yr. Ago 17.78 19.15 26.31
EPS - 5 Yr. Growth Rate 42.42 47.91 20.41
Capital Spending - 5 Yr. Growth Rate 12.17 20.35 17.18
Financial Strength Company Industry S&P 500
Quick Ratio (MRQ) 3.00 2.99 1.21
Current Ratio (MRQ) 3.37 3.22 1.71
LT Debt to Equity (MRQ) 0.00 0.11 0.60
Total Debt to Equity 0.00 0.12 0.91
Interest Coverage (TTM) - ( 12.55) 10.65
Profitability Ratios (%) Company Industry S&P 500
Gross Margin (TTM) 86.53 77.35 50.12
Gross Margin 5 Yr. Avg. 2.23 74.98 48.27
EBITD Margin (TTM) 49.54 25.17 23.77
EBITD - 5 Yr. Avg. 47.92 23.78 21.69
Operating Margin (TTM) 46.74 19.38 18.53
Operating Margin 5 - Yr. Avg 42.91 16.07 17.64
12. Working Capital Management 3. Ratio Analysis
_____________________________________________________________________________
53
Profitability Ratios (%) Company Industry S&P 500
Pre-Tax Margin (TTM) 63.35 9.00 18.49
Pre-Tax Margin - 5 Yr. Avg. 50.18 21.62 16.86
Net Profit Margin (TTM) 41.98 23.41 13.07
Net Profit Margin - 5 Yr. Avg. 32.62 13.23 10.64
Effective Tax Rate (TTM) 33.74 36.86 34.64
Effective Tax Rate - 5 Yr. Avg. 35.10 35.23 35.38
Management Effectiveness (%) Company Industry S&P 500
Return On Assets (TTM) 20.11 17.21 9.83
Return On Assets 5 Yr. Avg. 24.86 12.33 8.55
Return On Investment (TTM) 25.17 6.86 13.76
Return On Investment - 5 Yr. Avg. 24.86 24.58 13.57
Return on Equity (TTM) 25.61 7.17 23.16
Return on Equity - 5 Yr. Avg. 35.09 28.90 22.06
Efficiency Company Industry S&P 500
Revenue/Employee (TTM) 597,749.00 394,756.81 677,268.23
Net Income/Employee (TTM) 250,921.00 167,225.70 103,161.13
Receivable Turnover (TTM) 7.89 6.29 8.76
Inventory Turnover (TTM) - 26.85 9.53
Asset Turnover (TTM) 0.48 0.68 0.99
MRQ = Most Recent Quarter, TTM = Trailing Twelve Months
Note: Reported in Thousands of U.S. Dollars
Key Terms
Accounts payable, 31
Accounts receivable, 31
Accruals, 31
all-equity firm, 29
Asset management ratios, 32
Assets, 30
Balance sheet, 29
Bondholders, 29
Capital, 29
Cash, 31
Common stock, 31
Debt capital, 29
Debt management ratios, 33
debt ratio, 29
Equity, 30
Equity capital, 29
Inventories, 31
Liabilities, 30
Liquidity, 32
Liquidity crisis, 32
Liquidity ratios, 32
Long-term bonds, 31
Market value ratios, 33
Marketable securities, 31
Notes payable, 31
Preferred stock, 31
Profitability ratios, 33
Retained earnings, 31
Risk, 29
Stockholders, 29
Examples
3.1. Danube Trucking and Storage Company had revenue of $11.12 million in 1999 from
transportation operations, and $1.23 million in warehousing fees. The main expenses
were, diesel fuel $2.55 million, salary of the truck drivers $6.96 million, truck repairs
$1.03 million, tires and other parts $1.73 million. The company had depreciation of $1.45
million. The company has a $2.5 million note at the bank, with 8% interest rate. The
company had income tax rate of 28%. Prepare an income statement of Danube.
13. Working Capital Management 3. Ratio Analysis
_____________________________________________________________________________
54
Revenues $ million
Transportation 11.12
Warehouse fees 1.23
Total Revenues 12.35
Expenses $ million
Diesel fuel 2.55
Salaries 6.96
Repairs 1.03
Tires, parts 1.73
Depreciation 1.45
EBIT 12.35 13.72 = 1.37
Interest .08*2.5 = 0.2
EBT 1.57
Taxes paid 0
Earnings after taxes 1.57
Note that the depreciation is a non-cash expense. The company had to use some of its
cash reserves, or perhaps sell marketable securities to pay the $0.2 million in interest. The
company had a net loss of $1.57 million.
3.2. Elbe Chemical Company sold 8672 tons of ammonium sulfate in 1999 at $155 a ton.
The production cost of the chemical was $102 a ton, on the average. Mr. Elbe, the owner,
took a salary of $55,000, while the workers were paid $283,000. The company paid
$24,000 in warehouse rent, and $38,000 in office expenses. The company has a $100,000
note at the bank, with 8% interest rate. The company had income tax rate of 28%. Prepare
an income statement of Elbe.
A compact income statement is shown as following.
Elbe Chemical Company
Income Statement, 1999
Quantity Calculation Amount
Revenues 8672 tons * $155/ton $1,344,160
Production cost 8672 tons * $102/ton -$884,544
Salaries Owner $55,000
Workers $283,000 -$338,000
Rent -$24,000
Office expense -$38,000
EBIT $59,616
Interest $100,000 @ 8% -$8,000
EBT $51,616
Income tax .28 * EBT -$14,452
Net income $37,164
14. Working Capital Management 3. Ratio Analysis
_____________________________________________________________________________
55
3.3. The following information is available about Don Company.
Accounts payable $10 million
Accounts receivable $5.48 million
Average inventory $30 million
Buildings and land ?
Cash $5 million
Cost of goods sold $80 million
EBIT $18 million
Long-term bonds $25 million with 10% coupon
Price per share $72
Price/Earnings ratio 18
Stockholders equity ?
Total assets $100 million
Total sales $125 million
(A) Calculate the following:
1. Days sales outstanding
2. Interest coverage ratio
3. Debt ratio
4. Inventory turnover ratio
5. Earnings per share
(B) Prepare a balance sheet for Don Company.
(A) 1. By definition,
Days sales outstanding =
Receivables
Sales per day
= 365×
Receivables
Annual sales
= 365*5.48/125 = 16 days ♥
2. By definition, Interest coverage ratio =
EBIT
Interest charges
= 18/(25*.1) = 7.2 ♥
3. By definition, Debt ratio =
Total debt
Total assets
= 25/100 = 25% ♥
The debt of a corporation consists of its long-term bonds, and its short-term notes.
Although a company may also have other short-term obligations, such as accounts
payable, they are not included in its debt.
4. By definition, Inventory turnover =
Cost of goods sold
Inventories (average)
= 80/30 = 2.67 ♥
5. By definition, Earnings/share =
Market price/share
P-E ratio
= 72/18 = $4 ♥
15. Working Capital Management 3. Ratio Analysis
_____________________________________________________________________________
56
(B)
Don Company
Current Assets $million Current Liabilities $million
Cash
Accounts receivable
Inventory
Total current assets
5.00
5.48
30.00
40.48
Accounts payable
Total current liabilities
10.00
10.00
Long-term Assets Long-term liabilities
Buildings & land 59.52 Bonds (B)
Stockholders equity (S)
25.00
65.00
Total assets (V) 100.00 Total (B + S) 100.00
The above balance sheet has the following features:
1. It is simple and easy to read. It has all items given in the problem and includes the
unknown quantities, buildings and land, and stockholders equity.
2. It separates the items in terms of time: long-term and short-term.
3. It shows that the total assets of the company are equal to its liabilities and stockholders
equity.
3.4. The following information is available about Dnieper Company.
Number of shares = 100,000 Income tax rate = 30%
EBIT = $200,000 Price per share = $4.20
Long-term debt = $1 million Coupon rate on bonds = 8%
Find its (A) P/E ratio, (B) Interest coverage ratio, and (C) Debt ratio
(A) The interest on the bonds is .08*1,000,000 = $80,000. From EBIT, we first pay the
interest on the bonds. This gives us 200,000 – 80,000 = $120,000. This is earnings before
taxes. The taxes due on this amount are .3*120,000 = $36,000. After paying taxes, we are
left with 120,000 – 36,000 = $84,000. This is earnings after taxes. If we divide it by the
number of shares, 100,000, we get the EPS as 84,000/100,000 = $0.84.
A short-cut method is to use the formula
EPS =
(EBIT − I)(1 − t)
N
=
(200‚000 − .08*1‚000‚000)(1 − .3)
100‚000
= $0.84
The P/E ratio is $4.20/$0.84 = 5 ♥
(B) The interest coverage ratio is EBIT/I = 200,000/80,000 = 2.5 ♥
The total assets of the firm = total debt + total equity = 1,000,000 + 4.2*100,000 =
$1,420,000
16. Working Capital Management 3. Ratio Analysis
_____________________________________________________________________________
57
The debt ratio =
total debt
Total assets
=
1‚000‚000
1‚420‚000
= 70.42% ♥
Problems
3.5. Income statement: Drava Salt Company sold 8672 tons of common salt in 2008 at
$55 a ton. The purchase price of the salt was $32 a ton, on the average. Mr. Drava, the
owner, took a salary of $55,000, while the workers were paid $63,000. The company paid
$24,000 in warehouse rent, and $10,000 in office expenses. The company has a $100,000
note at the bank, with 8% interest rate. The company had income tax rate of 33%. Prepare
an income statement of Drava Salt.
3.6. Balance sheet: Prepare the balance sheet of Isar Company using the following data:
Accounts payable $6,000
Accounts receivable 8,000
Accumulated retained earnings 6,000
Bonds payable 7,000
Capital surplus 19,000
Cash 4,000
Machinery 34,000
Patents 82,000
Taxes payable 2,000
3.7. Balance sheet: A portion of Maritsa Company's balance sheet as of 12/31/2008 is
shown below:
12/31/2008 12/31/2009
Long-term debt $50 million
Preferred stock $30 million
Common stock $100 million
Retained earnings $20 million
In 2009, the company sold $10 million of new bonds, but also bought back $5 million of
its common stock. It had net income of $14 million, and paid out $4 million in dividends.
Indicate the changes in its balance sheet as of 12/31/2009.
3.8. Cash flows: We have the following information about Moselle Company:
Moselle Company
Income statement 2008
Revenues $800
Expenses 500
Depreciation 100
Net Income 200
Dividends 100
17. Working Capital Management 3. Ratio Analysis
_____________________________________________________________________________
58
Balance Sheet, Moselle Company
Assets 12/31/08 12/31/07
Current assets $300 $200
Net fixed assets 400 200
Total assets $700 $400
Liabilities and equity 12/31/08 12/31/07
Current liabilities $150 $100
Long-term debt 150 0
Stockholders' equity 400 300
Total liabilities and equity $700 $400
A. Find the change in the net working capital in 2008.
3.9. Cash position: Indicate whether the following actions will increase, decrease, or
make no change in the cash position of Neva Company:
1. The firm collects payments from previous sales.
2. The company buys a piece of machinery by using long-term debt.
3. The company buys raw material for inventory on credit.
4. The company issues common stock.
5. The firm sells merchandise on credit.
6. The company declares a dividend.
7. The company purchases raw materials for inventory and pays in cash.
8. The firm pays interest on long-term debt.
9. This year's tax liability is increased.
10. The firm pays last year's taxes.
11. The firm uses retained earnings to buy marketable securities.
12. The corporation buys a piece of furniture using a short-term note.
13. The company increases the allowance for bad debts.
14. The company buys back its own stock.
15. The firm borrows on a short-term note.
16. The company pays for a previous purchase.
17. The company sells some merchandise for cash.
18. The firm increases the accumulated depreciation.
19. The firm gives away some merchandise to charity.
20. The firm receives an insurance payment after a fire loss.
3.10. Financial ratios: The following information is available about Rhine Company.
EBIT = $800,000 Income tax rate = 30%
Total assets = $10 million Coupon rate on bonds = 8%
Number of shares = 200,000 Long-term debt = $4 million
Dividend payout ratio = 50% Short-term assets = $2 million
Short-term liabilities = $1 million
Find its (A) Current ratio, (B) Dividend per share, and (C) Price per share
(A) 2 (B) $0.84 (C) $25 ♥
18. Working Capital Management 3. Ratio Analysis
_____________________________________________________________________________
59
3.11. Financial ratios: The following information is available about Seine Company.
Number of shares = 400,000 Long-term debt = $6 million
EBIT = $3 million Income tax rate = 35%
Total assets = $18 million Coupon rate on bonds = 6%
Short-term liabilities = $2 million Average inventory = $1.5 million
COGS = $6 million
Find its (A) Inventory turnover ratio 4.00 ♥
(B) Interest coverage ratio 8.333 ♥
(C) Earnings per share $4.29 ♥
(D) Price per share $25.00 ♥
(E) P-E ratio 5.83 ♥
3.12. Financial ratios: The following information is available about Marne Company for
2010. All sales are on credit.
Average cash and marketable securities = $1 million EBIT = $2 million
Average inventory = $5 million COGS = $15 million
Average accounts payable = $3 million Long-term bonds = $8 million
Average accounts receivable = $3 million Coupon rate on bonds = 10%
Total Sales = $20 million
Find its (A) Inventory turnover ratio 3.00 ♥
(B) Number of days sales outstanding 54.75 days ♥
(C) Interest coverage ratio 2.50 ♥
(D) Current ratio 3.00 ♥
(E) Quick ratio 1.333 ♥
3.13. Financial ratios: Ider Corp expects to have $3.73 as earnings per share next year.
The cost of equity for Ider is 16%, whereas its dividend yield is 4%. The price per share
of Ider is $40. Find its dividend payout ratio. Find its current P/E ratio.
DPR = 42.9%, P/E = 12.01 ♥
3.14. Financial ratios: Archer Corporation has 12 million shares of common stock
selling at $30 each. Archer has a dividend payout ratio of 55%, and its dividend per share
is $2.50. It has no debt and its tax rate is 32%. Find the EBIT of Archer. $80.214 million ♥
3.15. Financial ratios: Capricorn Company has income tax rate of 40% and its expected
EBIT next year is $4.4 million. It has $12 million (face value) of bonds with a coupon of
9%, and has 3 million shares of common selling at $10 each. Calculate the expected
price-earnings ratio for Capricorn. 15.06 ♥
3.16. Financial ratios: James Corp has EBIT of $40 million. It has $50 million in debt at
8% average interest rate, and 45% dividend payout ratio. James has $12.276 million in
retained earnings from its current EBIT. Find the income tax rate of James. 38% ♥
19. Working Capital Management 3. Ratio Analysis
_____________________________________________________________________________
60
3.17. Financial ratios: Athol Corp has EBIT of $45 million and has 12 million shares of
stock. It has $120 million face value of bonds with a coupon of 11%, and its tax rate is
32%. If its P-E ratio is 12, find the price of one share of stock. $21.62 ♥
3.18. Financial ratios: Andover Co has debt/assets ratio of .35, and its tax rate is 32%.
Andover has 2 million shares, each selling for $25. The Andover bonds have a coupon of
8% and they sell at par. If the EPS of Andover is $2, find its EBIT. $8.036 million ♥
3.19. Financial ratios: Evans Co has dividend payout ratio of 65% and tax rate of 30%.
It has paid $18 million in interest, and $4 dividend per share for this year. If Evans has 6
million shares, find its EBIT for the current year. $70.747 million ♥
3.20. Financial ratios: Everly Co has EBIT of $40 million and P-E ratio of 12. The total
value of the stock of Everly is $240 million, and it has to pay $10 million in interest. Find
the income tax rate of Everly. 33.33% ♥
3.21. Financial ratios: Colombo Corporation has EBIT of $4.4 million, tax rate 30%,
and 60% dividend payout ratio. Colombo pays $1.68 million in total dividends and has $4
million in debt. Find the cost of debt for Colombo. 10% ♥
3.22. Which two of the following would be preferable to the bondholders of a company?
I. A debt ratio of 50% rather than 20%
II. A debt ratio of 20% rather than 50%
III. A times-interest-earned of 2.0 rather than 5.0
IV. A times-interest-earned 5.0 rather than 2.0
(A) I and III
(B) I and IV
(C) II and III
(D) II and IV
3.23. All else being equal, which of the following will increase a company’s current
ratio?
(A) An increase in accounts receivable.
(B) An increase in accounts payable.
(C) An increase in net fixed assets.
(D) A decrease in long-term debt.
3.24. Mini-Case: The information about Microsoft, given earlier in this chapter, is quite
old. You have just found a good position in the finance department at Microsoft, at their
headquarters office in Redmond, WA. Your first assignment is to find the current values
of the financial ratios. You should focus on the ratios related to the short-term financial
management of the company. Do you find any significant changes in these values,
compared to the numbers for 2001? Comment on the significance of these changes.