Portland, Oregon has a comprehensive approach to managing speed for safety. Their work provides a model for other Vision Zero cities to ensure action on this core value of Vision Zero.
31st World Press Freedom Day Conference in Santiago.
Portland Tames Speed for Safety, a Case Study for Vision Zero Cities
1. 1
Managing Speed for
Safety: Critical to
Vision Zero Success
One of the most important tenets of Vision
Zero is its focus on managing speed for the sake
of safety. This is a core part of Vision Zero’s
Safe Systems approach, which recognizes that
individuals are going to make mistakes, so the
transportation system should be designed to
protect people, even when mistakes are made.
A simple fact: a person’s chances of surviving a
crash decrease dramatically if they are involved
in a high-speed versus a low-speed crash,
especially if that person is hit while walking or
biking, or if they are more physically vulnerable,
including the elderly and the young. For too
long, this simple fact has been undervalued
or ignored, often due to political or practical
challenges.
Fortunately, this is changing with Vision Zero,
which recognizes that, more often than not, it’s
speed that kills.
We can manage speeds to preserve life — if
we choose to. And an increasing number of
local communities are choosing to do so, filling
longtime leadership gaps at the federal and state
levels.
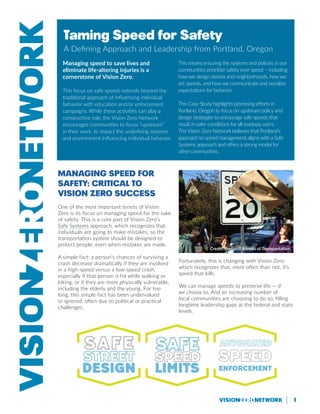
Taming Speed for Safety
A Defining Approach and Leadership from Portland, Oregon
Managing speed to save lives and
eliminate life-altering injuries is a
cornerstone of Vision Zero.
This focus on safe speeds extends beyond the
traditional approach of influencing individual
behavior with education and/or enforcement
campaigns. While these activities can play a
constructive role, the Vision Zero Network
encourages communities to focus “upstream”
in their work, to impact the underlying systems
and environment influencing individual behavior.
This means ensuring the systems and policies in our
communities prioritize safety over speed – including
how we design streets and neighborhoods, how we
set speeds, and how we communicate and socialize
expectations for behavior.
This Case Study highlights promising efforts in
Portland, Oregon to focus on upstream policy and
design strategies to encourage safe speeds that
result in safer conditions for all roadway users.
The Vision Zero Network believes that Portland’s
approach to speed management aligns with a Safe
Systems approach and offers a strong model for
other communities.
Credit: Portland Bureau of Transportation
2. 2
Portland’s High Crash Network identifies the most dangerous streets
for people walking, biking, and driving. The HCN is shown on a map
above, overlapping with the city’s low-income communities and
communities of color (Communities of Concern) based on a composite
index of 10 equity indicators.
Lay the Foundation:
Determine the Role Speed
Plays
Portland, Oregon is among the nation’s leaders in
elevating both the principles and actions of managing
speed for safety. Specifically, Portland’s Bureau of
Transportation (PBOT) is tapping into the trifecta
of speed management strategies to encourage safe
behavior: setting appropriate speed limits, designing
streets to support safe speeds, and operating camera
programs to enforce the posted speed limits.
Upon adoption of Vision Zero in 2015, the City of
Portland identified a High Crash Network (HCN) that
consists of 30 high crash intersections and 30 high
crash streets. The HCN is a compilation of the city’s
most dangerous streets and intersections for people
driving, walking, and bicycling. The HCN represents
eight percent of Portland streets, yet accounts for 57
percent of deadly crashes. (This is a common reality in
many communities, where a relatively small percentage
of streets account for a far greater portion of serious
injury and fatal crashes. Learn more about Vision Zero’s
development of High Injury Networks here.)
As part of its early analysis within its Vision Zero
initiative, Portland staff reviewed the rate of traffic
deaths per mile of posted speed limit, among other data.
One key piece of information stood out: Most traffic
deaths were occurring on streets with higher posted
speed limits, between 35-45 mph, representing 235
miles or almost 9 percent of Portland’s street network
(by centerline) and 45 percent of streets in the HCN.
The finding that more safety problems were happening
on higher speed streets seem obvious, but it is a fact
that too many communities ignore at great peril.
Portland’s early analysis of how speed relates
to severe injury/fatal crashes was important
as PBOT prioritized actions to reduce speeds,
including elevating the following three strategies
in its Vision Zero Action Plan:
» Lower posted speeds. Gain local authority for speed
reduction on City of Portland streets
» Improve street design to support safe speeds
» Install safety cameras on high injury streets
Each of these strategies is detailed below, with
emphasis on setting appropriate speed limits, as this
is a core strategy to Vision Zero where Portland is
taking a particularly strong and promising approach.
Portland’s work can be a model to other communities
questioning outdated practices that undermine safety
priorities.
Most traffic deaths in Portland occur with speeds between
35 and 45 mph
3. 3
Recommendation: Analyze data
early in the Vision Zero process to
understand how speeds impact safety
and use these findings to prioritize
strategies and actions.
Strategy #1: Set Appropriate
Speed Limits
While we know that lowering posted speed limits, alone,
is unlikely to have the full desired safety effect, it can
be an important piece of the speed management puzzle.
At the most basic level, posted speed limits are a key
communication tool influencing drivers’ behavior; they
send important messages about what authorities deem
to be not only the legal speed, but also the appropriate
speed.
In addition – and with greater consequences than most
people probably realize – those same posted speed
limits influence how the roadways are designed.
In most states in the U.S., local communities do not
have full control over how they set speeds on their
roadways. Speed limits in many cities are statutory,
which means they are established through state law,
and as a result, controlled by the state.
Generally, in areas where statutory limits do not fit
specific road, traffic, or land use conditions, local
authorities can establish speed zones and set speed
limits. But even within this framework, the state
often dictates (or at least strongly influences) the
methodology that determines how speeds are set.
Historically, “appropriate” and “safe” speeds in many
states have been determined by using the 85th
Unintended
consequences of the
85th percentile speed
A 2017 study on reducing speeding-related
crashes from the National Transportation Safety
Board (NTSB), the nation’s leading authority
on crashes and prevention, cited speeding as
a national deadly problem -- on par with drunk
driving. In the study, NTSB made numerous
recommendations to national and state authorities
to change outdated policies that contribute to the
dangerous behavior.
Among other policies, NTSB reviewed the history
of speed setting in the U.S., and specifically,
the Federal Highway Administration (FHWA)
requirement (outlined in the Manual on Uniform
Traffic Control Devices) for states and local cities
to use engineering studies that emphasize the use
of 85th percentile speed to change speed limits.
The 85th percentile is based on the free-flowing
travel speed or lower of 85 percent of drivers,
which according to NTSB, leads to unintended
consequences of higher operating speeds, and an
undesirable cycle of speed escalation and reduced
safety. As a result, NTSB recommends that FHWA
revise the MUTCD to incorporate the Safe Systems
approach for urban roads to strengthen protection
for road users.
Specific recommendations include:
» Revise the MUTCD so that additional relevant
factors – including crash experience, surrounding
land uses, and pedestrian activity – currently listed
as optional for all engineering studies, are required
» Remove the guidance that speed limits in
speed zones should be within 5 mph of the 85th
percentile speed
4. 4
percentile methodology, or the speed at which 85
percent of free-flowing traffic is travelling at or
below. This long-standing practice was based on
studies from the 1960s of largely rural roads, which
determined 85 percent of drivers would drive at
a prudent speed. Yet, determining the speed limit
on unconstrained free-flowing travel speed is not
appropriate for urban roads where we have a mix
of road users. And, as noted in a recent study from
the National Transportation Safety Board (NTSB),
the 85th percentile practice has “unintended
consequences” and can lead to higher speeds (see
sidebar on page 3).
Alternatives to 85th Percentile Speed
Setting Standards
In Oregon, decisions regarding non-statutory
posted speeds on streets are made by the Oregon
Department of Transportation (ODOT). An
independent body, the Oregon Speed Zone Control
Board, hears appeals of ODOT decisions from local
jurisdictions. Given this structure, PBOT has worked
closely over the past two years with the Oregon
State Legislature and ODOT to gain flexibility for
speed reduction. Portland’s goals in this work have
been to (a) develop an alternative to the traditional
methodology (which relies heavily on the vehicle 85th
percentile speed for speed setting), to include greater
consideration of non-motorized road users, and (b)
lower speed limits, even as street design may stay the
same.
PBOT’s approach to setting speed limits is focused
on shifting the focus away from an approach that
only considers people driving to a more balanced
incorporation of all road users, with more attention
directed toward the safety of the most vulnerable
roadway users, those walking and bicycling.
Portland pursued an administrative rule in 2015 with
ODOT to allow the city to use alternatives to the
85th percentile methodology, and it won permission
in 2016. Since adopting Vision Zero, PBOT has
proactively worked with ODOT to put this new
authority into practice and pursue lower speed limits,
especially on roads identified in the city’s High Crash
Network.
Portland’s authority to use alternative methods comes
with caveats, most notably that, at least for now, the
alternative methods can only be used on non-arterial
roads, which make up 94 percent of the city’s street
network. While arterials constitute a small percentage
(six percent) of the total street network, it is the
arterials that dominate the city’s High Crash Network
and streets where slowing speeds to save lives is
most urgent.
According to Clay Veka, PBOT’s Vision Zero Program
Manager, the agency plans to continue working with
ODOT to make federally classified arterials eligible for
using the alternative methodology.
PBOT’s alternative speed-setting methodology
focuses on minimizing the risk of fatality for different
roadway users. City staff created a Simplified
Decision Matrix, see above, to help translate this
approach to practice. The Decision Matrix looks at
design features needed to protect different roadway
users when cars are traveling at varying speeds.
PBOT created a Decision Matrix to emphasize risk reduction
to vulnerable road users and to guide staff to make decisions
regarding setting speed limits
5. 5
Portland’s Alternate
speed zone
investigation
This investigation allows the city to formally
and more quickly request a change in
speed limits on local streets via ODOT. The
investigation reviews a substantial number of
factors intended to reduce the risk of fatality
for vulnerable road users to 10 percent,
balanced with the city’s mobility goals.
Specific factors for consideration in
setting speed limits include:
» Adjacent land uses
» Street width(s)
» Average daily traffic volume
» Total number of fatal and injury crashes in
specified time period
» Number of crashes per mile in specified
time period
» Number of fatal and injury crashes per mile
in specified time period
» Details of pedestrian, bike, and vehicle
facilities
» Recommended speeds for pedestrians
and bicyclists based on Portland’s Simplified
Decision Matrix (speed intended to reduce
the risk of fatality to 10 percent, balanced
with mobility goals)
“Portland can’t redesign all of its
roads now, but by lowering speed
limits, we can lower the public’s
expectations for high speed and
begin to change the broader culture
of speeding.”
– Matthew Ferris-Smith, PBOT Active
Transportation and Safety Division
Process for ODOT Review
With these priorities in mind, PBOT worked with ODOT
to create a process where PBOT submits a formal
request – an Alternate Speed Zone Investigation – to
lower the speed limit for a street in question, which
ODOT reviews. The investigation method includes
information on the street context – including land use,
facilities for people walking and bicycling, crash history,
and recommended speeds to protect people walking
and bicycling based on the Decision Matrix. Using
this process, Portland has successfully lowered speed
limits on eight streets since August 2017, and requests
are pending for another four streets. These streets
include various types such as collectors, neighborhood
greenways, and streets within business districts.
PBOT and ODOT have successfully streamlined the
review process to reduce processing time from a
lengthy six-to-18 months (and a thick report for most
projects) to just a few months (and a three-to-four-page
analysis).
Speed Limit Change vs. Street Design
Change
PBOT sees value in lowering a speed limit, even if a
street redesign is not imminent. Matthew Ferris-Smith,
a Vision Zero specialist in PBOT’s Active Transportation
and Safety Division says, “Portland can’t redesign all
of its roads now, but by lowering speed limits, we can
lower the public’s expectations for high speed and
begin to change the broader culture of speeding.” As a
result, PBOT has sought speed reductions on a variety
of streets including business corridors, arterials, and
neighborhood streets.
Credit: Portland Bureau of Transportation
6. 6
Strategy #2: Design Streets to
Encourage Safe Speeds
In addition to lowering speed limits, Portland’s approach
to managing speeds also includes safe street design.
The Decision Matrix (page 4) helps identify
recommended design features to minimize risk for
each mode. PBOT implements design features on the
roadways to create separation and barriers between
different types of road users, who are often moving
at different speeds, such as those walking, biking, and
driving.
Equity and Prioritizing Street Design
Improvements
PBOT prioritizes street design changes on the city’s
High Crash Network streets, and especially on segments
identified as low-income communities and communities
of color, identified using a composite of 10 equity
indicators.
Using Vision Zero’s data-driven approach, PBOT starts
with three metrics to rank intersections within the
High Crash Network for safety improvements. These
intersections are then cross-referenced with low-income
communities and communities of color to ultimately
prioritize project funding.
The three metrics include:
a) The number of fatal and injury crashes in a specified
four to five-year time frame
b) The collision rate (based on the number of crashes
compared with the number of cars traveling through the
intersection), and
c) The total value of crashes, which assigns a monetary
value to the severity of injuries.
PBOT uses a variety of design tools to improve safety
for all road users.
EQUITY INDICATORS
» Low-income households
» People with disabilities
» Low English proficiency persons
» Youth
» Older adults
» Affordable housing
» Lower paying jobs
» Poor vehicle access
» Access to services
Recommendation: Work with the
state Department of Transportation
to develop alternatives to the
85th percentile practice, as well as
gain local flexibility to use these
alternatives as needed
traditional bike lanes
protected bike lanes
Raised curbs
7. 7
Strategy #3: Maximize Proven
Technology, Safety Cameras
The usage of speed safety cameras is also part of
PBOT’s strategy to encourage safe behavior. One of
the actions outlined in the city’s Vision Zero Action
Plan is to pilot the implementation of fixed speed
safety cameras on Portland’s high crash streets. With
approval from the Portland City Council, PBOT worked
extensively in 2015 with its Office of Government
Relations to seek state legislation that would authorize
the city to use fixed speed safety cameras on high
crash corridors, where it previously was not allowed.
A bill was signed into law that same year granting the
city the desired authorization.
In May 2016, the Council approved an initial pilot
program with 10 high crash corridors – all located
within the High Crash Network – to be eligible
for future camera installation. Eight cameras were
installed along four high crash streets (a camera faces
each direction of travel). Portland’s Vision Zero Action
Plan tasks PBOT to expand the program to additional
high crash corridors following the pilot. According
to staff, effectiveness of the new safety cameras will
be evaluated throughout 2018 and assessed before
expanding the program.
A 2017 initial evaluation of Portland’s safety
camera program shows them to be successful in
reducing speeding. Data comparisons of speeds
near the cameras before and after installation
show a decrease in speeding of as much as 61
percent, and a reduction of top end speeding – or
drivers exceeding 10 mph above posted or legal
speed limit – of up to 92 percent. Some results
are highlighted in the table below.
Outreach and Education
Portland city staff recognized the importance of
integrating substantive community outreach and
education to ensure community awareness of speed
problems and buy-in for safety strategies. They also
prioritized equity considerations and acknowledged
concerns about the risks of over-enforcement and
inequitable results of some safety strategies.
PBOT contacted community members and businesses
located near the camera locations to notify and
educate them about the pending installations.
Outreach included mailing postcards to residents
living within 10 blocks of each camera system. Staff
also disseminated postcards in 10 other languages,
a Frequently Asked Questions information sheet,
and a map of upcoming citywide safety projects
schedule for construction. In addition, PBOT staff
visited businesses located near the cameras prior to
installation to talk directly with community members,
answer questions, and address concerns.
So as not to over-concentrate cameras in any
communities, PBOT piloted cameras in geographic
areas throughout the city. Currently, staff is exploring
opportunities to lessen the fine burden on low-income
community members, for example, to allow first time
offenders to take driver safety education classes in
lieu of paying the fine.
Speed: Before and after installation of speed safety cameras on select corridors, 2016-2017
Percentage speeding decrease before and after speed count, one-year (2016) timeframe
Recommendation: Prioritize street
design changes on streets in the High
Crash/ Injury Network and in low-
income communities and communities
of color.
8. 8
Education has been an important part of PBOT’s speed safety camera program. PBOT created informational postcards – in
English and 10 other languages – to distribute to nearby residents and businesses prior to camera installation to provide
background information on the program.
Recommendations:
» Include automated enforcement
as part of a speed management
program. Specifically, work with
state legislature to pilot the use
of fixed safety cameras on select
streets within the High Crash/
Injury Network.
» Consider equity in camera
placement so that cameras are
not concentrated in any one
community.
» Create options to tier camera
fines based on family income and/
or ability to pay.
Conclusion
Managing speed to save lives and eliminate
life-altering injuries is a cornerstone of Vision
Zero. This is a critical part of Vision Zero’s Safe
Systems approach, which recognizes that humans
are going to make mistakes, so the transportation
system must be designed to protect people, even
when mistakes are made. Communities across the
U.S. are working to untangle the complicated web
of outdated policies to prioritize speed over safety
over speed as part of their Vision Zero efforts.
Portland’s three-part strategy to work with the
state DOT to gain authority in setting speeds
and use a Safe Systems alternative to the 85th
percentile practice, design roads that support
safe speeds, and use safety cameras is a
promising model for other Vision Zero cities.
Listen to the Vision Zero Network’s recorded webinar, featuring more
background from PBOT staff about their approach to speed management, here.