Contenu connexe
Plus de Wealth Partners Financial Group
Plus de Wealth Partners Financial Group (20)
S&P 500 Index Total Real Returns(2013 Edition)
- 1. AllFinancialMatters.com
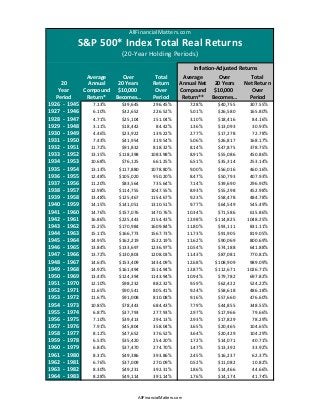
S&P 500* Index Total Real Returns
(20‐Year Holding Periods)
Average
Over
20
Annual
20 Years
Year
Compound $10,000
Period
Return*
Becomes…
7.13%
$39,645
1926 ‐ 1945
1927 ‐ 1946
6.10%
$32,652
1928 ‐ 1947
4.71%
$25,104
1929 ‐ 1948
3.11%
$18,442
1930 ‐ 1949
4.46%
$23,922
1931 ‐ 1950
7.43%
$41,954
1932 ‐ 1951
11.72%
$91,832
1933 ‐ 1952
13.15%
$118,398
1934 ‐ 1953
10.68%
$76,125
1935 ‐ 1954
13.13%
$117,880
1936 ‐ 1955
12.48%
$105,020
1937 ‐ 1956
11.20%
$83,564
1938 ‐ 1957
12.98%
$114,755
1939 ‐ 1958
13.48%
$125,467
1940 ‐ 1959
14.15%
$141,051
1941 ‐ 1960
14.76%
$157,076
1942 ‐ 1961
16.86%
$225,443
1943 ‐ 1962
15.25%
$170,984
1944 ‐ 1963
15.11%
$166,773
1945 ‐ 1964
14.95%
$162,219
1946 ‐ 1965
13.84%
$133,697
1947 ‐ 1966
13.72%
$130,803
1948 ‐ 1967
14.63%
$153,409
1949 ‐ 1968
14.92%
$161,494
1950 ‐ 1969
13.43%
$124,394
1951 ‐ 1970
12.10%
$98,232
1952 ‐ 1971
11.65%
$90,541
1953 ‐ 1972
11.67%
$91,008
1954 ‐ 1973
10.85%
$78,443
1955 ‐ 1974
6.87%
$37,793
1956 ‐ 1975
7.10%
$39,413
1957 ‐ 1976
7.91%
$45,804
1958 ‐ 1977
8.12%
$47,652
1959 ‐ 1978
6.53%
$35,420
1960 ‐ 1979
6.83%
$37,470
1961 ‐ 1980
8.31%
$49,386
1962 ‐ 1981
6.76%
$37,009
1963 ‐ 1982
8.30%
$49,231
1964 ‐ 1983
8.28%
$49,114
Total
Return
Over
Period
Inflation‐Adjusted Returns
Average
Over
Total
Annual Net 20 Years
Net Return
Compound $10,000
Over
Return** Becomes…
Period
296.45%
226.52%
151.04%
84.42%
139.22%
319.54%
818.32%
1083.98%
661.25%
1078.80%
950.20%
735.64%
1047.55%
1154.67%
1310.51%
1470.76%
2154.43%
1609.84%
1567.73%
1522.19%
1236.97%
1208.03%
1434.09%
1514.94%
1143.94%
882.32%
805.41%
810.08%
684.43%
277.93%
294.13%
358.04%
376.52%
254.20%
274.70%
393.86%
270.09%
392.31%
391.14%
AllFinancialMatters.com
7.28%
5.01%
3.10%
1.36%
2.77%
5.06%
8.14%
8.91%
6.51%
9.00%
8.47%
7.14%
8.93%
9.23%
9.77%
10.34%
12.98%
11.80%
11.73%
11.62%
10.54%
11.43%
12.68%
12.87%
10.94%
9.59%
9.24%
9.16%
7.79%
2.97%
2.93%
3.65%
3.64%
1.72%
1.47%
2.45%
0.52%
1.86%
1.76%
$40,755
$26,580
$18,416
$13,093
$17,278
$26,817
$47,875
$55,086
$35,314
$56,016
$50,793
$39,690
$55,298
$58,478
$64,549
$71,586
$114,825
$93,111
$91,905
$90,069
$74,188
$87,081
$108,909
$112,671
$79,782
$62,422
$58,618
$57,660
$44,855
$17,966
$17,829
$20,465
$20,429
$14,071
$13,392
$16,237
$11,082
$14,466
$14,174
307.55%
165.80%
84.16%
30.93%
72.78%
168.17%
378.75%
450.86%
253.14%
460.16%
407.93%
296.90%
452.98%
484.78%
545.49%
615.86%
1048.25%
831.11%
819.05%
800.69%
641.88%
770.81%
989.09%
1026.71%
697.82%
524.22%
486.18%
476.60%
348.55%
79.66%
78.29%
104.65%
104.29%
40.71%
33.92%
62.37%
10.82%
44.66%
41.74%
- 2. AllFinancialMatters.com
S&P 500* Index Total Real Returns
(20‐Year Holding Periods)
Average
Over
20
Annual
20 Years
Year
Compound $10,000
Period
Return*
Becomes…
1965 ‐ 1984
7.79%
$44,809
1966 ‐ 1985
8.66%
$52,663
1967 ‐ 1986
10.17%
$69,369
1968 ‐ 1987
9.27%
$58,878
1969 ‐ 1988
9.55%
$61,926
1970 ‐ 1989
11.55%
$88,991
1971 ‐ 1990
11.15%
$82,848
1972 ‐ 1991
11.89%
$94,618
1973 ‐ 1992
11.33%
$85,624
1974 ‐ 1993
12.76%
$110,356
1975 ‐ 1994
14.58%
$152,048
1976 ‐ 1995
14.59%
$152,303
1977 ‐ 1996
14.55%
$151,356
1978 ‐ 1997
16.65%
$217,463
1979 ‐ 1998
17.75%
$262,400
1980 ‐ 1999
17.87%
$268,160
1981 ‐ 2000
15.68%
$184,059
1982 ‐ 2001
15.24%
$170,568
1983 ‐ 2002
12.71%
$109,441
1984 ‐ 2003
12.99%
$114,971
1985 ‐ 2004
13.23%
$119,947
1986 ‐ 2005
11.93%
$95,215
1987 ‐ 2006
11.80%
$93,069
1988 ‐ 2007
11.81%
$93,299
1989 ‐ 2008
8.41%
$50,320
1990 ‐ 2009
8.20%
$48,391
1991 ‐ 2010
9.14%
$57,502
1992 ‐ 2011
7.81%
$44,974
1993 ‐ 2012
8.21%
$48,454
Total
Return
Over
Period
Inflation‐Adjusted Returns
Average
Over
Total
Annual Net 20 Years
Net Return
Compound $10,000
Over
Return** Becomes…
Period
348.09%
1.15%
$12,580
25.80%
426.63%
1.91%
$14,612
46.12%
593.69%
3.47%
$19,802
98.02%
488.78%
2.54%
$16,507
65.07%
519.26%
2.82%
$17,447
74.47%
789.91%
4.88%
$25,915
159.15%
728.48%
4.44%
$23,864
138.64%
846.18%
5.17%
$27,421
174.21%
756.24%
4.66%
$24,859
148.59%
1003.56%
6.44%
$34,829
248.29%
1420.48%
9.00%
$56,018
460.18%
1423.03%
9.19%
$58,040
480.40%
1413.56%
9.22%
$58,391
483.91%
2074.63%
11.57%
$89,341
793.41%
2524.00%
13.05%
$116,309
1063.09%
2581.60%
13.72%
$130,946
1209.46%
1740.59%
11.94%
$95,465
854.65%
1605.68%
11.97%
$95,931
859.31%
994.41%
9.52%
$61,636
516.36%
1049.71%
9.88%
$65,847
558.47%
1099.47%
10.16%
$69,251
592.51%
852.15%
8.87%
$54,742
447.42%
830.69%
8.68%
$52,838
428.38%
832.99%
8.71%
$53,148
431.48%
403.20%
5.60%
$29,749
197.49%
383.91%
5.47%
$29,024
190.24%
475.02%
6.66%
$36,332
263.32%
349.74%
5.33%
$28,244
182.44%
384.54%
5.79%
$30,813
208.13%
Source: Although I performed these calculations myself, the underlying source for the annual
returns is Morningstar's Stocks, Bonds, Bills, and Inflation 2007 Yearbook.
*Prior to 1957, the S&P 500 Index was known as the S&P 90.
**Average Annual Compound Return during the period
AllFinancialMatters.com