Is Low Cost Carrier Profitable -Ryan article - Issue No. 2
•
0 j'aime•152 vues

Is Low Cost Carrier Profitable, this time we hold differents senarios by varing load factors and fares, the network is huge and large 128 sectors. hope to enjoy

Recommandé
Recommandé
Contenu connexe
Tendances
Tendances (20)
Similaire à Is Low Cost Carrier Profitable -Ryan article - Issue No. 2
Similaire à Is Low Cost Carrier Profitable -Ryan article - Issue No. 2 (20)
Plus de Mohammed Awad
Plus de Mohammed Awad (20)
Dernier
Dernier (20)
Is Low Cost Carrier Profitable -Ryan article - Issue No. 2
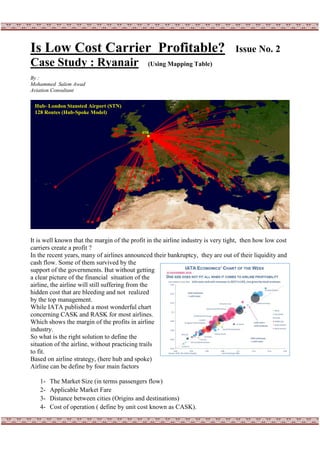
- 1. Is Low Cost Carrier Profitable? Issue No. 2 Case Study : Ryanair (Using Mapping Table) By : Mohammed Salem Awad Aviation Consultant It is well known that the margin of the profit in the airline industry is very tight, then how low cost carriers create a profit ? In the recent years, many of airlines announced their bankruptcy, they are out of their liquidity and cash flow. Some of them survived by the support of the governments. But without getting a clear picture of the financial situation of the airline, the airline will still suffering from the hidden cost that are bleeding and not realized by the top management. While IATA published a most wonderful chart concerning CASK and RASK for most airlines. Which shows the margin of the profits in airline industry. So what is the right solution to define the situation of the airline, without practicing trails to fit. Based on airline strategy, (here hub and spoke) Airline can be define by four main factors 1- The Market Size (in terms passengers flow) 2- Applicable Market Fare 3- Distance between cities (Origins and destinations) 4- Cost of operation ( define by unit cost known as CASK). STN Hub- London Stansted Airport (STN) 128 Routes (Hub-Spoke Model)
- 2. 2 2 Revenue Evaluation: The calculations of revenue for LCC have two parts 1- Scheduled Revenue : it is revenue generated by booking passengers 2- Ancillary Revenue : in airline industry, ancillary revenue is revenue from non-ticket sources, such as baggage fees and on-board food and services. For Ryan air the ratio of Ancillary Revenue to Scheduled Revenue is 0.531 So Revenue = Scheduled Revenue + Ancillary Revenue = Scheduled Revenue + 0.531 (Scheduled Revenue) = Fare * A/C capacity * Load Factor + 0.531 (Fare * A/C capacity * Load Factor) CASK Evaluation: CASK which is stand for Cost per Available Seat Kilometer, it is globally used in Aviation industry, it is reflect the cost of supply in service production system, as Airlines. The CASK for Low Cost Carriers range from 0.04 – 0.08 USD/ASK (Blue Dots), with respects Average Trip Length (Stage Length) CAPA source. While IATA published a world graph representing CASK and RASK (Revenue per Available Seat Kilometers ) – at IATA Economics Chart of the Week. So at a breakeven level, RASK equal CASK These two terms governed the airline network that utilize the concept of Origin and Destination system. The dot red line shows the level of unit cost equal unit revenue. While the size of the dots represent by total revenue. The aim of defining Ryan air CASK, is to positioning the size of aircraft used by Airline with respect to applicable load factor that represents / results 128 destinations (STN hub) According to the graph by CAPA, the CASK of the airline at 2014 was 0.04 USD/ASK. The cost of operation in terms of CASK = A/C capacity * Sector Distance * CASK
- 3. 3 3 Inputs: Ryan air – Case Study It is challenge to address Ryan air in this series, which is defined by the following terms Input: CASK = 0.04 Operating Load Factor = 95 % Break Even Load Factor = 83 % Aircraft type: B737 Max Aircraft Capacity : 197 seat Number of Routes : 128 Fare – lowest fare reported by Ryan air from website. Distance between Airports : it is almost fixed figure, when we come to design a network, we have to decide whether we need to operate short, medium or long-haul operation. Cost : it is well known cost parameter define by a term CASK ( cost per available seat kilometer ) from 0.01 to 0.1 USD, used as step function to develop a mapping table for airline (CASK, Load Factor, and Profit). Operation : one way Frequency: one ( 1 ) Mapping Table: It is very useful tool, use to define and position the financial situation for airlines, it is construct based on two variable parameters 1- Load Factor 2- CASK While we keep all other factors remain constant (unchanged ). As Aircraft capacity, distance, and fare between routes, but we manipulate Load Factor and Cask at different levels of Fares, based on that, many scenarios are setting up. Scenarios 1- Based on lowest published fare only. 2- Based on lowest published fare and ancillary Revenue. 3- Based on double lowest published fare only. 4- Based on double lowest published fare and ancillary Revenue. 5- Based on Breakeven load factor of Ryan air to define the % increase in Fare. Profits Losses
- 4. 4 4
- 5. 5 5 Analysis: Scenario 2 Based on lowest published fare and ancillary Revenue. Aircraft type : B737 MAX Capacity : 197 Seat Number of Routes : 128 Ryan air - Load Factor : 95 % CASK : 0.04 Ancillary Revenue = 0.531 * Scheduled Revenue The above scenario shows a negative result i.e - 323,962 USD operating network (128) per cycle, per aircraft. Why it is negative results while Ryan air is in a good financial health!!!, the reason for that, we are used the lowest market published fare which is a part of a promotion program of Ryan air, while actually there is an upward variance for these fares, which is applied for different seasons and weekends. The next scenario will define the percentage required to rise these fares to meet Break Even factor (83 % ) that reflects the operating cost of Ryan air.
- 6. 6 6 Scenario 5 Based on 1.7597958 * lowest published Fare and Ancillary Revenue (Ryanair) Aircraft type : B737 MAX Capacity : 197 Seat Number of Routes : 128 Ryan air – Break Even Load Factor : 83 % CASK : 0.04 Ancillary Revenue = 0.531 * Scheduled Revenue The final result of this scenario concerning Profit is ZERO, i.e to operate B737 MAX – having 197 seat at CASK equal 0.04 with a targeting load factor 83 % , We have to increase the whole published lowest fare by 71 %. This result is obtain by using a solver program. Even though we reach a Zero Result, but still some routes reported RED (losses), this means these routes need to review their selling price policy/strategy. So in the first scenario, Red color cell reflects, that price (fare) is not fitted for their corresponding routes.
- 7. 7 7 Conclusions : In fact Ryan air still survive in this mess, as simply it is not practicing what we are mentioned, but it is reinforced their stream of revenues by setting different seats configuration for their aircrafts/fleets. As B737-800, it has two classes, the first is Premium class – about 51 Seat and the second class is Economy about 138 seat (low fare). Also the variance and the range of fares that are applying for different seasons play a major role for increasing the revenue. Now, Is Low Cost Carrier Profitable (LCC) ? That first scenario shows clearly, how hard LCC maintains profits. Even they are reached 95% load factor, And define the routes that cause bleeding in the Ryanair network. So if and only if the first scenario is fair, then we can set another scenario (5 scenario) to target the breakeven load factor (83 %) to define the increase percentage for lowest published fare. Which comes (0.75979). The question of this article can be answer by those who are landed in Airline (Ryan air).