

Recommandé
Contenu connexe
Tendances
Tendances (20)
Similaire à Cost concepts
Similaire à Cost concepts (20)
Cost concepts
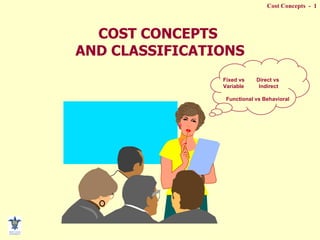
- 1. COST CONCEPTS AND CLASSIFICATIONS Fixed vs Direct vs Variable Indirect Functional vs Behavioral
- 3. COST CLASSIFICATIONS Functional – Product Detail Materials Labor Overhead
- 4. COST CLASSIFICATIONS Behavioral Fixed Variable
- 5. COST CLASSIFICATIONS Responsibility Fixed Variable A B C
- 6. COST RELATIONSHIPS: MANUFACTURING COMPANY Direct Mat. (Beg) Direct Mat. Purchases Direct Mat. (End) Direct labor incurred Direct Mat. Used + - Overhead costs applied Tot. Mfg. Costs incurred Cost of Goods Mfg. Cost of Goods Sold WIP (Beg) WIP (End) + + - - Fin Goods (End) Fin Goods (Beg) + + PRIOR PERIOD NEXT PERIOD
- 9. Total fixed costs do not respond to changes in unit level cost drivers within a period. Total fixed costs (Y) Total activity (X) 0 0 Basic Cost Behavior Patterns
- 10. Committed fixed costs are required to maintain the current service or production capacity to fill previous legal commitments. Fixed Costs
- 11. Discretionary fixed costs are set at a fixed amount each year at the discretion of management. Fixed Costs
- 12. Total variable costs increase in proportion to increases in unit level cost drivers. Total variable costs (Y) Total activity (X) 0 0 Basic Cost Behavior Patterns
- 13. Total mixed costs contain fixed and variable cost elements. They increase, but not in direct proportion to increases in unit level cost drivers. Total mixed costs (Y) Total activity (X) 0 0 Sometimes called semivariable costs Basic Cost Behavior Patterns
- 14. Total step costs are constant over a range of activity for a unit level cost driver but moves to a different amount at different ranges. Total step costs (Y) Total activity (X) 0 0 Basic Cost Behavior Patterns
- 16. Total costs (Y) Value of independent variable (X) 0 0 Variable costs are layered on top of fixed costs. Total Cost Behavior With A Single Unit Level Cost Driver Fixed costs (a) Variable costs (b) Total costs Y = a + b X Slope, b = Y X
- 17. Y = a + b X Equation for Total Costs total costs vertical axis intercept (an approximation of fixed costs) slope (an approximation of variable costs per unit of X) value of independent variable
- 19. Mixed Costs: An Example Month Utility Costs Unit Produced January $2,000 200 February 2,500 400 March 4,500 600 April 5,000 800 May 7,500 1,000
- 20. Scatterplot Method Units Produced Utility Cost $8,000 6,000 4,000 2,000 0 200 400 600 800 1,000 . . . . . Analyst can fit line based on his or her experience Important : Cost function is only relevant within relevant range
- 21. Number of Packaging Shipments Costs January 6,000 $17,000 February 9,000 26,000 March 12,000 32,000 April l0,000 20,000 Continued on next slide High-Low Cost Estimation High activity period Low activity period Variable cost per unit ( b ) = Difference in total costs Difference in activity b = $32,000 - $17,000 12,000 - 6,000
- 22. January a = Total costs - Variable costs $17,000 = a + ($2.50 x 6,000 shipments) a = $2,000 March $32,000 = a + ($2.50 x 12,000 shipments) a = $2,000 High-Low Cost Estimation Variable cost per unit ( b ) = $2.50 Same answer!
- 23. Y = $2,000 x $2.50X High-Low Cost Estimation Total packing department costs Number of shipments
- 24. Direct materials , the cost of primary raw materials converted into finished goods. The word “direct” indicates costs that are easily or directly traced to a finished product or service. Direct labor , the wages earned by production employees for the time they spend converting raw materials into finished products. Manufacturing overhead includes all manufacturing costs other than direct materials and direct labor. Composition of Manufacturing Costs
- 25. Conventional Product Costing Direct Materials Direct Labor Overhead to be Assigned Finished Goods Work in Process Traceable Indirect ?
- 26. JOB-ORDER COSTING Dir. Material Dir. Labor Overhead Job 300 Job 200 Job 100 Finished Goods Cost of Goods Sold Work in Process
- 27. PROCESS COSTING Dir. Material Dir. Labor Overhead Process A Process C Process B Finished Goods Work in Process Cost of Goods Sold
- 29. Percent of Total Manufacturing Costs 0 100 1900 1950 2000 Year Direct materials has increased Direct labor has decreased Manufacturing overhead has increased Changing Composition of Total Manufacturing Costs Total manufacturing costs
- 32. Select An Appropriate Activity Base Criterion: Cause and Effect Relationship Possible Measures of Production Activity 1. Units produced 2. Direct labor hours 3. Direct labor dollars 4. Machine hours 5. Direct materials Choice of Activity Base to be Used for Computing the Predetermined Overhead Rate
- 33. Comparison of Traditional and Contemporary Cost Management Systems Cost Information System Traditional Contemporary 1. Unit-based drivers 2. Allocation intensive 3. Narrow view of product costs 4. Focus on cost mgt. 5. Little activity information 6. Maximizes unit production 7. Uses financial measures of performance 1. Uses of nonunit drivers 2. Tracing intensive 3. Expanded product costing 4. Managing activities 5. Detailed activity information 6. System-wide performance appraisals 7. Use of nonfinancial measures of performance
- 34. Impact of Computers on Manufacturing Automatic identification systems (AIS) allow inventory and production information to be entered into a computer without writing or keying.
- 35. Impact of Computers on Manufacturing Computer-aided design (CAD) involves the use of computers to design products.
- 36. Computer-aided manufacturing (CAM) involves the use of computers to control machine operations. Impact of Computers on Manufacturing
- 37. Impact of Computers on Manufacturing Flexible manufacturing systems (FMS) are an extension of computer-aided manufacturing techniques through a series of manufacturing operations. Computer-integrated manufacturing (CIM) is the ultimate extension of CAD, CAM, and FMS concepts to a completed automated and computer-controlled factory. In their advanced stages, factories utilizing flexible manufacturing systems and computer-integrated manufacturing are sometimes referred to as “lights-out factories”because they can be operated in the dark .
Notes de l'éditeur
- 8
- 9
- 11