SlideShare une entreprise Scribd logo
1  sur  37
Tools for developing adaptive Scenarios
PESTEL Analysis
Political Factors
These are all about how and to what degree a government intervenes in the
economy. This can include – government policy, political stability or instability
in overseas markets, foreign trade policy, tax policy, labour law, environmental
law, trade restrictions and so on.
It is clear from the list above that political factors often have an impact on
organisations and how they do business. Organisations need to be able to
respond to the current and anticipated future legislation, and adjust their
marketing policy accordingly.
Economic Factors
Economic factors have a significant impact on how an organisation does
business and also how profitable they are. Factors include – economic
growth, interest rates, exchange rates, inflation, disposable income of
consumers and businesses and so on.
These factors can be further broken down into macro-economical and micro-
economical factors. Macro-economical factors deal with the management of
demand in any given economy. Governments use interest rate control,
taxation policy and government expenditure as their main mechanisms they
use for this.
Micro-economic factors are all about the way people spend their incomes.
This has a large impact on B2C organisations in particular.
Social Factors
Also known as socio-cultural factors, are the areas that involve the shared
belief and attitudes of the population. These factors include – population
growth, age distribution, health consciousness, career attitudes and so on.
These factors are of particular interest as they have a direct effect on how
marketers understand customers and what drives them.
Technological Factors
We all know how fast the technological landscape changes and how this
impacts the way we market our products. Technological factors affect
marketing and the management thereof in three distinct ways:
 New ways of producing goods and services
 New ways of distributing goods and services
 New ways of communicating with target markets
Environmental Factors
These factors have only really come to the forefront in the last fifteen years or
so. They have become important due to the increasing scarcity of raw
materials, polution targets, doing business as an ethical and sustainable
company, carbon footprint targets set by governments (this is a good example
were one factor could be classes as political and environmental at the same
time). These are just some of the issues marketers are facing within this
factor. More and more consumers are demanding that the products they buy
are sourced ethically, and if possible from a sustainable source.
Legal Factors
Legal factors include - health and safety, equal opportunities, advertising
standards, consumer rights and laws, product labelling and product safety. It
is clear that companies need to know what is and what is not legal in order to
trade successfully. If an organisation trades globally this becomes a very
tricky area to get right as each country has its own set of rules and
regulations.
Value chain Analysis
Value Chain Analysis describes the activities that take place in a business and relates
them to an analysis of the competitive strength of the business.
Work by Michael Porter suggested that the activities of a business could be grouped
under two headings:
(1) Primary Activities - those that are directly concerned with creating and delivering a
product (e.g. component assembly); and
(2) Support Activities, which whilst they are not directly involved in production, may
increase effectiveness or efficiency (e.g. human resource management). It is rare for a
business to undertake all primary and support activities.
Value Chain Analysis is one way of identifying which activities are best undertaken by a
business and which are best provided by others ("out sourced").
Linking Value Chain Analysis to Competitive Advantage
What activities a business undertakes is directly linked to achieving competitive
advantage. For example, a business which wishes to outperform its competitors
through differentiating itself through higher quality will have to perform its value chain
activities better than the opposition. By contrast, a strategy based on seekingcost
leadership will require a reduction in the costs associated with the value chain
activities, or a reduction in the total amount of resources used.
Primary Activities
Primary value chain activities include:
Secondary Activities
Secondary value chain activities include:
Steps in Value Chain Analysis
Value chain analysis can be broken down into a three sequential steps:
(1) Break down a market/organisation into its key activities under each of the major
headings in the model;
(2) Assess the potential for adding value via cost advantage or differentiation, or identify
current activities where a business appears to be at a competitive disadvantage;
(3) Determine strategies built around focusing on activities where competitive
advantage can be sustained
Generic Strategies By Michael E. Porter
Porter's generic strategies describe how a company
pursues competitive advantage across its chosen market scope.
There are three/four generic strategies, either lower
cost, differentiated, or focus. A company chooses to pursue one
of two types of competitive advantage, either via lower costs than
its competition or by differentiating itself along dimensions valued
by customers to command a higher price. A company also
chooses one of two types of scope, either focus (offering its
products to selected segments of the market) or industry-wide,
offering its product across many market segments. The generic
strategy reflects the choices made regarding both the type of
competitive advantage and the scope. The concept was
described by Michael Porter in 1980.
Porter wrote in 1980 that strategy targets either cost
leadership, differentiation, or focus.[1]
These are known as
Porter's three generic strategies and can be applied to any
size or form of business. Porter claimed that a company
must only choose one of the three or risk that the business
would waste precious resources. Porter's generic
strategies detail the interaction between cost minimization
strategies, product differentiation strategies, and market
focus strategies of firms.[1]
Porter described an industry as having
multiple segments that can be targeted by a firm. The
breadth of its targeting refers to the competitive scope of
the business. Porter defined two types of competitive
advantage: lower cost or differentiation relative to its rivals.
Achieving competitive advantage results from a firm's
ability to cope with the five forces better than its rivals.
Porter wrote: "Achieving competitive advantage requires a
firm to make a choice...about the type of competitive
advantage it seeks to attain and the scope within which it
will attain it." He also wrote: "The two basic types of
competitive advantage [differentiation and lower cost]
combined with the scope of activities for which a firm
seeks to achieve them lead to three generic strategies for
achieving above average performance in an industry: cost
leadership, differentiation and focus. The focus strategy
has two variants, cost focus and differentiation focus."[2]
In
general:
 If a firm is targeting customers in most or all segments
of an industry based on offering the lowest price, it is
following a cost leadership strategy;
 If it targets customers in most or all segments based on
attributes other than price (e.g., via higher product
quality or service) to command a higher price, it is
pursuing a differentiation strategy. It is attempting to
differentiate itself along these dimensions favorably
relative to its competition. It seeks to minimize costs in
areas that do not differentiate it, to remain cost
competitive; or
 If it is focusing on one or a few segments, it is following
a focus strategy. A firm may be attempting to offer a
lower cost in that scope (cost focus) or differentiate itself
in that scope (differentiation focus).[2]
The concept of choice was a different perspective on
strategy, as the 1970s paradigm was the pursuit of market
share (size and scale) influenced by the experience curve.
Companies that pursued the highest market share position
to achieve cost advantages fit under Porter's cost
leadership generic strategy, but the concept of choice
regarding differentiation and focus represented a new
perspective.
Cost Leadership Strategy
This strategy involves the firm winning market share by
appealing to cost-conscious or price-sensitive customers.
This is achieved by having the lowest prices in the target
market segment, or at least the lowest price to value ratio
(price compared to what customers receive). To succeed
at offering the lowest price while still achieving profitability
and a high return on investment, the firm must be able to
operate at a lower cost than its rivals. There are three
main ways to achieve this.
The first approach is achieving a high asset utilization. In
service industries, this may mean for example a restaurant
that turns tables around very quickly, or an airline that
turns around flights very fast. In manufacturing,it will
involve production of high volumes of output. These
approaches mean fixed costs are spread over a larger
number of units of the product or service, resulting in a
lower unit cost, i.e. the firm hopes to take advantage
of economies of scale and experience curve effects. For
industrial firms, mass production becomes both a strategy
and an end in itself. Higher levels of output both require
and result in high market share, and create an entry
barrier to potential competitors, who may be unable to
achieve the scale necessary to match the firms low costs
and prices.
The second dimension is achieving low direct and indirect
operating costs. This is achieved by offering high volumes
of standardized products, offering basic no-frills products
and limiting customization and personalization of service.
Production costs are kept low by using fewer components,
using standard components, and limiting the number of
models produced to ensure larger production runs.
Overheads are kept low by paying low wages, locating
premises in low rent areas, establishing a cost-conscious
culture, etc. Maintaining this strategy requires a
continuous search for cost reductions in all aspects of the
business. This will include outsourcing, controlling
production costs, increasing asset capacity utilization, and
minimizing other costs including distribution, R&D and
advertising. The associated distribution strategy is to
obtain the most extensive distribution possible.
Promotional strategy often involves trying to make a virtue
out of low cost product features.
The third dimension is control over the value chain
encompassing all functional groups (finance,
supply/procurement, marketing, inventory, information
technology etc..) to ensure low costs.[5]
For
supply/procurement chain, this could be achieved by bulk
buying to enjoy quantity discounts, squeezing suppliers on
price, instituting competitive bidding for contracts, working
with vendors to keep inventories low using methods such
as Just-in-Time purchasing or Vendor-Managed Inventory.
Wal-Mart is famous for squeezing its suppliers to ensure
low prices for its goods. Other procurement advantages
could come from preferential access to raw materials, or
backward integration. Keep in mind that if you are in
control of all functional groups this is suitable for cost
leadership; if you are only in control of one functional
group this is differentiation. For example, Dell
Computer initially achieved market share by keeping
inventories low and only building computers to order via
applying Differentiation strategies in supply/procurement
chain. This will be clarified in other sections.
Cost leadership strategies are only viable for large firms
with the opportunity to enjoy economies of scale and large
production volumes and big market share. Small
businesses can be "cost focused" not "cost leaders" if they
enjoy any advantages conducive to low costs. For
example, a local restaurant in a low rent location can
attract price-sensitive customers if it offers a limited menu,
rapid table turnover and employs staff on minimum wage.
Innovation of products or processes may also enable a
startup or small company to offer a cheaper product or
service where incumbents' costs and prices have become
too high. An example is the success of low-cost budget
airlines who, despite having fewer planes than the major
airlines, were able to achieve market share growth by
offering cheap, no-frills services at prices much cheaper
than those of the larger incumbents. At the beginning low-
cost budget airlines chose "cost focused" strategies but
later when the market grow, big airlines started to offer the
same low-cost attributes, and so cost focus became cost
leadership! [5]
A cost leadership strategy may have the disadvantage of
lower customer loyalty, as price-sensitive customers will
switch once a lower-priced substitute is available. A
reputation as a cost leader may also result in a reputation
for low quality, which may make it difficult for a firm to
rebrand itself or its products if it chooses to shift to a
differentiation strategy in future.
Differentiation Strategy
Differentiate the products/services in some way in order to
compete successfully. Examples of the successful use of
a differentiation strategy are Hero, Asian Paints, HUL,
Nike athletic shoes (image and brand mark), BMW Group
Automobiles, Perstorp BioProducts, Apple Computer
(product's design), Mercedes-Benz automobiles.
A differentiation strategy is appropriate where the target
customer segment is not price-sensitive, the market is
competitive or saturated, customers have very specific
needs which are possibly under-served, and the firm has
unique resources and capabilities which enable it to satisfy
these needs in ways that are difficult to copy. These could
include patents or other Intellectual Property (IP), unique
technical expertise (e.g. Apple's design skills or Pixar's
animation prowess), talented personnel (e.g. a sports
team's star players or a brokerage firm's star traders), or
innovative processes. Successful differentiation is
displayed when a company accomplishes either a
premium price for the product or service, increased
revenue per unit, or the consumers' loyalty to purchase the
company's product or service (brand loyalty).
Differentiation drives profitability when the added price of
the product outweighs the added expense to acquire the
product or service but is ineffective when its uniqueness is
easily replicated by its competitors.[6]
Successful brand
management also results in perceived uniqueness even
when the physical product is the same as competitors.
This way, Chiquita was able to brand bananas, Starbucks
could brand coffee, and Nike could brand sneakers.
Fashion brands rely heavily on this form of image
differentiation.
Differentiation strategy is not suitable for small companies.
It is more appropriate for big companies. To apply
differentiation with attributes throughoutpredominant
intensity in any one or several of the functional groups
(finance, purchase, marketing, inventory etc.).[5]
This point
is critical. For example, GE uses finance function to make
a difference. You may do so in isolation of other strategies
or in conjunction with focus strategies (requires more initial
investment).[5]
It provides great advantage to use
differentiation strategy (for big companies) in conjunction
with focus cost strategies or focus differentiation
strategies. Case for Coca-Cola and Royal Crown
beverages is good sample for this.
Variants on the Differentiation Strategy
The shareholder value model holds that the timing of the
use of specialized knowledge can create a differentiation
advantage as long as the knowledge remains
unique.[7]
This model suggests that customers buy
products or services from an organization to have access
to its unique knowledge. The advantage is static, rather
than dynamic, because the purchase is a one-time event.
The unlimited resources model utilizes a large base of
resources that allows an organization to outlast
competitors by practicing a differentiation strategy. An
organization with greater resources can manage risk and
sustain profits more easily than one with fewer resources.
This provides a short-term advantage only. If a firm lacks
the capacity for continual innovation, it will not sustain its
competitive position over time.
Focus strategies
This dimension is not a separate strategy for big
companies due to small market conditions. Big companies
which chose applying differentiation strategies may also
choose to apply in conjunction with focus strategies (either
cost or differentiation). On the other hand, this is definitely
an appropriate strategy for small companies especially for
those wanting to avoid competition with big one.
In adopting a narrow focus, the company ideally focuses
on a few target markets (also called a segmentation
strategy or niche strategy). These should be distinct
groups with specialised needs. The choice of offering low
prices or differentiated products/services should depend
on the needs of the selected segment and the resources
and capabilities of the firm. It is hoped that by focusing
your marketing efforts on one or two narrow market
segments and tailoring your marketing mix to these
specialized markets, you can better meet the needs of that
target market. The firm typically looks to gain a
competitive advantage through product innovation and/or
brand marketing rather than efficiency. A focused strategy
should target market segments that are less vulnerable to
substitutes or where a competition is weakest to earn
above-average return on investment.
Examples of firm using a focus strategy include Southwest
Airlines, which provides short-haul point-to-point flights in
contrast to the hub-and-spoke model of mainstream
carriers, United, and American Airlines.
Recent developments
Michael Treacy and Fred Wiersema (1993) in their
book The Discipline of Market Leaders have modified
Porter's three strategies to describe three basic "value
disciplines" that can create customer value and provide a
competitive advantage. They are operational excellence,
product leadership, and customer intimacy.
Criticisms of generic strategies
Several commentators have questioned the use of generic
strategies claiming they lack specificity, lack flexibility, and
are limiting.
Porter stressed the idea that only one strategy should be
adopted by a firm and failure to do so will result in “stuck in
the middle” scenario.[8]
He discussed the idea that
practising more than one strategy will lose the entire focus
of the organization hence clear direction of the future
trajectory could not be established. The argument is based
on the fundamental that differentiation will incur costs to
the firm which clearly contradicts with the basis of low cost
strategy and on the other hand relatively standardised
products with features acceptable to many customers will
not carry any differentiation[9]
hence, cost leadership and
differentiation strategy will be mutually exclusive.[8]
Two
focal objectives of low cost leadership and differentiation
clash with each other resulting in no proper direction for a
firm. In particular, Miller[10]
questions the notion of being
"caught in the middle". He claims that there is a viable
middle ground between strategies. Many companies, for
example, have entered a market as a niche player and
gradually expanded. According to Baden-Fuller and
Stopford (1992) the most successful companies are the
ones that can resolve what they call "the dilemma of
opposites". Furthermore, Reeves and Routledge's (2013)
study of entrepreneurial spirit demonstrated this is a key
factor in organisation success, differentiation and cost
leadership were the least important factors.
However, contrarily to the rationalisation of Porter,
contemporary research has shown evidence of successful
firms practising such a “hybrid strategy”.[11]
Research
writings of Davis (1984 cited by Prajogo 2007, p. 74) state
that firms employing the hybrid business strategy (Low
cost and differentiation strategy) outperform the ones
adopting one generic strategy. Sharing the same view
point, Hill (1988 cited by Akan et al. 2006, p. 49)
challenged Porter's concept regarding mutual exclusivity
of low cost and differentiation strategy and further argued
that successful combination of those two strategies will
result in sustainable competitive advantage. As to Wright
and other (1990 cited by Akan et al. 2006, p. 50) multiple
business strategies are required to respond effectively to
any environment condition. In the mid to late 1980s where
the environments were relatively stable there was no
requirement for flexibility in business strategies but
survival in the rapidly changing, highly unpredictable
present market contexts will require flexibility to face any
contingency (Anderson 1997, Goldman et al. 1995, Pine
1993 cited by Radas 2005, p. 197). After eleven years
Porter revised his thinking and accepted the fact that
hybrid business strategy could exist (Porter cited by
Prajogo 2007, p. 70) and writes in the following manner.
Though Porter had a fundamental rationalisation in his
concept about the invalidity of hybrid business strategy,
the highly volatile and turbulent market conditions will not
permit survival of rigid business strategies since long-term
establishment will depend on the agility and the quick
responsiveness towards market and environmental
conditions. Market and environmental turbulencewill make
drastic implications on the root establishment of a firm. If a
firm's business strategy could not cope with the
environmental and market contingencies, long-term
survival becomes unrealistic. Diverging the strategy into
different avenues with the view to exploit opportunities and
avoid threats created by market conditions will be a
pragmatic approach for a firm.[10][12][13]
Critical analysis
done separately for cost leadership strategy and
differentiation strategy identifies elementary value in both
strategies in creating and sustaining a competitive
advantage. Consistent and superior performance than
competition could be reached with stronger foundations in
the event “hybrid strategy” is adopted. Depending on the
market and competitive conditions, hybrid strategy should
be adjusted regarding the extent which each generic
strategy (cost leadership or differentiation) should be given
priority in practice.
SWOT/ TOWS Analysis
SWOT Analysis is a useful techniquefor
understanding your Strengths and Weaknesses,
and for identifying both the Opportunities open to
you and the Threats you face.
Business SWOT Analysis
What makes SWOT particularly powerful is that, with a little thought, it can
help you uncover opportunities that you are well-placed to exploit. And by
understanding the weaknesses of your business, you can manage and
eliminate threats that would otherwise catch you unawares.
More than this, by looking at yourself and yourcompetitors using the SWOT
framework, you can start to craft a strategy that helps you distinguish yourself
from your competitors, so that you can compete successfully in yourmarket.
How to Use the Tool
Originated by Albert S Humphrey in the 1960s, the tool is as useful now as it
was then. You can use it in two ways – as a simple icebreaker helping people
get together to "kick off" strategy formulation, or in a more sophisticated way
as a serious strategy tool.
Tip:
Strengths and weaknesses are often internal to your organization, while
opportunitiesand threats generally relate to external factors. For this
reason, SWOT is sometimes called Internal-External Analysis and the
SWOT Matrix is sometimes called an IE Matrix.
To help you to carry out youranalysis, download and print off our
free worksheet, and write down answers to the following questions.
Strengths
 What advantages does your organization have?
 What do you do better than anyone else?
 What unique or lowest-cost resources can you draw upon that others can't?
 What do people in your market see as your strengths?
 What factors mean that you "get the sale"?
 What is your organization's Unique Selling Proposition (USP)?
Consider yourstrengths from both an internal perspective, and from the point
of view of your customers and people in your market.
Also, if you're having any difficulty identifying strengths, try writing down a
list of yourorganization's characteristics. Some of these will hopefully be
strengths!
When looking at your strengths, think about them in relation to your
competitors. For example, if all of your competitors provide high quality
products, then a high quality production process is not a strength in your
organization's market, it's a necessity.
Weaknesses
 What could you improve?
 What should you avoid?
 What are people in your market likely to see as weaknesses?
 What factors lose you sales?
Again, consider this from an internal and external basis: Do other people seem
to perceive weaknesses that you don't see? Are yourcompetitors doing any
better than you?
It's best to be realistic now, and face any unpleasant truths as soon as possible.
Opportunities
 What good opportunities can you spot?
 What interesting trends are you aware of?
Useful opportunities can come from such things as:
 Changes in technology and markets on both a broad and narrow scale.
 Changes in government policy related to your field.
 Changes in social patterns, population profiles, lifestyle changes, and so on.
 Local events.
Tip:
A useful approach when looking at opportunitiesis to look at your
strengths and ask yourself whether these open up any opportunities.
Alternatively, look at your weaknesses and ask yourself whether you could
open up opportunitiesby eliminating them.
Threats
 What obstacles do you face?
 What are your competitors doing?
 Are quality standards or specifications for your job, products or services changing?
 Is changing technology threatening your position?
 Do you have bad debt or cash-flow problems?
 Could any of your weaknesses seriously threaten your business?
Tip:
When looking at opportunitiesand threats, PESTAnalysis can help to
ensure that you don't overlook external factors, such as new government
regulations, or technological changes in your industry.
Further SWOT Tips
If you're using SWOT as a serious tool (rather than as a casual "warm up" for
strategy formulation), make sure you're rigorous in the way you apply it:
 Only accept precise, verifiable statements ("Cost advantage of $10/ton in sourcing
raw material x", rather than "Good value for money").
 Ruthlessly prune long lists of factors, and prioritize them, so that you spend
your time thinking about the most significant factors.
 Make sure that options generated are carried through to later stages in the strategy
formation process.
 Apply it at the right level – for example, you might need to apply the tool at a
product or product-line level, rather than at the much vaguer whole company level.
 Use it in conjunction with other strategy tools (for example, USP
Analysis andCore Competence Analysis ) so that you get a comprehensive
picture of the situation you're dealing with.
Note:
You could also consider using the TOWS Matrix . This is quite similar
to SWOT in that it also focuses on the same fourelements of Strengths,
Weaknesses, Opportunities and Threats. But TOWS can be a helpful
alternative because it emphasizes the external environment, while SWOT
focuses on the internal environment.
Example
A start-up small consultancy business might draw up the following SWOT
Analysis:
Strengths
 We are able to respond very quickly as we have no red tape, and no need for higher
management approval.
 We are able to give really good customer care, as the current small amount of work
means we have plenty of time to devote to customers.
 Our lead consultant has strong reputation in the market.
 We can change direction quickly if we find that our marketing is not working.
 We have low overheads, so we can offer good value to customers.
Weaknesses
 Our company has little market presence or reputation.
 We have a small staff, with a shallow skills base in many areas.
 We are vulnerable to vital staff being sick, and leaving.
 Our cash flow will be unreliable in the early stages.
Opportunities
 Our business sector is expanding, with many future opportunities for success.
 Local government wants to encourage local businesses.
 Our competitors may be slow to adopt new technologies.
Threats
 Developments in technology may change this market beyond our ability to adapt.
 A small change in the focus of a large competitor might wipe out any market
position we achieve.
As a result of their analysis, the consultancy may decide to specialize in rapid
response, good value services to local businesses and local government.
Marketing would be in selected local publications to get the greatest possible
market presence for a set advertising budget, and the consultancy shouldkeep
up-to-date with changes in technology where possible.
Key Points
SWOT Analysis is a simple but useful framework for analyzing your
organization's strengths and weaknesses, and the opportunities and threats
that you face. It helps you focus on your strengths, minimize threats, and
take the greatest possible advantage of opportunitiesavailable to you.
It can be used to "kick off" strategy formulation,or in a more sophisticated
way as a serious strategy tool.You can also use it to get an understanding
of your competitors, which can give you the insights you need to craft a
coherent and successful competitive position.
When carrying outyour analysis, be realistic and rigorous.Apply it at the
right level, and supplement it with other option-generation toolswhere
appropriate.
General Electric matrix
The GE Matrix is a way of mapping a number of different factors to help in the understanding
of markets. It is particularly useful for concurrently examining multiple markets or a portfolio
of products.
It is also known by other names such as the GE Multi-factor Portfolio Matrix
or the Directional Policy Matrix. It was developed for GE in the 1970s by McKinsey as an
improvement on the Boston Matrix and is now one of the classic market analysis matrices
taught at business schools around the world.
A typical matrix is shown below:
Clearly, the best position is to have high business strength, a very attractive market and a
significant market share. Yet business is not always like this and the chart can help with
various decisions, such as shoring up strengths in attractive markets or getting out of
unattractive small markets where only a limited share is held.
Business strength
Business strength is an indicator of the ability of the company to compete in each of the
markets being analyzed. Business strength can depend on a number of factors including:
 Soundnessof financial structure,able toinvestinmarketsandweatherdownturns.
 Qualityproductsthatare bothdesirable andaffordablewithinthe marketinquestion.
 Flexibilityinbeingable toadaptto marketconditions.
 Innovative abilityincreatingproductsandadaptingmarketingtocompete well the target
market.
 The abilitytogrow quickly,forexamplewithspare capacityathand.
 Fitwithgovernmentconcerns,suchaslowerenergyusage.
A major benefit of the chart is in the sheer amount of information that can be displayed at
once. All charts can be overloaded and there may still be a decision as to whether to create a
larger chart with many smaller circles, or to spread the circles across multiple separate charts.
Although many graphs have 'high' on the right, the GE matrix is often drawn with higher
strength on the left and lower strength on the right. In practice is does not matter which is
used, just so long as people reading the chart realize this.
Industry/market attractiveness
The attractiveness of the market indicates the desirability for the company to enter and
compete within each market being analyzed. Factors that indicate an attractive market include:
 Growth rate of market.
 Potential forprofit,bothshort-termandlong-term.
 Limitedseriouscompetitionwithinmarket.
 Good infrastructure andotherfactors.
As with other variables, determining the important factors to include is a critical aspect and
itself may involve a significant piece of research.
Different markets
The GE Matrix shows a number of circles, each indicating a separate market. The 'market' can
be defined in several ways, including geographically and by product. Hence, for example, you
could have one circle for each of your products (or product families). Another alternative is to
have one circle per country or region where products are sold.
Circles may also be plotted on different charts for brands, business units, portfolios, services
and so on. The chart may also be used to map major competitors within markets. These may be
shown by adding further segments to each circle. As with any chart, you can adapt it to any
purpose, just as long as it continues to make sense.
Market size
The circles on the chart represent markets and the radius or area of each circle indicates the
size of each market.
While the radius may be easier to use, the area of a circle is proportional to the square of the
radius, so a circle that is twice as wide is four times as big, so to double the area, increase the
radius by only 1.4 times. In practice, perception is more important than calculation, so do be
careful that whatever representation is used is understood in an appropriate way.
Market share
The share of the market that the company has is shown as a segment, where the
angle of the segment represents the currentpercentage shareof the company.
The market shareof competitor products may be shown as additional segments.
BCG matrix
The growth–share matrix (aka the product portfolio,[1] BCG-matrix, Boston
matrix, Boston Consulting Group analysis, portfolio diagram) is a chart that was created
by Bruce D. Henderson for the Boston Consulting Group in 1970 to help corporations to
analyze their business units, that is, their product lines. This helps the company allocate
resources and is used as an analytical tool in brand marketing, product
management, strategic management, and portfolio analysis. Analysis of market
performance by firms using its principles has recently called its usefulness into question.
To use the chart, analysts plot a scatter graph to rank the business units (or products) on the basis
of their relative market sharesand growth rates.
 Cash cows is where a company has high market share in a slow-growing industry. These units
typically generate cash in excess of the amount of cash needed to maintain the business. They
are regarded as staid and boring, in a "mature" market, yet corporations value owning them due
to their cash generating qualities. They are to be "milked" continuously with as little investment
as possible, since such investment would be wasted in an industry with low growth.
 Dogs, more charitably called pets, are units with low market share in a mature, slow-growing
industry. These units typically "break even", generating barely enough cash to maintain the
business's market share. Though owning a break-even unit provides the social benefit of
providing jobs and possible synergies that assist other business units, from an accounting point
of view such a unit is worthless, not generating cash for the company. They depress a profitable
company's return on assets ratio, used by many investors to judge how well a company is being
managed. Dogs, it is thought, should be sold off.
 Question marks (also known as problem children) are business operating in a high market
growth, but having a low market share. They are a starting point for most businesses. Question
marks have a potential to gain market share and become stars, and eventually cash cows when
market growth slows. If question marks do not succeed in becoming a market leader, then after
perhaps years of cash consumption, they will degenerate into dogs when market growth
declines. Question marks must be analyzed carefully in order to determine whether they are
worth the investment required to grow market share.
 Stars are units with a high market share in a fast-growing industry. They are graduated question
marks with a market or niche leading trajectory, for example: amongst market share front-
runners in a high-growth sector, and/or having a monopolistic or increasingly dominant USP with
burgeoning/fortuitous proposition drive(s) from: novelty (e.g. Last.FM upon CBS Interactive's due
diligence), fashion/promotion (e.g. newly prestigious celebrity branded fragrances), customer
loyalty (e.g. greenfield or military/gang enforcement backed, and/or innovative, grey-market/illicit
retail of addictive drugs, for instance the British East India Company's, late-1700s opium-based
Qianlong Emperor embargo-busting, Canton System), goodwill and/or gearing (e.g. oligopolies,
for instance Portland cement producers near boomtowns),[citation needed]
etc. The hope is that stars
become next cash cows.
Stars require high funding to fight competitions and maintain a growth rate. When industry
growth slows, if they remain a niche leader or are amongst market leaders they have been
able to maintain their category leadership stars become cash cows, else they become dogs
due to low relative market share.
As a particular industry matures and its growth slows, all business units become either cash
cows or dogs. The natural cycle for most business units is that they start as question marks,
then turn into stars. Eventually the market stops growing thus the business unit becomes a cash
cow. At the end of the cycle the cash cow turns into a dog.
As BCG stated in 1970:
Only a diversified company with a balanced portfolio can use its strengths to truly capitalize on
its growth opportunities. The balanced portfolio has:
 stars whose high share and high growth assure the future;
 cash cows that supply funds for that future growth; and
 question marks to be converted into stars with the added funds.
Practicaluse
BCG-matrix.png
"To be successful, a company should have a portfolio of products with different growth rates and
different market shares. The portfolio composition is a function of the balance between cash
flows. High growth products require cash inputs to grow. Low growth products should generate
excess cash. Both kinds are needed simultaneously."—Bruce Henderson
For each product or service, the 'area' of the circle represents the value of its sales. The growth –
share matrix thus offers a "map" of the organization's product (or service) strengths and
weaknesses, at least in terms of current profitability, as well as the likely cashflows.
The need which prompted this idea was, indeed, that of managing cash-flow. It was reasoned
that one of the main indicators of cash generation was relative market share, and one which
pointed to cash usage was that of market growth rate.
Relative market share
This indicates likely cash generation, because the higher the share the more cash will be
generated. As a result of 'economies of scale' (a basic assumption of the BCG Matrix), it is
assumed that these earnings will grow faster the higher the share. The exact measure is the
brand's share relative to its largest competitor. Thus, if the brand had a share of 20 percent, and
the largest competitor had the same, the ratio would be 1:1. If the largest competitor had a share
of 60 percent; however, the ratio would be 1:3, implying that the organization's brand was in a
relatively weak position. If the largest competitor only had a share of 5 percent, the ratio would
be 4:1, implying that the brand owned was in a relatively strong position, which might be
reflected in profits and cash flows. If this technique is used in practice, this scale is logarithmic,
not linear.
On the other hand, exactly what is a high relative share is a matter of some debate. The best
evidence is that the most stable position (at least in fast-moving consumer goods markets) is for
the brand leader to have a share double that of the second brand, and triple that of the third.
Brand leaders in this position tend to be very stable—and profitable; the Rule of 123.
The selection of the relative market share metric was based upon its relationship to the
experience curve. The market leader would have greater experience curve benefits, which
delivers a cost leadership advantage.
Another reason for choosing relative market share, rather than just profits, is that it carries more
information than just cash flow. It shows where the brand is positioned against its main
competitors, and indicates where it might be likely to go in the future. It can also show what type
of marketing activities might be expected to be effective.
Market growth rate
Rapidly growing in rapidly growing markets, are what organizations strive for; but, as we have
seen, the penalty is that they are usually net cash users – they require investment. The reason
for this is often because the growth is being 'bought' by the high investment, in the reasonable
expectation that a high market share will eventually turn into a sound investment in future profits.
The theory behind the matrix assumes, therefore, that a higher growth rate is indicative of
accompanying demands on investment. The cut-off point is usually chosen as 10 per cent per
annum.[5]
Determining this cut-off point, the rate above which the growth is deemed to be
significant (and likely to lead to extra demands on cash) is a critical requirement of the
technique; and one that, again, makes the use of the growth–share matrix problematical in some
product areas. What is more, the evidence, from fast-moving consumer goods markets at least,
is that the most typical pattern is of very low growth, less than 1 per cent per annum. This is
outside the range normally considered in BCG Matrix work, which may make application of this
form of analysis unworkable in many markets.[citation needed]
Where it can be applied, however, the
market growth rate says more about the brand position than just its cash flow. It is a good
indicator of that market's strength, of its future potential (of its 'maturity' in terms of the market
life-cycle), and also of its attractiveness to future competitors. It can also be used in growth
analysis.
While theoretically useful, and widely used, several academic studies have called into question
whether using the growth–share matrix actually helps businesses succeed, and the model has
since been removed from some major marketing textbooks.[
One study (Slater and Zwirlein,
1992) which looked at 129 firms found that those who follow portfolio planning models like the
BCG matrix had lower shareholder returns.
The matrix ranks only market share and industry growth rate, and only implies actual profitability,
the purpose of any business. (It is certainly possible that a particular dog can be profitable
without cash infusions required, and therefore should be retained and not sold.) The matrix also
overlooks other elements of industry. With this or any other such analytical tool, ranking
business units has a subjective element involving guesswork about the future, particularly with
respect to growth rates. Unless the rankings are approached with rigor and scepticism, optimistic
evaluations can lead to a dot com mentality in which even the most dubious businesses are
classified as "question marks" with good prospects; enthusiastic managers may claim that cash
must be thrown at these businesses immediately in order to turn them into stars, before growth
rates slow and it's too late. Poor definition of a business's market will lead to some dogs being
misclassified as cash cows.
As originally practiced by the Boston Consulting Group,[8]
the matrix was used in situations
where it could be applied for graphically illustrating a portfolio composition as a function of the
balance between cash flows.[1]
If used with this degree of sophistication its use would still be
valid. However, later practitioners have tended to over-simplify its messages.[citation needed]
In
particular, the later application of the names (problem children, stars, cash cows and dogs) has
tended to overshadow all else—and is often what most students, and practitioners, remember.
This is unfortunate, since such simplistic use contains at least two major problems:
'Minority applicability'. The cashflow techniques are only applicable to a very limited number of
markets (where growth is relatively high, and a definite pattern of product life-cycles can be
observed, such as that of ethical pharmaceuticals). In the majority of markets, use may give
misleading results.
'Milking cash cows'. Perhaps the worst implication of the later developments is that the (brand
leader) cash cows should be milked to fund new brands. This is not what research into the fast-
moving consumer goods markets has shown to be the case. The brand leader's position is the
one, above all, to be defended, not least since brands in this position will probably outperform
any number of newly launched brands. Such brand leaders will, of course, generate large cash
flows; but they should not be `milked' to such an extent that their position is jeopardized. In any
case, the chance of the new brands achieving similar brand leadership may be slim—certainly
far less than the popular perception of the Boston Matrix would imply.
Perhaps the most important danger is, however, that the apparent implication of its four-
quadrant form is that there should be balance of products or services across all four quadrants;
and that is, indeed, the main message that it is intended to convey. Thus, money must be
diverted from `cash cows' to fund the `stars' of the future, since `cash cows' will inevitably
decline to become `dogs'. There is an almost mesmeric inevitability about the whole process. It
focuses attention, and funding, on to the `stars'. It presumes, and almost demands, that `cash
cows' will turn into `dogs'.
The reality is that it is only the `cash cows' that are really important—all the other elements are
supporting actors. It is a foolish vendor who diverts funds from a `cash cow' when these are
needed to extend the life of that `product'. Although it is necessary to recognize a `dog' when it
appears (at least before it bites you) it would be foolish in the extreme to create one in order to
balance up the picture. The vendor, who has most of his (or her) products in the `cash cow'
quadrant, should consider himself (or herself) fortunate indeed, and an excellent marketer,
although he or she might also consider creating a few stars as an insurance policy against
unexpected future developments and, perhaps, to add some extra growth. There is also a
common misconception that 'dogs' are a waste of resources. In many markets 'dogs' can be
considered loss-leaders that while not themselves profitable will lead to increased sales in other
profitable areas.
Alternatives
As with most marketing techniques, there are a number of alternative offerings vying with the
growth–share matrix although this appears to be the most widely used. The next most widely
reported technique is that developed by McKinsey and General Electric, which is a three-cell by
three-cell matrix—using the dimensions of `industry attractiveness' and `business strengths'.
This approaches some of the same issues as the growth–share matrix but from a different
direction and in a more complex way (which may be why it is used less, or is at least less widely
taught). A more practical approach is that of the Boston Consulting Group's Advantage Matrix,
which the consultancy reportedly used itself though it is little known amongst the wider
population.
Other uses
The initial intent of the growth–share matrix was to evaluate business units, but the same
evaluation can be made for product lines or any other cash-generating entities. This should only
be attempted for real lines that have a sufficient history to allow some prediction; if the
corporation has made only a few products and called them a product line, the sample
variance will be too high for this sort of analysis to be meaningful.
Ansoff Growth Matrix
Ansoff, in his 1957 paper, provided a definition for product-market strategy as "a joint
statement of a product line and the corresponding set of missions which the products are
designed to fulfill". He describes four growth alternatives:
Market penetration
In market penetration strategy, the organization tries to grow using its existing offerings (products
and services) in existing markets. In other words, it tries to increase its market share in current
market scenario. This involves increasing market share within existing market segments. This can
be achieved by selling more products or services to established customers or by finding new
customers within existing markets. Here, the company seeks increased sales for its present products
in its present markets through more aggressive promotion and distribution –
This can be accomplished by: (i) Price reduction; (ii) Increase in promotion and distribution support;
(iii) Acquisition of a rival in the same market; (iv) Modest product refinements
Market development
In market development strategy, a firm tries to expand into new markets (geographies, countries
etc.) using its existing offerings.
This can be accomplished by: (i) Different customer segments; (ii) Industrial buyers for a good that
was previously sold only to the households; (iii) New areas or regions of the country (iv) Foreign
markets. This strategy is more likely to be successful where:- (i) The firm has a unique product
technology it can leverage in the new market; (ii) It benefits from economies of scale if it increases
output; (iii) The new market is not too different from the one it has experience of; (iv) The buyers in
the market are intrinsically profitable.
Product development
In product development strategy, a company tries to create new products and services targeted at its
existing markets to achieve growth
This involves extending the product range available to the firm's existing markets. These products
may be obtained by: (i) Investment in research and development of additional products; (ii)
Acquisition of rights to produce someone else's product; (iii) Buying in the product and "branding" it;
(iv) Joint development with ownership of another product who need access to the firm's distribution
channels or brands.
Diversification
In diversification an organization tries to grow their market share by introducing new offerings in new
markets. It is the most risky strategy because both product and market development is required. (i)
Related Diversification - Here there is relationship and, therefore, potential synergy, between the
firms in existing business and the new product/market space. (a) Concentric diversification, and (b)
Vertical integration. (ii) Unrelated Diversification: This is otherwise termed conglomerate growth
because the resulting corporation is a conglomerate, i.e. a collection of businesses without any
relationship to one another.
Trend Analysis
Laying the Groundwork
Business owners don't have lots of time to spend forecasting and keeping those forecasts current.While forecasting
is not as urgent as managing day-to-day operations,a company needs to forecast for growth and to anticipate
problems. To evaluate the effectiveness of trend analysis, you need to consider all of its components -- seasonal,
cyclical and long-term trends. While promotional discounts and clearance sales might bring in revenue in the short
term, a business can't ignore long-term trends.
Trend Analysis Forecasting
Trend analysis uses a variety of statistical tools,all of which are accessible to business owners.At the most basic
level, you can plot data points for visual identification of trends to clarify relationships between variables and
identify “outliers,” or random points that don't fit a pattern. Data points can then be converted into moving averages
to smooth random fluctuations. A business ownercan use spreadsheet software to “fit” trend lines on charted data or
build regression models. These allow her to include more variables to predict sales more accurately and forecast the
impact of rising interest rates and seasonalchanges.
Pros
With the widespread availability of data in virtually every field and the computer’s capability to process it,
applications for trend analysis seemalmost limitless. Since a trend analysis is based on verifiable data,it can be
subjected to thorough scrutiny for validation. The use of numbers makes the analysis more exacting. A trend
analysis can be replicated, checked, updated and refined when necessary.
Cons
Historical data may not give a true picture of an underlying trend. An obvious event like hurricanes Katrina and
Sandy will distort a normal business trend line, while others are more subtle.A major problem in forecasting trends
involves identifying turning points. With hindsight,turning points are clearly visible, but it can be difficult to tell in
the moment whether they are mere aberrations or the beginning of new trends. Long-term projections need more
data to support them, and that may not always be available, particularly for a new business orproduct line. In any
case, the further out one forecasts,the greater the possibility for error, because the passage oftime will inevitably
introduce new variables.

Contenu connexe

Tendances

Media Management 2011-Strategy Module - Jan 21_2
Media Management 2011-Strategy Module - Jan 21_2Media Management 2011-Strategy Module - Jan 21_2
Media Management 2011-Strategy Module - Jan 21_2Robin Teigland
 
Competitive Strategies And Environment
Competitive Strategies And EnvironmentCompetitive Strategies And Environment
Competitive Strategies And Environmentibdngo
 
Generic strategy & competative advantage
Generic strategy & competative advantageGeneric strategy & competative advantage
Generic strategy & competative advantageiipmff2
 
A2 Business Economics Glossary
A2 Business Economics GlossaryA2 Business Economics Glossary
A2 Business Economics Glossarytutor2u
 
I M P O R T A N T Chap003 1
I M P O R T A N T  Chap003 1I M P O R T A N T  Chap003 1
I M P O R T A N T Chap003 1Ashar Azam
 
Mefa unit iii material(market stuructures and pricing methods)
Mefa unit iii material(market stuructures and pricing methods)Mefa unit iii material(market stuructures and pricing methods)
Mefa unit iii material(market stuructures and pricing methods)Dr. Durgaprasad Navulla
 
Business environment 1
Business environment 1Business environment 1
Business environment 1sahan1997
 
Strategic management unit-II
Strategic management unit-IIStrategic management unit-II
Strategic management unit-IIkarventhanps
 
Coordinated effect of mergers research
Coordinated effect of mergers researchCoordinated effect of mergers research
Coordinated effect of mergers researchNkululeko Tshabalala
 
Michael Porter's Competitive Advantage
Michael Porter's Competitive AdvantageMichael Porter's Competitive Advantage
Michael Porter's Competitive AdvantageWesley Shu
 
Business Economics Glossary
Business Economics GlossaryBusiness Economics Glossary
Business Economics Glossarytutor2u
 
Pricing Decisions of a product
Pricing Decisions of a productPricing Decisions of a product
Pricing Decisions of a productYash Maheshwari
 
Porters five model
Porters five modelPorters five model
Porters five modelHEMA SANKAR
 
Diversification (designed by Matt and Suh-hee)
Diversification (designed by Matt and Suh-hee)Diversification (designed by Matt and Suh-hee)
Diversification (designed by Matt and Suh-hee)Suh-hee Choi
 
Michael porter’s
Michael porter’sMichael porter’s
Michael porter’sjyoti goyal
 
Porters three generic strtegies
Porters three generic strtegiesPorters three generic strtegies
Porters three generic strtegiesMaxwell Ranasinghe
 

Tendances (20)

Module 5 report
Module 5 reportModule 5 report
Module 5 report
 
Media Management 2011-Strategy Module - Jan 21_2
Media Management 2011-Strategy Module - Jan 21_2Media Management 2011-Strategy Module - Jan 21_2
Media Management 2011-Strategy Module - Jan 21_2
 
Competitive Strategies And Environment
Competitive Strategies And EnvironmentCompetitive Strategies And Environment
Competitive Strategies And Environment
 
Generic strategy & competative advantage
Generic strategy & competative advantageGeneric strategy & competative advantage
Generic strategy & competative advantage
 
A2 Business Economics Glossary
A2 Business Economics GlossaryA2 Business Economics Glossary
A2 Business Economics Glossary
 
I M P O R T A N T Chap003 1
I M P O R T A N T  Chap003 1I M P O R T A N T  Chap003 1
I M P O R T A N T Chap003 1
 
Mefa unit iii material(market stuructures and pricing methods)
Mefa unit iii material(market stuructures and pricing methods)Mefa unit iii material(market stuructures and pricing methods)
Mefa unit iii material(market stuructures and pricing methods)
 
Business environment 1
Business environment 1Business environment 1
Business environment 1
 
Strategic management unit-II
Strategic management unit-IIStrategic management unit-II
Strategic management unit-II
 
Coordinated effect of mergers research
Coordinated effect of mergers researchCoordinated effect of mergers research
Coordinated effect of mergers research
 
Michael Porter's Competitive Advantage
Michael Porter's Competitive AdvantageMichael Porter's Competitive Advantage
Michael Porter's Competitive Advantage
 
Business Economics Glossary
Business Economics GlossaryBusiness Economics Glossary
Business Economics Glossary
 
Pricing Decisions of a product
Pricing Decisions of a productPricing Decisions of a product
Pricing Decisions of a product
 
Porters five model
Porters five modelPorters five model
Porters five model
 
Industry and competitor analysis lec 5
Industry and competitor analysis lec 5Industry and competitor analysis lec 5
Industry and competitor analysis lec 5
 
Porter generic strategies pgp1
Porter generic strategies pgp1Porter generic strategies pgp1
Porter generic strategies pgp1
 
Diversification (designed by Matt and Suh-hee)
Diversification (designed by Matt and Suh-hee)Diversification (designed by Matt and Suh-hee)
Diversification (designed by Matt and Suh-hee)
 
Michael porter’s
Michael porter’sMichael porter’s
Michael porter’s
 
On the Relationship between Antitrust and Strategy
On the Relationship between Antitrust and StrategyOn the Relationship between Antitrust and Strategy
On the Relationship between Antitrust and Strategy
 
Porters three generic strtegies
Porters three generic strtegiesPorters three generic strtegies
Porters three generic strtegies
 

Similaire à Qualitative tools for ci

STRATEGIC COST MANAGEMENT-TOPIC 5 (1).ppt
STRATEGIC COST MANAGEMENT-TOPIC 5 (1).pptSTRATEGIC COST MANAGEMENT-TOPIC 5 (1).ppt
STRATEGIC COST MANAGEMENT-TOPIC 5 (1).pptRenvic
 
Innovative competitive advantages in business notes
Innovative competitive advantages in business notesInnovative competitive advantages in business notes
Innovative competitive advantages in business notesAylya B.S
 
Industrial pricing strategies and policies
Industrial pricing strategies and policiesIndustrial pricing strategies and policies
Industrial pricing strategies and policiesSanath Dasanayaka
 
Business strategies
Business strategiesBusiness strategies
Business strategiesGopal Dosaya
 
Porter's 5 forces & PESTLE analysis.docx
Porter's 5 forces & PESTLE analysis.docxPorter's 5 forces & PESTLE analysis.docx
Porter's 5 forces & PESTLE analysis.docxYashAgarwal750419
 
Strategic Marketing PPT.pptx
Strategic Marketing PPT.pptxStrategic Marketing PPT.pptx
Strategic Marketing PPT.pptxBereketDesalegn5
 
Strategic Management
Strategic ManagementStrategic Management
Strategic ManagementDharlyn
 
IT Strategy and Management
IT Strategy and ManagementIT Strategy and Management
IT Strategy and ManagementChristian Reina
 
LECT-7- INDUSTRY ANALYSIS.pptx
LECT-7- INDUSTRY ANALYSIS.pptxLECT-7- INDUSTRY ANALYSIS.pptx
LECT-7- INDUSTRY ANALYSIS.pptxdebajanipalai
 
Executing a Total Solutions Strategy - And Other Complex Selling and Pricing ...
Executing a Total Solutions Strategy - And Other Complex Selling and Pricing ...Executing a Total Solutions Strategy - And Other Complex Selling and Pricing ...
Executing a Total Solutions Strategy - And Other Complex Selling and Pricing ...CIT Group
 
Presentation on marketing plan show
Presentation on marketing plan showPresentation on marketing plan show
Presentation on marketing plan showinamkhattakkhan
 
Internal assignment no 2(MBA208)BY ANIL KUMAR
Internal assignment no 2(MBA208)BY ANIL KUMARInternal assignment no 2(MBA208)BY ANIL KUMAR
Internal assignment no 2(MBA208)BY ANIL KUMARANIL KUMAR
 
Powerful ways-to-start-a-new-business vol2
Powerful ways-to-start-a-new-business vol2Powerful ways-to-start-a-new-business vol2
Powerful ways-to-start-a-new-business vol2Your Retail Coach
 
Top 10 Questions : Chapter 2 : Ansay
Top 10 Questions : Chapter 2 : AnsayTop 10 Questions : Chapter 2 : Ansay
Top 10 Questions : Chapter 2 : Ansaycatansay
 
Porters strategies.edited.
Porters strategies.edited.Porters strategies.edited.
Porters strategies.edited.EllahWatson
 
Module 1 course 1 mysore university pgdmm
Module 1 course 1 mysore university pgdmmModule 1 course 1 mysore university pgdmm
Module 1 course 1 mysore university pgdmmthanuja
 
Chapter 02 strategy analysis
Chapter 02 strategy analysisChapter 02 strategy analysis
Chapter 02 strategy analysisAl Sabbir
 
Strategic Management:Business Level Strategies, Corporate level Analysis,
Strategic Management:Business Level Strategies, Corporate level Analysis,Strategic Management:Business Level Strategies, Corporate level Analysis,
Strategic Management:Business Level Strategies, Corporate level Analysis,Kishor Deka
 

Similaire à Qualitative tools for ci (20)

STRATEGIC COST MANAGEMENT-TOPIC 5 (1).ppt
STRATEGIC COST MANAGEMENT-TOPIC 5 (1).pptSTRATEGIC COST MANAGEMENT-TOPIC 5 (1).ppt
STRATEGIC COST MANAGEMENT-TOPIC 5 (1).ppt
 
Innovative competitive advantages in business notes
Innovative competitive advantages in business notesInnovative competitive advantages in business notes
Innovative competitive advantages in business notes
 
Industrial pricing strategies and policies
Industrial pricing strategies and policiesIndustrial pricing strategies and policies
Industrial pricing strategies and policies
 
Business strategies
Business strategiesBusiness strategies
Business strategies
 
Porter's 5 forces & PESTLE analysis.docx
Porter's 5 forces & PESTLE analysis.docxPorter's 5 forces & PESTLE analysis.docx
Porter's 5 forces & PESTLE analysis.docx
 
Strategic Marketing PPT.pptx
Strategic Marketing PPT.pptxStrategic Marketing PPT.pptx
Strategic Marketing PPT.pptx
 
Strategic Management
Strategic ManagementStrategic Management
Strategic Management
 
Material 1 - Blog - Learn, do and growth
Material 1 - Blog - Learn, do and growthMaterial 1 - Blog - Learn, do and growth
Material 1 - Blog - Learn, do and growth
 
IT Strategy and Management
IT Strategy and ManagementIT Strategy and Management
IT Strategy and Management
 
LECT-7- INDUSTRY ANALYSIS.pptx
LECT-7- INDUSTRY ANALYSIS.pptxLECT-7- INDUSTRY ANALYSIS.pptx
LECT-7- INDUSTRY ANALYSIS.pptx
 
Executing a Total Solutions Strategy - And Other Complex Selling and Pricing ...
Executing a Total Solutions Strategy - And Other Complex Selling and Pricing ...Executing a Total Solutions Strategy - And Other Complex Selling and Pricing ...
Executing a Total Solutions Strategy - And Other Complex Selling and Pricing ...
 
Presentation on marketing plan show
Presentation on marketing plan showPresentation on marketing plan show
Presentation on marketing plan show
 
Internal assignment no 2(MBA208)BY ANIL KUMAR
Internal assignment no 2(MBA208)BY ANIL KUMARInternal assignment no 2(MBA208)BY ANIL KUMAR
Internal assignment no 2(MBA208)BY ANIL KUMAR
 
Powerful ways-to-start-a-new-business vol2
Powerful ways-to-start-a-new-business vol2Powerful ways-to-start-a-new-business vol2
Powerful ways-to-start-a-new-business vol2
 
Top 10 Questions : Chapter 2 : Ansay
Top 10 Questions : Chapter 2 : AnsayTop 10 Questions : Chapter 2 : Ansay
Top 10 Questions : Chapter 2 : Ansay
 
Porters strategies.edited.
Porters strategies.edited.Porters strategies.edited.
Porters strategies.edited.
 
Module 1 course 1 mysore university pgdmm
Module 1 course 1 mysore university pgdmmModule 1 course 1 mysore university pgdmm
Module 1 course 1 mysore university pgdmm
 
Best practice in pricing processes
Best practice in pricing processesBest practice in pricing processes
Best practice in pricing processes
 
Chapter 02 strategy analysis
Chapter 02 strategy analysisChapter 02 strategy analysis
Chapter 02 strategy analysis
 
Strategic Management:Business Level Strategies, Corporate level Analysis,
Strategic Management:Business Level Strategies, Corporate level Analysis,Strategic Management:Business Level Strategies, Corporate level Analysis,
Strategic Management:Business Level Strategies, Corporate level Analysis,
 

Dernier

Call Girls In Panjim North Goa 9971646499 Genuine Service
Call Girls In Panjim North Goa 9971646499 Genuine ServiceCall Girls In Panjim North Goa 9971646499 Genuine Service
Call Girls In Panjim North Goa 9971646499 Genuine Serviceritikaroy0888
 
Business Model Canvas (BMC)- A new venture concept
Business Model Canvas (BMC)-  A new venture conceptBusiness Model Canvas (BMC)-  A new venture concept
Business Model Canvas (BMC)- A new venture conceptP&CO
 
Call Girls Navi Mumbai Just Call 9907093804 Top Class Call Girl Service Avail...
Call Girls Navi Mumbai Just Call 9907093804 Top Class Call Girl Service Avail...Call Girls Navi Mumbai Just Call 9907093804 Top Class Call Girl Service Avail...
Call Girls Navi Mumbai Just Call 9907093804 Top Class Call Girl Service Avail...Dipal Arora
 
FULL ENJOY Call Girls In Majnu Ka Tilla, Delhi Contact Us 8377877756
FULL ENJOY Call Girls In Majnu Ka Tilla, Delhi Contact Us 8377877756FULL ENJOY Call Girls In Majnu Ka Tilla, Delhi Contact Us 8377877756
FULL ENJOY Call Girls In Majnu Ka Tilla, Delhi Contact Us 8377877756dollysharma2066
 
Katrina Personal Brand Project and portfolio 1
Katrina Personal Brand Project and portfolio 1Katrina Personal Brand Project and portfolio 1
Katrina Personal Brand Project and portfolio 1kcpayne
 
👉Chandigarh Call Girls 👉9878799926👉Just Call👉Chandigarh Call Girl In Chandiga...
👉Chandigarh Call Girls 👉9878799926👉Just Call👉Chandigarh Call Girl In Chandiga...👉Chandigarh Call Girls 👉9878799926👉Just Call👉Chandigarh Call Girl In Chandiga...
👉Chandigarh Call Girls 👉9878799926👉Just Call👉Chandigarh Call Girl In Chandiga...rajveerescorts2022
 
Call Girls Jp Nagar Just Call 👗 7737669865 👗 Top Class Call Girl Service Bang...
Call Girls Jp Nagar Just Call 👗 7737669865 👗 Top Class Call Girl Service Bang...Call Girls Jp Nagar Just Call 👗 7737669865 👗 Top Class Call Girl Service Bang...
Call Girls Jp Nagar Just Call 👗 7737669865 👗 Top Class Call Girl Service Bang...amitlee9823
 
Uneak White's Personal Brand Exploration Presentation
Uneak White's Personal Brand Exploration PresentationUneak White's Personal Brand Exploration Presentation
Uneak White's Personal Brand Exploration Presentationuneakwhite
 
Enhancing and Restoring Safety & Quality Cultures - Dave Litwiller - May 2024...
Enhancing and Restoring Safety & Quality Cultures - Dave Litwiller - May 2024...Enhancing and Restoring Safety & Quality Cultures - Dave Litwiller - May 2024...
Enhancing and Restoring Safety & Quality Cultures - Dave Litwiller - May 2024...Dave Litwiller
 
Quick Doctor In Kuwait +2773`7758`557 Kuwait Doha Qatar Dubai Abu Dhabi Sharj...
Quick Doctor In Kuwait +2773`7758`557 Kuwait Doha Qatar Dubai Abu Dhabi Sharj...Quick Doctor In Kuwait +2773`7758`557 Kuwait Doha Qatar Dubai Abu Dhabi Sharj...
Quick Doctor In Kuwait +2773`7758`557 Kuwait Doha Qatar Dubai Abu Dhabi Sharj...daisycvs
 
Monthly Social Media Update April 2024 pptx.pptx
Monthly Social Media Update April 2024 pptx.pptxMonthly Social Media Update April 2024 pptx.pptx
Monthly Social Media Update April 2024 pptx.pptxAndy Lambert
 
Call Girls In DLf Gurgaon ➥99902@11544 ( Best price)100% Genuine Escort In 24...
Call Girls In DLf Gurgaon ➥99902@11544 ( Best price)100% Genuine Escort In 24...Call Girls In DLf Gurgaon ➥99902@11544 ( Best price)100% Genuine Escort In 24...
Call Girls In DLf Gurgaon ➥99902@11544 ( Best price)100% Genuine Escort In 24...lizamodels9
 
John Halpern sued for sexual assault.pdf
John Halpern sued for sexual assault.pdfJohn Halpern sued for sexual assault.pdf
John Halpern sued for sexual assault.pdfAmzadHosen3
 
Ensure the security of your HCL environment by applying the Zero Trust princi...
Ensure the security of your HCL environment by applying the Zero Trust princi...Ensure the security of your HCL environment by applying the Zero Trust princi...
Ensure the security of your HCL environment by applying the Zero Trust princi...Roland Driesen
 
Call Girls From Pari Chowk Greater Noida ❤️8448577510 ⊹Best Escorts Service I...
Call Girls From Pari Chowk Greater Noida ❤️8448577510 ⊹Best Escorts Service I...Call Girls From Pari Chowk Greater Noida ❤️8448577510 ⊹Best Escorts Service I...
Call Girls From Pari Chowk Greater Noida ❤️8448577510 ⊹Best Escorts Service I...lizamodels9
 
FULL ENJOY Call Girls In Mahipalpur Delhi Contact Us 8377877756
FULL ENJOY Call Girls In Mahipalpur Delhi Contact Us 8377877756FULL ENJOY Call Girls In Mahipalpur Delhi Contact Us 8377877756
FULL ENJOY Call Girls In Mahipalpur Delhi Contact Us 8377877756dollysharma2066
 
Call Girls In Noida 959961⊹3876 Independent Escort Service Noida
Call Girls In Noida 959961⊹3876 Independent Escort Service NoidaCall Girls In Noida 959961⊹3876 Independent Escort Service Noida
Call Girls In Noida 959961⊹3876 Independent Escort Service Noidadlhescort
 
Mysore Call Girls 8617370543 WhatsApp Number 24x7 Best Services
Mysore Call Girls 8617370543 WhatsApp Number 24x7 Best ServicesMysore Call Girls 8617370543 WhatsApp Number 24x7 Best Services
Mysore Call Girls 8617370543 WhatsApp Number 24x7 Best ServicesDipal Arora
 

Dernier (20)

Call Girls In Panjim North Goa 9971646499 Genuine Service
Call Girls In Panjim North Goa 9971646499 Genuine ServiceCall Girls In Panjim North Goa 9971646499 Genuine Service
Call Girls In Panjim North Goa 9971646499 Genuine Service
 
Business Model Canvas (BMC)- A new venture concept
Business Model Canvas (BMC)-  A new venture conceptBusiness Model Canvas (BMC)-  A new venture concept
Business Model Canvas (BMC)- A new venture concept
 
Call Girls Navi Mumbai Just Call 9907093804 Top Class Call Girl Service Avail...
Call Girls Navi Mumbai Just Call 9907093804 Top Class Call Girl Service Avail...Call Girls Navi Mumbai Just Call 9907093804 Top Class Call Girl Service Avail...
Call Girls Navi Mumbai Just Call 9907093804 Top Class Call Girl Service Avail...
 
FULL ENJOY Call Girls In Majnu Ka Tilla, Delhi Contact Us 8377877756
FULL ENJOY Call Girls In Majnu Ka Tilla, Delhi Contact Us 8377877756FULL ENJOY Call Girls In Majnu Ka Tilla, Delhi Contact Us 8377877756
FULL ENJOY Call Girls In Majnu Ka Tilla, Delhi Contact Us 8377877756
 
Katrina Personal Brand Project and portfolio 1
Katrina Personal Brand Project and portfolio 1Katrina Personal Brand Project and portfolio 1
Katrina Personal Brand Project and portfolio 1
 
👉Chandigarh Call Girls 👉9878799926👉Just Call👉Chandigarh Call Girl In Chandiga...
👉Chandigarh Call Girls 👉9878799926👉Just Call👉Chandigarh Call Girl In Chandiga...👉Chandigarh Call Girls 👉9878799926👉Just Call👉Chandigarh Call Girl In Chandiga...
👉Chandigarh Call Girls 👉9878799926👉Just Call👉Chandigarh Call Girl In Chandiga...
 
Call Girls Jp Nagar Just Call 👗 7737669865 👗 Top Class Call Girl Service Bang...
Call Girls Jp Nagar Just Call 👗 7737669865 👗 Top Class Call Girl Service Bang...Call Girls Jp Nagar Just Call 👗 7737669865 👗 Top Class Call Girl Service Bang...
Call Girls Jp Nagar Just Call 👗 7737669865 👗 Top Class Call Girl Service Bang...
 
Uneak White's Personal Brand Exploration Presentation
Uneak White's Personal Brand Exploration PresentationUneak White's Personal Brand Exploration Presentation
Uneak White's Personal Brand Exploration Presentation
 
Enhancing and Restoring Safety & Quality Cultures - Dave Litwiller - May 2024...
Enhancing and Restoring Safety & Quality Cultures - Dave Litwiller - May 2024...Enhancing and Restoring Safety & Quality Cultures - Dave Litwiller - May 2024...
Enhancing and Restoring Safety & Quality Cultures - Dave Litwiller - May 2024...
 
Falcon Invoice Discounting platform in india
Falcon Invoice Discounting platform in indiaFalcon Invoice Discounting platform in india
Falcon Invoice Discounting platform in india
 
Quick Doctor In Kuwait +2773`7758`557 Kuwait Doha Qatar Dubai Abu Dhabi Sharj...
Quick Doctor In Kuwait +2773`7758`557 Kuwait Doha Qatar Dubai Abu Dhabi Sharj...Quick Doctor In Kuwait +2773`7758`557 Kuwait Doha Qatar Dubai Abu Dhabi Sharj...
Quick Doctor In Kuwait +2773`7758`557 Kuwait Doha Qatar Dubai Abu Dhabi Sharj...
 
Monthly Social Media Update April 2024 pptx.pptx
Monthly Social Media Update April 2024 pptx.pptxMonthly Social Media Update April 2024 pptx.pptx
Monthly Social Media Update April 2024 pptx.pptx
 
Call Girls In DLf Gurgaon ➥99902@11544 ( Best price)100% Genuine Escort In 24...
Call Girls In DLf Gurgaon ➥99902@11544 ( Best price)100% Genuine Escort In 24...Call Girls In DLf Gurgaon ➥99902@11544 ( Best price)100% Genuine Escort In 24...
Call Girls In DLf Gurgaon ➥99902@11544 ( Best price)100% Genuine Escort In 24...
 
John Halpern sued for sexual assault.pdf
John Halpern sued for sexual assault.pdfJohn Halpern sued for sexual assault.pdf
John Halpern sued for sexual assault.pdf
 
Forklift Operations: Safety through Cartoons
Forklift Operations: Safety through CartoonsForklift Operations: Safety through Cartoons
Forklift Operations: Safety through Cartoons
 
Ensure the security of your HCL environment by applying the Zero Trust princi...
Ensure the security of your HCL environment by applying the Zero Trust princi...Ensure the security of your HCL environment by applying the Zero Trust princi...
Ensure the security of your HCL environment by applying the Zero Trust princi...
 
Call Girls From Pari Chowk Greater Noida ❤️8448577510 ⊹Best Escorts Service I...
Call Girls From Pari Chowk Greater Noida ❤️8448577510 ⊹Best Escorts Service I...Call Girls From Pari Chowk Greater Noida ❤️8448577510 ⊹Best Escorts Service I...
Call Girls From Pari Chowk Greater Noida ❤️8448577510 ⊹Best Escorts Service I...
 
FULL ENJOY Call Girls In Mahipalpur Delhi Contact Us 8377877756
FULL ENJOY Call Girls In Mahipalpur Delhi Contact Us 8377877756FULL ENJOY Call Girls In Mahipalpur Delhi Contact Us 8377877756
FULL ENJOY Call Girls In Mahipalpur Delhi Contact Us 8377877756
 
Call Girls In Noida 959961⊹3876 Independent Escort Service Noida
Call Girls In Noida 959961⊹3876 Independent Escort Service NoidaCall Girls In Noida 959961⊹3876 Independent Escort Service Noida
Call Girls In Noida 959961⊹3876 Independent Escort Service Noida
 
Mysore Call Girls 8617370543 WhatsApp Number 24x7 Best Services
Mysore Call Girls 8617370543 WhatsApp Number 24x7 Best ServicesMysore Call Girls 8617370543 WhatsApp Number 24x7 Best Services
Mysore Call Girls 8617370543 WhatsApp Number 24x7 Best Services
 

Qualitative tools for ci

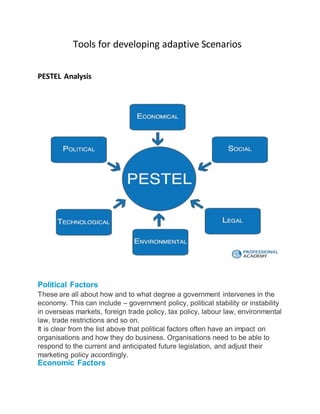
  • 1. Tools for developing adaptive Scenarios PESTEL Analysis Political Factors These are all about how and to what degree a government intervenes in the economy. This can include – government policy, political stability or instability in overseas markets, foreign trade policy, tax policy, labour law, environmental law, trade restrictions and so on. It is clear from the list above that political factors often have an impact on organisations and how they do business. Organisations need to be able to respond to the current and anticipated future legislation, and adjust their marketing policy accordingly. Economic Factors
  • 2. Economic factors have a significant impact on how an organisation does business and also how profitable they are. Factors include – economic growth, interest rates, exchange rates, inflation, disposable income of consumers and businesses and so on. These factors can be further broken down into macro-economical and micro- economical factors. Macro-economical factors deal with the management of demand in any given economy. Governments use interest rate control, taxation policy and government expenditure as their main mechanisms they use for this. Micro-economic factors are all about the way people spend their incomes. This has a large impact on B2C organisations in particular. Social Factors Also known as socio-cultural factors, are the areas that involve the shared belief and attitudes of the population. These factors include – population growth, age distribution, health consciousness, career attitudes and so on. These factors are of particular interest as they have a direct effect on how marketers understand customers and what drives them. Technological Factors We all know how fast the technological landscape changes and how this impacts the way we market our products. Technological factors affect marketing and the management thereof in three distinct ways:  New ways of producing goods and services  New ways of distributing goods and services  New ways of communicating with target markets Environmental Factors These factors have only really come to the forefront in the last fifteen years or so. They have become important due to the increasing scarcity of raw materials, polution targets, doing business as an ethical and sustainable company, carbon footprint targets set by governments (this is a good example were one factor could be classes as political and environmental at the same time). These are just some of the issues marketers are facing within this factor. More and more consumers are demanding that the products they buy are sourced ethically, and if possible from a sustainable source. Legal Factors Legal factors include - health and safety, equal opportunities, advertising standards, consumer rights and laws, product labelling and product safety. It is clear that companies need to know what is and what is not legal in order to trade successfully. If an organisation trades globally this becomes a very
  • 3. tricky area to get right as each country has its own set of rules and regulations. Value chain Analysis Value Chain Analysis describes the activities that take place in a business and relates them to an analysis of the competitive strength of the business. Work by Michael Porter suggested that the activities of a business could be grouped under two headings: (1) Primary Activities - those that are directly concerned with creating and delivering a product (e.g. component assembly); and
  • 4. (2) Support Activities, which whilst they are not directly involved in production, may increase effectiveness or efficiency (e.g. human resource management). It is rare for a business to undertake all primary and support activities. Value Chain Analysis is one way of identifying which activities are best undertaken by a business and which are best provided by others ("out sourced"). Linking Value Chain Analysis to Competitive Advantage What activities a business undertakes is directly linked to achieving competitive advantage. For example, a business which wishes to outperform its competitors through differentiating itself through higher quality will have to perform its value chain activities better than the opposition. By contrast, a strategy based on seekingcost leadership will require a reduction in the costs associated with the value chain activities, or a reduction in the total amount of resources used. Primary Activities Primary value chain activities include: Secondary Activities Secondary value chain activities include:
  • 5. Steps in Value Chain Analysis Value chain analysis can be broken down into a three sequential steps: (1) Break down a market/organisation into its key activities under each of the major headings in the model; (2) Assess the potential for adding value via cost advantage or differentiation, or identify current activities where a business appears to be at a competitive disadvantage; (3) Determine strategies built around focusing on activities where competitive advantage can be sustained Generic Strategies By Michael E. Porter
  • 6. Porter's generic strategies describe how a company pursues competitive advantage across its chosen market scope. There are three/four generic strategies, either lower cost, differentiated, or focus. A company chooses to pursue one of two types of competitive advantage, either via lower costs than its competition or by differentiating itself along dimensions valued by customers to command a higher price. A company also chooses one of two types of scope, either focus (offering its products to selected segments of the market) or industry-wide, offering its product across many market segments. The generic strategy reflects the choices made regarding both the type of competitive advantage and the scope. The concept was described by Michael Porter in 1980.
  • 7. Porter wrote in 1980 that strategy targets either cost leadership, differentiation, or focus.[1] These are known as Porter's three generic strategies and can be applied to any size or form of business. Porter claimed that a company must only choose one of the three or risk that the business would waste precious resources. Porter's generic strategies detail the interaction between cost minimization strategies, product differentiation strategies, and market focus strategies of firms.[1] Porter described an industry as having multiple segments that can be targeted by a firm. The breadth of its targeting refers to the competitive scope of the business. Porter defined two types of competitive advantage: lower cost or differentiation relative to its rivals. Achieving competitive advantage results from a firm's ability to cope with the five forces better than its rivals. Porter wrote: "Achieving competitive advantage requires a firm to make a choice...about the type of competitive advantage it seeks to attain and the scope within which it will attain it." He also wrote: "The two basic types of competitive advantage [differentiation and lower cost] combined with the scope of activities for which a firm seeks to achieve them lead to three generic strategies for achieving above average performance in an industry: cost leadership, differentiation and focus. The focus strategy has two variants, cost focus and differentiation focus."[2] In general:  If a firm is targeting customers in most or all segments of an industry based on offering the lowest price, it is following a cost leadership strategy;
  • 8.  If it targets customers in most or all segments based on attributes other than price (e.g., via higher product quality or service) to command a higher price, it is pursuing a differentiation strategy. It is attempting to differentiate itself along these dimensions favorably relative to its competition. It seeks to minimize costs in areas that do not differentiate it, to remain cost competitive; or  If it is focusing on one or a few segments, it is following a focus strategy. A firm may be attempting to offer a lower cost in that scope (cost focus) or differentiate itself in that scope (differentiation focus).[2] The concept of choice was a different perspective on strategy, as the 1970s paradigm was the pursuit of market share (size and scale) influenced by the experience curve. Companies that pursued the highest market share position to achieve cost advantages fit under Porter's cost leadership generic strategy, but the concept of choice regarding differentiation and focus represented a new perspective. Cost Leadership Strategy This strategy involves the firm winning market share by appealing to cost-conscious or price-sensitive customers. This is achieved by having the lowest prices in the target market segment, or at least the lowest price to value ratio (price compared to what customers receive). To succeed at offering the lowest price while still achieving profitability
  • 9. and a high return on investment, the firm must be able to operate at a lower cost than its rivals. There are three main ways to achieve this. The first approach is achieving a high asset utilization. In service industries, this may mean for example a restaurant that turns tables around very quickly, or an airline that turns around flights very fast. In manufacturing,it will involve production of high volumes of output. These approaches mean fixed costs are spread over a larger number of units of the product or service, resulting in a lower unit cost, i.e. the firm hopes to take advantage of economies of scale and experience curve effects. For industrial firms, mass production becomes both a strategy and an end in itself. Higher levels of output both require and result in high market share, and create an entry barrier to potential competitors, who may be unable to achieve the scale necessary to match the firms low costs and prices. The second dimension is achieving low direct and indirect operating costs. This is achieved by offering high volumes of standardized products, offering basic no-frills products and limiting customization and personalization of service. Production costs are kept low by using fewer components, using standard components, and limiting the number of models produced to ensure larger production runs. Overheads are kept low by paying low wages, locating premises in low rent areas, establishing a cost-conscious culture, etc. Maintaining this strategy requires a continuous search for cost reductions in all aspects of the business. This will include outsourcing, controlling
  • 10. production costs, increasing asset capacity utilization, and minimizing other costs including distribution, R&D and advertising. The associated distribution strategy is to obtain the most extensive distribution possible. Promotional strategy often involves trying to make a virtue out of low cost product features. The third dimension is control over the value chain encompassing all functional groups (finance, supply/procurement, marketing, inventory, information technology etc..) to ensure low costs.[5] For supply/procurement chain, this could be achieved by bulk buying to enjoy quantity discounts, squeezing suppliers on price, instituting competitive bidding for contracts, working with vendors to keep inventories low using methods such as Just-in-Time purchasing or Vendor-Managed Inventory. Wal-Mart is famous for squeezing its suppliers to ensure low prices for its goods. Other procurement advantages could come from preferential access to raw materials, or backward integration. Keep in mind that if you are in control of all functional groups this is suitable for cost leadership; if you are only in control of one functional group this is differentiation. For example, Dell Computer initially achieved market share by keeping inventories low and only building computers to order via applying Differentiation strategies in supply/procurement chain. This will be clarified in other sections. Cost leadership strategies are only viable for large firms with the opportunity to enjoy economies of scale and large production volumes and big market share. Small businesses can be "cost focused" not "cost leaders" if they
  • 11. enjoy any advantages conducive to low costs. For example, a local restaurant in a low rent location can attract price-sensitive customers if it offers a limited menu, rapid table turnover and employs staff on minimum wage. Innovation of products or processes may also enable a startup or small company to offer a cheaper product or service where incumbents' costs and prices have become too high. An example is the success of low-cost budget airlines who, despite having fewer planes than the major airlines, were able to achieve market share growth by offering cheap, no-frills services at prices much cheaper than those of the larger incumbents. At the beginning low- cost budget airlines chose "cost focused" strategies but later when the market grow, big airlines started to offer the same low-cost attributes, and so cost focus became cost leadership! [5] A cost leadership strategy may have the disadvantage of lower customer loyalty, as price-sensitive customers will switch once a lower-priced substitute is available. A reputation as a cost leader may also result in a reputation for low quality, which may make it difficult for a firm to rebrand itself or its products if it chooses to shift to a differentiation strategy in future. Differentiation Strategy Differentiate the products/services in some way in order to compete successfully. Examples of the successful use of a differentiation strategy are Hero, Asian Paints, HUL, Nike athletic shoes (image and brand mark), BMW Group Automobiles, Perstorp BioProducts, Apple Computer (product's design), Mercedes-Benz automobiles.
  • 12. A differentiation strategy is appropriate where the target customer segment is not price-sensitive, the market is competitive or saturated, customers have very specific needs which are possibly under-served, and the firm has unique resources and capabilities which enable it to satisfy these needs in ways that are difficult to copy. These could include patents or other Intellectual Property (IP), unique technical expertise (e.g. Apple's design skills or Pixar's animation prowess), talented personnel (e.g. a sports team's star players or a brokerage firm's star traders), or innovative processes. Successful differentiation is displayed when a company accomplishes either a premium price for the product or service, increased revenue per unit, or the consumers' loyalty to purchase the company's product or service (brand loyalty). Differentiation drives profitability when the added price of the product outweighs the added expense to acquire the product or service but is ineffective when its uniqueness is easily replicated by its competitors.[6] Successful brand management also results in perceived uniqueness even when the physical product is the same as competitors. This way, Chiquita was able to brand bananas, Starbucks could brand coffee, and Nike could brand sneakers. Fashion brands rely heavily on this form of image differentiation. Differentiation strategy is not suitable for small companies. It is more appropriate for big companies. To apply differentiation with attributes throughoutpredominant intensity in any one or several of the functional groups (finance, purchase, marketing, inventory etc.).[5] This point is critical. For example, GE uses finance function to make
  • 13. a difference. You may do so in isolation of other strategies or in conjunction with focus strategies (requires more initial investment).[5] It provides great advantage to use differentiation strategy (for big companies) in conjunction with focus cost strategies or focus differentiation strategies. Case for Coca-Cola and Royal Crown beverages is good sample for this. Variants on the Differentiation Strategy The shareholder value model holds that the timing of the use of specialized knowledge can create a differentiation advantage as long as the knowledge remains unique.[7] This model suggests that customers buy products or services from an organization to have access to its unique knowledge. The advantage is static, rather than dynamic, because the purchase is a one-time event. The unlimited resources model utilizes a large base of resources that allows an organization to outlast competitors by practicing a differentiation strategy. An organization with greater resources can manage risk and sustain profits more easily than one with fewer resources. This provides a short-term advantage only. If a firm lacks the capacity for continual innovation, it will not sustain its competitive position over time. Focus strategies This dimension is not a separate strategy for big companies due to small market conditions. Big companies which chose applying differentiation strategies may also choose to apply in conjunction with focus strategies (either cost or differentiation). On the other hand, this is definitely
  • 14. an appropriate strategy for small companies especially for those wanting to avoid competition with big one. In adopting a narrow focus, the company ideally focuses on a few target markets (also called a segmentation strategy or niche strategy). These should be distinct groups with specialised needs. The choice of offering low prices or differentiated products/services should depend on the needs of the selected segment and the resources and capabilities of the firm. It is hoped that by focusing your marketing efforts on one or two narrow market segments and tailoring your marketing mix to these specialized markets, you can better meet the needs of that target market. The firm typically looks to gain a competitive advantage through product innovation and/or brand marketing rather than efficiency. A focused strategy should target market segments that are less vulnerable to substitutes or where a competition is weakest to earn above-average return on investment. Examples of firm using a focus strategy include Southwest Airlines, which provides short-haul point-to-point flights in contrast to the hub-and-spoke model of mainstream carriers, United, and American Airlines. Recent developments Michael Treacy and Fred Wiersema (1993) in their book The Discipline of Market Leaders have modified Porter's three strategies to describe three basic "value disciplines" that can create customer value and provide a competitive advantage. They are operational excellence, product leadership, and customer intimacy.
  • 15. Criticisms of generic strategies Several commentators have questioned the use of generic strategies claiming they lack specificity, lack flexibility, and are limiting. Porter stressed the idea that only one strategy should be adopted by a firm and failure to do so will result in “stuck in the middle” scenario.[8] He discussed the idea that practising more than one strategy will lose the entire focus of the organization hence clear direction of the future trajectory could not be established. The argument is based on the fundamental that differentiation will incur costs to the firm which clearly contradicts with the basis of low cost strategy and on the other hand relatively standardised products with features acceptable to many customers will not carry any differentiation[9] hence, cost leadership and differentiation strategy will be mutually exclusive.[8] Two focal objectives of low cost leadership and differentiation clash with each other resulting in no proper direction for a firm. In particular, Miller[10] questions the notion of being "caught in the middle". He claims that there is a viable middle ground between strategies. Many companies, for example, have entered a market as a niche player and gradually expanded. According to Baden-Fuller and Stopford (1992) the most successful companies are the ones that can resolve what they call "the dilemma of opposites". Furthermore, Reeves and Routledge's (2013) study of entrepreneurial spirit demonstrated this is a key factor in organisation success, differentiation and cost leadership were the least important factors.
  • 16. However, contrarily to the rationalisation of Porter, contemporary research has shown evidence of successful firms practising such a “hybrid strategy”.[11] Research writings of Davis (1984 cited by Prajogo 2007, p. 74) state that firms employing the hybrid business strategy (Low cost and differentiation strategy) outperform the ones adopting one generic strategy. Sharing the same view point, Hill (1988 cited by Akan et al. 2006, p. 49) challenged Porter's concept regarding mutual exclusivity of low cost and differentiation strategy and further argued that successful combination of those two strategies will result in sustainable competitive advantage. As to Wright and other (1990 cited by Akan et al. 2006, p. 50) multiple business strategies are required to respond effectively to any environment condition. In the mid to late 1980s where the environments were relatively stable there was no requirement for flexibility in business strategies but survival in the rapidly changing, highly unpredictable present market contexts will require flexibility to face any contingency (Anderson 1997, Goldman et al. 1995, Pine 1993 cited by Radas 2005, p. 197). After eleven years Porter revised his thinking and accepted the fact that hybrid business strategy could exist (Porter cited by Prajogo 2007, p. 70) and writes in the following manner. Though Porter had a fundamental rationalisation in his concept about the invalidity of hybrid business strategy, the highly volatile and turbulent market conditions will not permit survival of rigid business strategies since long-term establishment will depend on the agility and the quick responsiveness towards market and environmental conditions. Market and environmental turbulencewill make
  • 17. drastic implications on the root establishment of a firm. If a firm's business strategy could not cope with the environmental and market contingencies, long-term survival becomes unrealistic. Diverging the strategy into different avenues with the view to exploit opportunities and avoid threats created by market conditions will be a pragmatic approach for a firm.[10][12][13] Critical analysis done separately for cost leadership strategy and differentiation strategy identifies elementary value in both strategies in creating and sustaining a competitive advantage. Consistent and superior performance than competition could be reached with stronger foundations in the event “hybrid strategy” is adopted. Depending on the market and competitive conditions, hybrid strategy should be adjusted regarding the extent which each generic strategy (cost leadership or differentiation) should be given priority in practice.
  • 18. SWOT/ TOWS Analysis SWOT Analysis is a useful techniquefor understanding your Strengths and Weaknesses, and for identifying both the Opportunities open to you and the Threats you face.
  • 19. Business SWOT Analysis What makes SWOT particularly powerful is that, with a little thought, it can help you uncover opportunities that you are well-placed to exploit. And by understanding the weaknesses of your business, you can manage and eliminate threats that would otherwise catch you unawares. More than this, by looking at yourself and yourcompetitors using the SWOT framework, you can start to craft a strategy that helps you distinguish yourself from your competitors, so that you can compete successfully in yourmarket. How to Use the Tool Originated by Albert S Humphrey in the 1960s, the tool is as useful now as it was then. You can use it in two ways – as a simple icebreaker helping people get together to "kick off" strategy formulation, or in a more sophisticated way as a serious strategy tool. Tip: Strengths and weaknesses are often internal to your organization, while opportunitiesand threats generally relate to external factors. For this reason, SWOT is sometimes called Internal-External Analysis and the SWOT Matrix is sometimes called an IE Matrix. To help you to carry out youranalysis, download and print off our free worksheet, and write down answers to the following questions. Strengths  What advantages does your organization have?  What do you do better than anyone else?  What unique or lowest-cost resources can you draw upon that others can't?  What do people in your market see as your strengths?  What factors mean that you "get the sale"?  What is your organization's Unique Selling Proposition (USP)?
  • 20. Consider yourstrengths from both an internal perspective, and from the point of view of your customers and people in your market. Also, if you're having any difficulty identifying strengths, try writing down a list of yourorganization's characteristics. Some of these will hopefully be strengths! When looking at your strengths, think about them in relation to your competitors. For example, if all of your competitors provide high quality products, then a high quality production process is not a strength in your organization's market, it's a necessity. Weaknesses  What could you improve?  What should you avoid?  What are people in your market likely to see as weaknesses?  What factors lose you sales? Again, consider this from an internal and external basis: Do other people seem to perceive weaknesses that you don't see? Are yourcompetitors doing any better than you? It's best to be realistic now, and face any unpleasant truths as soon as possible. Opportunities  What good opportunities can you spot?  What interesting trends are you aware of? Useful opportunities can come from such things as:  Changes in technology and markets on both a broad and narrow scale.  Changes in government policy related to your field.  Changes in social patterns, population profiles, lifestyle changes, and so on.  Local events.
  • 21. Tip: A useful approach when looking at opportunitiesis to look at your strengths and ask yourself whether these open up any opportunities. Alternatively, look at your weaknesses and ask yourself whether you could open up opportunitiesby eliminating them. Threats  What obstacles do you face?  What are your competitors doing?  Are quality standards or specifications for your job, products or services changing?  Is changing technology threatening your position?  Do you have bad debt or cash-flow problems?  Could any of your weaknesses seriously threaten your business? Tip: When looking at opportunitiesand threats, PESTAnalysis can help to ensure that you don't overlook external factors, such as new government regulations, or technological changes in your industry. Further SWOT Tips If you're using SWOT as a serious tool (rather than as a casual "warm up" for strategy formulation), make sure you're rigorous in the way you apply it:  Only accept precise, verifiable statements ("Cost advantage of $10/ton in sourcing raw material x", rather than "Good value for money").  Ruthlessly prune long lists of factors, and prioritize them, so that you spend your time thinking about the most significant factors.  Make sure that options generated are carried through to later stages in the strategy formation process.
  • 22.  Apply it at the right level – for example, you might need to apply the tool at a product or product-line level, rather than at the much vaguer whole company level.  Use it in conjunction with other strategy tools (for example, USP Analysis andCore Competence Analysis ) so that you get a comprehensive picture of the situation you're dealing with. Note: You could also consider using the TOWS Matrix . This is quite similar to SWOT in that it also focuses on the same fourelements of Strengths, Weaknesses, Opportunities and Threats. But TOWS can be a helpful alternative because it emphasizes the external environment, while SWOT focuses on the internal environment. Example A start-up small consultancy business might draw up the following SWOT Analysis: Strengths  We are able to respond very quickly as we have no red tape, and no need for higher management approval.  We are able to give really good customer care, as the current small amount of work means we have plenty of time to devote to customers.  Our lead consultant has strong reputation in the market.  We can change direction quickly if we find that our marketing is not working.  We have low overheads, so we can offer good value to customers. Weaknesses  Our company has little market presence or reputation.  We have a small staff, with a shallow skills base in many areas.  We are vulnerable to vital staff being sick, and leaving.
  • 23.  Our cash flow will be unreliable in the early stages. Opportunities  Our business sector is expanding, with many future opportunities for success.  Local government wants to encourage local businesses.  Our competitors may be slow to adopt new technologies. Threats  Developments in technology may change this market beyond our ability to adapt.  A small change in the focus of a large competitor might wipe out any market position we achieve. As a result of their analysis, the consultancy may decide to specialize in rapid response, good value services to local businesses and local government. Marketing would be in selected local publications to get the greatest possible market presence for a set advertising budget, and the consultancy shouldkeep up-to-date with changes in technology where possible. Key Points SWOT Analysis is a simple but useful framework for analyzing your organization's strengths and weaknesses, and the opportunities and threats that you face. It helps you focus on your strengths, minimize threats, and take the greatest possible advantage of opportunitiesavailable to you. It can be used to "kick off" strategy formulation,or in a more sophisticated way as a serious strategy tool.You can also use it to get an understanding of your competitors, which can give you the insights you need to craft a coherent and successful competitive position.
  • 24. When carrying outyour analysis, be realistic and rigorous.Apply it at the right level, and supplement it with other option-generation toolswhere appropriate. General Electric matrix The GE Matrix is a way of mapping a number of different factors to help in the understanding of markets. It is particularly useful for concurrently examining multiple markets or a portfolio of products. It is also known by other names such as the GE Multi-factor Portfolio Matrix or the Directional Policy Matrix. It was developed for GE in the 1970s by McKinsey as an improvement on the Boston Matrix and is now one of the classic market analysis matrices taught at business schools around the world. A typical matrix is shown below:
  • 25. Clearly, the best position is to have high business strength, a very attractive market and a significant market share. Yet business is not always like this and the chart can help with various decisions, such as shoring up strengths in attractive markets or getting out of unattractive small markets where only a limited share is held. Business strength Business strength is an indicator of the ability of the company to compete in each of the markets being analyzed. Business strength can depend on a number of factors including:  Soundnessof financial structure,able toinvestinmarketsandweatherdownturns.  Qualityproductsthatare bothdesirable andaffordablewithinthe marketinquestion.  Flexibilityinbeingable toadaptto marketconditions.  Innovative abilityincreatingproductsandadaptingmarketingtocompete well the target market.  The abilitytogrow quickly,forexamplewithspare capacityathand.  Fitwithgovernmentconcerns,suchaslowerenergyusage. A major benefit of the chart is in the sheer amount of information that can be displayed at once. All charts can be overloaded and there may still be a decision as to whether to create a larger chart with many smaller circles, or to spread the circles across multiple separate charts.
  • 26. Although many graphs have 'high' on the right, the GE matrix is often drawn with higher strength on the left and lower strength on the right. In practice is does not matter which is used, just so long as people reading the chart realize this. Industry/market attractiveness The attractiveness of the market indicates the desirability for the company to enter and compete within each market being analyzed. Factors that indicate an attractive market include:  Growth rate of market.  Potential forprofit,bothshort-termandlong-term.  Limitedseriouscompetitionwithinmarket.  Good infrastructure andotherfactors. As with other variables, determining the important factors to include is a critical aspect and itself may involve a significant piece of research. Different markets The GE Matrix shows a number of circles, each indicating a separate market. The 'market' can be defined in several ways, including geographically and by product. Hence, for example, you could have one circle for each of your products (or product families). Another alternative is to have one circle per country or region where products are sold. Circles may also be plotted on different charts for brands, business units, portfolios, services and so on. The chart may also be used to map major competitors within markets. These may be shown by adding further segments to each circle. As with any chart, you can adapt it to any purpose, just as long as it continues to make sense. Market size The circles on the chart represent markets and the radius or area of each circle indicates the size of each market. While the radius may be easier to use, the area of a circle is proportional to the square of the radius, so a circle that is twice as wide is four times as big, so to double the area, increase the radius by only 1.4 times. In practice, perception is more important than calculation, so do be careful that whatever representation is used is understood in an appropriate way. Market share The share of the market that the company has is shown as a segment, where the angle of the segment represents the currentpercentage shareof the company. The market shareof competitor products may be shown as additional segments.
  • 27. BCG matrix The growth–share matrix (aka the product portfolio,[1] BCG-matrix, Boston matrix, Boston Consulting Group analysis, portfolio diagram) is a chart that was created by Bruce D. Henderson for the Boston Consulting Group in 1970 to help corporations to analyze their business units, that is, their product lines. This helps the company allocate resources and is used as an analytical tool in brand marketing, product management, strategic management, and portfolio analysis. Analysis of market performance by firms using its principles has recently called its usefulness into question.
  • 28. To use the chart, analysts plot a scatter graph to rank the business units (or products) on the basis of their relative market sharesand growth rates.  Cash cows is where a company has high market share in a slow-growing industry. These units typically generate cash in excess of the amount of cash needed to maintain the business. They are regarded as staid and boring, in a "mature" market, yet corporations value owning them due to their cash generating qualities. They are to be "milked" continuously with as little investment as possible, since such investment would be wasted in an industry with low growth.  Dogs, more charitably called pets, are units with low market share in a mature, slow-growing industry. These units typically "break even", generating barely enough cash to maintain the business's market share. Though owning a break-even unit provides the social benefit of providing jobs and possible synergies that assist other business units, from an accounting point of view such a unit is worthless, not generating cash for the company. They depress a profitable company's return on assets ratio, used by many investors to judge how well a company is being managed. Dogs, it is thought, should be sold off.  Question marks (also known as problem children) are business operating in a high market growth, but having a low market share. They are a starting point for most businesses. Question marks have a potential to gain market share and become stars, and eventually cash cows when market growth slows. If question marks do not succeed in becoming a market leader, then after perhaps years of cash consumption, they will degenerate into dogs when market growth declines. Question marks must be analyzed carefully in order to determine whether they are worth the investment required to grow market share.
  • 29.  Stars are units with a high market share in a fast-growing industry. They are graduated question marks with a market or niche leading trajectory, for example: amongst market share front- runners in a high-growth sector, and/or having a monopolistic or increasingly dominant USP with burgeoning/fortuitous proposition drive(s) from: novelty (e.g. Last.FM upon CBS Interactive's due diligence), fashion/promotion (e.g. newly prestigious celebrity branded fragrances), customer loyalty (e.g. greenfield or military/gang enforcement backed, and/or innovative, grey-market/illicit retail of addictive drugs, for instance the British East India Company's, late-1700s opium-based Qianlong Emperor embargo-busting, Canton System), goodwill and/or gearing (e.g. oligopolies, for instance Portland cement producers near boomtowns),[citation needed] etc. The hope is that stars become next cash cows. Stars require high funding to fight competitions and maintain a growth rate. When industry growth slows, if they remain a niche leader or are amongst market leaders they have been able to maintain their category leadership stars become cash cows, else they become dogs due to low relative market share. As a particular industry matures and its growth slows, all business units become either cash cows or dogs. The natural cycle for most business units is that they start as question marks, then turn into stars. Eventually the market stops growing thus the business unit becomes a cash cow. At the end of the cycle the cash cow turns into a dog. As BCG stated in 1970: Only a diversified company with a balanced portfolio can use its strengths to truly capitalize on its growth opportunities. The balanced portfolio has:  stars whose high share and high growth assure the future;  cash cows that supply funds for that future growth; and  question marks to be converted into stars with the added funds. Practicaluse BCG-matrix.png
  • 30. "To be successful, a company should have a portfolio of products with different growth rates and different market shares. The portfolio composition is a function of the balance between cash flows. High growth products require cash inputs to grow. Low growth products should generate excess cash. Both kinds are needed simultaneously."—Bruce Henderson For each product or service, the 'area' of the circle represents the value of its sales. The growth – share matrix thus offers a "map" of the organization's product (or service) strengths and weaknesses, at least in terms of current profitability, as well as the likely cashflows. The need which prompted this idea was, indeed, that of managing cash-flow. It was reasoned that one of the main indicators of cash generation was relative market share, and one which pointed to cash usage was that of market growth rate. Relative market share This indicates likely cash generation, because the higher the share the more cash will be generated. As a result of 'economies of scale' (a basic assumption of the BCG Matrix), it is assumed that these earnings will grow faster the higher the share. The exact measure is the brand's share relative to its largest competitor. Thus, if the brand had a share of 20 percent, and the largest competitor had the same, the ratio would be 1:1. If the largest competitor had a share of 60 percent; however, the ratio would be 1:3, implying that the organization's brand was in a relatively weak position. If the largest competitor only had a share of 5 percent, the ratio would be 4:1, implying that the brand owned was in a relatively strong position, which might be reflected in profits and cash flows. If this technique is used in practice, this scale is logarithmic, not linear. On the other hand, exactly what is a high relative share is a matter of some debate. The best evidence is that the most stable position (at least in fast-moving consumer goods markets) is for the brand leader to have a share double that of the second brand, and triple that of the third. Brand leaders in this position tend to be very stable—and profitable; the Rule of 123. The selection of the relative market share metric was based upon its relationship to the experience curve. The market leader would have greater experience curve benefits, which delivers a cost leadership advantage. Another reason for choosing relative market share, rather than just profits, is that it carries more information than just cash flow. It shows where the brand is positioned against its main competitors, and indicates where it might be likely to go in the future. It can also show what type of marketing activities might be expected to be effective. Market growth rate Rapidly growing in rapidly growing markets, are what organizations strive for; but, as we have seen, the penalty is that they are usually net cash users – they require investment. The reason
  • 31. for this is often because the growth is being 'bought' by the high investment, in the reasonable expectation that a high market share will eventually turn into a sound investment in future profits. The theory behind the matrix assumes, therefore, that a higher growth rate is indicative of accompanying demands on investment. The cut-off point is usually chosen as 10 per cent per annum.[5] Determining this cut-off point, the rate above which the growth is deemed to be significant (and likely to lead to extra demands on cash) is a critical requirement of the technique; and one that, again, makes the use of the growth–share matrix problematical in some product areas. What is more, the evidence, from fast-moving consumer goods markets at least, is that the most typical pattern is of very low growth, less than 1 per cent per annum. This is outside the range normally considered in BCG Matrix work, which may make application of this form of analysis unworkable in many markets.[citation needed] Where it can be applied, however, the market growth rate says more about the brand position than just its cash flow. It is a good indicator of that market's strength, of its future potential (of its 'maturity' in terms of the market life-cycle), and also of its attractiveness to future competitors. It can also be used in growth analysis. While theoretically useful, and widely used, several academic studies have called into question whether using the growth–share matrix actually helps businesses succeed, and the model has since been removed from some major marketing textbooks.[ One study (Slater and Zwirlein, 1992) which looked at 129 firms found that those who follow portfolio planning models like the BCG matrix had lower shareholder returns. The matrix ranks only market share and industry growth rate, and only implies actual profitability, the purpose of any business. (It is certainly possible that a particular dog can be profitable without cash infusions required, and therefore should be retained and not sold.) The matrix also overlooks other elements of industry. With this or any other such analytical tool, ranking business units has a subjective element involving guesswork about the future, particularly with respect to growth rates. Unless the rankings are approached with rigor and scepticism, optimistic evaluations can lead to a dot com mentality in which even the most dubious businesses are classified as "question marks" with good prospects; enthusiastic managers may claim that cash must be thrown at these businesses immediately in order to turn them into stars, before growth rates slow and it's too late. Poor definition of a business's market will lead to some dogs being misclassified as cash cows. As originally practiced by the Boston Consulting Group,[8] the matrix was used in situations where it could be applied for graphically illustrating a portfolio composition as a function of the balance between cash flows.[1] If used with this degree of sophistication its use would still be valid. However, later practitioners have tended to over-simplify its messages.[citation needed] In particular, the later application of the names (problem children, stars, cash cows and dogs) has tended to overshadow all else—and is often what most students, and practitioners, remember.
  • 32. This is unfortunate, since such simplistic use contains at least two major problems: 'Minority applicability'. The cashflow techniques are only applicable to a very limited number of markets (where growth is relatively high, and a definite pattern of product life-cycles can be observed, such as that of ethical pharmaceuticals). In the majority of markets, use may give misleading results. 'Milking cash cows'. Perhaps the worst implication of the later developments is that the (brand leader) cash cows should be milked to fund new brands. This is not what research into the fast- moving consumer goods markets has shown to be the case. The brand leader's position is the one, above all, to be defended, not least since brands in this position will probably outperform any number of newly launched brands. Such brand leaders will, of course, generate large cash flows; but they should not be `milked' to such an extent that their position is jeopardized. In any case, the chance of the new brands achieving similar brand leadership may be slim—certainly far less than the popular perception of the Boston Matrix would imply. Perhaps the most important danger is, however, that the apparent implication of its four- quadrant form is that there should be balance of products or services across all four quadrants; and that is, indeed, the main message that it is intended to convey. Thus, money must be diverted from `cash cows' to fund the `stars' of the future, since `cash cows' will inevitably decline to become `dogs'. There is an almost mesmeric inevitability about the whole process. It focuses attention, and funding, on to the `stars'. It presumes, and almost demands, that `cash cows' will turn into `dogs'. The reality is that it is only the `cash cows' that are really important—all the other elements are supporting actors. It is a foolish vendor who diverts funds from a `cash cow' when these are needed to extend the life of that `product'. Although it is necessary to recognize a `dog' when it appears (at least before it bites you) it would be foolish in the extreme to create one in order to balance up the picture. The vendor, who has most of his (or her) products in the `cash cow' quadrant, should consider himself (or herself) fortunate indeed, and an excellent marketer, although he or she might also consider creating a few stars as an insurance policy against unexpected future developments and, perhaps, to add some extra growth. There is also a common misconception that 'dogs' are a waste of resources. In many markets 'dogs' can be considered loss-leaders that while not themselves profitable will lead to increased sales in other profitable areas. Alternatives As with most marketing techniques, there are a number of alternative offerings vying with the growth–share matrix although this appears to be the most widely used. The next most widely reported technique is that developed by McKinsey and General Electric, which is a three-cell by three-cell matrix—using the dimensions of `industry attractiveness' and `business strengths'.
  • 33. This approaches some of the same issues as the growth–share matrix but from a different direction and in a more complex way (which may be why it is used less, or is at least less widely taught). A more practical approach is that of the Boston Consulting Group's Advantage Matrix, which the consultancy reportedly used itself though it is little known amongst the wider population. Other uses The initial intent of the growth–share matrix was to evaluate business units, but the same evaluation can be made for product lines or any other cash-generating entities. This should only be attempted for real lines that have a sufficient history to allow some prediction; if the corporation has made only a few products and called them a product line, the sample variance will be too high for this sort of analysis to be meaningful. Ansoff Growth Matrix
  • 34. Ansoff, in his 1957 paper, provided a definition for product-market strategy as "a joint statement of a product line and the corresponding set of missions which the products are designed to fulfill". He describes four growth alternatives: Market penetration In market penetration strategy, the organization tries to grow using its existing offerings (products and services) in existing markets. In other words, it tries to increase its market share in current market scenario. This involves increasing market share within existing market segments. This can be achieved by selling more products or services to established customers or by finding new customers within existing markets. Here, the company seeks increased sales for its present products in its present markets through more aggressive promotion and distribution – This can be accomplished by: (i) Price reduction; (ii) Increase in promotion and distribution support; (iii) Acquisition of a rival in the same market; (iv) Modest product refinements
  • 35. Market development In market development strategy, a firm tries to expand into new markets (geographies, countries etc.) using its existing offerings. This can be accomplished by: (i) Different customer segments; (ii) Industrial buyers for a good that was previously sold only to the households; (iii) New areas or regions of the country (iv) Foreign markets. This strategy is more likely to be successful where:- (i) The firm has a unique product technology it can leverage in the new market; (ii) It benefits from economies of scale if it increases output; (iii) The new market is not too different from the one it has experience of; (iv) The buyers in the market are intrinsically profitable. Product development In product development strategy, a company tries to create new products and services targeted at its existing markets to achieve growth This involves extending the product range available to the firm's existing markets. These products may be obtained by: (i) Investment in research and development of additional products; (ii) Acquisition of rights to produce someone else's product; (iii) Buying in the product and "branding" it; (iv) Joint development with ownership of another product who need access to the firm's distribution channels or brands. Diversification In diversification an organization tries to grow their market share by introducing new offerings in new markets. It is the most risky strategy because both product and market development is required. (i) Related Diversification - Here there is relationship and, therefore, potential synergy, between the firms in existing business and the new product/market space. (a) Concentric diversification, and (b) Vertical integration. (ii) Unrelated Diversification: This is otherwise termed conglomerate growth because the resulting corporation is a conglomerate, i.e. a collection of businesses without any relationship to one another.
  • 36. Trend Analysis Laying the Groundwork Business owners don't have lots of time to spend forecasting and keeping those forecasts current.While forecasting is not as urgent as managing day-to-day operations,a company needs to forecast for growth and to anticipate problems. To evaluate the effectiveness of trend analysis, you need to consider all of its components -- seasonal, cyclical and long-term trends. While promotional discounts and clearance sales might bring in revenue in the short term, a business can't ignore long-term trends. Trend Analysis Forecasting Trend analysis uses a variety of statistical tools,all of which are accessible to business owners.At the most basic level, you can plot data points for visual identification of trends to clarify relationships between variables and identify “outliers,” or random points that don't fit a pattern. Data points can then be converted into moving averages to smooth random fluctuations. A business ownercan use spreadsheet software to “fit” trend lines on charted data or build regression models. These allow her to include more variables to predict sales more accurately and forecast the impact of rising interest rates and seasonalchanges. Pros With the widespread availability of data in virtually every field and the computer’s capability to process it, applications for trend analysis seemalmost limitless. Since a trend analysis is based on verifiable data,it can be subjected to thorough scrutiny for validation. The use of numbers makes the analysis more exacting. A trend analysis can be replicated, checked, updated and refined when necessary. Cons Historical data may not give a true picture of an underlying trend. An obvious event like hurricanes Katrina and Sandy will distort a normal business trend line, while others are more subtle.A major problem in forecasting trends
  • 37. involves identifying turning points. With hindsight,turning points are clearly visible, but it can be difficult to tell in the moment whether they are mere aberrations or the beginning of new trends. Long-term projections need more data to support them, and that may not always be available, particularly for a new business orproduct line. In any case, the further out one forecasts,the greater the possibility for error, because the passage oftime will inevitably introduce new variables.